The aim of our study was to investigate possible relationships between F-FDG-PET parameters and clinically relevant histopathological findings in patients with cervical cancer (CC).
METHODS:
Eighteen female patients (mean age 55.4 years) with histologically confirmed squamous cell CC were involved into the study. In all cases, F-FDG-PET CT was performed. Mean and maximum standardized uptake values (SUV and SUV), total lesion glycolysis (TLG) and metabolic tumor volume (MTV) were determined on PET-images. For every tumor the following specimen stainings were performed: epidermal growth factor receptor (EGFR), vascular endothelial growth factor (VEGF), tumor suppressor protein p53, hypoxia-inducible factor (HIF)-1, and histone 3. All stained specimens were digitalized and analyzed by using the ImageJ software 1.48v. Spearman’s correlation coefficient () was used to analyze associations between investigated parameters. -values 0.05 were taken to indicate statistical significance.
RESULTS:
TLG and MTV correlated well with expression of EGFR ( 0.601, 0.008 and 0.586, 0.011, respectively). SUV correlated inversely with expression of HIF 1alpha (0.509, 0.031). SUV tended to correlate with expression of EGFR and HIF 1alpha. None of the PET parameters correlated with expression of Histone 3, p53 and VEGF.
CONCLUSION:
TLG and MTV can reflect expression of EGFR and SUV correlated significantly with expression of HIF-1. None of the PET parameters can predict expression of Histone 3, p53 and VEGF.
Uterine cervical cancer (CC) is the second most common malignancy in women worldwide [1]. Furthermore, CC accounts 9% of the total new cancer cases and 8% of the total cancer deaths among females [1].
Positron emission tomography (PET) using [F]-Fluorodeoxyglucose (F-FDG) has been shown to be a useful tool for diagnosing and staging of cervical cancer [2, 3, 4, 5, 6]. Moreover, different PET parameters, namely maximal standardized uptake value (SUV), Metabolic Tumor Volume (MTV), and Total Lesion Glycolysis (TLG) can also predict tumor behavior of CC [2, 3, 4, 5, 6, 7]. For instance, Micco et al. showed that MTV and TLG correlated with N-stage in CC [7]. It has also been shown that different F-FDG-PET parameters can be used as prognosis biomarkers in CC. So Pan et al. reported that high pretreatment SUV ( 11.2) of primary tumor indicated worse prognosis [8]. Furthermore, Chung et al. mentioned that SUV, MTV and TLG can predict tumor recurrence in CC [9]. In addition, MTV has been reported as an independent prognostic factor for disease free survival in patients with CC treated by radical surgery [4]. Similarly, pretreatment TLG proved to be an independent prognostic factor for disease free survival in patients with locally advanced CC treated by definitive chemoradiotherapy [3]. Finally, MTV can also predict overall survival in CC [7].
The reported data suggest that F-FDG-PET parameters may be associated with several histopathological features in CC. Therefore, the aim of the present study was to investigate possible relationships between F-FDG-PET parameters and clinically relevant histopathological findings in patients with CC.
Clinical data of the investigated patients and tumors
Case
Age
Tumor grade
T stage
N stage
M stage
1
63
G2
2b
1
0
2
76
G3
4
0
0
3
65
G2
2b
0
0
4
63
G3
4
1
1
5
34
G3
2b
1
0
6
57
G2
4
1
1
7
53
G3
2b
0
0
8
32
G2
4
1
0
9
32
G2
2b
0
0
10
54
G2
3a
2
0
11
79
G3
4
1
0
12
52
G1
4
0
0
13
37
G3
2b
1
1
14
72
G3
4
0
0
15
46
G2
2b
1
1
16
71
G2
4
1
1
17
50
G2
2b
1
1
18
61
G2
4
1
0
Material and methods
This prospective study was approved by the local research ethics committee.
Patients
This study evaluated squamous cell carcinoma of the uterine cervix investigated in the time period from 2014 to 2016. Only patients with previously untreated tumors were included into the study. Patients with recurrent tumors, treated carcinomas, and as well as patients with cervical adenocarcinomas, were excluded.
Overall, 18 female patients (age range 32–79 years; mean age 55.4 years) with histopathologically confirmed squamous cell cervical carcinoma were acquired (Table 1).
F-FDG-PET findings in a 79-year-old patient with a T4 N1 uterine cervical cancer. Axial F-FDG-PET (a) and fused PET/CT (b) images documenting a large, hypermetabolic cancer lesion of the cervix (arrow). Tumor margins of the CC were identified on diagnostic CT images (c) and a polygonal volume of interest that include the entire lesion in the axial, sagittal and coronal planes, was placed in the PET dataset. F-FDG-PET parameters are as follows: SUV 24.64, SUV 11.76, SUV 12.5, TLG 4107.29, MTV 349.23.
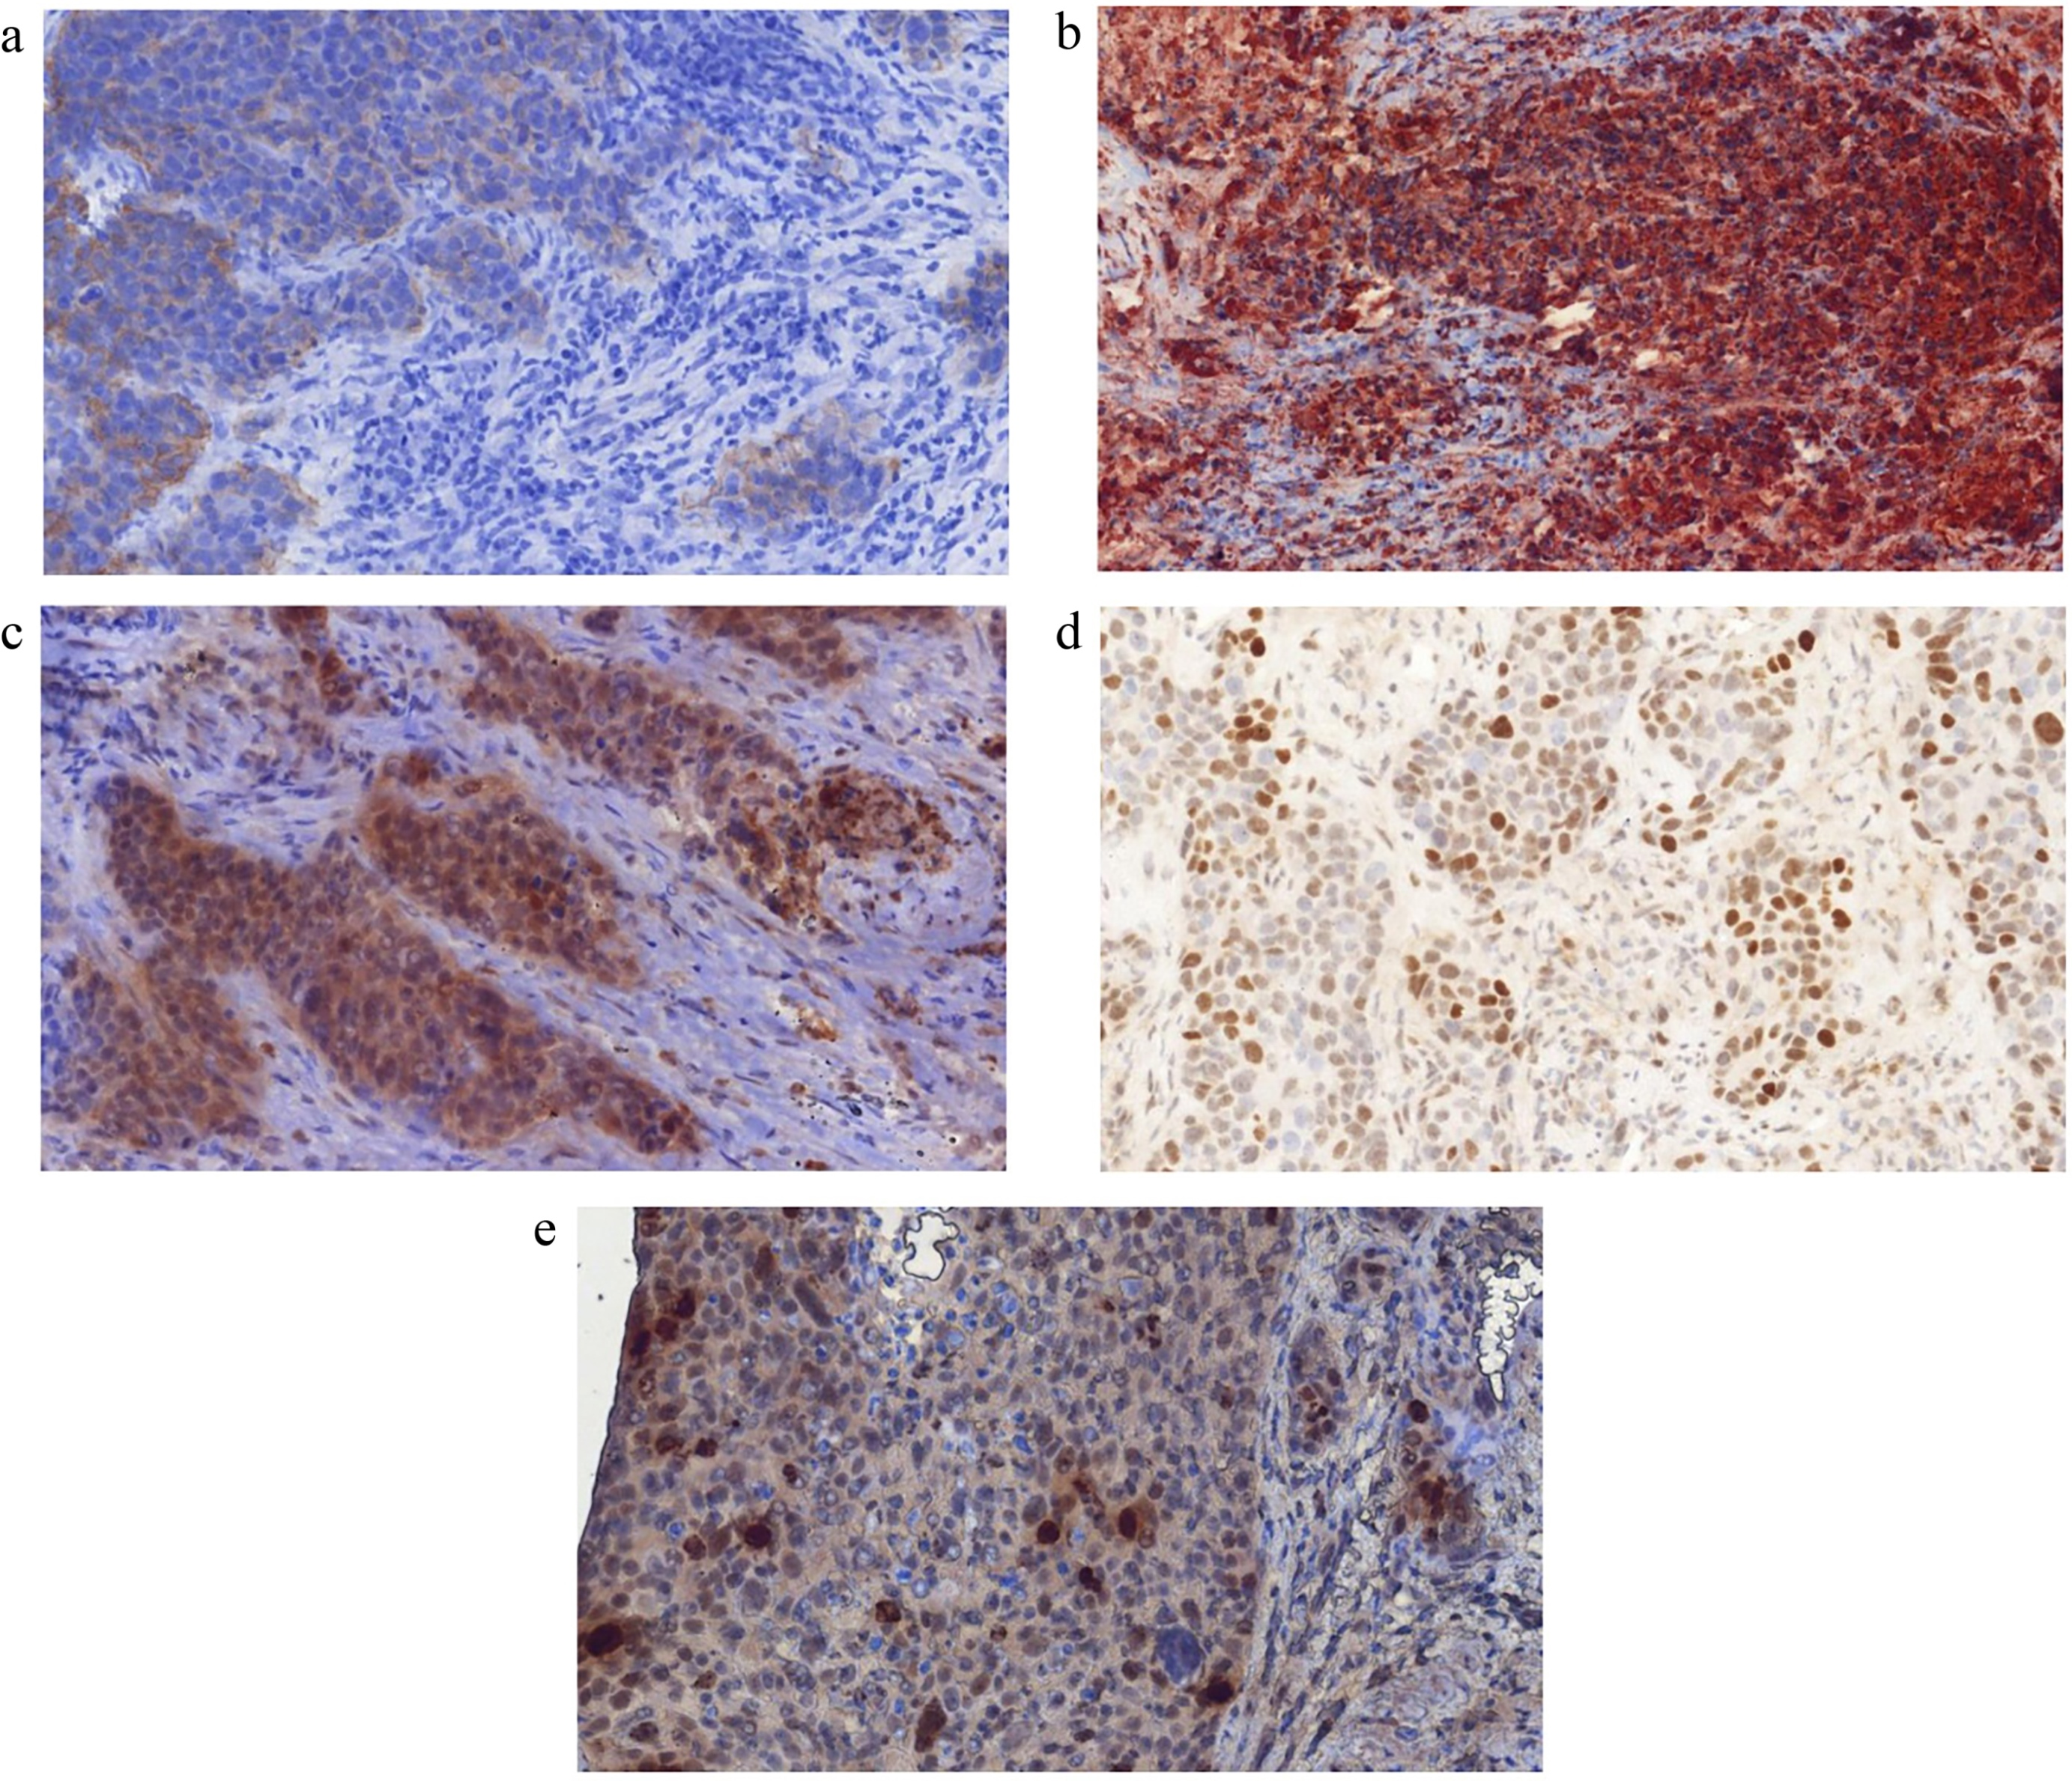
Histopathological findings. a. EGFR staining. Stained area is 5.3%. b. VEGF staining. Stained area is 57.8%. c. HIF-1 staining. Stained area is 28.9%. d. p53 staining. Stained area is 8.1%. e. Histone 3 staining. Stained area is 22.89%.
F-FDG-PET/CT
In all 18 patients an F-FDG-PET/CT (Siemens Biograph 16, Siemens Medical Solutions, Erlangen, Germany) was performed from the skull to the upper thigh after a fasting period of at least 6 hours. Radiotracer administration was performed intravenously after a fasting period of at least 6 hours with a body weight-adapted dose of F-FDG (4 MBq/kg, range: 152–442 MBq, mean std: 285 70 MBq). PET/CT image acquisition started on average 157 minutes after F-FDG application. Due to radiotracer elimination via the urinary tract, all patients received a bladder catheter prior to PET/CT examination. Low-dose CT was used for attenuation correction of the PET-Data.
F-FDG-PET and histopathological parameters of the investigated tumors
Parameters
Mean standard deviation
Median
Range
SUV
20.4 9.6
17.3
8.8–48.5
SUV
10.9 5.1
9.9
4.7–26.1
SUV
10.5 5.1
9.3
4.3–24.9
TLG
916.8 1125.2
410.4
92.9–4107.3
MTV
79.5 91.8
51.3
8.8–349.2
p53, %
14.0 9.9
11.0
2.7–33.2
EGFR, %
27.0 22.6
23.0
1–52.9
HIF 1 alpha, %
29.8 21.8
23.4
5.1–84.6
Histone 3, %
26.8 23.3
20.2
0.6–81.7
VEGF, %
28.1 21.0
22.9
0.7–61.1
Identified correlations between F-FDG-PET and histopathological parameters in uterine cervical cancer
P53
EGFR
HIF 1alpha
Histone 3
VEGF
SUV
0.223
0.442
0.278
0.003
0.073
0.39
0.067
0.265
0.99
0.773
SUV
0.206
0.437
0.451
0.011
0.015
0.428
0.069
0.06
0.964
0.951
SUV
0.145
0.404
0.509
0.065
0.013
0.58
0.096
0.031
0.798
0.958
TLG
0.108
0.601
0.143
0.238
0.185
0.68
0.008
0.57
0.341
0.463
MTV
0.056
0.586
0.028
0.36
0.28
0.83
0.011
0.913
0.142
0.261
Significant correlations are highlighted in bold.
PET/CT image analysis was performed on the dedicated workstation of Hermes Medical Solutions, Sweden. For each tumor, maximum and mean SUV (SUV; SUV), TLG and MTV were determined on PET-images. Prior to this, tumor margins of the CC were identified on diagnostic CT and fused PET/CT images and a polygonal volume of interest (VOI), that include the entire lesion in the axial, sagittal and coronal plane, was placed in the PET dataset (SUV threshold 40%) (Fig. 1a–c). MTV was defined as total tumor volume with an SUV 2.5 and was calculated automatically. TLG was also calculated automatically by multiplying the MTV of the primary tumor by its SUV.
Histopathological analysis
For every tumor, histopathological specimens were available. The specimens were deparaffinized, rehydrated and cut into 5 m slices. Thereafter, the histological slices were stained by the following markers: epidermal growth factor receptor (EGFR, EMERGO Europe, clone 111.6, dilution 1:30), p53 (DakoCytomation, Glostrup, Denmark), vascular endothelial growth factor (VEGF, EMERGO Europe, clone VG1, dilution 1:20), hypoxia-inducible factor (HIF-1 Biocare Medical, 60 Berry Dr Pacheco, CA 94553, USA; clone EP1215Y, dilution 1:100), histone 3 (Phospho-Histone H3, Biocare Medical, 60 Berry Dr Pacheco, CA 94553, USA; dilution 1:100).
Furthermore, the stained specimens were digitalized by using the Pannoramic microscope scanner (Pannoramic SCAN, 3DHISTECH Ltd., Budapest, Hungary) with Carl Zeiss objectives according to our previous descriptions [10, 11]. Thereafter, the digital histopathological images were further analyzed by using the ImageJ software 1.48v (National Institutes of Health Image program) with a Windows operating system [10, 11]. Expression of EGFR, p53, histone 3, VEGF, and HIF-1 (Fig. 2a–e) were estimated as a percent of stained areas per high power field.
Statistical analysis
Statistical analysis was performed using SPSS 23.0 (SPSS Inc, Chicago, IL, USA). The acquired data were analyzed by means of descriptive statistics. Spearman’s correlation coefficient () was used to investigate associations between the parameters. -values 0.05 were taken to indicate statistical significance.
Results
An overview about the analyzed F-FDG-PET and histopathological parameters is given in Table 2.
Correlation analysis identified statistically significant correlations between several parameters. TLG and MTV correlated well with expression of EGFR ( 0.601, 0.008 and 0.586, 0.011, respectively) (Table 3). Furthermore, SUV correlated inversely with expression of HIF-1 (0.509, 0.031). Additionally, SUV tended to correlate with expression of EGFR and HIF-1 (Table 3).
SUV also tended to correlate with EGFR.
None of the F-FDG-PET parameters showed significant correlations with expression of Histone 3, p53 and VEGF.
Discussion
The present study identified significant associations between F-FDG-PET parameters and histopathological findings in uterine CC.
Previously, only few reports analyzed associations between F-FDG-PET and histopathology in CC. Predominantly, biomarkers having a direct role in FDG uptake like glucose transporter type-1 (GLUT 1) and hexokinases were analyzed [12]. So Park et al. observed statistically significant slightly correlations between SUV and expression of GLUT 1 ( 0.342, 0.008), carbonic anhydrase IX ( 0.281, 0.03) and hexokinase type II ( 0.571, 0.001) [12]. The identified correlations are of interest, however, they could not explain the associations between F-FDG-PET and tumor behavior in CC mentioned above.
According to the literature, several histopathological features can play an important role in CC. Especially epidermal growth factor receptor (EGFR), tumor suppressor protein p53, vascular endothelial growth factor (VEGF), hypoxia-inducible factor (HIF)-1 and histone 3 influence significantly tumor behavior [13, 14, 15, 16]. For example, EGFR, a glycoprotein receptor activates a tyrosine kinase domain to regulate multiple functions like cell growth, differentiation, gene expression and development [13, 14, 15, 16, 17]. It has been shown that overexpression of EGFR has been associated with poor prognosis in CC [15, 16, 17]. VEGF is another important factor in CC. It has been shown that VEGF is an independent prognostic factor of unfavorable clinical outcome [13, 17]. VEGF predicts disease-free survival and overall survival in CC [13, 18]. Furthermore, VEGF expression is also associated with metastasis-free survival in CC [17, 18]. Tumor suppressor protein p53 also predicts tumor prognosis in CC. According to the literature, patients with p53-positive tumors showed a shorter disease-free survival in comparison to patients with p53-negative lesions [13, 19]. Another factor, namely HIF-1, mediates cellular response to hypoxia and activates numerous hypoxia-response genes [13, 20]. Thereby, it prevents hypoxia-induced cell death [13, 20, 21]. High HIF-1 expression is associated with poor survival in CC [13, 20, 21]. Finally, histone 3 plays also an important role in CC. Oversimplified; this factor is incorporated into the cell cycle and reflects proliferation potential [22]. Histone H3 acetyl K9 is an independent marker of overall survival in CC. Furthermore, histone H3 tri methyl K4 is associated with poor prognosis [22]. In addition, histone H3 tri methyl K4 is an independent marker of relapse-free survival [22].
To the best of our knowledge, previously, only two studies investigated correlations between clinically relevant histopathological features and F-FDG-PET parameters in CC [12, 23]. It has been shown that KI 67 correlated moderately with SUV ( 0.59, 0.005) and SUV ( 0.45, 0.04) [23]. In another study, weakly correlations were observed between cytoplasmic HIF-1 and SUV ( 0.309, 0.016) [12]. Furthermore, SUV tended to correlate with expression of VEGF ( 0.251, 0.053) [12].
In the present study, several interesting aspects were observed. Firstly, widely used routine F-FDG-PET parameters, namely SUV and SUV did not correlate statistically significant with the analyzed histopathological features. However, metabolo-volumetric parameters MTV and TLG correlated well with expression of EGFR. This finding suggests that metabolo-volumetric parameters are more sensitive than SUV or SUV in reflection of associations between metabolic activity and histopathology in CC. The identified relationships seem logical. In fact, EGFR signaling is very important in cellular homeostasis, proliferation, and growth [13]. Therefore, metabolo-volumetric F-FDG-PET parameters can predict proliferation activity in CC. Furthermore, this finding is in accordance with the reported data, which identified significant correlations between F-FDG-PET parameters and expression of proliferation marker KI 67 in CC [23].
Furthermore, as shown, SUV can predict hypoxic tissue areas. HIF-1 induces the expression of different target genes; those regulating angiogenesis and glucose metabolism are some of the most important with respect to cancer growth [13, 20].
Secondly, none of the F-FDG-PET parameters showed significant correlations with expression of p53, VEGF and histone 3. Therefore, it may be postulated that F-FDG-PET cannot predict tumor suppression, angiogenesis and some tumor proliferation pathways in CC. This finding is difficult to explain. As mentioned above, p53, VEGF and histone 3 influence tumor aggressiveness and invasiveness in CC. Similarly, also F-FDG-PET parameters predict tumor behavior in CC. Presumably, F-FDG-PET may be associated with these histopathological features. Previous investigations analyzed only associations between several standardized uptake values (SUV and/or SUV) and histopathology in CC [12, 23]. In the present study, also SUV and volume-based parameters TLG and MTV were estimated. According to the literature, volume-based FDG PET/CT parameters were significant prognostic factors in patients with uterine cervical cancer [2, 24]. Furthermore, TLG and MTV could independently predict survival in patients with locally advanced uterine cervical cancer [2]. Therefore, it may be postulated that PET investigation of uterine cervical carcer should include estimation of volume-based parameters.
Our study is limited to the relatively small number of patients. Clearly, further investigations with more patients are needed to confirm the identified associations between F-FDG-PET and histopathological parameters.
In conclusion, TLG and MTV can reflect expression of EGFR and SUV correlated significantly with expression of HIF-1. None of the PET parameters can predict expression of Histone 3, p53 and VEGF.
Footnotes
Conflict of interest
The authors declare that there are no conflicts of interest.
References
1.
BrayF. et al., Global cancer statistics 2018: GLOBOCAN estimates of incidence and mortality worldwide for 36 cancers in 185 countries, CA: A Cancer Journal for Clinicians (2018), doi: 10.3322/caac.21492.
2.
HanS. et al., Prognostic value of volume-based metabolic parameters of 18F-FDG PET/CT in uterine cervical cancer: A systematic review and meta-analysis, American Journal of Roentgenology (Sep 12 2018), 1–10. doi: 10.2214/AJR.18.19734.
3.
PalaniswamyS.S. et al., 18F-FDG PET/CT in the evaluation of cancer cervix: Where do we stand today? Nuclear Medicine Communications39 (2018), 583–592.
4.
SchernbergA. et al., A score combining baseline neutrophilia and primary tumor SUVpeak measured from FDG PET is associated with outcome in locally advanced cervical cancer, European Journal Nuclear Medicine and Molecular Imaging45 (2018), 187–195.
5.
LeeH.J. et al., Prognostic value of metabolic parameters determined by preoperative 18F-FDG PET/CT in patients with uterine carcinosarcoma, Journal of Gynecologic Oncology28 (2017), e43.
6.
ShenW.C. et al., 18Fluorodeoxyglucose positron emission tomography for the textural features of cervical cancer associated with lymph node metastasis and histological type, European Journal Nuclear Medicine and Molecular Imaging44 (2017), 1721–1731.
7.
MiccoM. et al., Combined pre-treatment MRI and 18F-FDG PET/CT parameters as prognostic biomarkers in patients with cervical cancer, European Journal of Radiology83(7) (2014), 1169–1176.
8.
PanL. et al., The SUVmax (maximum standardized uptake value for F-18 fluorodeoxyglucose) and serum squamous cell carcinoma antigen (SCC-ag) function as prognostic biomarkers in patients with primary cervical cancer, Journal of Cancer Research and Clinical Oncology138(2) (2012), 239–246.
9.
ChungH.H. et al., Prognostic value of preoperative intratumoral FDG uptake heterogeneity in early stage uterine cervical cancer, Journal of Gynecologic Oncology27(2) (2016), e15.
10.
SurovA. et al., Associations between histogram analysis parameters of dynamic contrast-enhanced magnetic resonance imaging and histopathological findings including proliferation potential, cellularity, and nucleic areas in head and neck squamous cell carcinoma, Oncotarget9(30) (2018), 23599–23607.
11.
MeyerH.J. et al., Histogram analysis of ADC in rectal cancer: Associations with different histopathological findings including expression of EGFR, Hif 1alpha, VEGF, p53, PD 1, and KI 67. A preliminary study, Oncotarget9(26) (2018), 18510–18517.
12.
ParkS.I. et al., Correlation between biological marker expression and F-fluorodeoxyglucose uptake in cervical cancer measured by positron emission tomography, Onkologie36(4) (2013), 169–174.
13.
GadducciA. et al., Tissue biomarkers as prognostic variables of cervical cancer, Critical Reviews in Oncology Hematology86(2) (2013), 104–129.
14.
SoonthornthumT. et al., Epidermal growth factor receptor as a biomarker for cervical cancer, Annals of Oncology22(10) (2011), 2166–2178.
15.
NoordhuisM.G. et al., Expression of epidermal growth factor receptor (EGFR) and activated EGFR predict poor response to (chemo)radiation and survival in cervical cancer, Clinical Cancer Research15(23) (2009), 7389–7397.
16.
KimY.T. et al., Correlation between expression of EGFR and the prognosis of patients with cervical carcinoma, Gynecology Oncology87(1) (2002), 84–89.
17.
GaffneyD.K. et al., Epidermal growth factor receptor (EGFR) and vascular endothelial growth factor (VEGF) negatively affect overall survival in carcinoma of the cervix treated with radiotherapy, International Journal of Radiation Oncology Biology Physics56(4) (2003), 922–928.
18.
CarpiniJ. Delliet al.,Vascular endothelial growth factor and its relationship to the prognosis and treatment of breast,ovarian, and cervical cancer, Angiogenesis,13(1)(2010),43–58.
19.
CrawfordR.A. et al., Prognostic significance of the bcl-2 apoptotic family of proteins in primary and recurrent cervical cancer, British Journal of Cancer78(2) (1998), 210–214.
20.
IwasakiK. et al., Role of hypoxia-inducible factor-1α, carbonic anhydrase-IX, glucose transporter-1 and vascular endothelial growth factor associated with lymph node metastasis and recurrence in patients with locally advanced cervical cancer, Oncology Letters10(4) (2015), 1970–1978.
21.
HuangM. et al., Overexpression of hypoxia-inducible factor-1α is a predictor of poor prognosis in cervical cancer: A clinicopathologic study and a meta-analysis, International Journal of Gynecologic Cancer24(6) (2014), 1054–1064.
22.
BeyerS. et al., Histone H3 acetyl K9 and histone H3 tri methyl K4 as prognostic markers for patients with cervical cancer, International Journal of Molecular Science18(3) (2017), E477.
23.
SurovA. et al., Parameters of simultaneous 18F-FDG-PET/MRI predict tumor stage and several histopathological features in uterine cervical cancer, Oncotarget8(17) (2017), 28285–28296.
24.
LiangY. et al., Prognostic value of volume-based metabolic parameters obtained by 18F-FDG-PET/CT in patients with locally advanced squamous cell cervical carcinoma, Journal of Computer Assisted Tomography42 (2018), 429–434.