
Abstract
BACKGROUND:
Clear cell renal cell carcinoma (CCRCC) is the most aggressive form of renal cell carcinoma (RCC).
OBJECTIVE:
This study was aimed to identify the differentially expressed miRNAs and target genes in CCRCC.
METHODS:
The miRNA and mRNA next-generation sequencing data were downloaded from The Cancer Genome Atlas (TCGA) dataset. Differential expression analysis was performed, followed by correlation analysis of miRNA-mRNA. Functional enrichment and survival analysis was also performed.
RESULTS:
Seven hundred and eighty-seven patients with CCRCC from TCGA data portal were included in this study. A total of 52 differentially expressed miRNAs were identified in CCRCC. Then 2361 differentially expressed genes (DEGs) were identified. Prediction analysis and correlation analysis revealed that 89 miRNA-mRNA pairs were not only predicted by algorithms but also had a significant inverse relationship. Several differentially expressed miRNAs such as hsa-mir-501 and their target genes including AK1, SLC25A15 and PCDHGC3 had a significant prognostic value for CCRCC patients.
CONCLUSIONS:
Alterations of differentially expressed miRNAs and target genes may be involved in the development of CCRCC and can be considered as the prognostic markers for CCRCC.
Introduction
Renal cell carcinoma (RCC) accounts for about 80% of kidney cancers, and large numbers of new cases are diagnosed worldwide [1]. RCC consists of various types of cancer: papillary renal cell carcinoma, clear cell renal cell carcinoma, chromophobe renal cell carcinoma, urothelial carcinoma, renal medullary carcinoma and collecting duct carcinoma [2]. Clear cell renal cell carcinoma (CCRCC) develops from epithelium of the proximal tubules and is the most aggressive form of RCC. CCRCC has two origins including sporadic and familial cases [3]. The underlying mechanism includes obesity, smoking and acquired kidney disease [4, 5, 6].
The majority of CCRCC cases are diagnosed at the late stage because of the asymptomatic course of the disease. The classic symptoms of advanced CCRCC are hematuria, fatigue, flank pain and rarely abdominal mass [7]. CCRCC is a therapy-resistant carcinoma due to the poor or not at all response to radiotherapy, chemotherapy and hormonal therapy. Generally, most patients with localized disease are treated with surgical resection, however, nearly a third develop recurrence and die of the disease. It is suggested that CCRCC is rarely cured once spread beyond the kidney [8]. In addition, there is no commensurate improvement in survival of CCRCC. It is reported that CCRCC has a worse prognosis with 5-year survival of 77% [9, 10]. Large numbers of prognostic markers have been studied in CCRCC such as p53, XIAP, VEGF, HIF1-
Recently, the pathological mechanism of CCRCC is still unclear. It is needed to discover the molecular basis of the disease, which is helpful in understanding the molecular mechanism and providing potential detection and prognostic markers. It is noted that miRNA expression analyses have provided meaningful insight into the clinical pathology of many solid tumors. MiRNAs are small non-coding RNAs that function in the regulation of protein-coding or non-coding gene expression. Several miRNAs including hsa-mir-215, hsa-mir-708, hsa-mir-204, hsa-mir-205, hsa-mir-141 and hsa-mir-199a have been found to regulate of CCRCC cell growth, apoptosis, invasion and migration, which suggested that miRNA dysfunction may be related to CCRCC carcinogenesis [12, 13, 14, 15, 16, 17, 18].
In this study, we integrated the analysis of miRNA and mRNA profiling data, which were downloaded from The Cancer Genome Atlas (TCGA) dataset of CCRCC. Differentially expressed miRNAs and differentially expressed genes (DEGs) were identified in CCRCC compared with the normal tissues. Function enrichment analysis of a variety of target genes of differentially expressed miRNAs was then performed. In the end, several candidate miRNAs and target genes were identified for the survival analysis of CCRCC. Our result may provide the new field in uncovering the molecular mechanism of CCRCC.
Clinical information about these 787 patients with CCRCC
Clinical information about these 787 patients with CCRCC
The interactions of miRNA-targets pairs with negatively correlation. Diamonds and ellipses represent the miRNAs and target genes, respectively. The red and green colors represent up-regulation and down-regulation, respectively.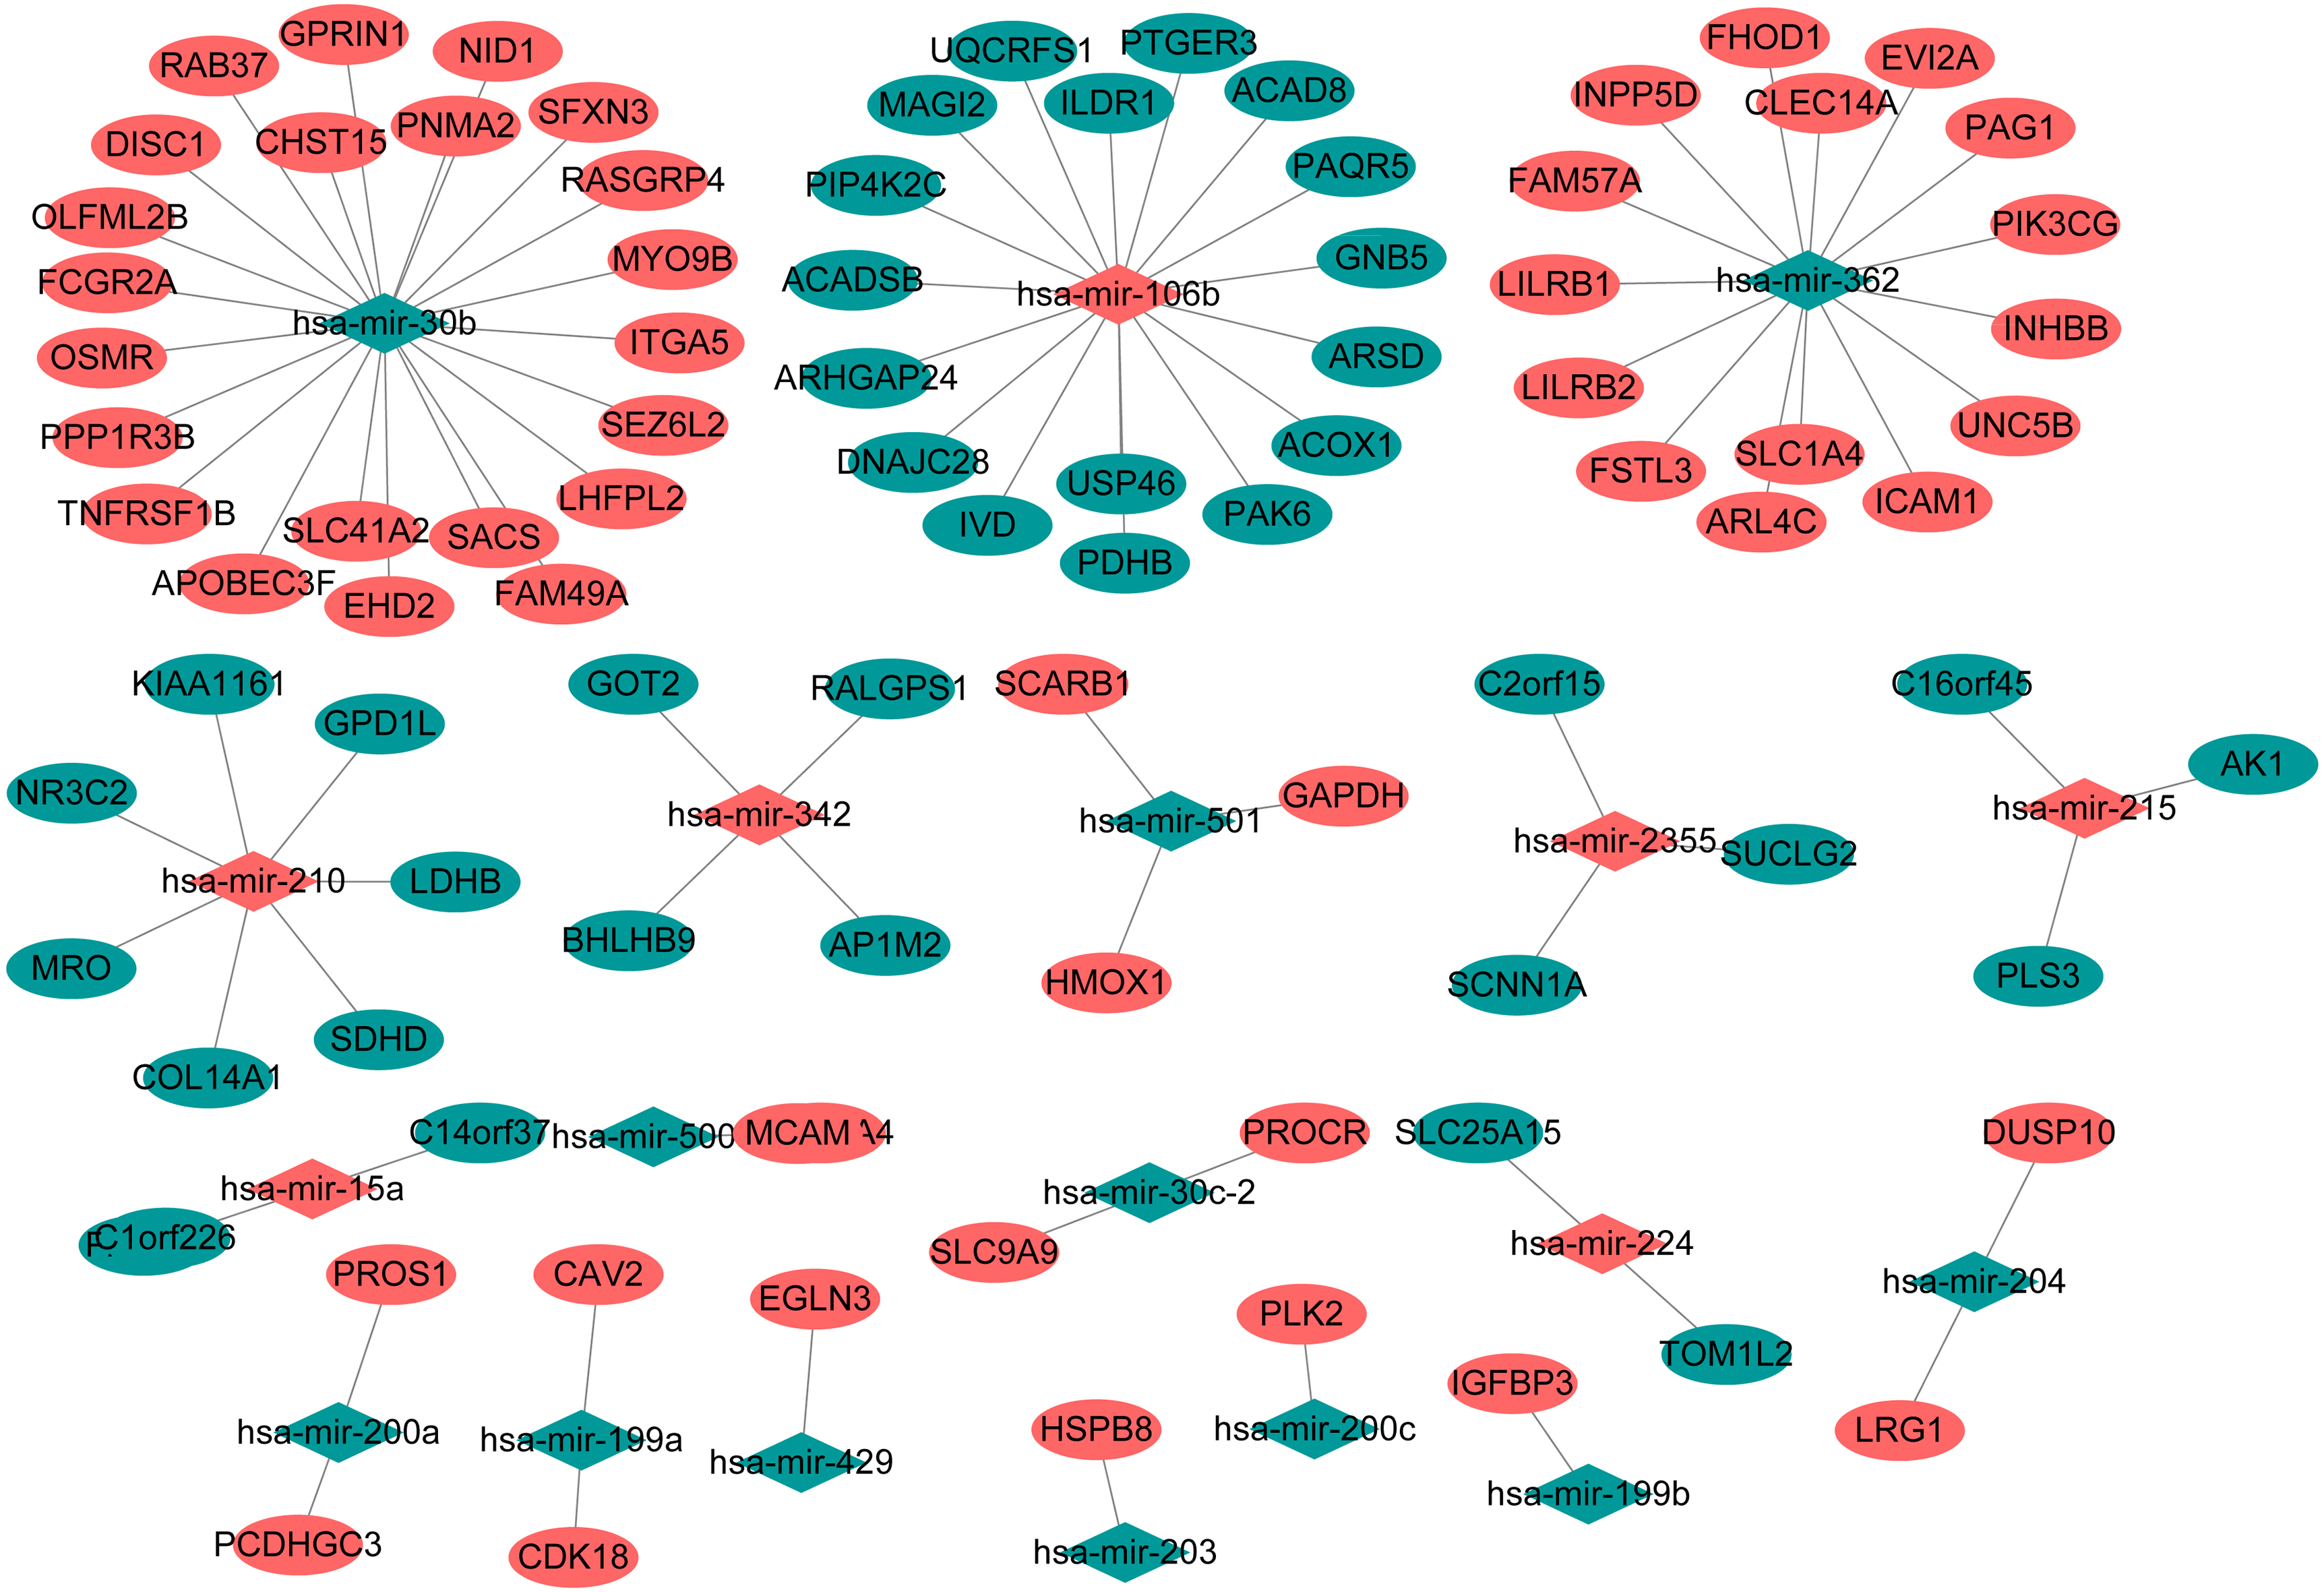
Datasets
In this study, the miRNA expression and mRNA expression data from TCGA data portal (
Differential expression analysis of miRNAs and genes
Differential expression of miRNAs and genes between CCRCC tumors and normal tissues was assessed using the R-bioconductor package DESeq [19], and the p-value were then calculated. Multiple hypothesis testing was performed by the Benjamini-Hochberg procedure [20], and the false discovery rate was used to control for differential expression. Differentially expressed miRNAs and genes were identified with the thresholds of p_value
MiRNA-mRNA expression correlation analysis
Pairwise pearson correlation coefficients between differentially expressed miRNAs and genes were first calculated. Statistical significance was defined as p_value
Top 15 Go terms for target genes in CCRCC
Top 15 Go terms for target genes in CCRCC
KEGG pathways for target genes in CCRCC
The heat map of miRNAs in the miRNA-targets regulatory network. Diagram presents the result of a two-way hierarchical clustering of miRNAs and samples. The clustering is constructed using the complete-linkage method together with the Euclidean distance. Each row represents a miRNA and each column, a sample. The miRNA clustering tree is shown on the right. The colour scale illustrates the relative level of miRNA expression: red, below the reference channel; green, higher than the reference.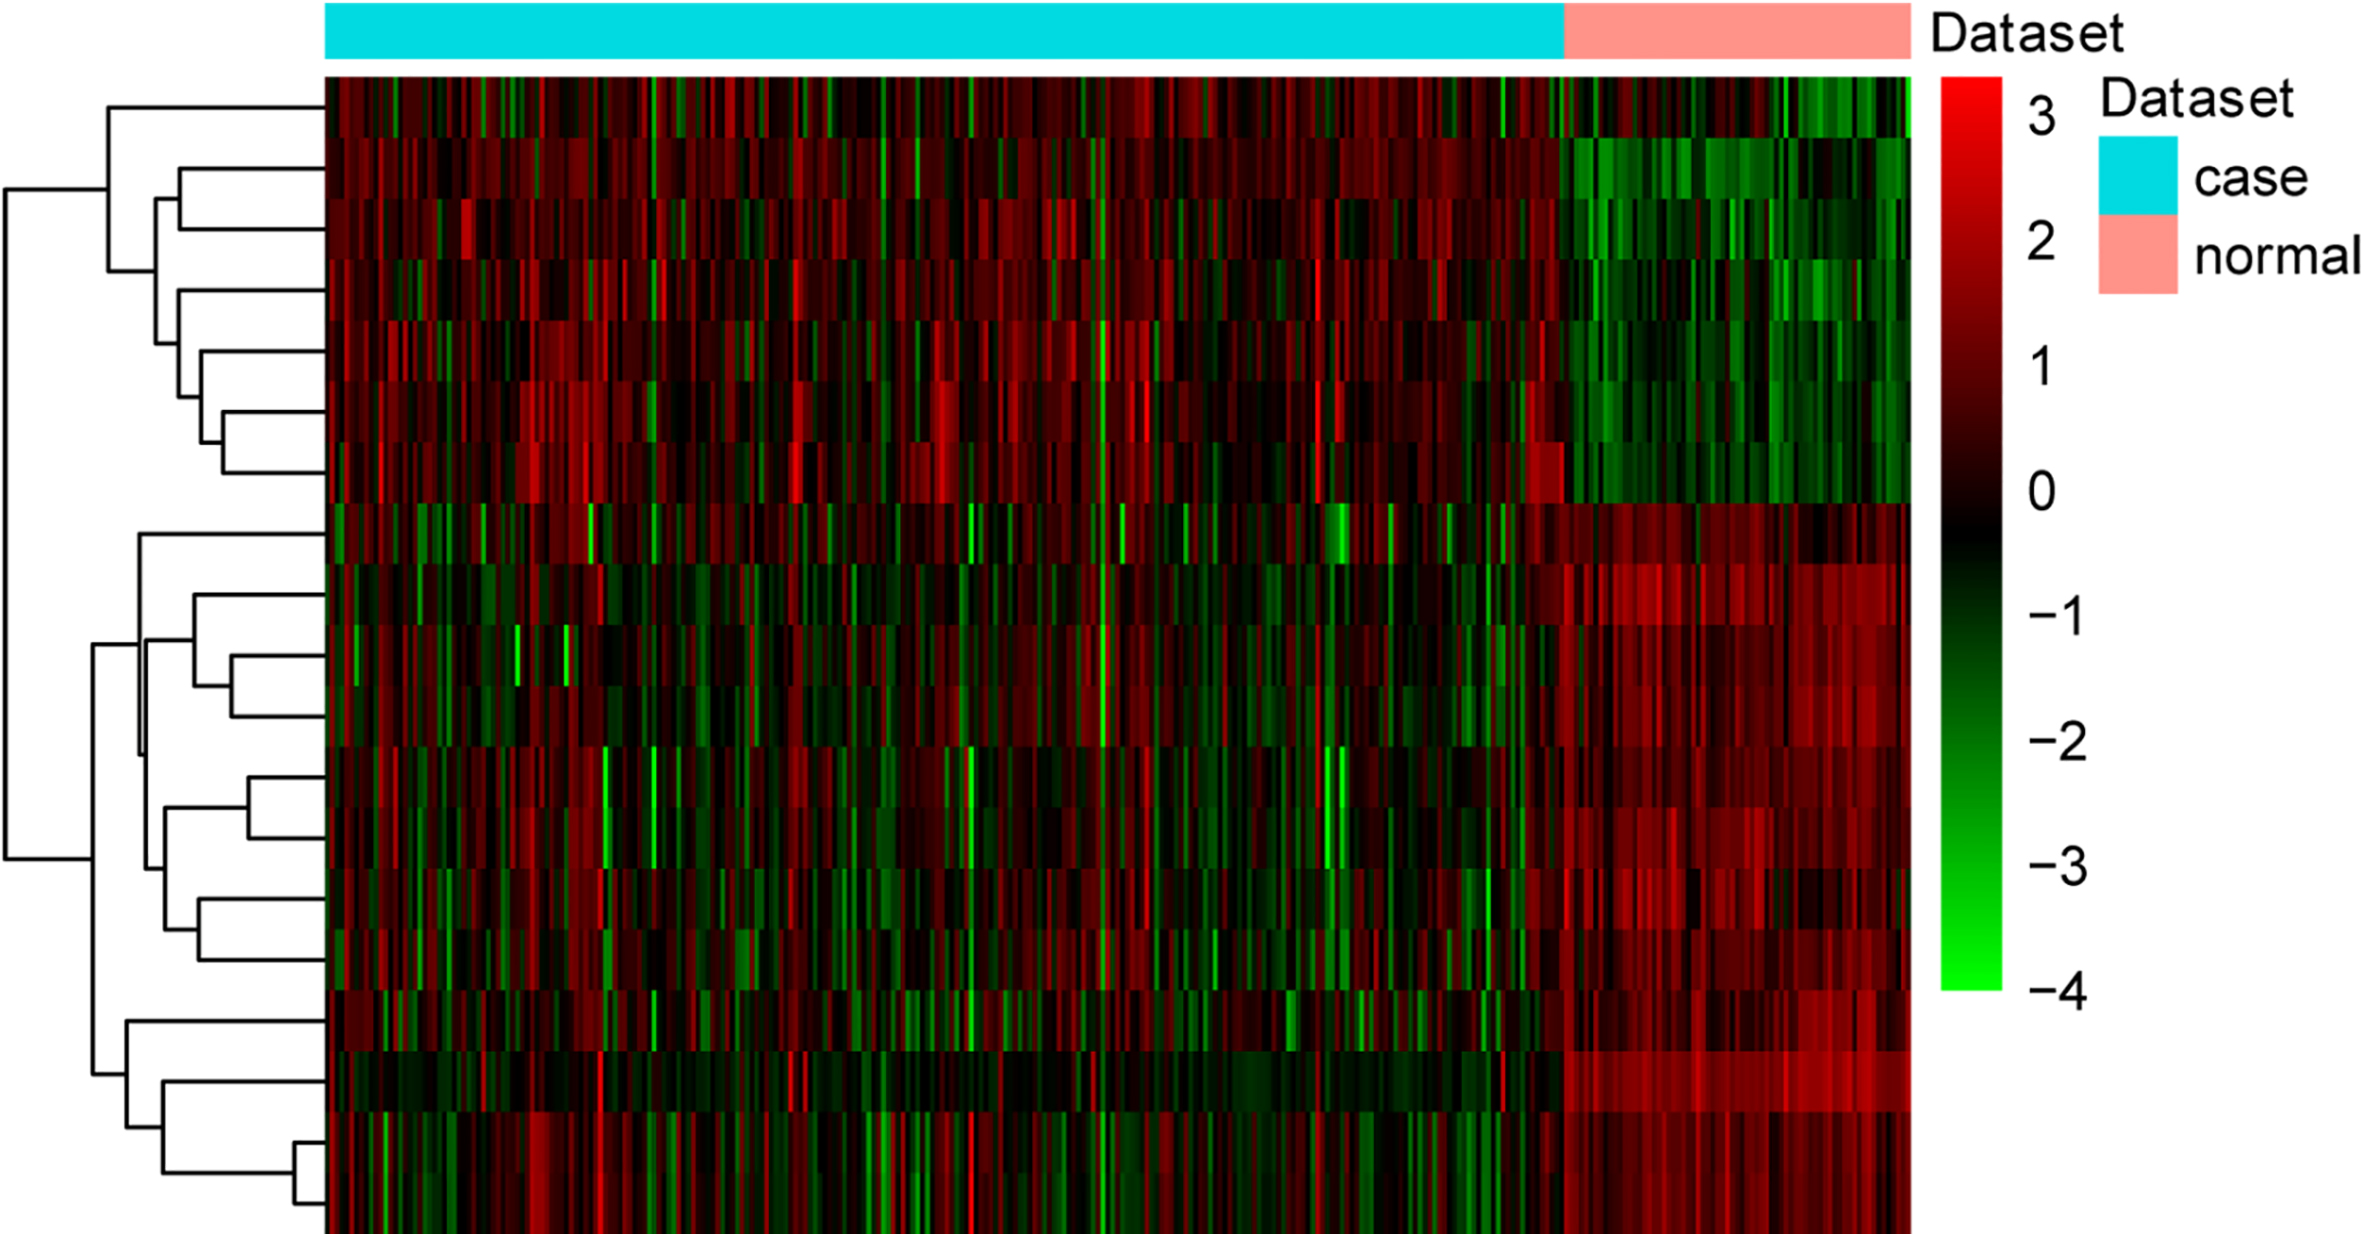
The heat map of target genes in the miRNA-targets regulatory network. Diagram presents the result of a two-way hierarchical clustering of DEGs and samples. The clustering is constructed using the complete-linkage method together with the Euclidean distance. Each row represents a DEG and each column, a sample. The DEG clustering tree is shown on the right. The colour scale illustrates the relative level of DEG expression: red, below the reference channel; green, higher than the reference.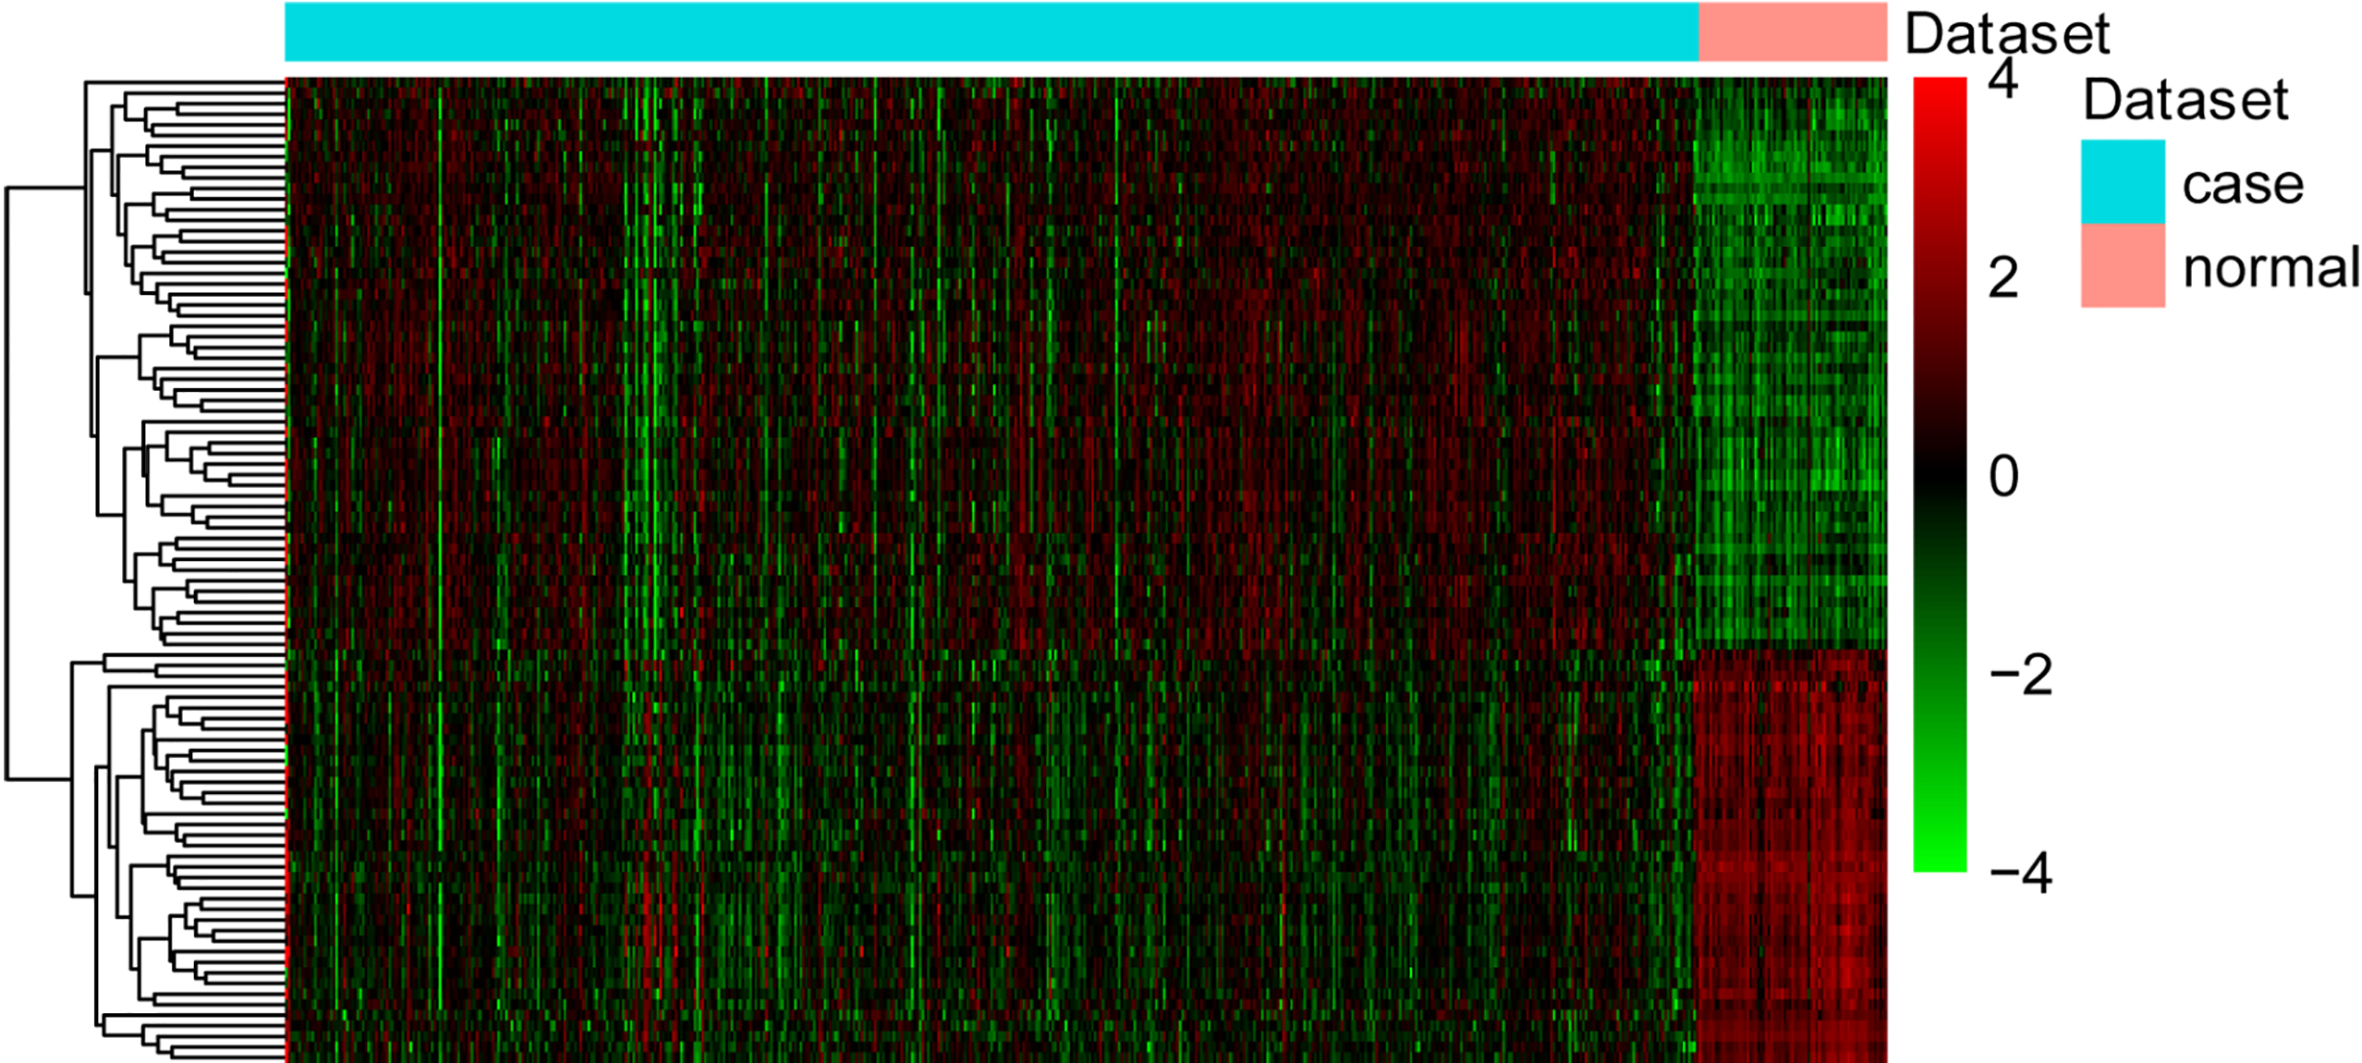
The survival curves of selected miRNAs and DEGs with significant prognostic value for patients with CCRCC. Censoring samples are marked with ‘+’. The x-axis represents time to event and the y-axis represents the percentage. The number of samples, censored number and concordance index (CI) is shown in the top-right insets. High- and low-risk groups are labeled with red and green curves, respectively.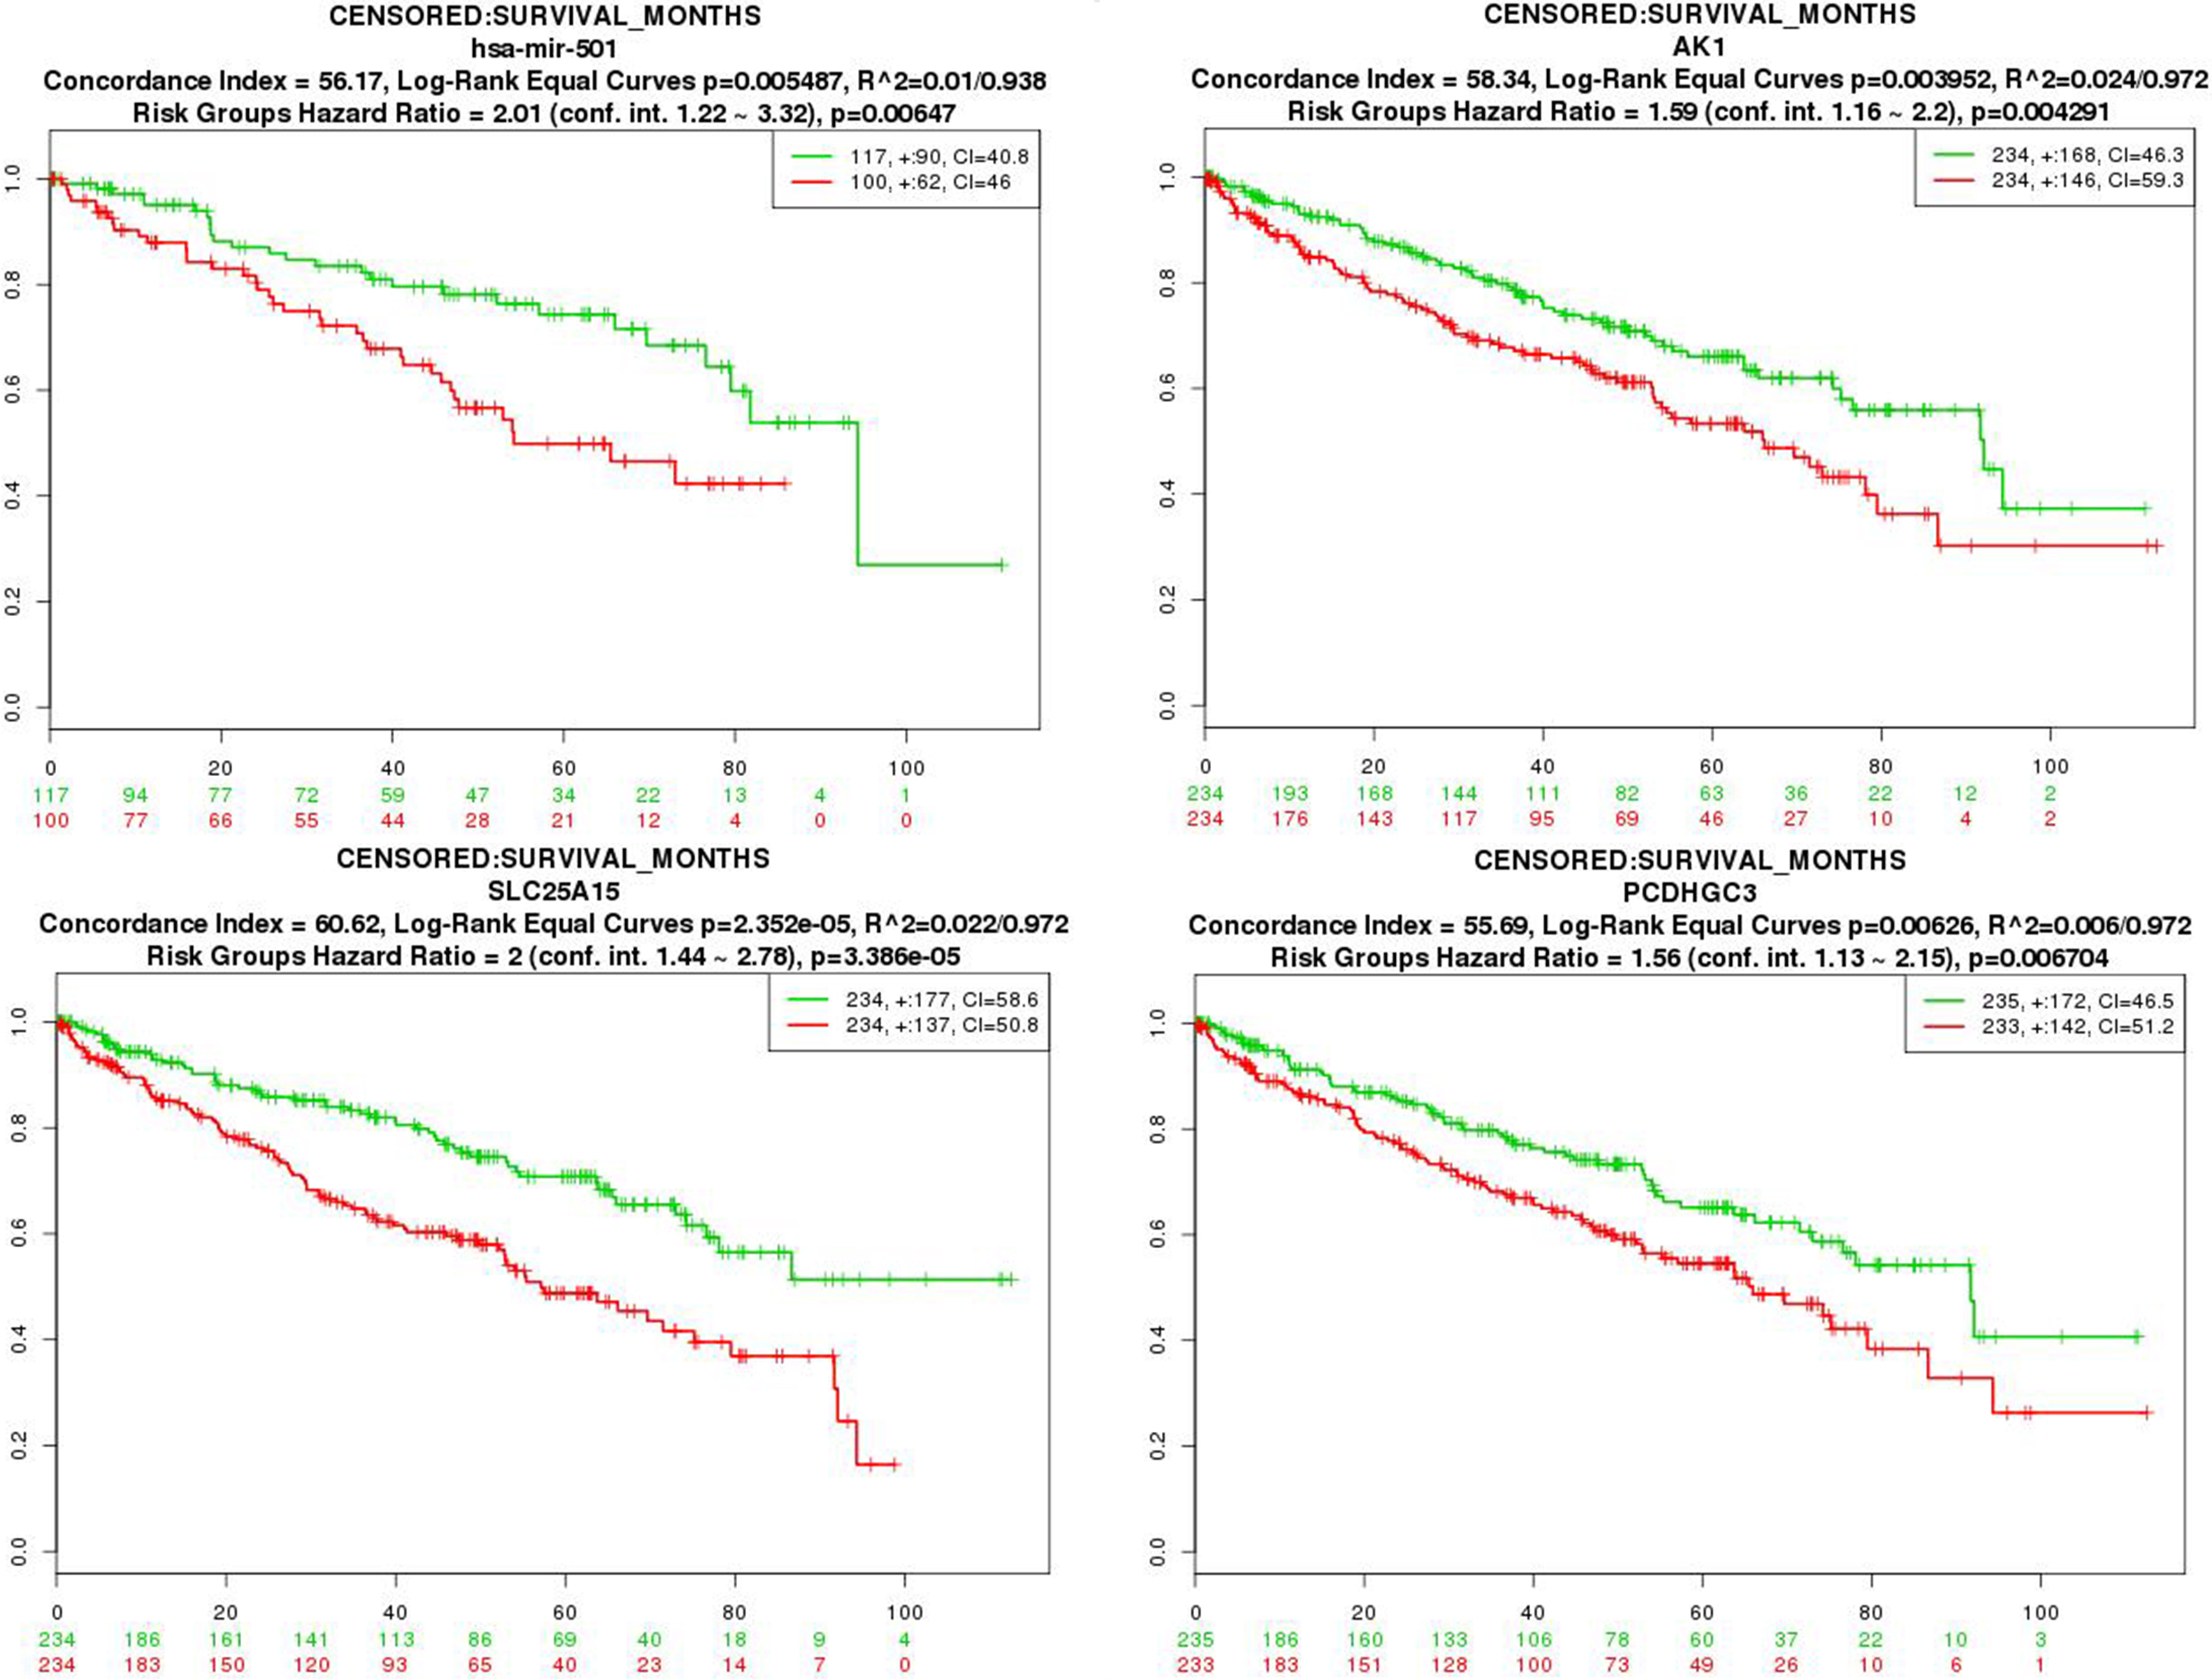
In order to investigate the functional information of target genes in the miRNA-target regulatory network, Database for Annotation, Visualization, and Integrated Discovery (DAVID) was applied to address it by web-based analysis modules, including Gene Ontology (GO) functional categories [22] and Kyoto Encyclopedia of Genes and Genomes (KEGG) biochemical pathway [23].
Survivability analysis of differentially expressed miRNAs and target genes
The online software SurvExpress (
Results
MiRNA and mRNA expression signature
According to the thresholds of p_value
MiRNA-mRNA interactions
Epigenetic modification of gene regulation plays an important role in many cancers. According to miRNA-targets expression correlation analysis, there were 40939 miRNA-targets pairs which were negatively correlated (p_value
Functional annotation
To find the potential biological functions of target genes in the miRNA-targets regulatory network, functional enrichment was conducted. The GO results showed that target genes were significantly related to signal transduction, cell adhesion and extracellular matrix organization of biological process; ATP binding, protein binding and nucleotide binding of molecular function; integral to the membrane, membrane and cytoplasm of the cellular component. Renal cell carcinoma signal was one of significant enriched signal pathways involving EGLN3, PAK6 and PIK3CG. Top 15 GO terms and all KEGG pathways of target genes were shown in Tables 2 and 3, respectively.
Survivability analysis
In order to analyze the survivability of miRNAs and target genes in the miRNA-target regulatory network, hsa-mir-215, hsa-mir-199a-1, hsa-mir-204, hsa-mir-501, hsa-mir-2355, AK1, CDK18, LRG1, GAPDH, SCARB1, HMOX1, SUCLG2, SLC25A15, TOM1L2, PCDHGC3, PROS1, SLC9A9 and EGLN3 were selected for survivability analysis. Our result showed that hsa-mir-501, AK1, SLC25A15 and PCDHGC3 had a significant prognostic value for CCRCC patients (Fig. 4).
Discussion
CCRCC is the most common type of RCC, which affects the health of patients. Complementation of multidimensional omics data can remarkably increase the value of the study results and highlight the prominent associations between gene expression and cancer [24]. In this study, we integrated miRNA profiles and mRNA profiles data of CCRCC to find the value miRNAs and genes which were associated with the development of CCRCC. Integration of miRNA profiles led to 52 differentially expressed miRNAs and 2361 differentially expressed genes in CCRCC compared with normal tissue. According to miRNA-mRNA expression correlation analysis and miRNA target prediction, we obtained 89 miRNA-mRNA pairs under the thresholds of p_value
Hsa-mir-215 is involved in cancer cellular proliferation and migration, and can induce cell-cycle arrest by increasing the expression of p21 [25]. It is found that hsa-mir-215 is decreased in metastatic RCC samples compared to primary RCC tissues [12]. It is found that AK1 is significantly expressed in renal cells [26]. In this study, we found that hsa-mir-215 was up-regulated in the tumor tissues of CCRCC. One of target genes of hsa-mir-215, adenylate kinase 1 (AK1), was down-regulated in CCRCC. It is suggested that epigenetic modification regulation between hsa-mir-215 and AK1 was correlated with CCRCC progression. In addition, AK1 were closely associated with the survival time of CCRCC.
It is proposed that hsa-mir-199a-1 may target cancer-specific lncRNAs by miRNA response elements [27]. CDK18 belongs to the cell cycle-related CDK subfamilies, which play various functional roles by regulating different cell cycle progress [28]. Increased phosphorylation of CDK18 is found in the database of vasopressin regulation of kidney [29]. It is a putative up-regulated target gene of hsa-mir-101 in RCC specimens [30]. Herein, we first found that the expression of hsa-mir-199a-1 was down-regulated in the tumor tissues of CCRCC. Additionally, cyclin dependent kinase 18 (CDK18) was up-regulated and targeted by hsa-mir-199a-1. This indicated that the cell cycle-related gene CDK18 under the regulation of hsa-mir-199a-1 may serve as a biomarker for the early stages of CCRCC tumor development.
Lu et al. found that the expression of hsa-mir-204 was higher in human kidney compared with other organs tested [31]. It has been demonstrated that hsa-mir-204 is down-regulated and is a potential survival molecular biomarker of CCRCC [32, 33]. Moreover, the higher tumor grade of CCRCC is associated with a concomitant decrease in hsa-mir-204 [16]. LRG1 has been reported to play roles in cell proliferation, cell migration, cell apoptosis, immune response and neovascularization [34, 35, 36, 37]. It is worth mentioning that the missense mutations (L279F) in LRG1 gene is detected in the chromophobe RCC tissues [38]. In this study, we found that hsa-mir-204 was down-regulated. Furthermore, leucine rich alpha-2-glycoprotein 1 (LRG1), one of target genes of hsa-mir-204, was up-regulated in the tumor tissues of CCRCC. Our results provided additional evidence for their important roles of hsa-mir-204 and LRG1 in CCRCC.
It is reported that hsa-mir-501-5p is down-regulated and involved in the focal adhesion and extracellular matrix pathways in the papillary RCC [39]. Vila et al. found that the amount of GAPDH was increased in tumor tissues of CCRCC patients [40]. Scavenger receptor class B member 1 (SCARB1) has been suggested implicated in the development of CCRCC [41]. RNA-seq analysis showed that the expression of SCARB1 was up-regulated in CCRCC [42]. In addition, the mutation (rs4765623) in the SCARB1 gene has been found associated with CCRCC [43]. Banerjee et al. found that Heme oxygenase 1 (HMOX1, also called HO-1) was often over expressed in RCC, which protected cancer cells from apoptosis induced by chemo- therapeutic drug [44]. It is proposed that HMOX1 expression may be a useful biomarker for drugs response prediction for patients with metastatic CCRCC [45]. Our study found that hsa-mir-501 was down-regulated in CCRCC, which had a potential interaction with the up-regulation of GAPDH, SCARB1 and HMOX1. Our results suggested that hsa-mir-501 and target genes including GAPDH, SCARB1 and HMOX1 were correlated with CCRCC progression.
The expression of hsa-mir-2355 is up-regulated in lung adenocarcinoma compared with adjacent normal tissues [46]. In addition, hsa-mir-2355-5p has been detected in breast cancer when compared to normal tissue [47]. The expression of succinate-CoA ligase GDP-forming beta subunit (SUCLG2) is detected in the chromophobe RCC [48]. There is a significant decreased expression of SUCLG2 in CCRCC tissues compared with normal kidney tissue [49]. Herein, we found that hsa-mir-2355 was up-regulated in CCRCC and had a potential interaction with the down-regulation of SUCLG2, which indicated the important roles in the process of CCRCC.
Down-regulated expression of hsa-mir-200a is found in metastatic CCRCC compared to benign kidney tissues [50]. Additionally, the expression of hsa-mir-200a-3p in plasma is related to overall survival of metastatic kidney cancer [51]. It has been found that protocadherin gamma subfamily C, 3 (PCDHGC3) is expressed in RCC [52]. Protein S (PROS1) is up-regulated and involved in organismal and immune system of CCRCC [53]. In addition, genetic mutation of PROS1 (c.1294C
Hsa-mir-30c-2 is decreased in metastatic CCRCC compared to benign kidney tissue [50]. It is found that solute carrier family 9 member A9 (SLC9A9) is involved in chromosomal rearrangements in RCC [55]. Herein, we found that the expression of hsa-mir-30c-2 was decreased and inversely correlated with SLC9A9. In a word, the expression changes of SLC9A9 under the regulation of hsa-mir-30c-2 illuminated the mechanism of carcinogenesis which may play a crucial role in the progress of CCRCC.
Down-regulated hsa-mir-429 can significantly inhibit cancer cell proliferation, suggesting that hsa-mir-429 was a candidate tumor suppressive miRNA in RCC [56]. It is reported that hsa-mir-429 was down-regulated in CCRCC [32]. It is reported that egl-9 family hypoxia inducible factor 3 (EGLN3, also called PHD3) is important for the hypoxic cell cycle to proceed over G1/S checkpoint by reducing the stability of p27 in CCRCC cells [57]. Microarray analysis showed that EGLN3 was significantly up-regulated in CCRCC compared with normal tissue [58]. Furthermore, it has been demonstrated that high EGLN3 expression serves as the marker of poor prognosis in CCRCC patients [59]. In this study, we found that hsa-mir-429 was down-regulated, and the target gene, EGLN3, was up-regulated in CCRCC. Additionally, EGLN3 was significantly enriched in the renal cell carcinoma signal pathway. Our results suggested that epigenetic modification of EGLN3 in terms of hsa-mir-429 regulation was linked to CCRCC progression.
Conclusions
In summary, integrated analysis of the TCGA data led to a pool of differentially expressed miRNAs and DEGs. The epigenetic modifications between miRNAs (such as hsa-mir-215, hsa-mir-199a-1, hsa-mir-204, hsa-mir-501, hsa-mir-2355, hsa-mir-200a, hsa-mir-30c-2 and hsa-mir-429) and target genes including AK1, CDK18, LRG1, GAPDH, SCARB1, HMOX1, SUCLG2, SLC25A15, TOM1L2, PCDHGC3, PROS1, SLC9A9 and EGLN3 may be implicated in the growth of CCRCC. The epigenetic alterations of genes hold promise for becoming biomarkers for the prognosis of CCRCC. However, there is a limitation to our study. The sample size in the normal controls was small in the TCGA dataset. Larger numbers of normal controls that match the solid tumor are needed for further research.
Footnotes
Acknowledgments
This work was funded by “The molecular mechanism study of microRNAs in the development of Clear cell renal cell carcinoma” (KJ2017A244).
Conflict of interest
None declared.
Abbreviations
Supplementary data
A clear list of the p_value and log2 (Fold_change) normalized for miRNAs
miRNAs
log2(Fold_change)
p_value
hsa-mir-2355
1.630849451
1E-16
hsa-mir-30c-2
1.00172441
1E-16
hsa-mir-204
1.071030601
1E-16
hsa-mir-200a
1.119397958
1E-16
hsa-mir-501
1.201711431
1E-16
hsa-mir-199a-1
1.283070226
1E-16
hsa-mir-429
1.816832419
1E-16
hsa-mir-215
1.081785581
1.38E-09