
Abstract
BACKGROUND AND OBJECTIVE:
To monitor therapies targeted to epidermal growth factor receptors (EGFR) in non-small cell lung cancer (NSCLC), we investigated Peroxiredoxin 6 (PRDX6) as a biomarker of response to anti-EGFR agents.
METHODS:
We studied cells that are sensitive (H3255, HCC827) or resistant (H1975, H460) to gefitinib. PRDX6 was examined with either gefitinib or vehicle treatment using enzyme-linked immunosorbent assays. We created xenograft models from one sensitive (HCC827) and one resistant cell line (H1975) and monitored serum PRDX6 levels during treatment.
RESULTS:
PRDX6 levels in cell media from sensitive cell lines increased significantly after gefitinib treatment vs. vehicle, whereas there was no significant difference for resistant lines. PRDX6 accumulation over time correlated positively with gefitinib sensitivity. Serum PRDX6 levels in gefitinib-sensitive xenograft models increased markedly during the first 24 hours of treatment and then decreased dramatically during the following 48 hours. Differences in serum PRDX6 levels between vehicle and gefitinib-treated animals could not be explained by differences in tumor burden.
CONCLUSIONS:
Our results show that changes in serum PRDX6 during the course of gefitinib treatment of xenograft models provide insight into tumor response and such an approach offers several advantages over imaging-based strategies for monitoring response to anti-EGFR agents.
Introduction
Targeted therapies directed against key oncogenic targets offer considerable promise for the treatment of cancer. For many targeted therapies however, it is not yet possible to predict how a given patient will respond to treatment. As a result, oncologists must monitor response to therapy, such that patients who do not respond can quickly be switched to an alternative treatment regimen. If a patient does respond, a second problem then arises – how best to detect the onset of resistance as early as possible during the course of treatment. Such “early resistance detection” is an important clinical problem, and one that has been relatively unexplored to date [3]. In this regard, the use of anti-EGFR therapeutics in non-small cell lung cancer (NSCLC) illustrates the challenges facing oncologists in managing patients who will inevitably acquire resistance to treatment.
NSCLC patients with specific mutations in the EGFR domain often show a significant response [4] to the anti-EGFR tyrosine kinase inhibitors (TKIs) gefitinib (Iressa) and erlotinib (Tarceva). It is estimated that over 70% of NSCLC patients with EGFR-mutant tumors show a decrease in tumor burden following treatment with either of the aforementioned TKIs [5, 6]. However, lung tumors in all patients treated with these agents eventually acquire resistance to this form of therapy [6, 7], with a median time to treatment failure of ten months [4]. Once therapeutic resistance has developed, it is essential that the treatment regimen be re-evaluated as soon as possible. This may consist of switching the patient to a different therapy or stopping treatment with the anti-EGFR TKI for a period of time in the hope of re-sensitizing the tumor to the original therapy.
Presently, the dominant approach to therapy monitoring in the clinic is based on the use of serial morphological imaging during treatment. In the case of NSCLC patients receiving anti-EGFR therapy, computed tomography (CT) scans are typically performed every two months. Despite the widespread use of imaging to monitor treatment response, it suffers from a number of serious drawbacks that ultimately limit its effectiveness. Specifically, imaging scans are time-intensive, relatively costly, and in the case of CT expose the patient to ionizing radiation. Furthermore, the molecular changes that drive therapeutic response and the development of resistance may occur sometime before their effects are apparent on morphological imaging (using, for example, the standard RECIST criteria [8]).
In contrast to in vivo imaging approaches, in vitro strategies based on blood biomarkers offer the potential to serve as effective tools for both short-term and long-term therapy monitoring (see Fig. S1). Blood samples can be taken regularly from patients during the course of treatment with relative ease, at minimal cost, and without exposing the patient to any significant risk. In addition, these samples can be analyzed quickly and inexpensively for multiple biomarkers using standard proteomic assays. Here, we present a blood biomarker strategy for monitoring response to anti-EGFR therapy. In particular, we show that changes in serum levels of the peroxiredoxin family member PRDX6 during the course of gefitinib therapy discriminate between gefitinib-sensitive and gefitinib-resistant tumors. Our approach makes use of serial blood sampling from xenograft mouse models together with enzyme-linked immunosorbent assays (ELISAs) to quantify proteomic changes in serum. Our results illustrate the promise of this approach for monitoring of response to anti-EGFR therapy in cancer.
Materials and methods
Cell lines and reagents
Human cancer cell lines H3255, HCC827, H460, H1975 and A431 were obtained from American Type Culture Collection (ATCC, Manassas, VA). Each cell line was passaged in culture for several generations and then aliquoted into multiple vials and frozen at
H3255, HCC827, H460 and H1975 cells were grown in RPMI medium 1640 with HEPES buffer, L-glutamine (GIBCO, Invitrogen; Cat. No. 22400-089), 1 mM sodium pyruvate (GIBCO, Invitrogen; Cat. No. 11360-070), 10% FBS and 1% penicillin/ streptomycin. A431 cells were grown in Dulbecco’s Modified Eagle’s Medium with high glucose, sodium pyruvate, 10% FBS and 1% penicillin/streptomycin.
Cell culture experiments
H3255, HCC827, H1975 and H460 cells were cultured in complete media and plated onto 100 mm tissue culture dishes (BD Biosciences, Durham, NC) at approximately 1.5 million cells per plate (10 ml media volume). For each cell line, 36 plates were seeded. Cells were grown to 80% confluence then old media was aspirated, the cell layer carefully washed with PBS, and 10 ml of low serum media (0.1% FBS) supplemented with 10 nM EGF (GIBCO, Invitrogen; Cat. No. PHG0311L) was added to each plate. Half of the plates were then treated with 100 nM gefitinib (Biaffin GmbH & Co. KG; Cat. No. PKI-GFTB-010) dissolved in DMSO, while the other half were treated with vehicle (0.01% DMSO). Media from three plates from each treatment group were collected at 0, 4, 8, 12, 24 and 32 hours post-treatment and stored at
Determination of IC
values
To assess the degree in inhibition of proliferation to increasing concentrations of gefitinib, an MTT-based proliferation assay was employed. (CellTiter 96
Xenograft experiments
All animal studies were approved by Stanford University Administrative Panel on Laboratory Animal Care. For all tumor inoculations, cells were suspended in an equal mixture of media and growth-factor reduced Matrigel (BD Biosciences, Bedford, MA; Cat. No. 356231) with 100
For the HCC827/H1975 study, thirty 8–10 week old female athymic female mice were inoculated in the thymus with 3–4 million cells, with half the mice inoculated with HCC827 cells and half with H1975 cells. Once the average tumor volume reached approximately 240 mm
For the A431 xenograft study, twenty-five 8 to 10-week old female nude athymic mice (Charles River Laboratories, Wilmington, MA) were inoculated in the right flank above the hind limb with A431 cells. The A431 cell line used for the xenograft study was obtained as a gift from Dr. Anjali Jain at Cedars-Sinai Medical Center and established as previously described [9]. Once the average tumor volume reached approximately 400 mm
Blood sampling
Blood samples were collected prior to sacrifice by submandibular bleed using 5 mm Goldenrod Animal Lancets (Medipoint Inc., Mineola, NY). At the time of sacrifice, a final sample was collected by cardiac puncture. Blood samples were collected in 1.1 ml screw cap micro tubes (Sarstedt Inc., Newton, NC; Cat. No. 41.1378.005). Each tube was tapped and then inverted 10 times to ensure adequate mixing of the blood, before clotting 1 hour at 20
Cell media and lysate processing
Cell media was centrifuged for 5 minutes at 1000 rpm and supernatant collected. 10 ml of cell media was concentrated to 600
Tumor processing
Resected tumors were added to a 10 cm plate containing approximately 10 ml of serum-free and phenol-free RPMI 1640. Excised tumor was cut into pieces (
Enzyme-linked immunosorbent assays
Maxisorp F96 96-well plates (Nunc, Thermo Fisher Scientific; Cat. No. 442404) were coated with 100
Development of PRDX6 ELISA
Commercially available anti-PRDX6 antibodies were initially tested in a direct ELISA with PRDX6. The pair of sc-59671 (Santa Cruz): ab73350 (AbCAM) yielded the highest signal while maintaining a low background reading. A concentration of 1
Statistical analysis
Statistical analysis was performed using GraphPad Prism (GraphPad Software, La Jolla, CA). For all statistical tests, a two-tailed unpaired Student’s t test was used to determine the significance of changes between vehicle and gefitinib-treated groups at specific time points. To assess the significance of changes in serum PRDX6 levels for xenograft studies, we compared PRDX6 changes from baseline after gefitinib treatment with the corresponding changes from baseline after vehicle treatment [10]. To assess the correlation between tumor volume and PRDX6 levels we used Pearson’s R
Computational network analysis
Network analysis was performed using MetaCore
Results
Selection of candidate blood biomarkers of gefitinib response
To select candidate blood biomarkers of gefitinib response we mined proteomic data from a pilot cell culture study via quantitative mass spectrometry [1]. The data consisted of differential proteomic changes in the whole cell lysate, at the cell surface, and within the cell secretome, between gefitinib-treated and vehicle-treated A431 cells at 16 hours post-treatment [11]. A431 is an epidermoid cancer cell line that exhibits very high expression of wild-type EGFR [11] and is considered a model system for the study of EGFR.
We focused on four proteins that showed at least a 1.4-fold increase in abundance in response to gefitinib (in either the cell lysate, at the cell surface, or within the cell secretome of A431 cells), whose response to gefitinib had previously been verified by Western blot [1], and for which we were able successfully to develop an ELISA: peroxiredoxin 6 (PRDX6), epithelial cell adhesion molecule (EpCAM), tumor-associated calcium signal transducer 2 (TACSTD2 or TROP2) and claudin 1 (CLDN1).
We selected PRDX6 as we were able to detect PRDX6 consistently by ELISA with as little as 40
PRDX6 changes in cell culture during gefitinib therapy
We first studied PRDX6 changes in cell culture following gefitinib treatment of the NSCLC cell lines H3255, HCC827, H1975 and H460 (Fig. 1). H3255 and HCC827 are highly sensitive to gefitinib as a result of activating mutations in their EGFR domains (the L858R point mutation [12], and a deletion in exon 19 of the EGFR domain [13], respectively). H1975 is characterized by the double mutation L858R/T790M in the EGFR kinase domain that confers resistance to reversible EGFR TKIs [14, 15]. H460 is an EGFR wild type cell line that is resistant to gefitinib treatment [13].
Changes in PRDX6 for four different NSCLC cell lines following treatment with either vehicle or gefitinib over the course of 32 hours. Each row shows PRDX6 levels (normalized to total protein) in cell lysate (left column) and cell media (right column) for (A) H3255 cells, (B) HCC827 cells, (C) H1975 cells and (D) H460 cells. Cell lines are arranged in order of decreasing sensitivity to gefitinib (i.e. H3255 – most sensitive, H460 – least sensitive).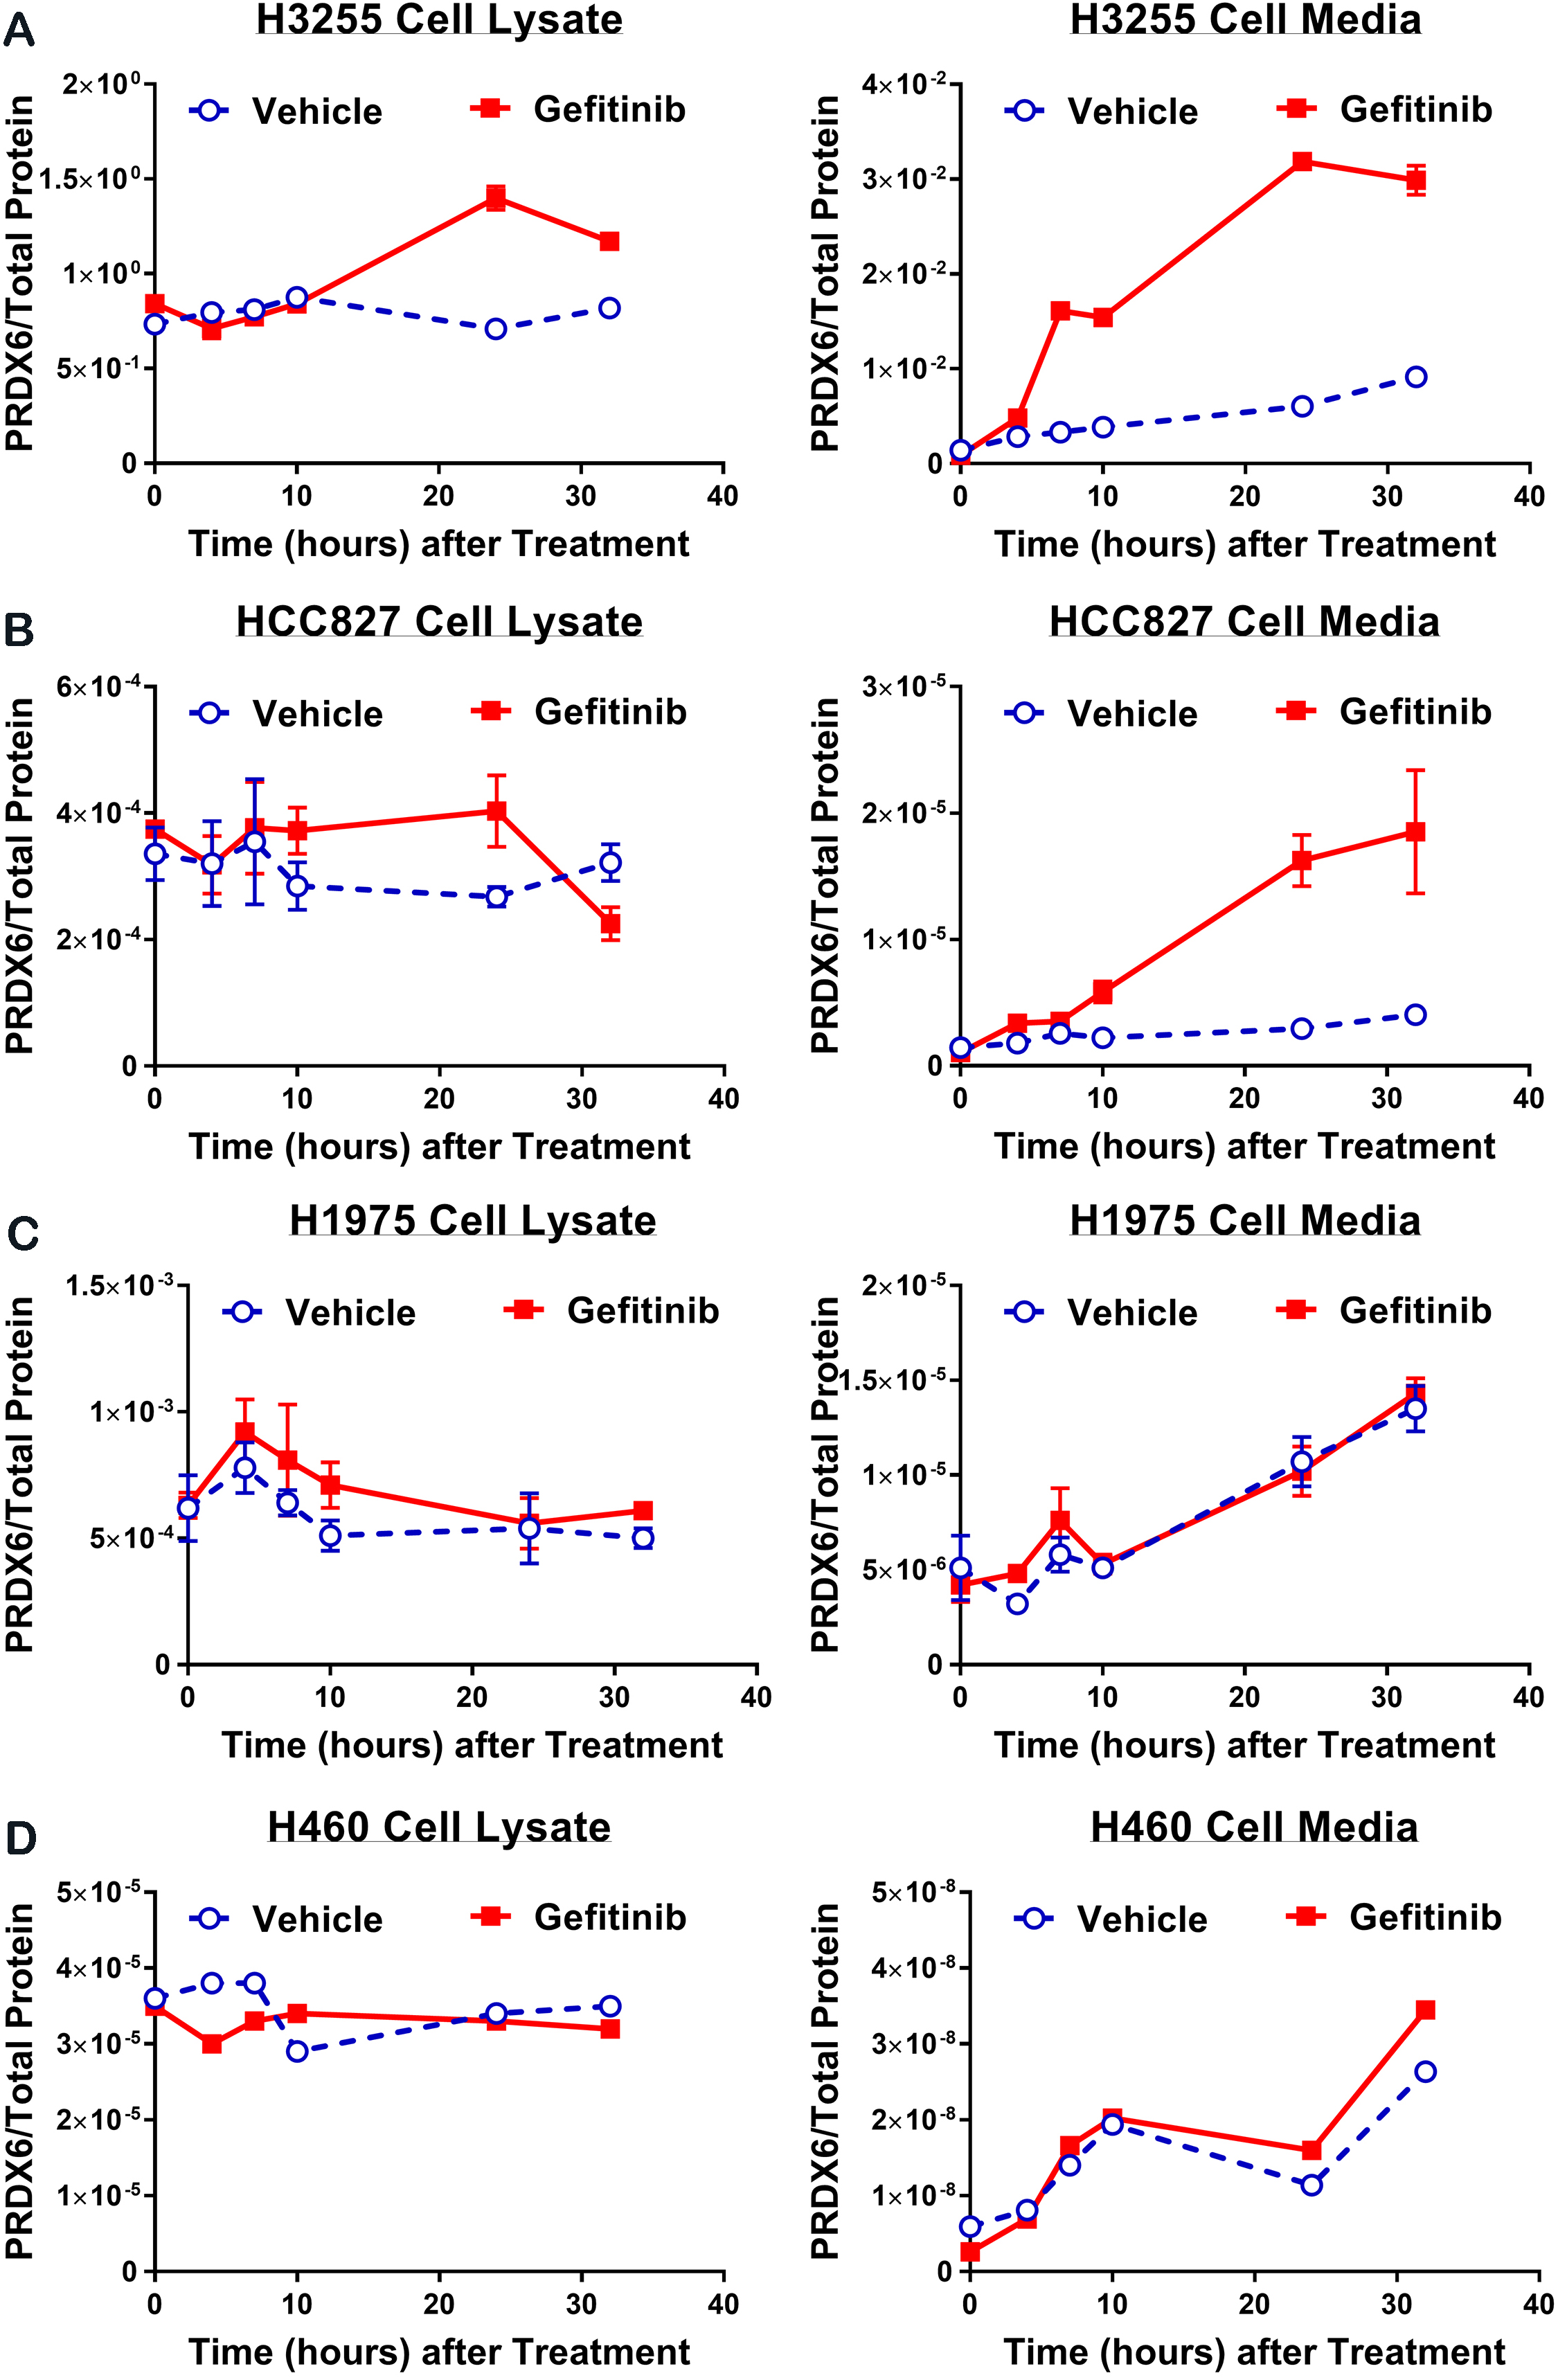
H3255, HCC827, H1975 and H460 cells were plated onto 100 mm tissue culture plates, and treated with either gefitinib (100 nM) or vehicle (0.01% DMSO). For each treatment group, plates were collected at 0, 4, 8, 12, 24 and 32 hours after the start of treatment, and PRDX6 protein levels in both cell media and cell lysate measured by sandwich ELISA. The PRDX6 ELISA antibody pair, antibody concentration and incubation time were optimized to achieve the highest sensitivity, reproducibility and robustness in the presence of serum (see Methods).
For H3255 cells (Fig. 1A), PRDX6 levels in cell lysate of gefitinib treated cells exceeded those of vehicle-treated cells at 24 and 32 hours, with the peak concentration of PRDX6 occurring at 24 hours. PRDX6 levels in H3255 cell media were significantly higher for gefitinib treated cells compared with vehicle treated cells after 12 hours of treatment and for all subsequent time points. A similar pattern of response to gefitinib was observed with HCC827 cell lysate and cell media (Fig. 1B). Notably, PRDX6 levels in both H3255 and HCC827 cell media increased markedly over the course of gefitinib therapy and were approximately four fold greater in gefitinib treated cells compared with vehicle treated by 32 hours. In contrast, for H1975 and H460 cells, there was no significant difference in the gefitinib and vehicle PRDX6 time courses for either cell lysate or cell media (Fig. 1C and D).
Relationship between gefitinib induced change in PRDX6 and sensitivity to gefitinib as measured by IC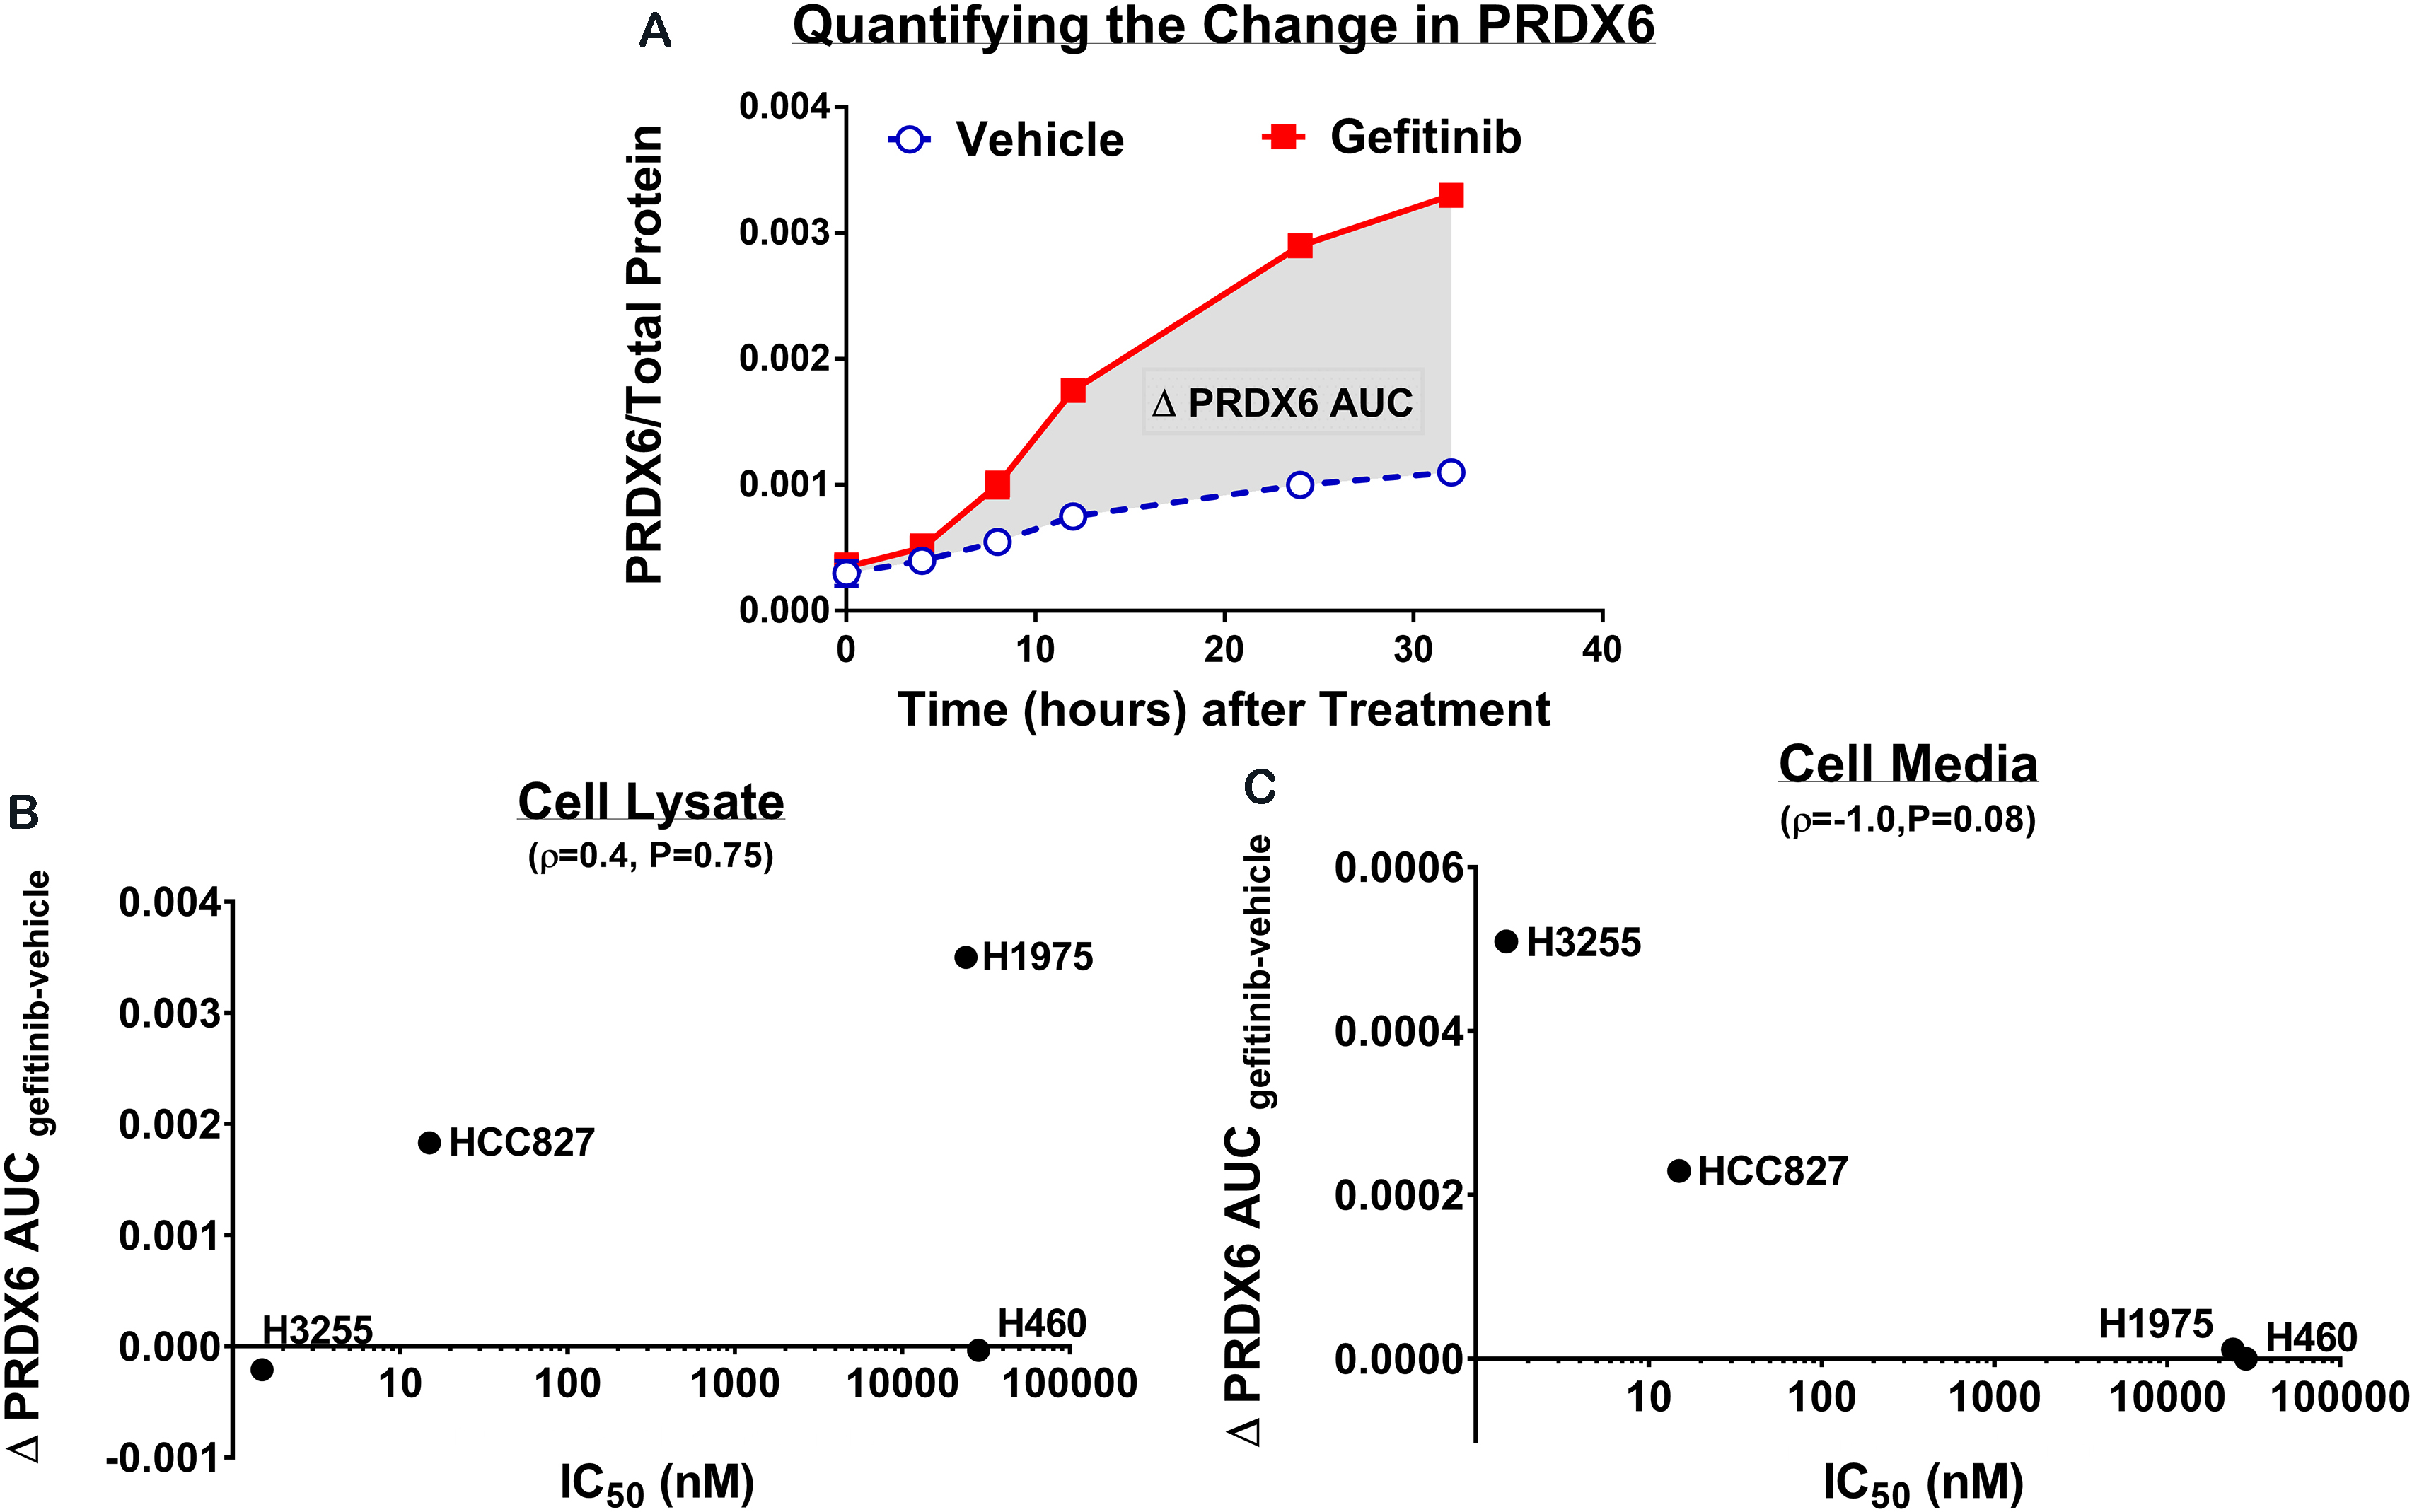
To quantify the overall change in PRDX6 due to gefitinib, we computed the difference in the area under the PRDX6 concentration curves (
To test if the gefitinib-induced changes in PRDX6 that we observed in cell culture could also be detected in vivo, we performed a subcutaneous xenograft study using the HCC827 and H1975 cell lines in mice (see Fig. S2). HCC827 xenografts treated with gefitinib showed a highly significant response to the drug (Fig. 3A). The difference in tumor volumes between the vehicle-treated and gefitinib-treated HCC827 xenografts was statistically significant from Day 4 (
Changes in serum PRDX6 levels for HCC827 and H1975 xenografts treated with either vehicle or gefitinib. (A) Tumor growth curves (treatment initiated on day 1) for HCC827 and H1975 xenografts, respectively. (B) Serum PRDX6 levels in naïve (pre-inoculation), Day 0 (pre-treatment), Day 4 (post-treatment) and Day 15 (post-treatment) blood samples. (C) Serum PRDX6 levels normalized to tumor volume. All error bars represent one standard error of the mean. Note – there was no statistically significant difference at any time point in the mean change from baseline in serum PRDX6 between vehicle and gefitinib treated H1975 xenografts, both for raw PRDX6 levels and PRDX6 levels normalized to tumor volume. Key: ns – not significant, 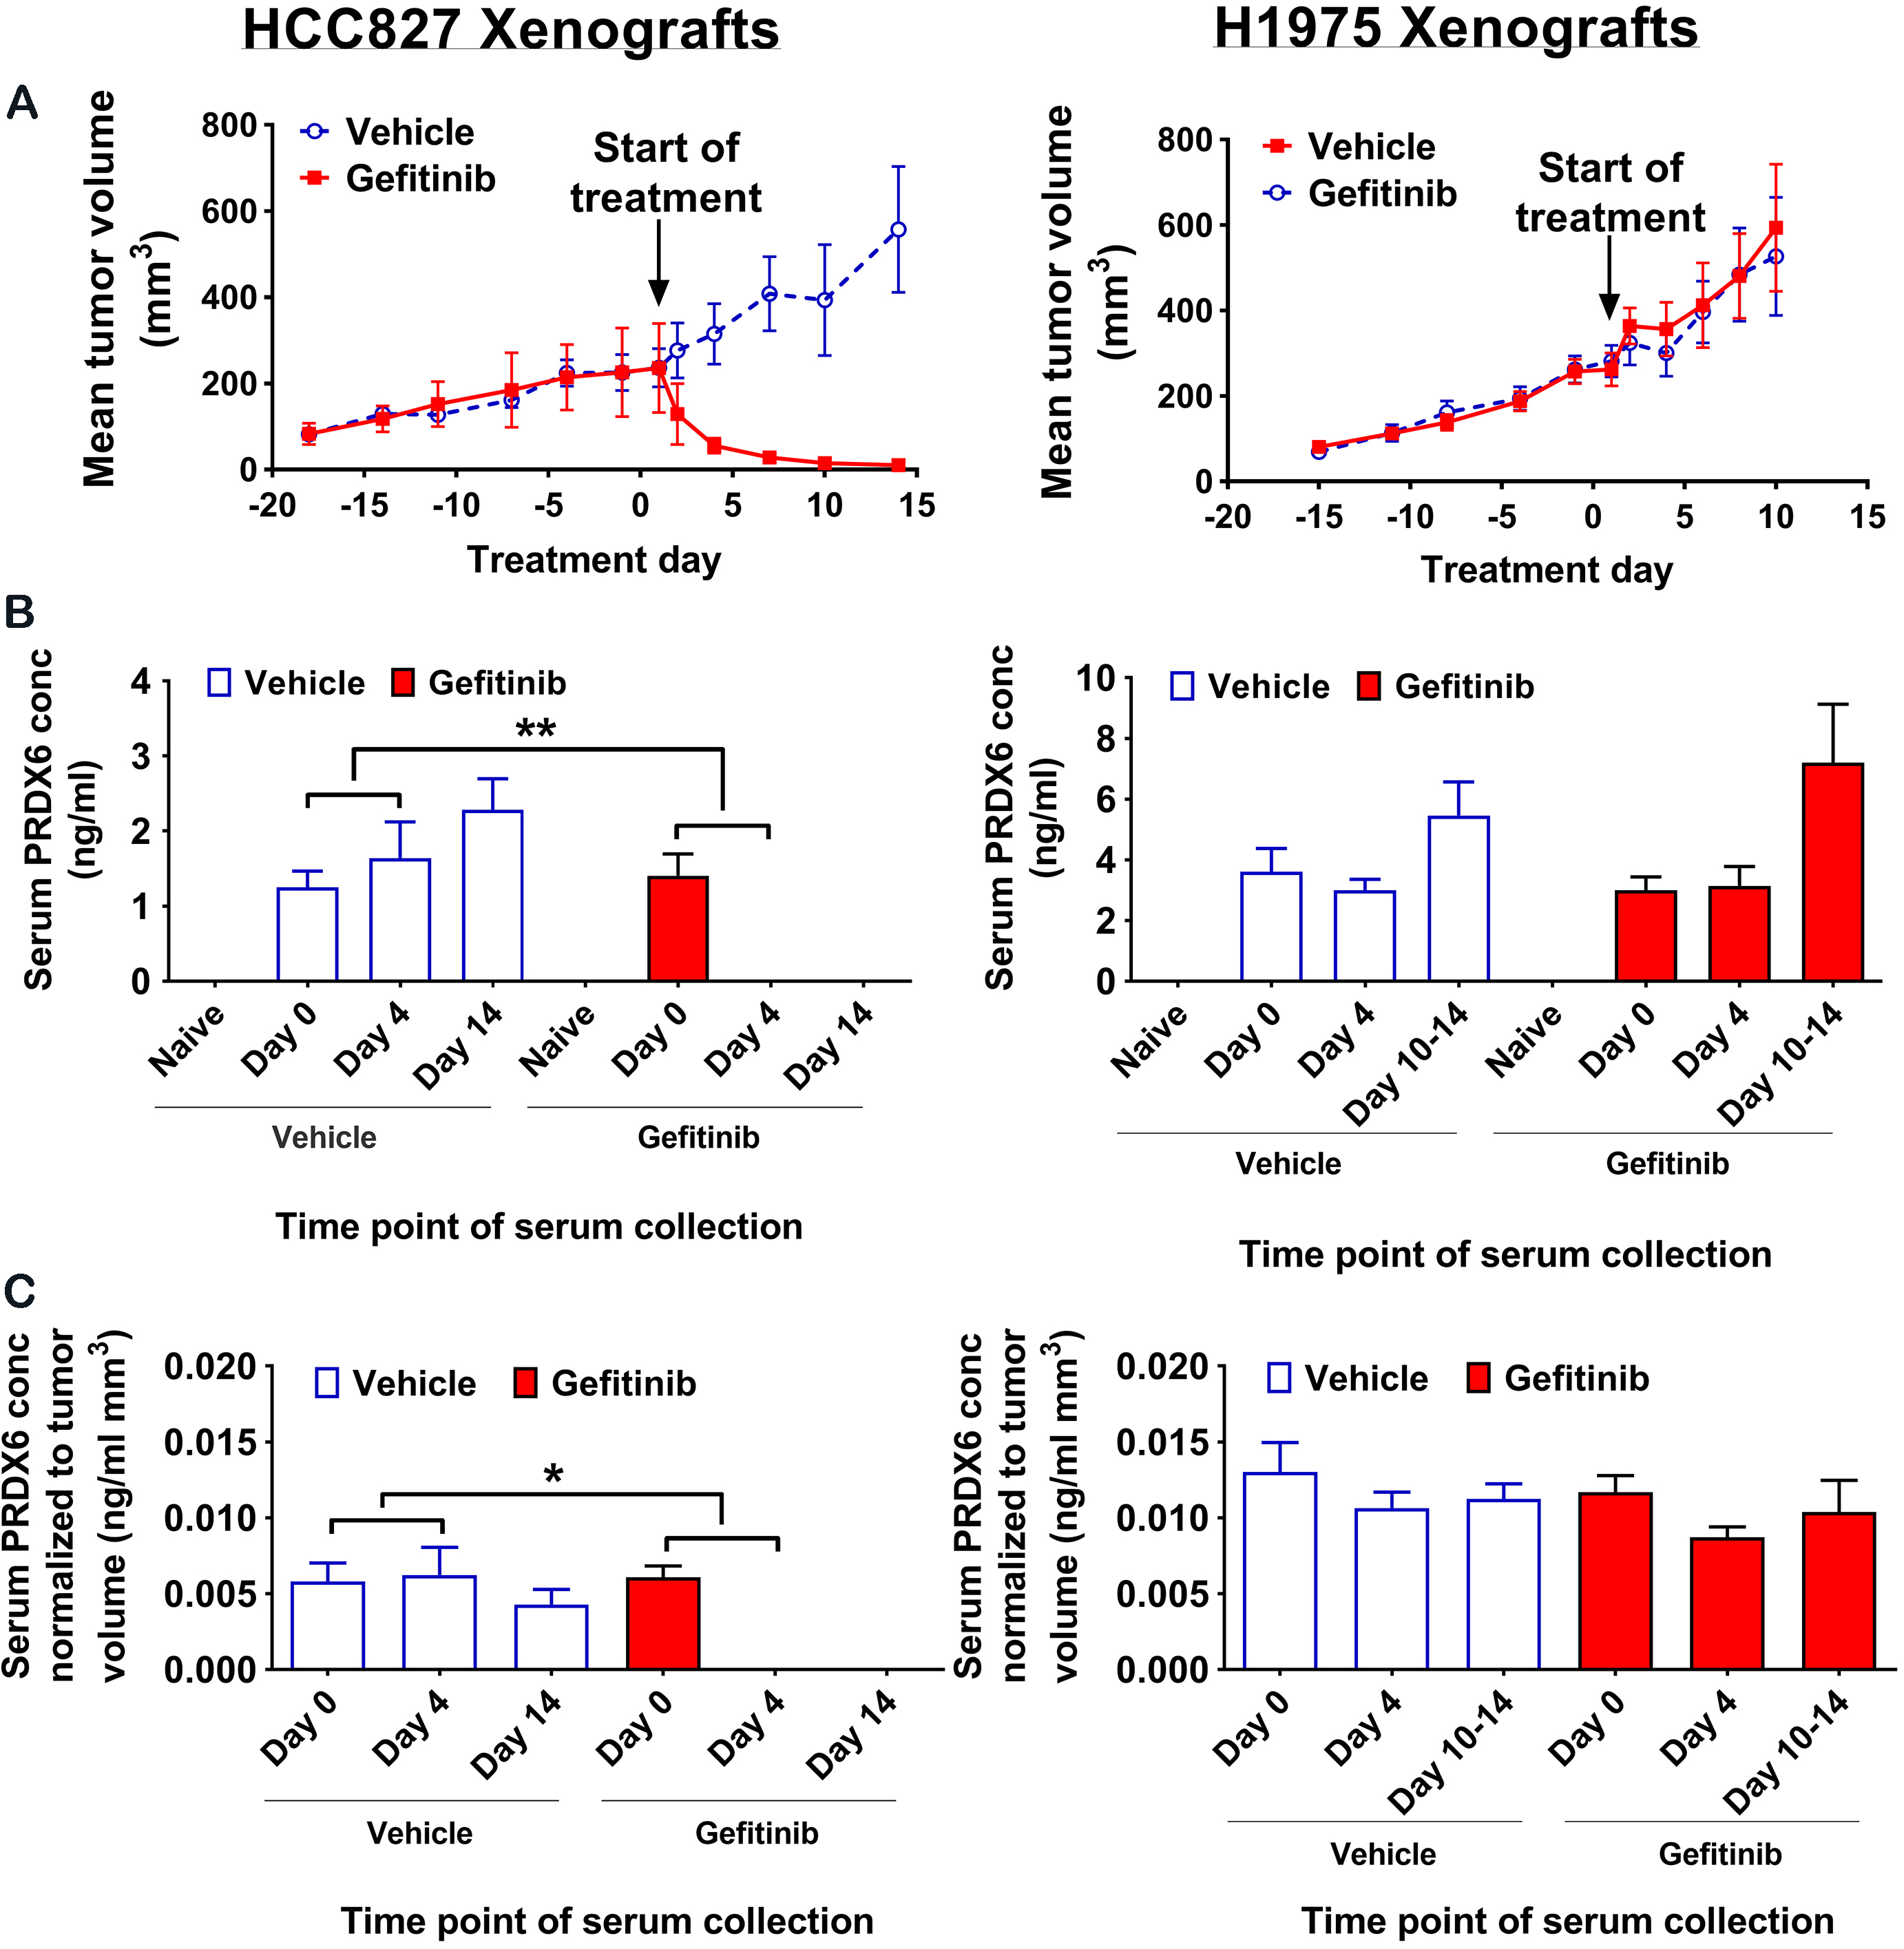
Early changes in serum PRDX6 levels for HCC827 xenografts treated with either vehicle or gefitinib. (A) Mean serum PRDX6 levels from naïve (all mice), pre-treatment (all mice) and multiple early post-treatment blood samples (groups of 5 mice). (B) Mean change from baseline in serum PRDX6 levels for paired pre- and post-treatment samples. (C) Mean change from baseline in tumor volume for vehicle and gefitinib-treated animals. (D) Mean change from baseline in serum PRDX6 levels normalized to tumor volume for paired pre- and post-treatment samples. All error bars represent one standard error of the mean.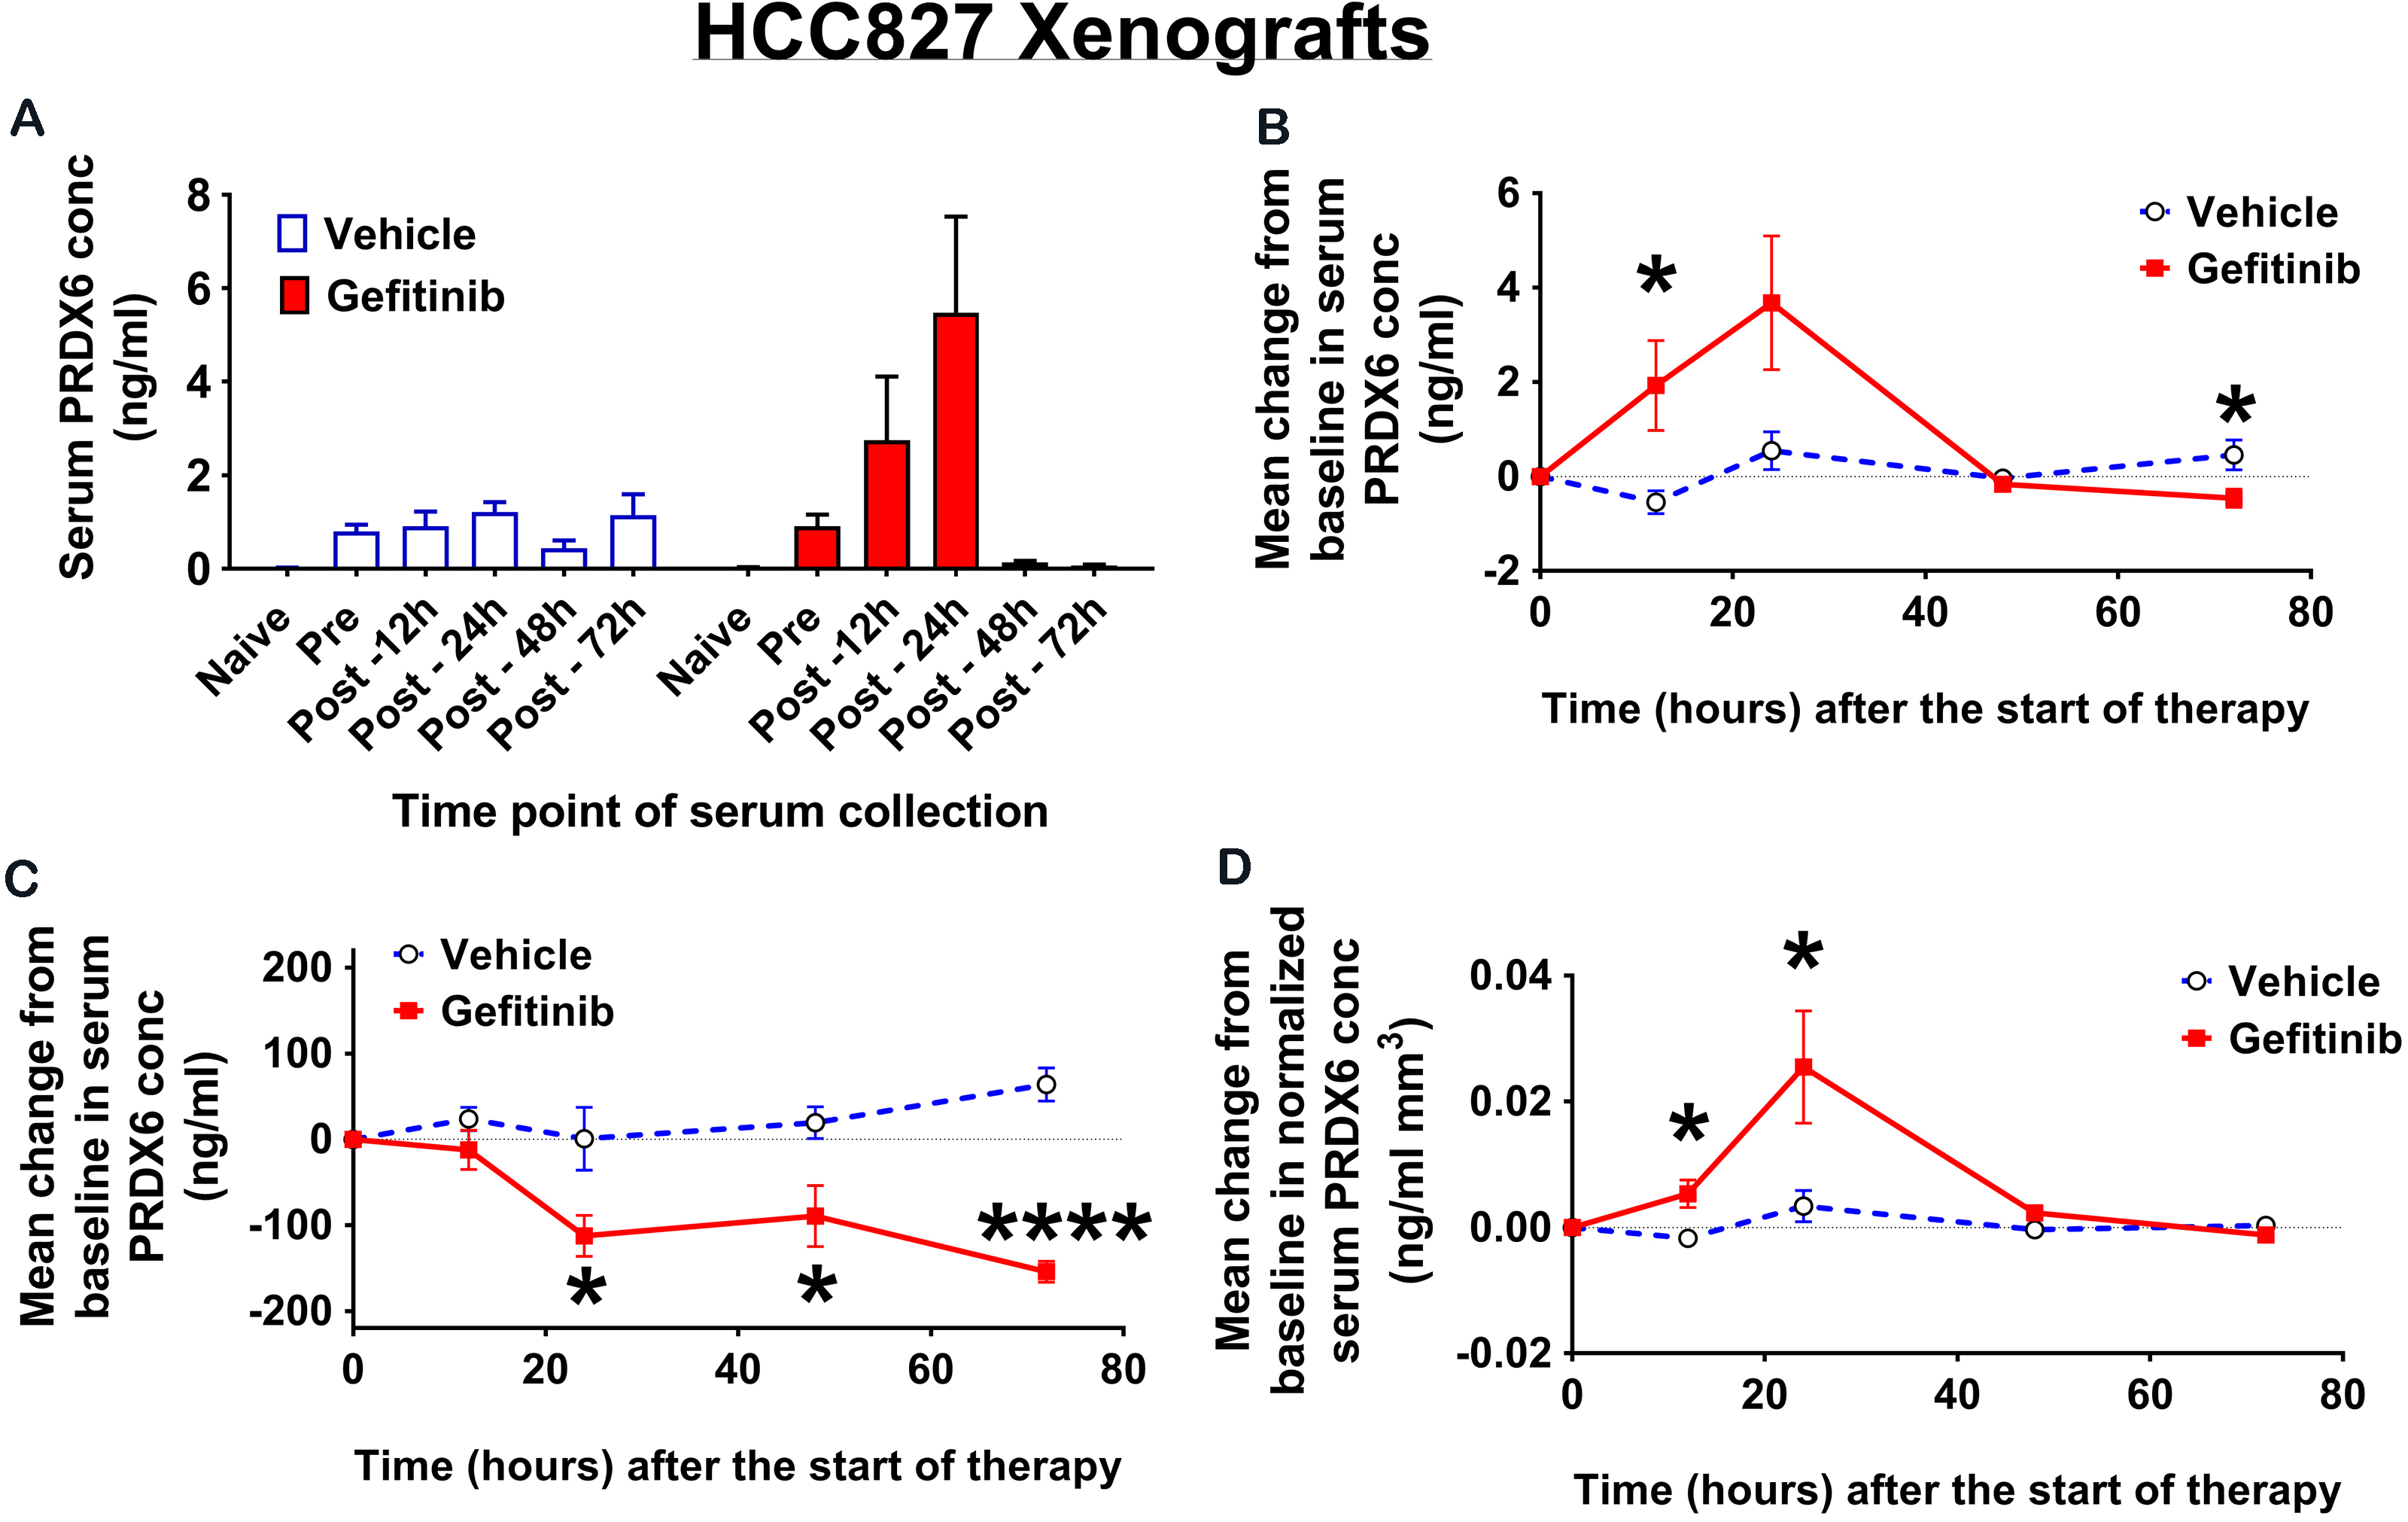
Next, we analyzed serum levels of PRDX6 from blood samples collected prior to tumor inoculation (naïve), immediately before the start of treatment (Day 0), during treatment (Day 4) and immediately prior to sacrifice (Days 10–14). Naïve serum samples from all mice showed only trace levels of PRDX6 that were indistinguishable from background on the ELISA for the majority of samples (Fig. 3B). For HCC827 (sensitive) xenografts, mean serum PRDX6 levels increased after treatment with vehicle and decreased dramatically after treatment with gefitinib. The difference in the mean change from baseline in serum PRDX6 between vehicle and gefitinib-treated animals was statistically significant on both Day 4 (
The above findings are consistent with studies from Kani et al. [1] who showed that mice with gefitinib-sensitive A431 xenografts showed responsiveness to drug treatment as manifested in a decrease for tumor load along with appearance of PRDX6 in the sera. But mice with A431-AZD xenografts (i.e. gefitinib-resistant A431 sublines derived from parentals that endured prolonged exposure to gefitinib) displayed no change in serum PRDX6 when challenged with gefitinib. The findings of Kani et al. [1] would suggest that PRDX6 can also serve as a biomarker to assess for onset of resistance. In addition, our research suggests that optimal utilization of circulating PRDX6 as a biomarker for response and/or for resistance to drug relies upon multiple samplings and therefore several time points after feeding of the therapeutic.
To evaluate whether the observed difference in serum PRDX6 changes between vehicle and gefitinib-treated mice could be explained by the difference in tumor burden, we normalized serum PRDX6 levels to tumor volume and compared normalized levels for both HCC827 and H1975 xenografts (Fig. 3C). For HCC827 (sensitive) xenografts, the difference in the mean change from baseline in serum PRDX6 normalized to tumor volume was significant on both Day 4 (
To gain insight into the time course of serum PRDX6 levels following the onset of gefitinib therapy and to better understand how PRDX6 changes in vivo relate to those in cell culture, we analyzed serum from HCC827 xenografts collected at multiple early time points following the start of treatment. Specifically, we collected blood samples by submandibular bleed from all mice prior to tumor inoculation and immediately before the start of treatment with either gefitinib or vehicle, and then by cardiac puncture from groups of 5 mice from each treatment arm at 12, 24, 48 and 72 hours after the start of treatment.
For the gefitinib-treated mice, mean serum PRDX6 levels increased markedly after the start of treatment, reaching a maximum concentration at 24 hours post-treatment, before returning to baseline levels at 48 hours and continuing to decrease up to 72 hours post-treatment (Fig. 4A). The increase in mean serum PRDX6 for gefitinib-treated animals relative to vehicle-treated animals (Fig. 4B) was statistically significant at 12 hours (
Intratumoral PRDX6 changes during gefitinib therapy
To understand the effect of gefitinib on intratumoral PRDX6, we assayed for levels of PRDX6 in tumor lysates derived from HCC827 xenografts at 12, 24 and 72 hours following treatment with either vehicle or gefitinib (Fig. S3). We found no statistically significant difference in tumor PRDX6 between vehicle- and gefitinib-treated xenografts at either 12 (
Discussion
Oncologists treating patients with targeted agents require effective techniques to assess initial response to therapy (or lack thereof), as well as to detect the potential onset of acquired resistance at a later stage. Therapy monitoring strategies based on the use of blood biomarkers offer a number of compelling advantages including ease of sample collection, absence of ionizing radiation and low cost of sample analysis. We report here a novel blood biomarker of response to anti-EGFR therapy. Our results illustrate that changes in serum levels of PRDX6 as early as 12 hours after the start of gefitinib treatment can differentiate between gefitinib-sensitive and gefitinib-resistant tumors in NSCLC xenograft models.
Our cell culture studies showed that for the gefitinib-sensitive cell lines H3255 and HCC827, PRDX6 levels in cell media were significantly increased as early as 12 hours after treatment with gefitinib compared with the corresponding levels after vehicle treatment (Fig. 1B and D). These results were then validated in vivo using HCC827 xenograft models, for which mean serum PRDX6 levels in gefitinib-treated animals were significantly higher at 12 hours after the start of treatment compared with their vehicle-treated counterparts (Fig. 4A and B). Interestingly, serum PRDX6 levels had dropped dramatically by 4 days after the start of gefitinib treatment, and were no longer detectable by ELISA at this point (Fig. 3C). A critical issue therefore in translating our findings to the clinic is to determine how the dynamics of serum PRDX6 levels that we observed in gefitinib-sensitive xenograft mouse models relate to those in patients showing a short-term response to anti-EGFR therapy. Understanding the “temporal signature” of PRDX6 changes in human NSCLC patients receiving anti-EGFR therapy is a major focus of our current research efforts.
At present the manner by which PRDX6 shedding is an indicator of NSCLC’s response to gefitinib is unknown. However we can offer three scenarios: a) gefitinib treatment alters cellular expression of PRDX6, b) gefitinib treatment promotes the extrusion of exosomes that house PRDX6 or c) the release of PRDX6 caused by the death and lysis of NSCLC cells exposed to gefitinib. We think that all of the scenarios are realized depending on which cellular compartment we are studying, the dosage of the drug, the length of drug exposure and the mutational status (particularly EGFR) of the studied cell lines.
A key question for a biomarker of therapeutic response is whether changes in biomarker levels after therapy are predominantly a function of changes in tumor burden, or from therapy-induced molecular changes preceding reduction in tumor burden. Our results for HCC827 xenografts show that after 14 days of gefitinib treatment there is a statistically significant decrease in serum PRDX6 levels normalized to gross tumor volume, compared with vehicle-treated animals (Fig. 3A–C). To understand how well this finding generalizes to tumors derived from other cancer cell lines that are sensitive to gefitinib, we assayed for serum PRDX6 levels during gefitinib therapy in xenografts derived from the A431 cell line (see Fig. S4). Our results with A431 xenografts parallel those with HCC827 xenografts – namely after 14 days of gefitinib therapy there is a statistically significant decrease in serum PRDX6, both with and without normalization to tumor volume (Fig. S5). Thus, the decrease we observe in serum PRDX6 levels during gefitinib therapy is most likely a result of changes in oncogenic signaling that directly impact downstream PRDX6 levels.
The fact that tumor volume plateaued with drug treatment for A431 but PRDX6 still decreased suggests that, in some situations, circulating PRDX6 may be dissociated with the therapeutic effectiveness of gefitinib. We think that an explanation may lie in the mutational status of A431 and its sub-populations [2]. For instance A431 may possess resistant subpopulations and thus gefitinib may be effective in killing sensitive cohorts (thus accounting for the shed serum PRDX6 and its eventual decline) but the resistant population is of sufficient proportion such that the culling of the sensitive subpopulation may be undetected in the tumor volume measurements. In the remaining population, gefitinib may even be cytostatic instead of cytotoxic [2]. Thus, complete assessment of NSCLC tumors may involve coupling the measurement of circulating biomarker panels (of which PRDX6 is one) along with the determination of the mutational and expression status of oncogenic cytokine receptors (for example, EGFR).
How does inhibition of EGFR signaling lead to subsequent changes in PRDX6 levels in gefitinib-sensitive cell lines? To gain insight, we used computational network analysis in conjunction with a curated knowledge base of protein-protein interactions (MetaCore
Although the connection between temporal changes in serum PRDX6 and response to anti-EGFR therapy has not previously been reported, the role of peroxiredoxins in lung cancer has been studied previously. Tissue levels of peroxiredoxins 1, 2, 4 and 6 were highly elevated in a set of 103 human lung cancer samples, and PRDX1 and PRDX4 were found to be significantly higher in tumor compared with nonmalignant tissue in a set of 9 lung tumor samples with paired samples from normal lung [24]. Plasma levels of PRDX1 were strongly correlated with the presence of lung cancer in a set of 222 lung cancer patients, asbestos-exposed patients and healthy tobacco smokers [25]. Furthermore, PRDX6 has been shown to increase the invasiveness and metastatic potential of human lung cancer cells [26].
Our results add to a growing body of literature on circulating protein and nucleic acid biomarkers of EGFR mutant lung cancer. Taguchi et al. developed a classifier of response to anti-EGFR therapy using 8 features derived from matrix-assisted laser desorption ionization (MALDI) mass spectrometry (MS) analysis of pretreatment serum [27]. They showed that on two independent validation cohorts of 67 and 96 patients their classifier was able to identify patients who showed an improved outcome after EGFR TKI therapy. Several authors have investigated the use of PCR-based assays to detect point mutations in the EGFR domain of plasma DNA taken from NSCLC patients [5, 28, 29]. More recently, Newman et al. have demonstrated that deep sequencing can be used to identify cancer specific genetic aberrations in circulating tumor DNA (ctDNA) from NSCLC patients [30]. Using this technology, they were able to detect both the L858R activating mutation as well as the T790M “gatekeeper” mutation (which confers resistance to anti-EGFR TKIs) using plasma from a single patient.
Although our results indicate that PRDX6 shows promise as a blood biomarker of anti-EGFR therapeutic response, its predictive utility may be circumvented by oncogenic drivers that function independently of the EGFR axis. For example, common mechanisms of resistance to EGFR therapy such as MET amplification [31] and PIK3CA mutations [32] may lead to tumor growth without an associated change in serum PRDX6 dynamics. In order to detect non-EGFR driven tumor growth, it would be necessary to monitor additional biomarkers that are sensitive to changes in the relevant oncogenic signaling pathways. In the future, we anticipate that the use of multiple blood biomarkers together with multiplexed assays for highly sensitive biomarker quantification [33] may provide an effective strategy to monitor response to a range of targeted therapies, either as single agents or combination therapies.
Footnotes
Conflict of interest
The authors declare no potential conflicts of interest.
Supplementary data
The supplementary files are available to download from http://dx.doi.org/10.3233/CBM-171149.