Abstract
BACKGROUND:
Understanding the molecular mechanisms is important in development and therapy of endometrioid endometrial adenocarcinoma.
OBJECTIVE:
To identify key genes in endometrioid endometrial adenocarcinoma.
METHODS:
The data of mRNA, miRNA and DNA methylation were downloaded from The Cancer Genome Atlas (TCGA) database and differential analysis was performed. Then, bioinformatic analysis was used to explore the regulatory mechanisms of miRNA and DNA methylation on gene expression. The regulatory network between differentially expressed miRNAs and target genes was established. Finally, the quantitative RT-PCR was applied to validate the bioinformatics results.
RESULTS:
We obtained biological omics data of 381 patients with endometrioid endometrial adenocarcinoma from TCGA data portal. After data processing, up to 2068 DEGs and 69 differentially expressed miRNAs were identified. Prediction and correlation analysis revealed that 175 DEGs that were not only the target genes but also negatively correlated with the screened differentially expressed miRNAs. After the integrated analysis of differentially methylated CpG islands and DEGs, 16 related genes were obtained. The quantitative RT-PCR results were roughly consistent with the bioinformatics analysis.
CONCLUSIONS:
The altered DEGs (ZEB1, ZEB2, TIMP2, TCF4, CYP1B1, PITX1, PITX2, ZNF154 and TSPYL5) may be involved in tumor differentiation of endometrioid endometrial adenocarcinoma and could be used as potential therapeutic targets for the disease.
Introduction
Endometrial carcinoma is a complicated disease and is driven by genetic, epigenetic and environmental factors [1]. It can be classified into a number of distinct histological subtypes. Among which, endometrioid endometrial adenocarcinoma (EEA), serous carcinoma and clear cell endometrial carcinoma was major histological subtypes with distinct natural history, genetic etiology and associated clinical outcome [2]. In addition, endometrioid endometrial cancer can be subdivided into high risk, intermediate risk and low risk. It is worth mentioning that 70% to 80% of newly diagnosed cases of endometrial carcinoma are EEA, which occurs in pre- and post-menopausal women and is usually developed from endometrial hyperplasia [3, 4]. Although the 5-year survival rate of EEA patients is greater than 85% when diagnosed at an early stage, approximately 13–25% of EEA patients (originally thought to have a good outcome) show recurrence and metastasis [5, 6]. Therefore, to improve current status, it requires the researchers understanding the molecular mechanism underlying the development and progression of EEA.
Recently, miRNA expression and DNA methylation are two types of epigenetic regulation, and frequently alters in the development of different cancers. The epigenetic regulation via miRNAs and DNA methylation has brought a new insight into the pathogenesis of various diseases, including endometrial carcinoma. In human endometrium, several studies have determined the expression of large numbers of miRNAs, some of which showed altered expression in endometrial carcinoma [7, 8, 9]. It is pointed out that DNA methylation regulates gene expression by affecting not only proximal promoters but also distal enhancers [1]. The DNA methylation signature facilitates the investigation molecular mechanisms of endometrioid endometrial adenocarcinoma.
Additionally, the Cancer Genome Atlas (TCGA) project includes high throughput analyses such as gene expression profiling, microRNA profiling and genomic DNA methylation profiling along with clinical data of each patient. After omics data was downloaded from TCGA database, profiles of genes, miRNAs, and methylated sites in EEA were identified. Comprehensive analysis of mRNA, miRNA and DNA methylation profiling data of EEA was performed to identify the hub gene under the epigenetic regulation in EEA. Finally, quantitative RT-PCR (qRT-PCR) was utilized to validate the bioinformatics analysis. Fortunately, nine candidate genes were identified, and may be used for the potential treatment of EEA.
Materials and methods
Datasets
In this study, the mRNA expression (IlluminaHiSeq_ RNASeqV2), miRNA expression (IlluminaHiSeq_ miRNASeq) and DNA methylation data (Human- Methylation450) of all 381 patients with EEA were downloaded from TCGA data portal (
Identification of DEGs and differentially expressed miRNAs
The DEGs and differentially expressed miRNAs were calculated via R-bioconductor package DESeq2 [10] based on the read count of each sample. The false discovery rate (FDR) was obtained from multiple comparisons using the Benjamini and Hochberg method [11]. DEGs and differentially expressed miRNAs were identified using the cutoffs: FDR
The data platforms of EEA in TCGA
The data platforms of EEA in TCGA
Pairwise Pearson correlation coefficients between differentially expressed miRNAs and DEGs was calculated, and p
The top ten up-regulated and down-regulated DEGs
The top ten up-regulated and down-regulated DEGs
FC: fold change; FDR: false discovery rate.
The differentially expressed miRNAs
FC: fold change; FDR: false discovery rate.
The regulatory network of down-regulated miRNA and their target genes in EEA. The diamonds and ellipses represent the miRNAs and target genes, respectively. The red and green colors represent up-regulation and down-regulation, respectively.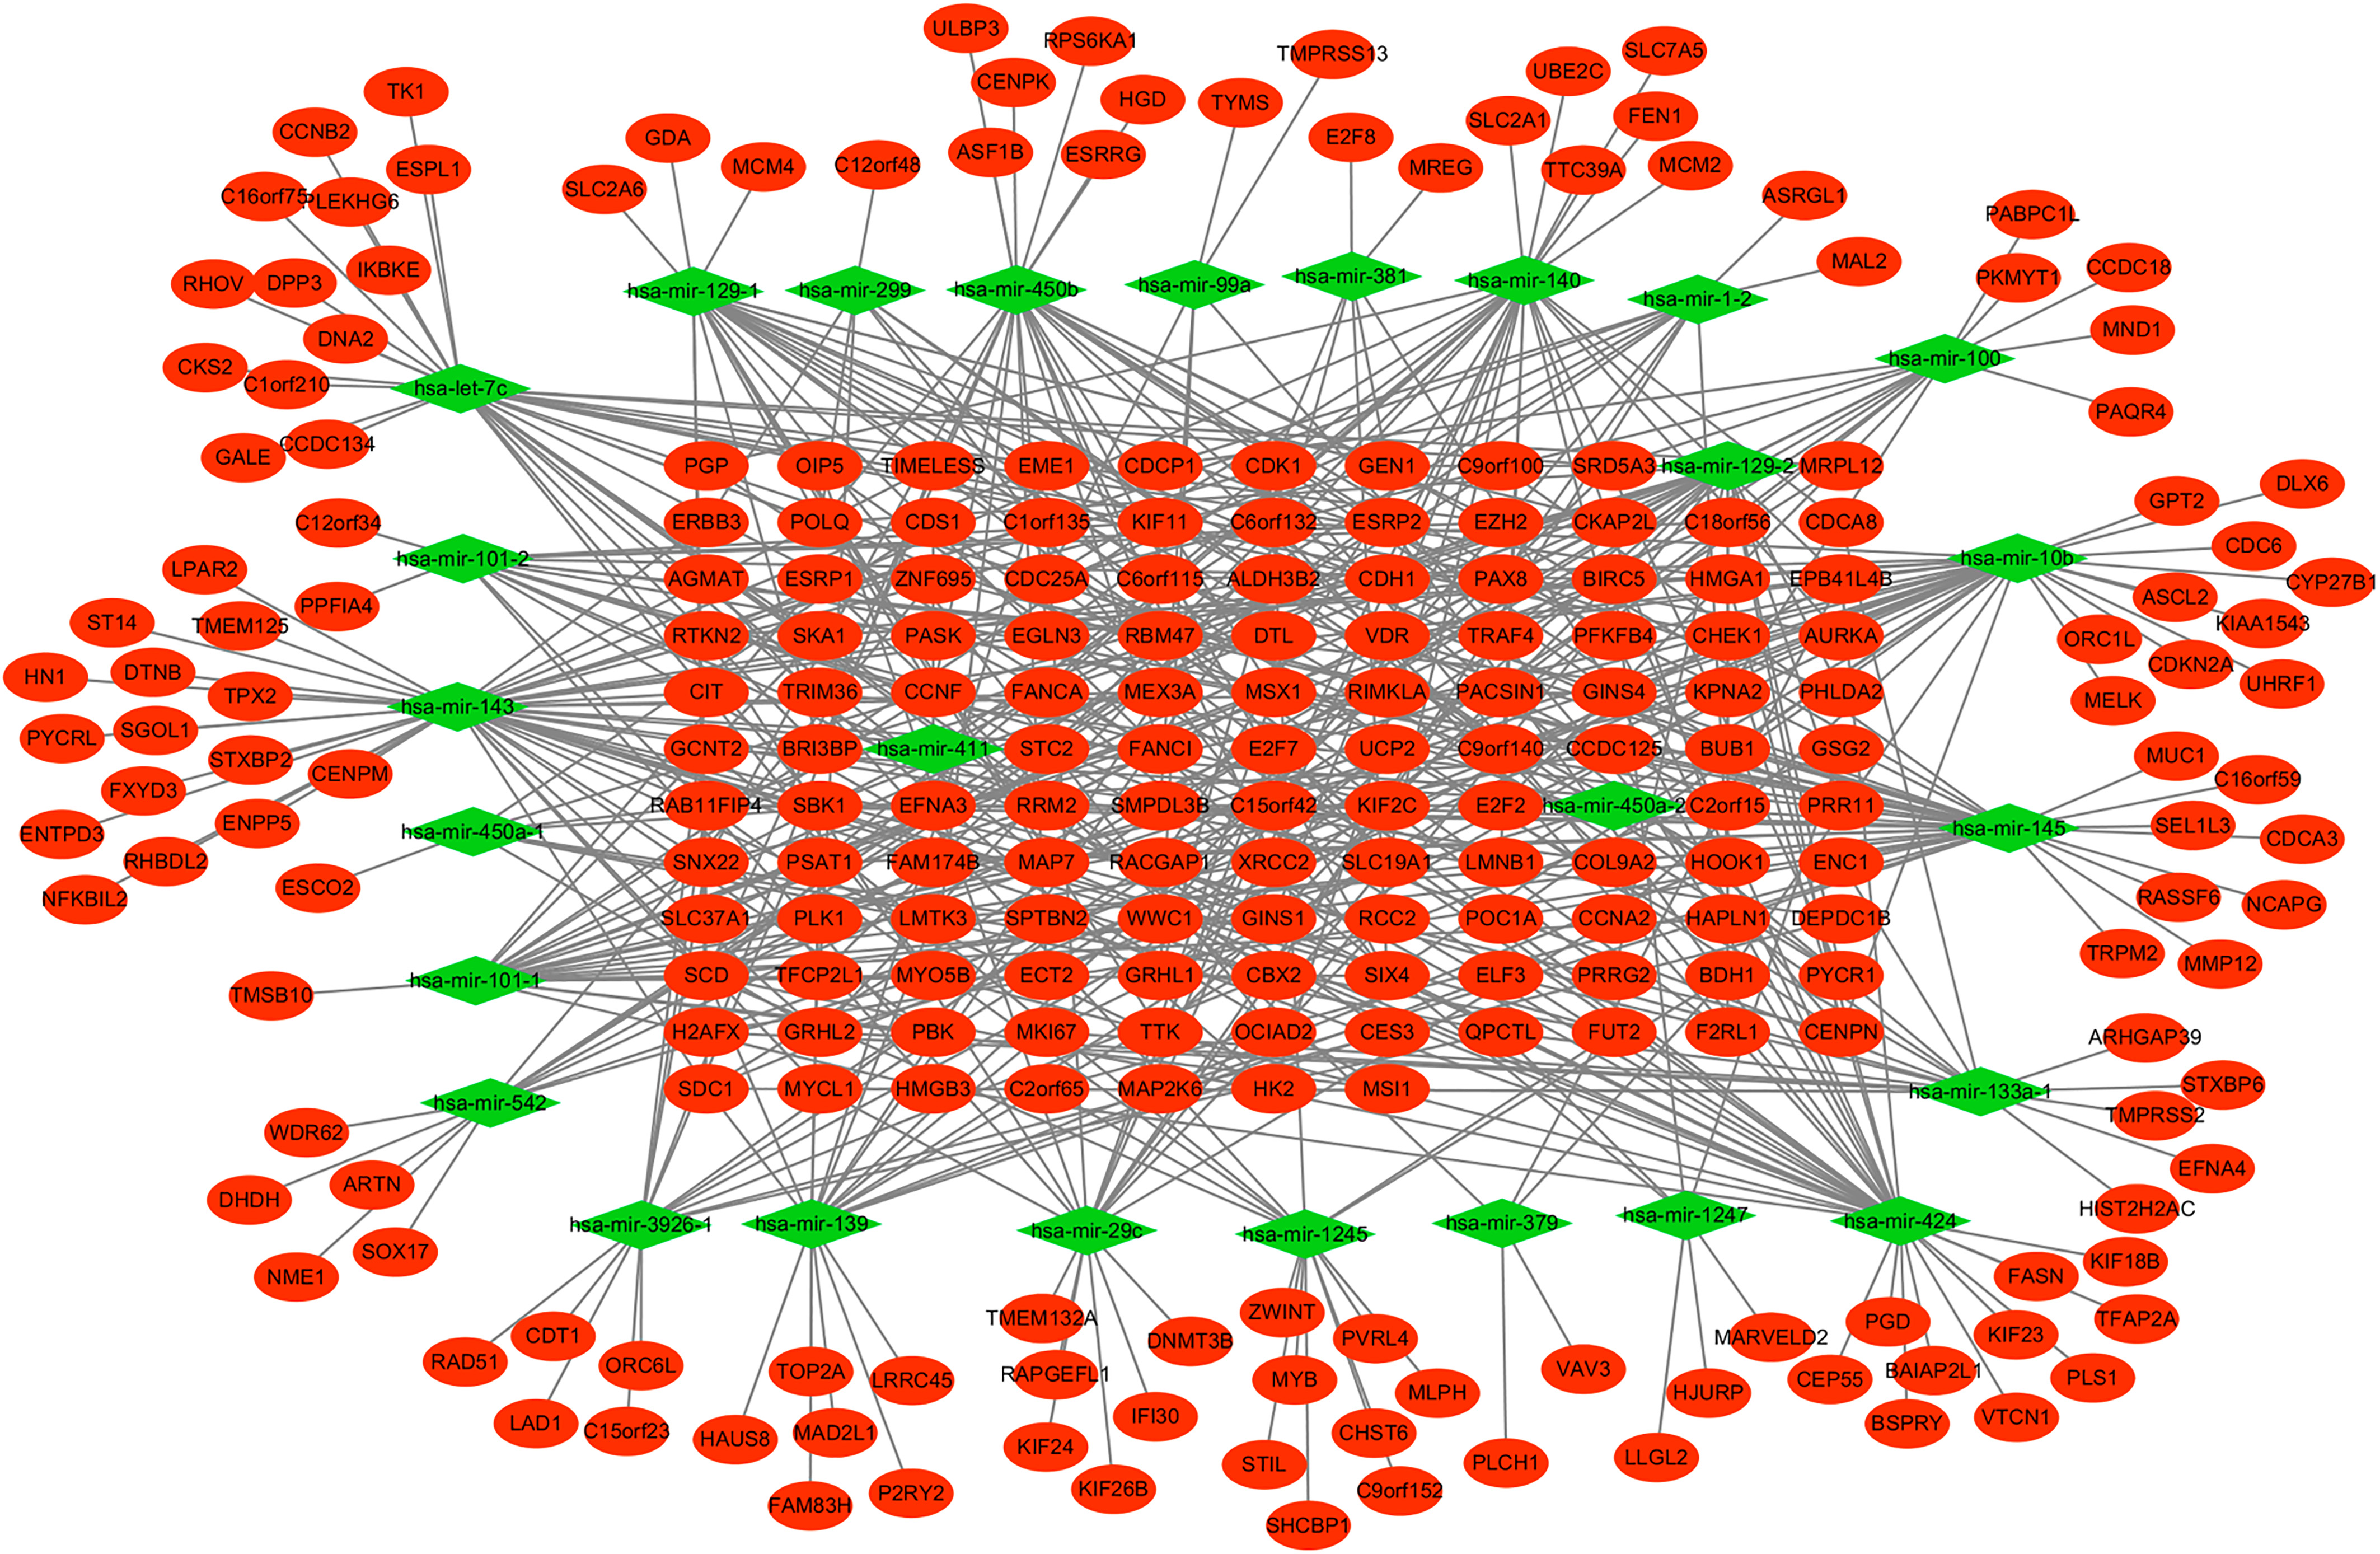
The COHCAP package in R (
QRT-PCR validation
Five patients diagnosed as EEA and seven normal individuals with no gynecological disease were enrolled in this study. EEA tissues and corresponding normal tissue samples were obtained at the time of surgery, and immediately frozen in liquid nitrogen. All participating individuals provided informed consent with the approval of the ethics committee of our hospital (2017-002-01). This study met the standards of the Declaration of Helsinki in its revised version of 1975 and its amendments of 1983, 1989, and 1996 [13].
Total RNA was extracted through the TRIzol
Results
Gene and miRNA expression pattern in EEA
Up to 381 EEA samples were included in the present study, all of which with fully characterized mRNA profiles, miRNA profiles and DNA methylation data. There were 2068 DEGs with FDR
Correlations of DEGs and differentially expressed miRNAs in EEA
To study correlations between DEGs and differentially expressed miRNAs, correlation analysis was conducted. Depending on the analysis, 1856 miRNA-mRNA inverse correlation pairs (P
Correlation between DEGs and DNA methylation in EEA
Generally, the methylation in the promoter regions results in the gene silencing. In this study, there were 2013 differentially methylated CpG sites. According to the threshold value selection of methyl.cutoff
Integrated analysis between differentially methylated CpG islands and DEGs
Integrated analysis between differentially methylated CpG islands and DEGs
delta.beta: an index of methylation evaluation; FDR: island false discovery rate; FC: fold change.
The regulatory network of up-regulated miRNA and their target genes in EEA. The diamonds and ellipses represent the miRNAs and target genes, respectively. The red and green colors represent up-regulation and down-regulation, respectively.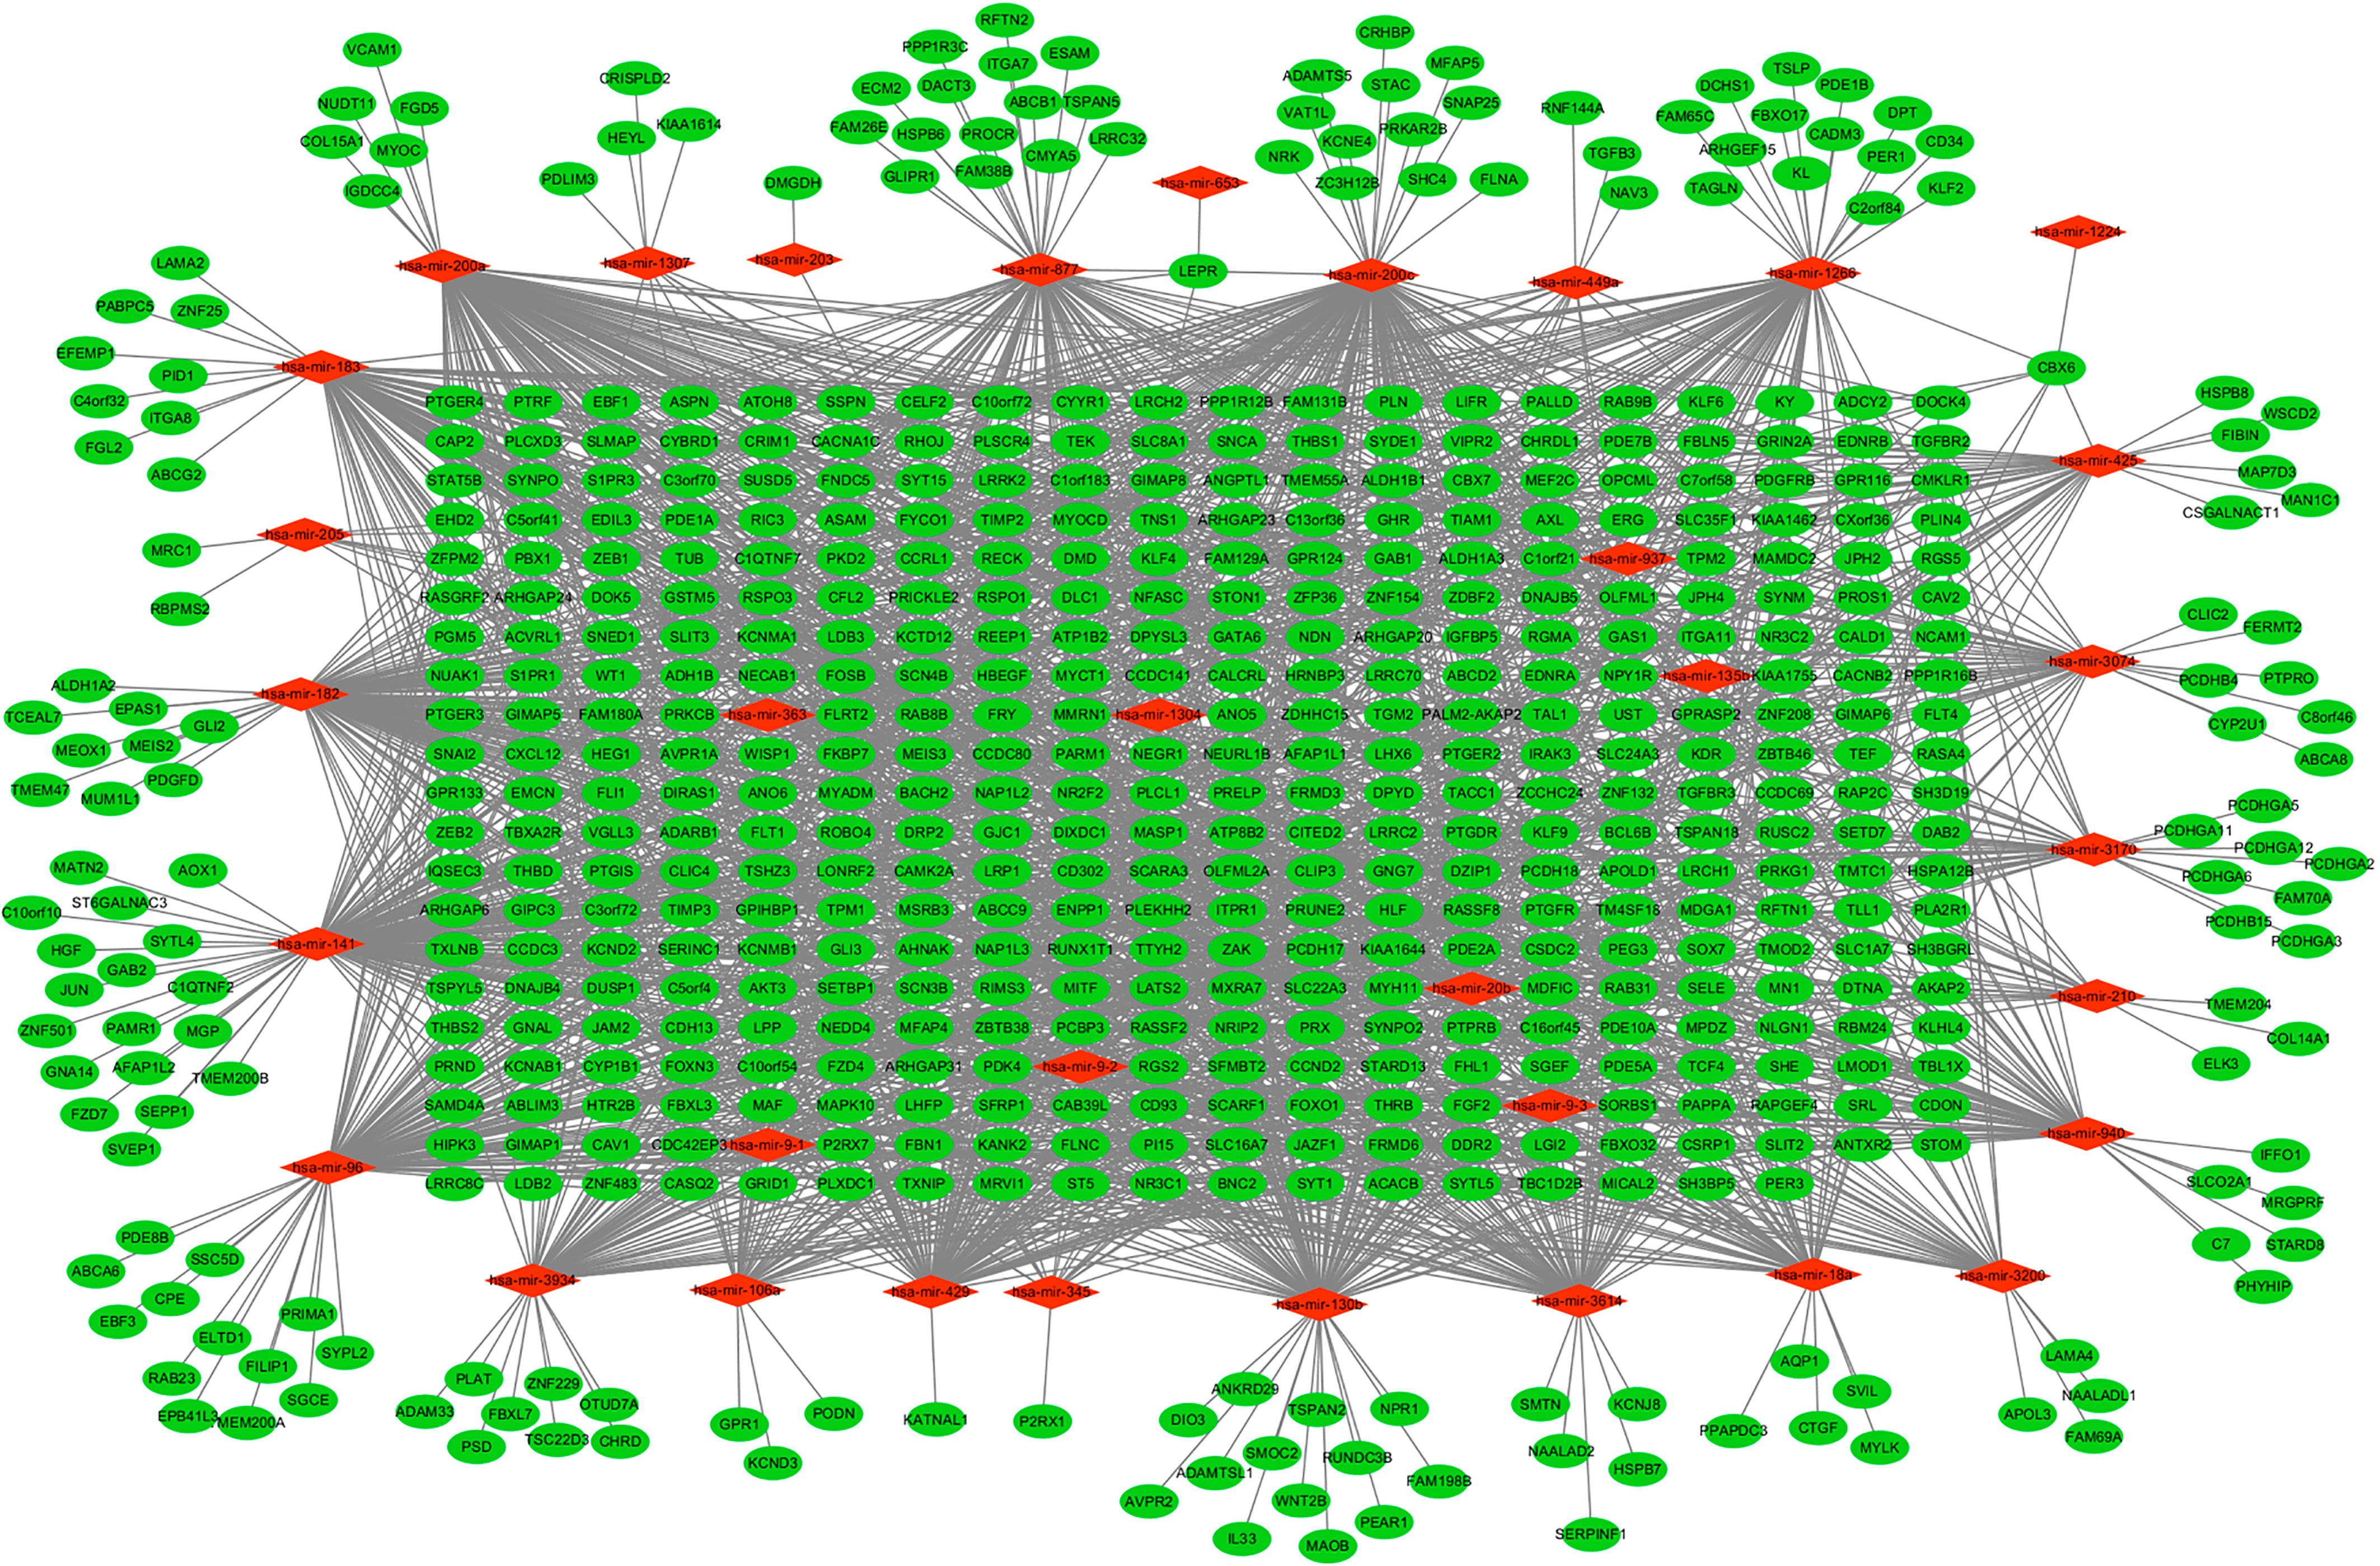
The negatively correlated target regulatory network between target DEGs and differentially expressed miRNAs in EEA. The diamonds and ellipses represent the miRNAs and target genes, respectively. The red and blue colors represent up-regulation and down-regulation, respectively.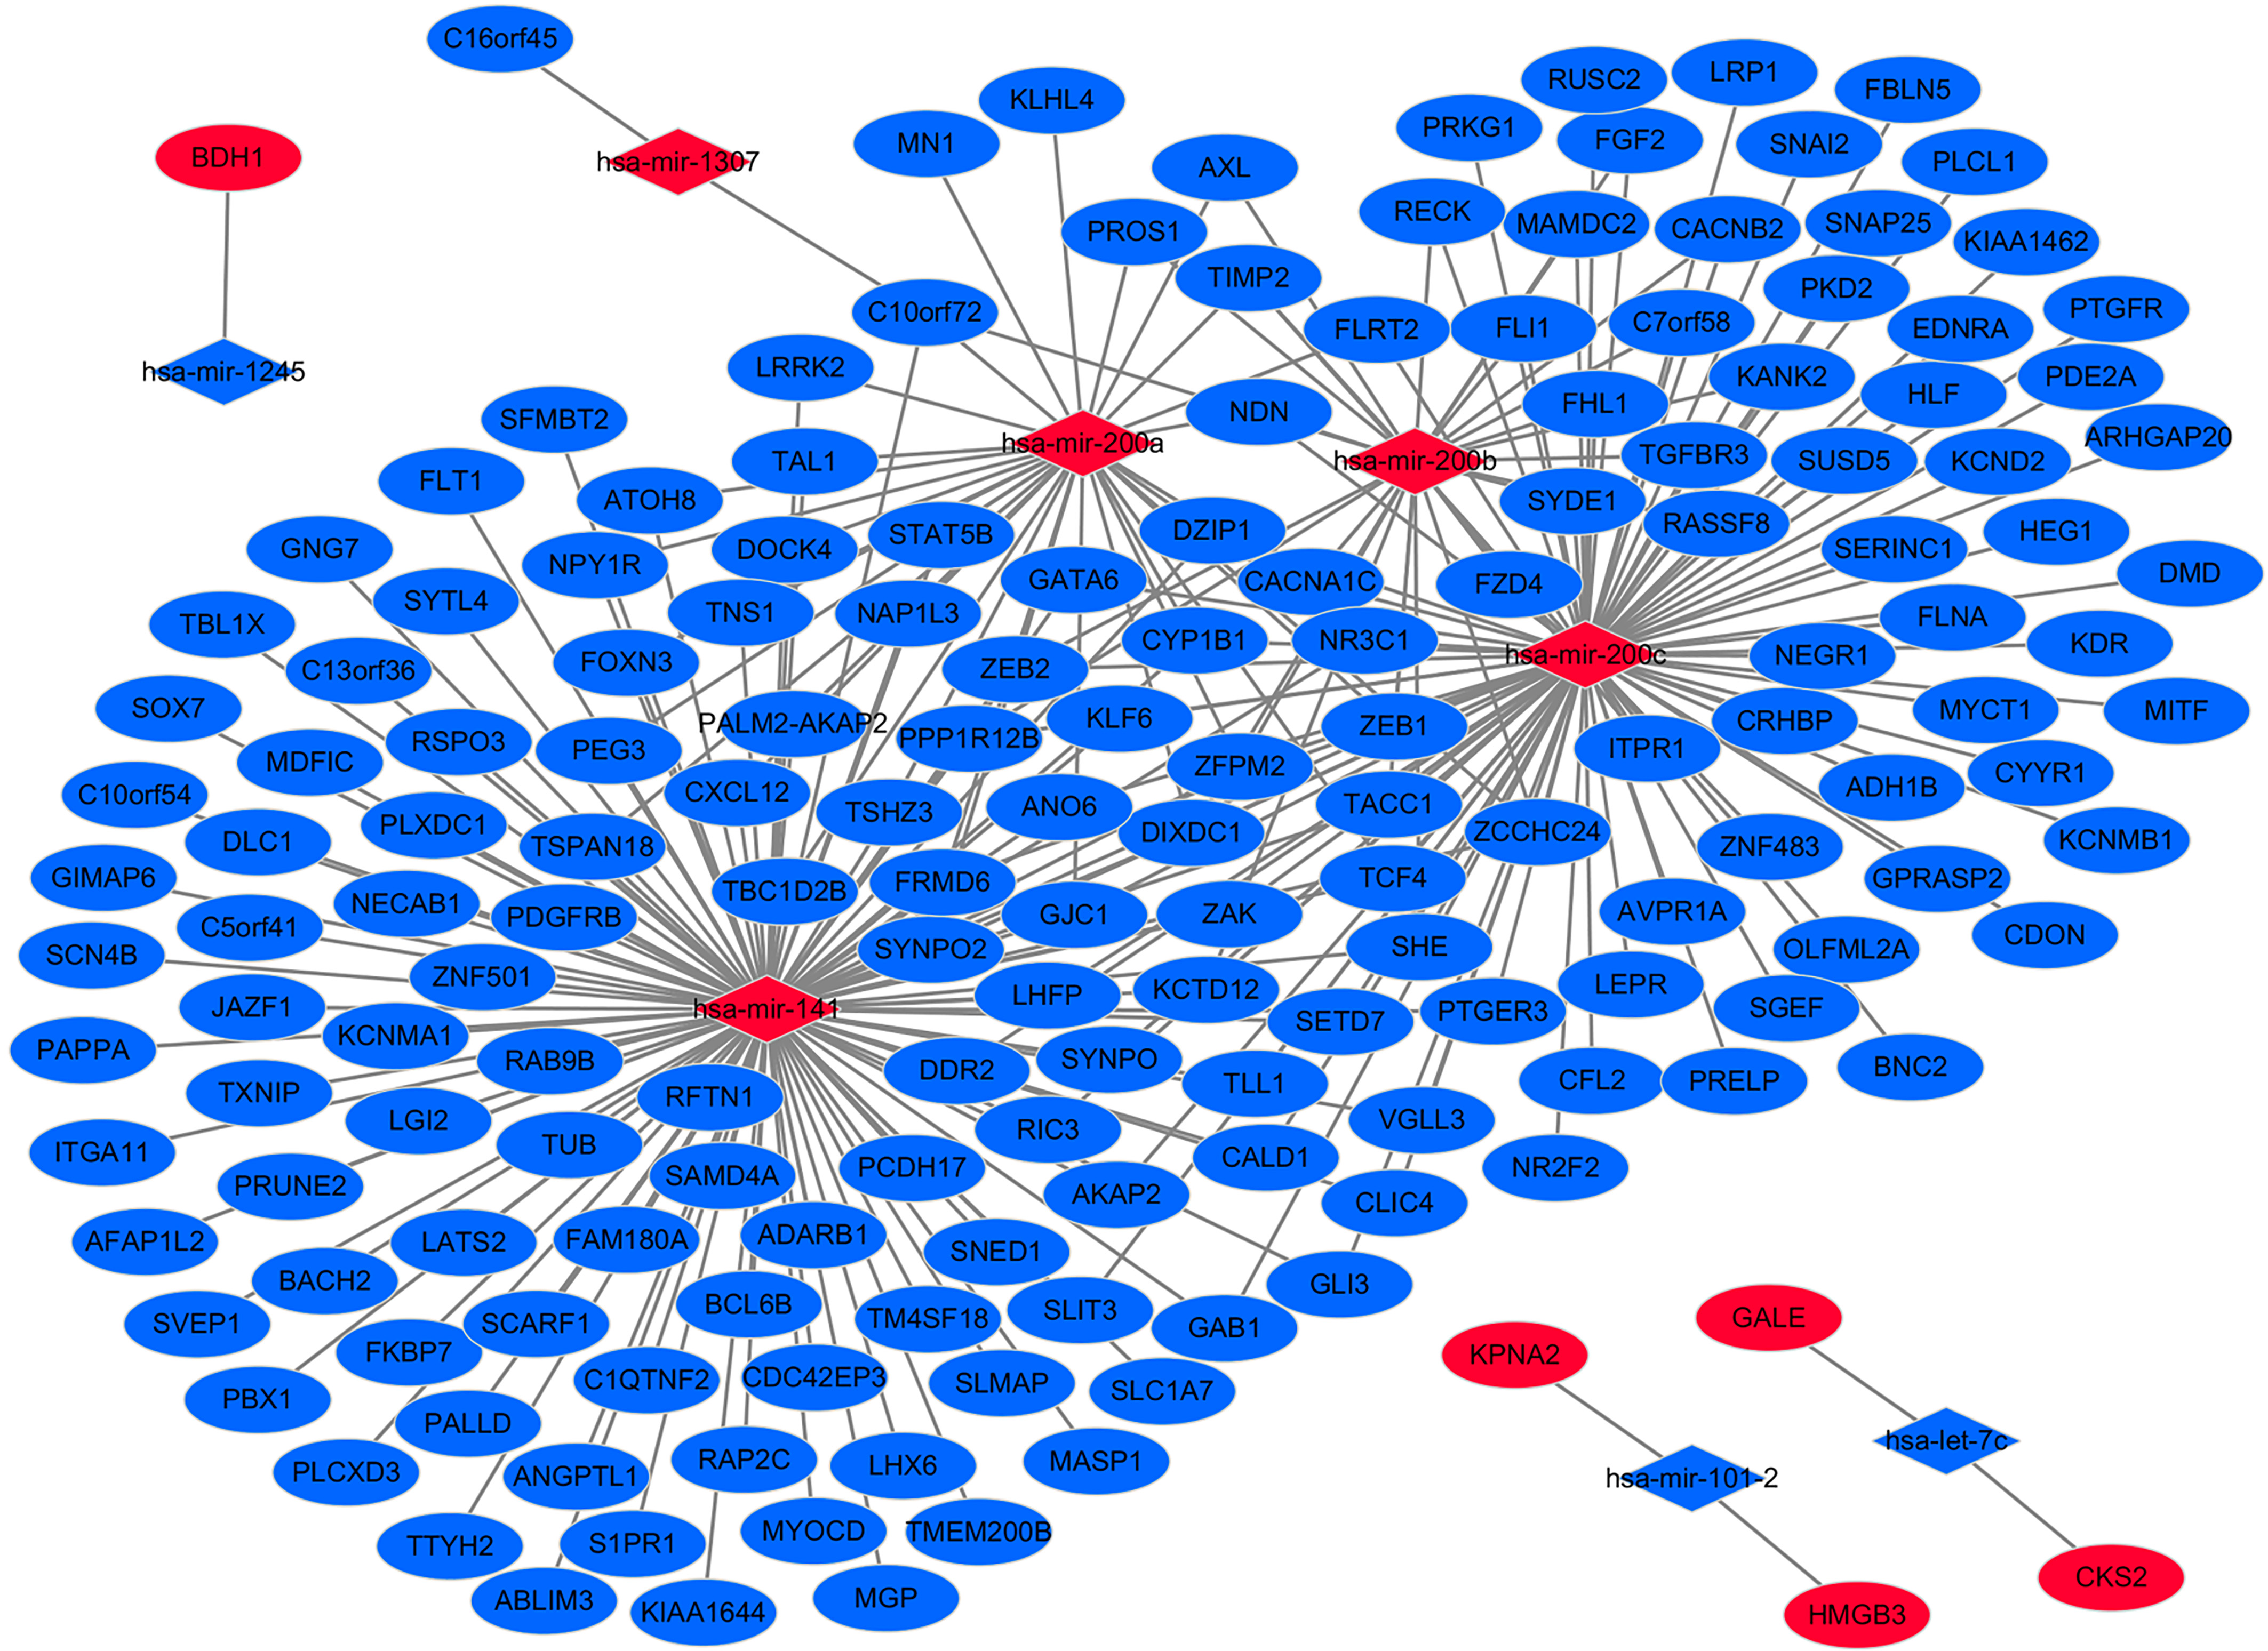
ZEB1, ZEB2, CYP1B1, PITX1, PITX2, hsa-mir-200a and hsa-mir-200b were selected to validate the expression of integrated analysis. The qRT-PCR results showed that PITX1, PITX2, hsa-mir-200a and hsa-mir-200b were up-regulated, which was consistent with that of integrated analysis. While ZEB1, ZEB2 and CYP1B1 were down-regulated, which were inconsistent with that of integrated analysis. The result of qRT-PCR was shown in Fig. 4. Additionally, the expression of nine genes including ZEB1, ZEB2, TIMP2, TCF4, CYP1B1, PITX1, PITX2, ZNF154 and TSPYL5 were analyzed in different grades of G1 (highly differentiated), G2 (moderately differentiated) and G3 (poorly differentiated) in the TCGA dataset. The result showed that TCF4, CYP1B1 and ZNF154 were the most significantly expressed genes in different grades, which were showed in Fig. 5.
Validation differentially expressed miRNAs and DEGs in the EEA tissues by qRT-PCR. 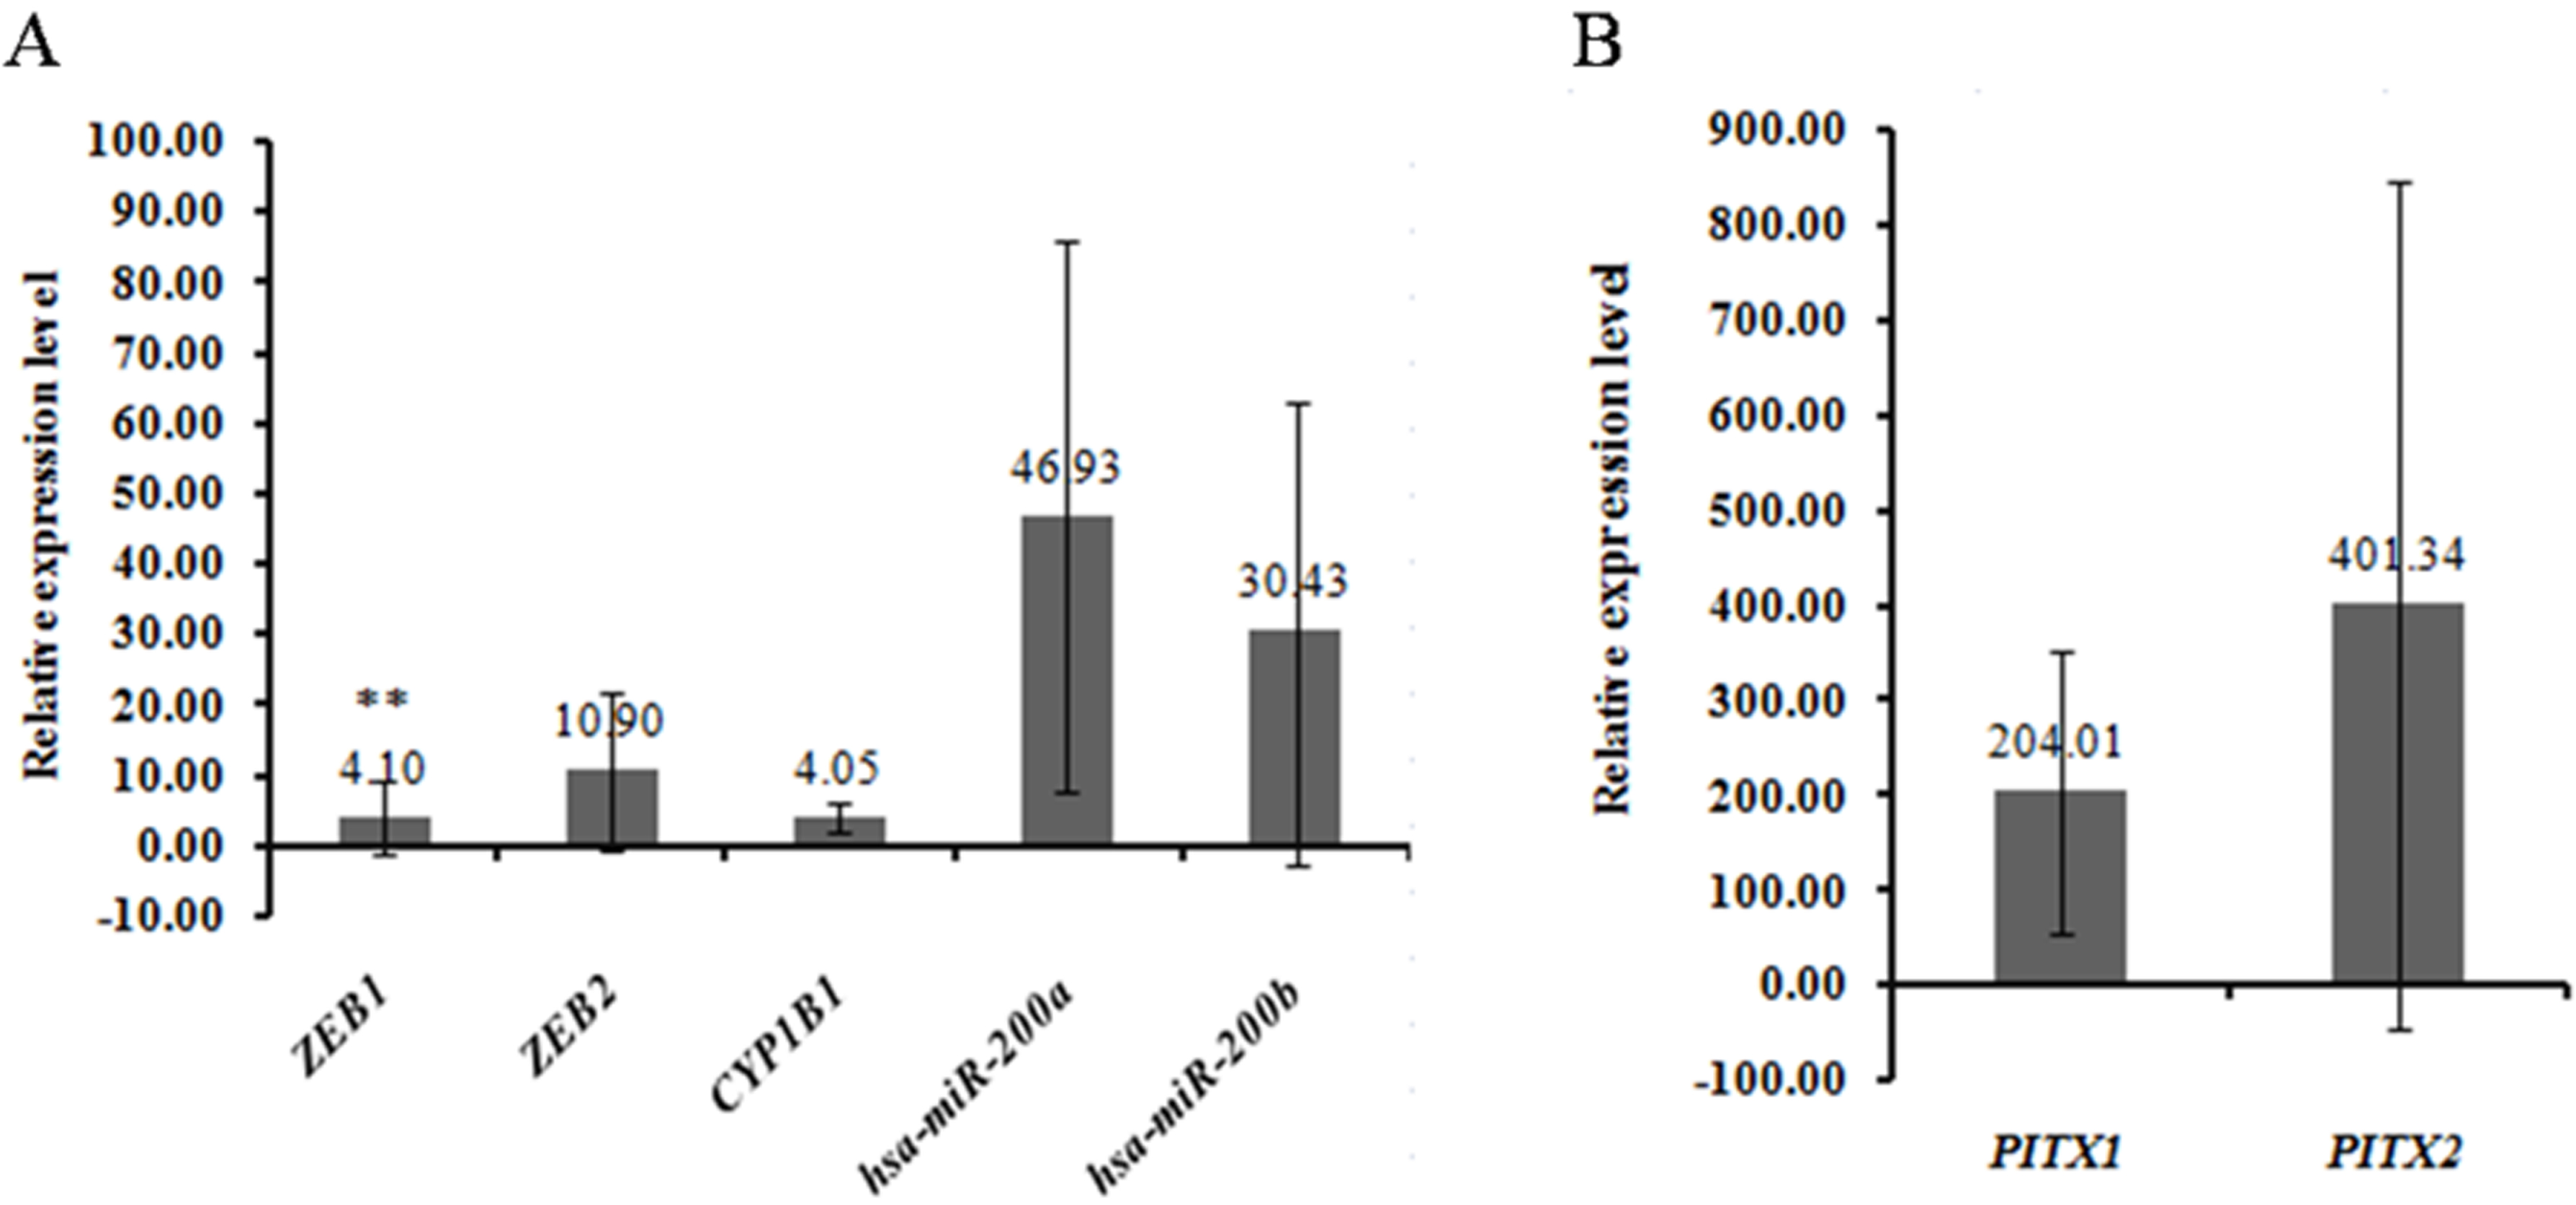
Electronic expression patterns of identified DEGs in different tumor grades in the TCGA dataset. G1: highly differentiated; G2: moderately differentiated; G3: poorly differentiated.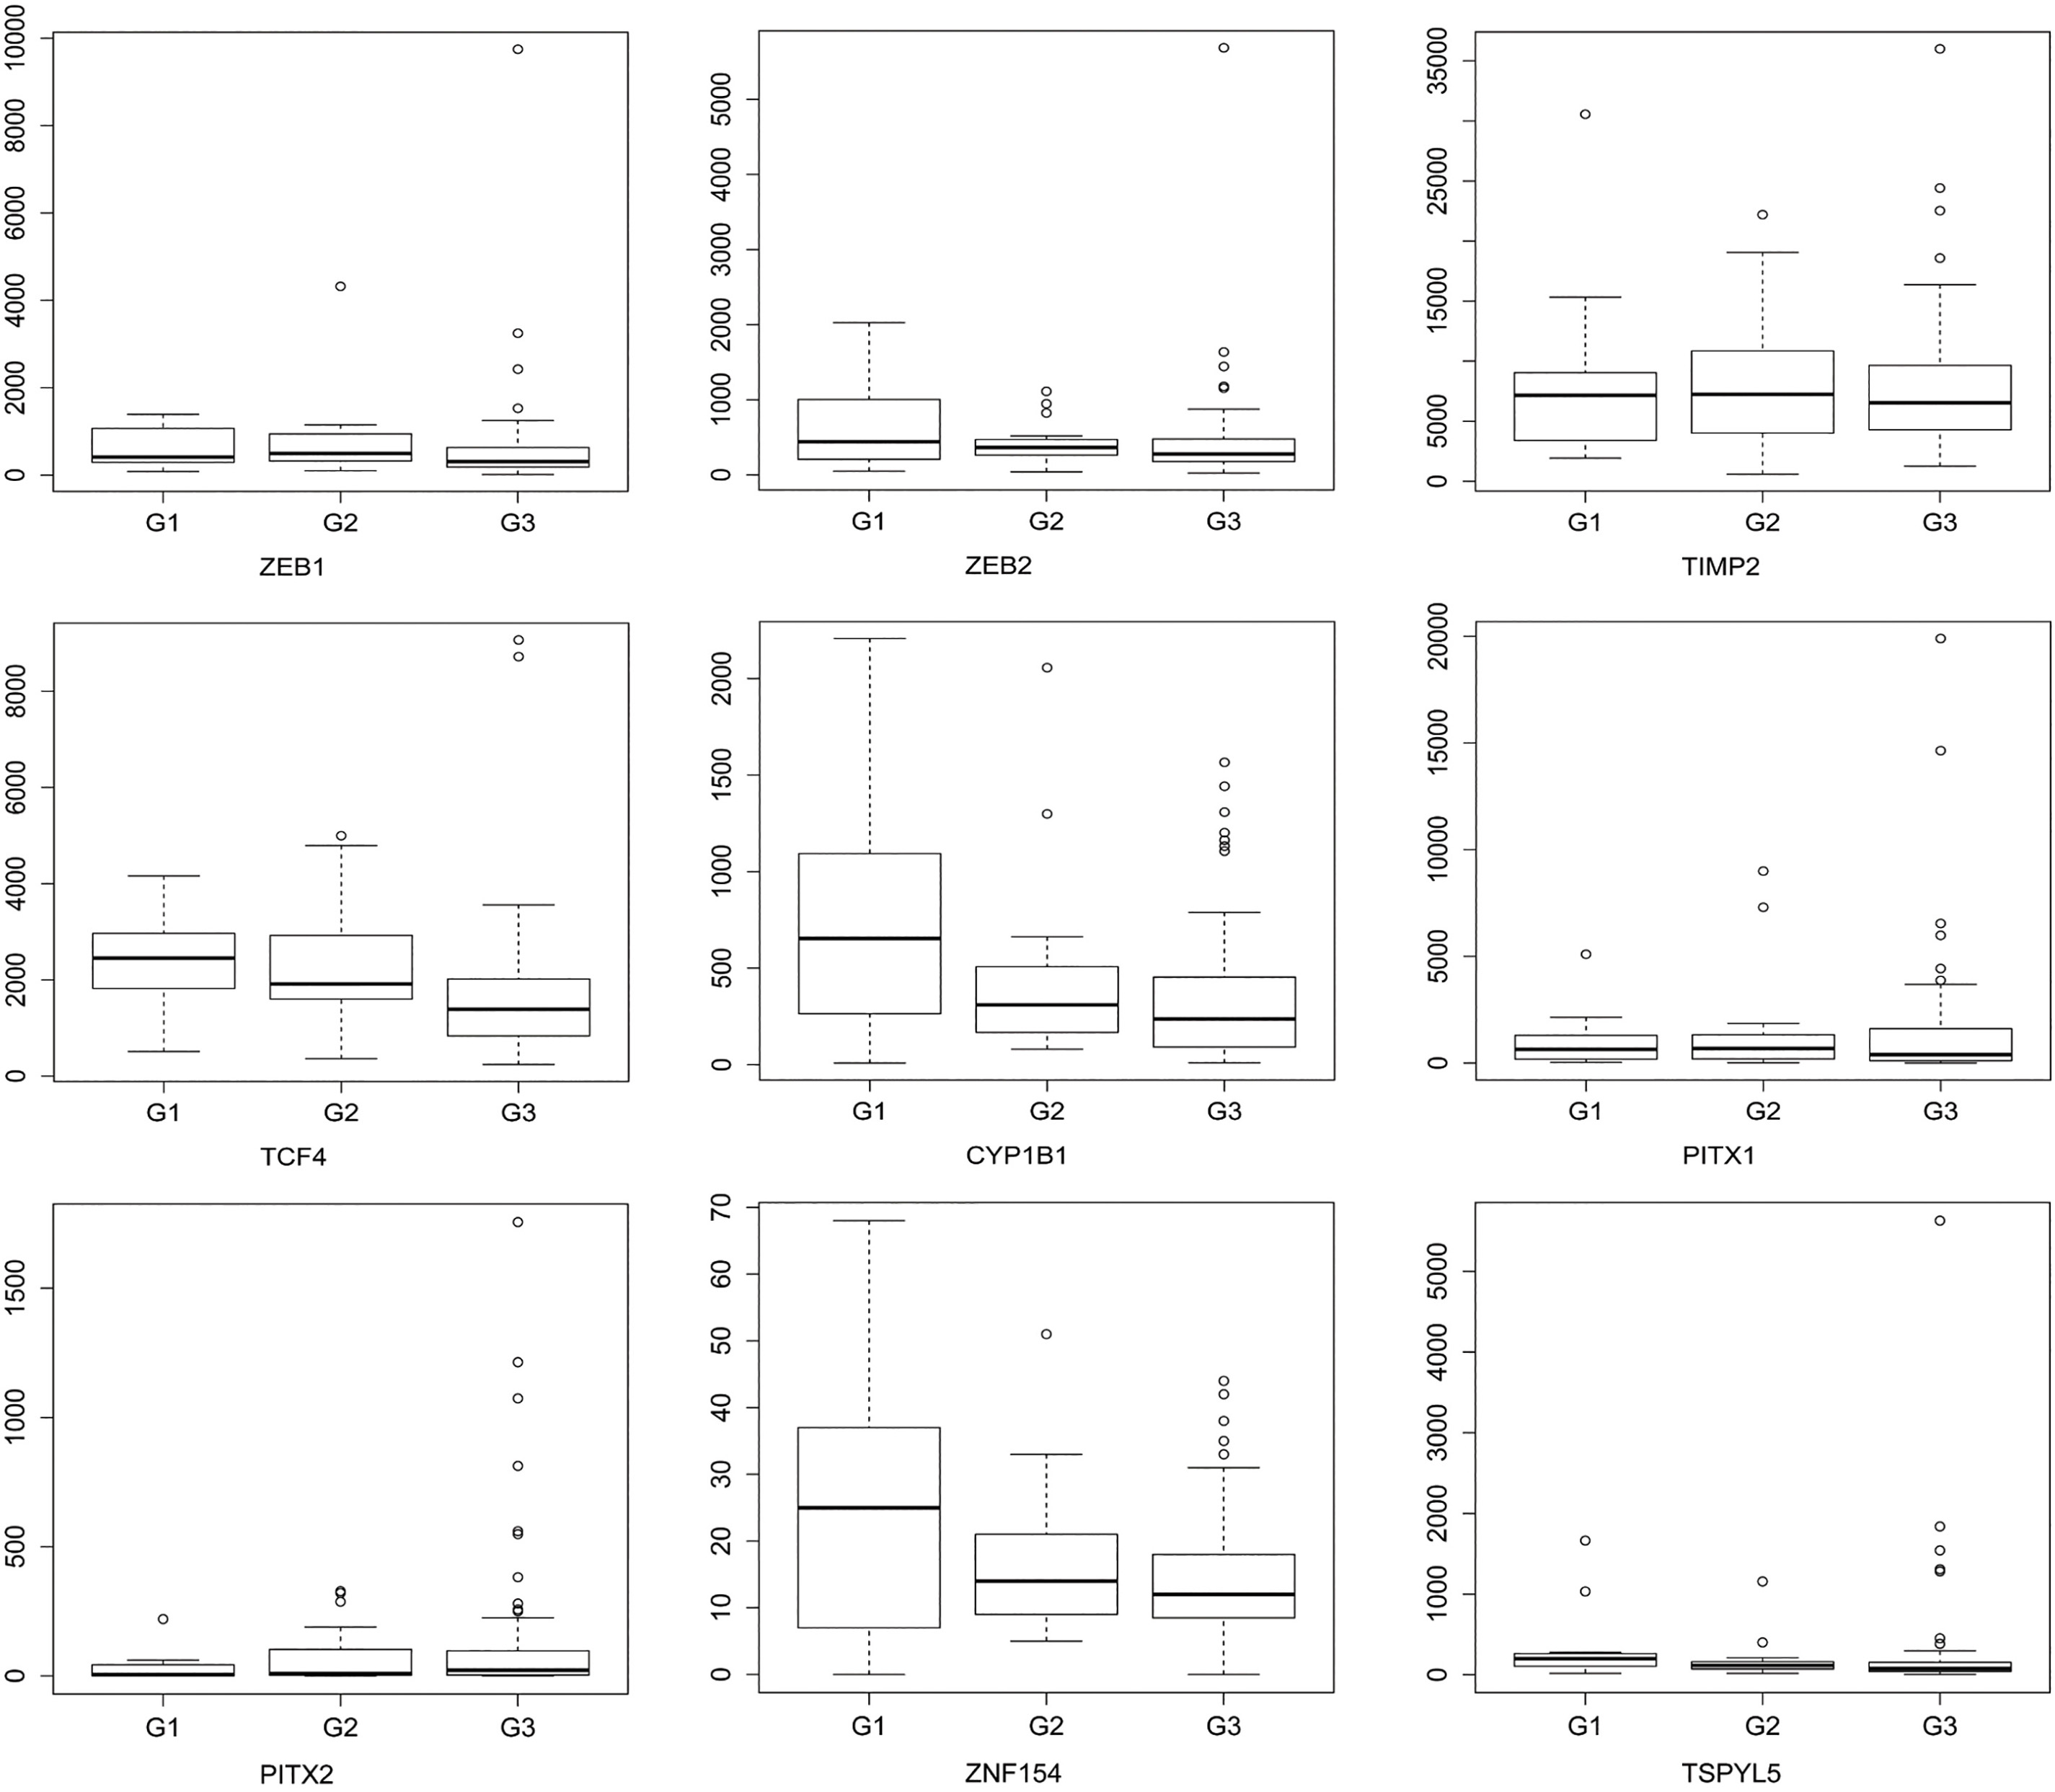
The identification of key genes can aid our understanding of EEA and the discovery of novel targets for therapy of EEA. In the present study, we first integrated mRNA expression, miRNA expression and DNA methylation data of EEA, and found that 2068 genes (1085 up-regulated and 983 down-regulated genes) were differentially expressed compared with normal tissues. Furthermore, 32 differentially expressed miRNAs including 27 up-regulated and 42 down-regulated miRNAs were identified in EEA. Then, according to miRNA-mRNA expression correlation analysis and miRNA-target prediction, we obtained 1856 inverse correlation pairs and 6062 target correlation pairs. Additionally, depending on the correlation analysis between DNA methylation and inverse mRNA expression, we obtained 16 differentially expressed genes which were remarkably associated with DNA methylation. Finally, the mRNA expression of several DEGs (PITX1 and PITX2) and miRNAs (hsa-mir-200a and hsa-mir-200b) confirmed results with the bioinformatics analysis except ZEB1, ZEB2 and CYP1B1.
In the negatively correlated target regulatory network of DEGs and differentially expressed miRNAs, we found five genes (degree
ZEB1 and ZEB2 are members of transcriptional repressors of E-cadherin. Interestingly, ZEB1 was not expressed in the normal endometrial epithelium, while it was aberrantly expressed in tumor epithelial cells of endometrial carcinoma [14]. Moreover, the higher expression of ZEB1 which was associated with higher aggressive capacity and development of metastases in cancers has been found in endometrial carcinoma [15]. It is reported that ZEB1 protein expression was remarkably up-regulated in tumor of EEA as compared to hyperplastic or normal endometrium [16]. ZEB2 is implicated in tumour metastasis and the induction of epithelial to mesenchymal transition in several carcinoma types [17]. In this study, we found down-regulated expression of ZEB1 and ZEB2 in EEA and further validated by qRT-PCR. While our validation experiment was inconsistent with the bioinformatics result. Therefore, further researches with large clinical samples were needed.
TIMP2 is an inhibitor of MMPs known to function in matrix degradation and cellular invasion. Graesslin et al. reported that low TIMP2 expression was the potent markers for endometrial malignancies with a high risk of metastasis [18]. In this study, we found down-regulated expression of TIMP2 in EEA, which suggested that it played an important role in the process of metastasis in EEA. TCF4 is a transcription factor and involved in the process of endometrial carcinoma via binding to MALAT1 promoter under the pathway of wnt/beta-catenin pathway [19]. In the present study, we found the expression of TCF4 was decreased in EEA. This further demonstrated the role of TCF4 in the pathogenic process of EEA.
CYP1B1 (also called P4501B1), is an estrogen metabolic enzyme. Previous studies have reported that the expression changes of CYP1B1 are potent risk factors for endometrial carcinoma [20, 21]. Furthermore, Saini et al. demonstrated that CYP1B1 depletion in endometrial carcinoma cells reduced cellular proliferation and induced G0-G1 cell cycle arrest, thus suggesting that inhibiting the expression of CYP1B1 in cells could be a useful therapeutic approach in endometrial carcinoma [22]. In this study, we found the decreased expression of CYP1B1 in EEA. While it increased in qRT-PCR. Maybe the dysregulation of CYP1B1 was associated with EEA and further research was needed.
The hsa-mir-200 family consisting of 5 members (hsa-mir-141, hsa-mir-200a, hsa-mir-200b, hsa-mir-200c and hsa-mir-429) is an emerging miRNA family that has been demonstrated to play important roles in cancer recurrence and metastasis, and potentially be crucial to the diagnosis and treatment of cancer [23]. It is worth mentioning that the hsa-mir-200 family has been reported to be up-regulated in EEA [24]. In this study, we also found increased expressions of hsa-mir-141, hsa-mir-200a, hsa-mir-200b, hsa-mir-200c in EEA, which were in line with the previous reports. Additionally, ZEB1, ZEB2, TIMP2, TCF4 and CYP1B1 were all under the regulation of these four miRNAs in EEA, which further demonstrated the relationship between above mentioned DEGs and EEA.
Depending on the analysis of methylation analysis of DEGs, we found four DEGs including (PITX1, PITX2, ZNF154 and TSPYL5) that were significantly related to methylation in EEA. PITX1 and PITX2 belong to the paired like homeodomain family. PITX1 is known to be involved in numerous biological processes, such as transcription regulation [25]. It is considered as tumor suppressor, probably due to activating the transcription of tumor suppressor p53 [26]. Additionally, it is reported that methylation at the CpGs of PITX1 is associated with clear cell renal cell carcinoma [27]. PITX2 is a DNA methylation biomarker and has been recorded to promote tumor progression of renal cancer and ovarian cancer and is involved in potential clinical applications, such as response to therapy of breast cancer [28, 29, 30]. In this study, we found that both PITX1 and PITX2 were all methylated and increased in EEA, which further suggested the vital role of methylation of PITX1 and PITX2 in EEA.
ZNF154 is reported to show the strongest hypermethylation signal at a CpG island within the promoter in tumors including endometrial carcinoma, which demonstrates hypermethylation of ZNF154 as a potential marker for tumor identification [31]. TSPYL5 is a frequently silenced gene mediated by DNA methylation in various cancers [32, 33, 34, 35, 36]. It is also associated with the cell cycle and is potentially related to patient survival in all endometrial carcinoma grades [37]. It is reported that TSPYL5 is down-regulated in EEA [37]. In this study, we found that ZNF154 and TSPYL5 were all hypermethylation and down-regulated in EEA, which illustrated that aberrant methylation played a major role in development of EEA.
In conclusion, we found nine DEGs (ZEB1, ZEB2, TIMP2, TCF4, CYP1B1, PITX1, PITX2, ZNF154 and TSPYL5) in EEA. Among which, the expression of ZEB1, ZEB2, TIMP2, TCF4 and CYP1B1 was under the regulation of hsa-mir-200a, hsa-mir-200b, hsa-mir-200c and hsa-mir-141. While the expression of PITX1, PITX2, ZNF154 and TSPYL5 were regulated by DNA methylation. All these DEGs were differentially expressed in differentially tumor grades of EEA development, which further suggested the role in the tumor differentiation of EEA. Additionally, we first found the role of ZEB2, PITX1 and PITX2 in EEA. In conclusion, the identified DEGs were significantly associated with EEA, which provided a novel therapy target for EEA.
EEA can present as different subtypes at different stages. Herein, we studied the pathology mechanism of EEA in only 381 patients, which meant a limitation of the study. Anyway, we also found the numbers of differentially expressed genes and miRNAs, which were helpful in understanding the pathogenesis of EEA. In further studies, larger cohorts of EEA patients are needed to demonstrate the diagnostic and therapy value of identified genes.
Footnotes
Conflict of interest
None declared.
Supplementary data
The heat map of top 100 DEGs in EEA. Diagram presents the result of a two-way hierarchical clustering of top 100 DEGs and samples. The clustering is constructed using the complete-linkage method together with the Euclidean distance. Each row represents a DEG and each column, a sample. The DEG clustering tree is shown on the right. The colour scale illustrates the relative level of DEG expression: red, below the reference channel; green, higher than the reference.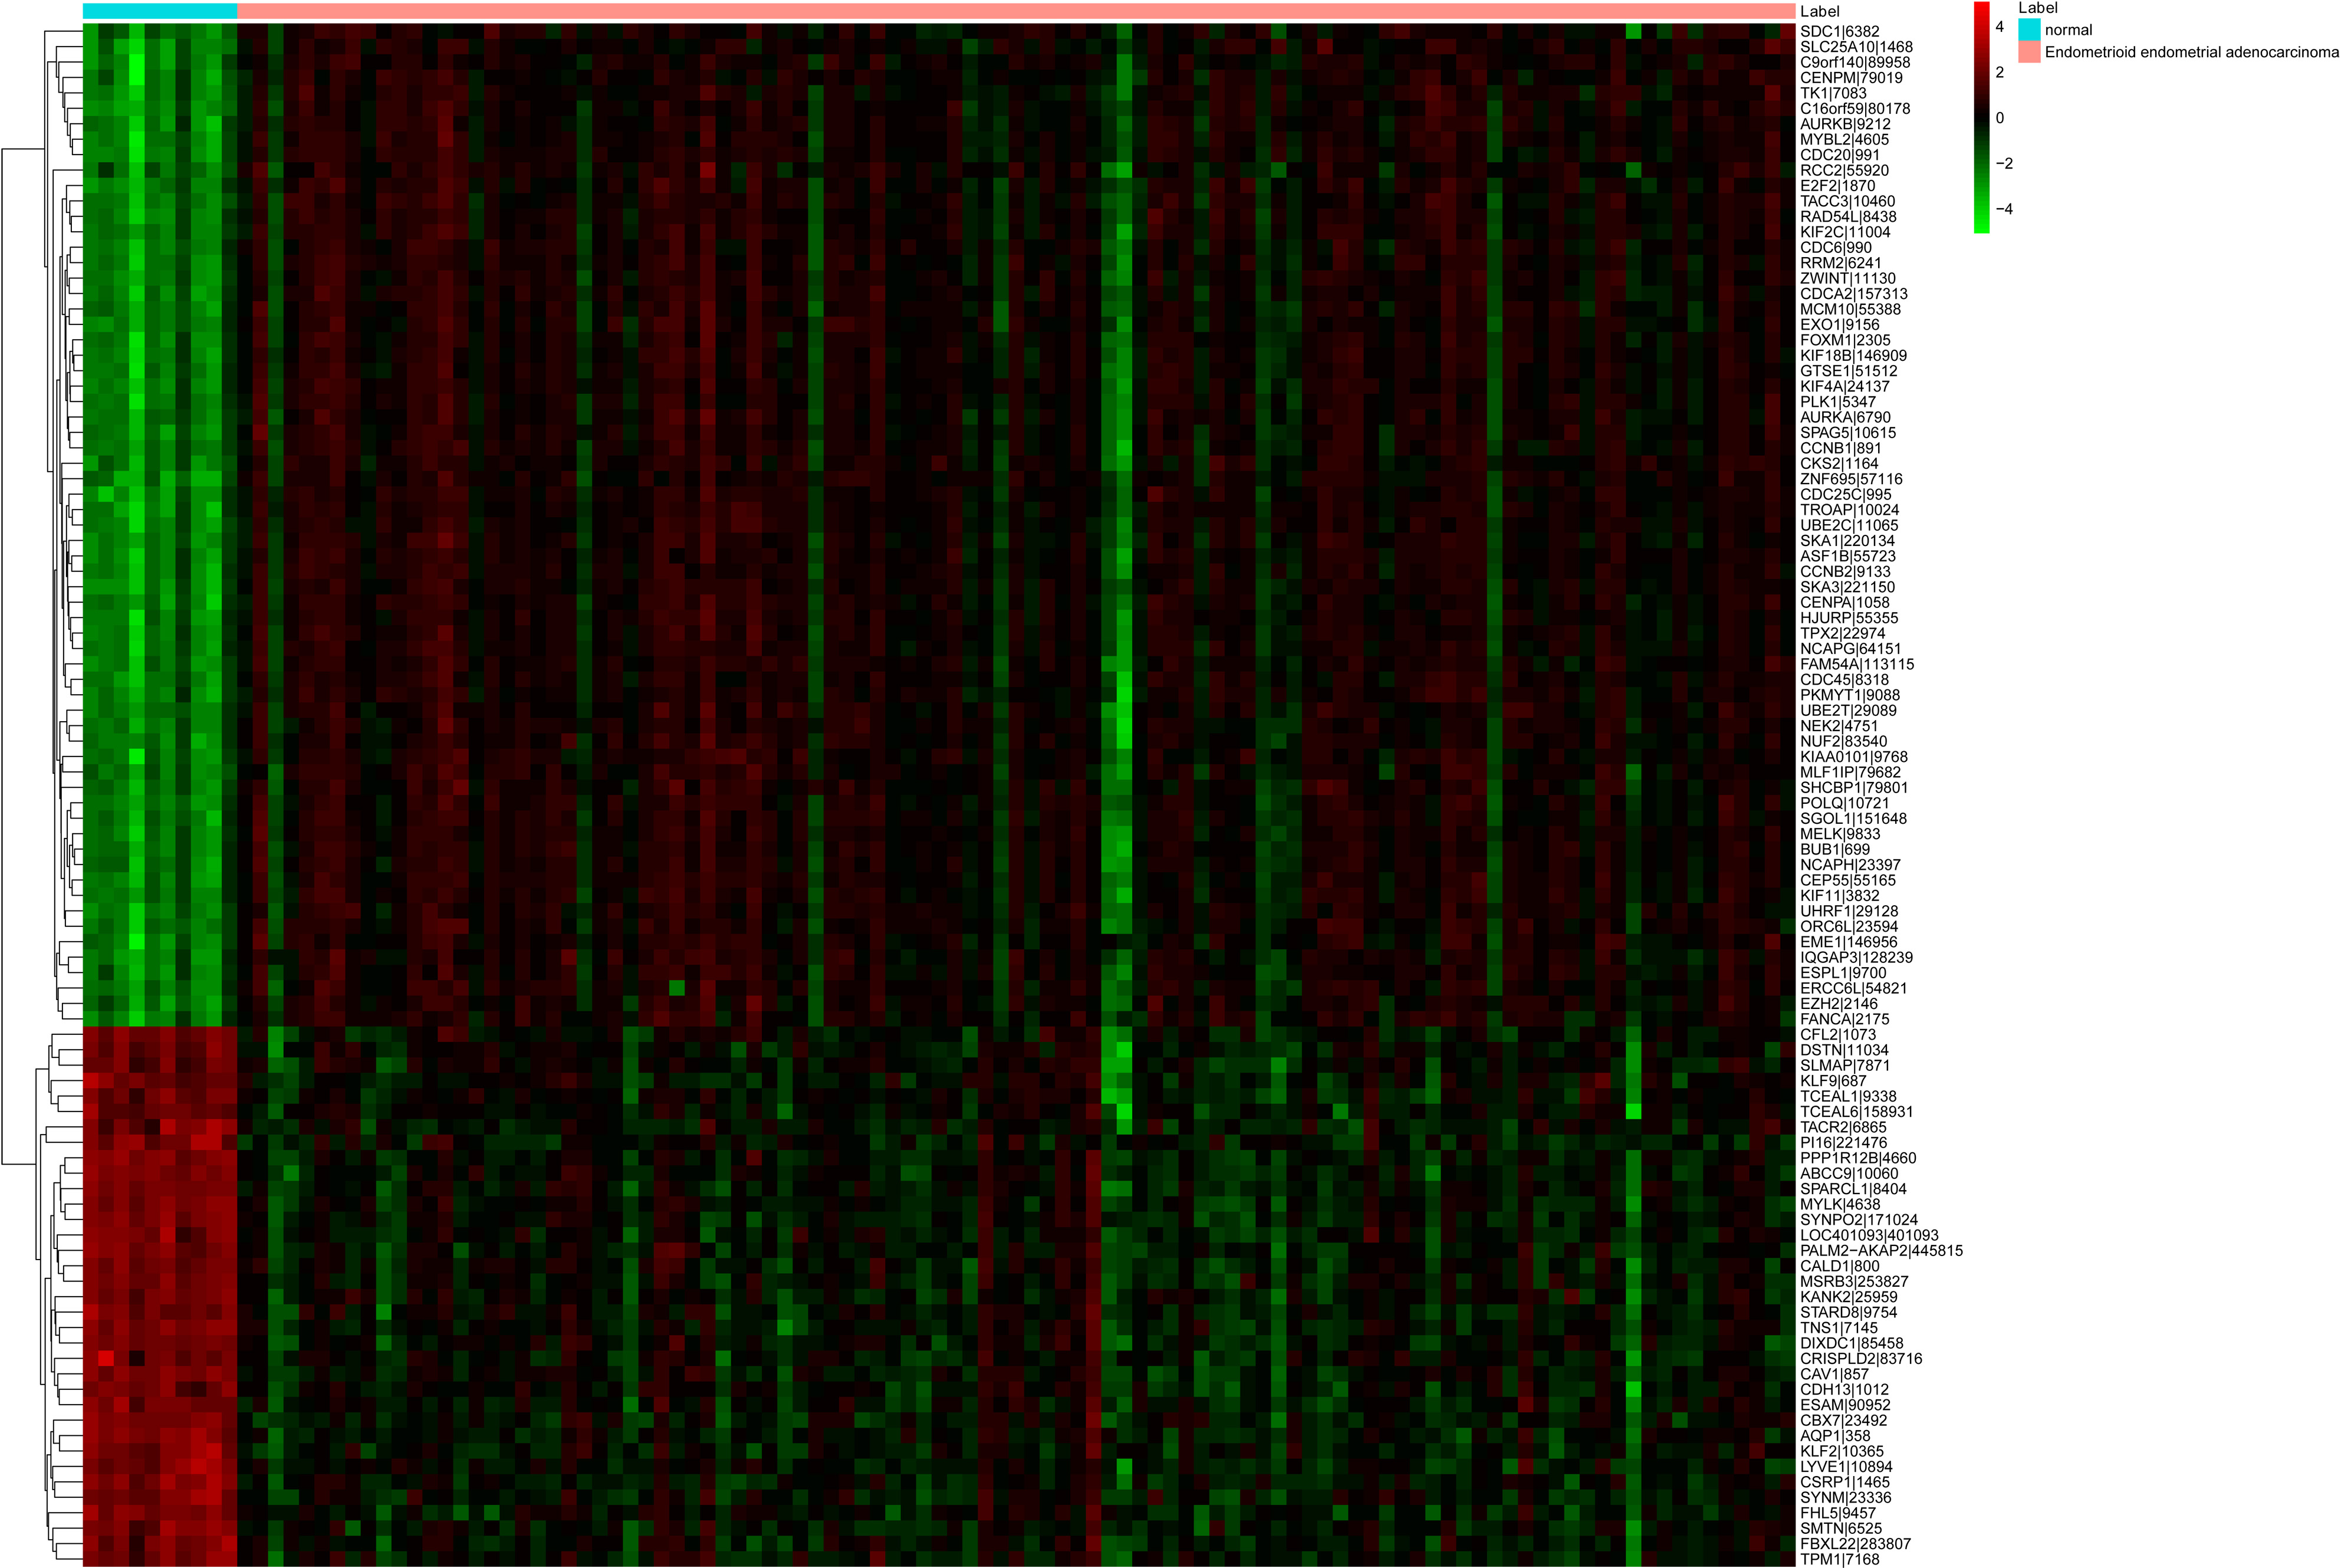
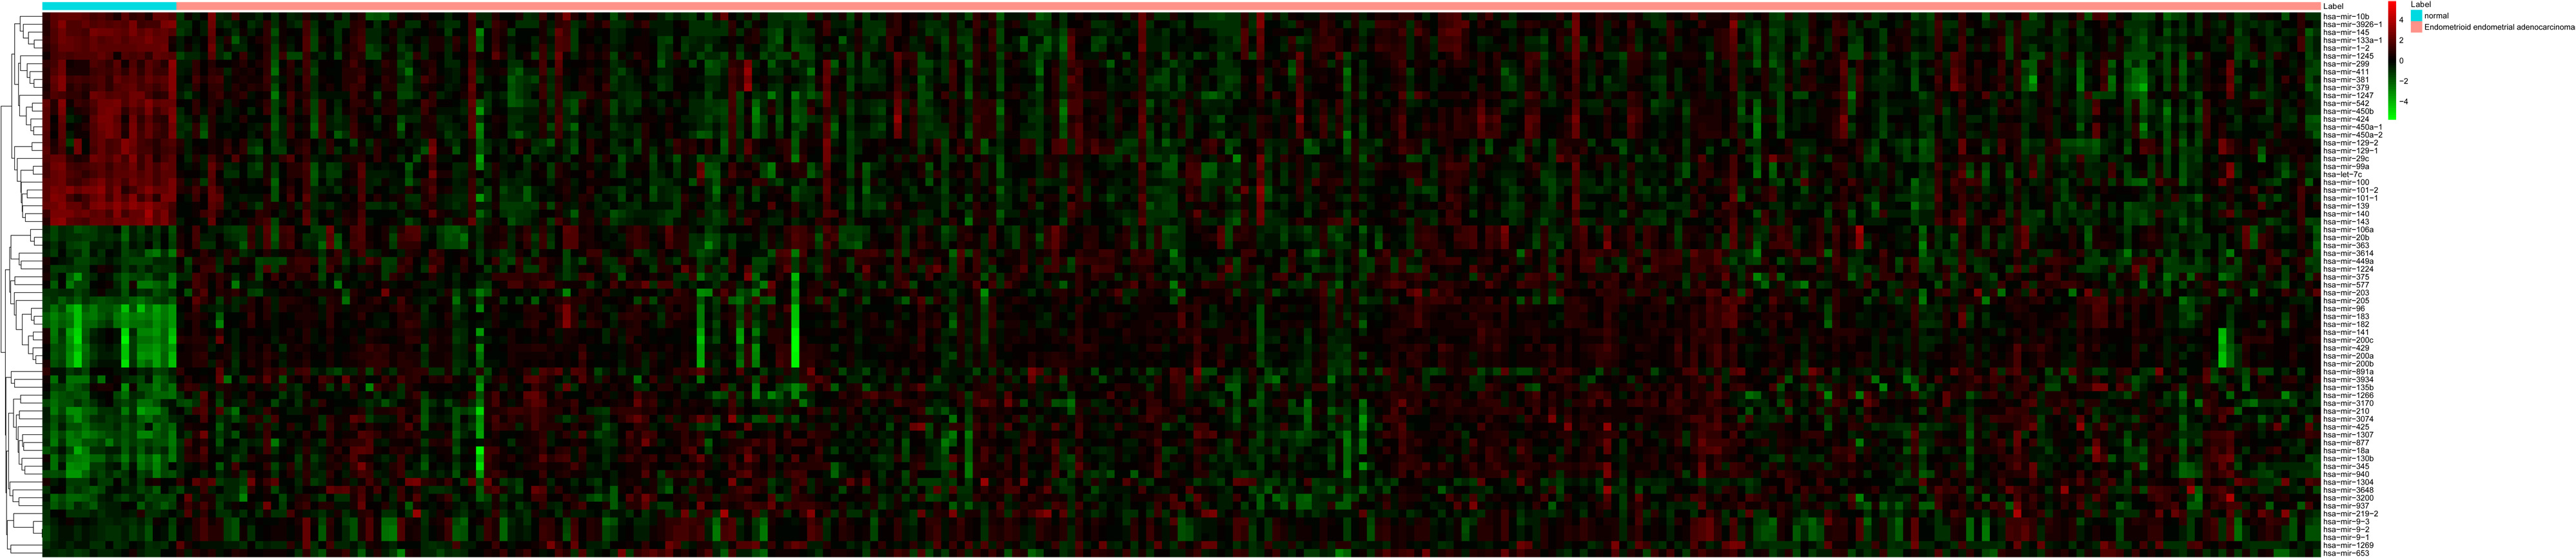
The heat map of all differentially expressed miRNAs in EEA. Diagram presents the result of a two-way hierarchical clustering of all differentially expressed miRNAs and samples. The clustering is constructed using the complete-linkage method together with the Euclidean distance. Each row represents a miRNA and each column, a sample. The miRNA clustering tree is shown on the right. The colour scale illustrates the relative level of miRNA expression: red, below the reference channel; green, higher than the reference.