
Abstract
Cancer is the most important cause of death worldwide, and early cancer detection is the most fundamental factor for efficacy of treatment, prognosis, and increasing survival rate. Over the years great effort has been devoted to discovering and testing new biomarkers that can improve its diagnosis, especially at an early stage. Here we report the potential usefulness of new, easily applicable, non-invasive and relatively low-cost clinical biomarkers, based on abnormalities of oral mucosa spectral reflectance and fractal geometry of the vascular networks in several different tissues, for identification of hereditary non-polyposis colorectal cancer carriers as well for detection of other tumors, even at an early stage. In the near future the methodology/technology of these procedures should be improved, thus making possible their applicability worldwide as screening tools for early recognition and prevention of cancer.
Keywords
Introduction
Cancer is a class of diseases characterized by the uncontrolled growth and spread of abnormal cells. The basic cellular mechanism that permits cancer development consists in alterations of multiple genes and of their expression that confer a survival advantage and proliferative potential to somatic or germinal cells. Such alterations primarily affect three main classes of genes: (proto) oncogenes, tumor suppressor, and DNA repair genes. These alterations (mutated genes) collectively contribute to the development of cancer genotypes and phenotypes that show high resilience to the death mechanism(s) intrinsic in cells (e.g., apoptosis), and miss-regulated cell proliferation [94, 170].
As is well-known, the impact of this disease is remarkable. It has been estimated that 14.1 million new cancer cases and 8.2 million cancer-related deaths occurred in 2012 worldwide [68], with a huge increase foreseen in the next few years. Projections based on the GLOBOCAN 2012 forecast an increase to 19.3 million new cancer cases per year by 2025, due to growth and aging of the global population. In the USA alone 1.5 million of people were diagnosed with cancer in 2010, causing in the same year around 570,000 cancer deaths [1]. Colorectal cancer (CRC) is the third most common form of cancer (after Lung and Breast) and the fourth leading cause of death among cancers worldwide, after lung, stomach, and liver cancers [34]. CRC gives rise to almost 1.4 million new cases each year [34, 69]. Advances in care and treatment have increased the survival rate for some cancers, but the most important factor for prognosis is early detection, reflected in a 30% reduction in colorectal cancer mortality in individuals enrolled in regular screening programs [105, 165].
The importance of detecting cancer at an early stage is also suggested by the circumstance that 90% of patients diagnosed with stage I CRC survive 5 years, while patients diagnosed with stage II or III cancer have a 5-year survival expectation from 60% up to 70%, which falls to 10% for stage IV [69, 85]. Similar findings have been reported for other cancers, although the exact benefits of screening are still questioned.
In this perspective, a key point of discussion is that despite the widespread availability of multiple options for CRC screening, participation in screening programs remains suboptimal: Over one-third of adults in the US population have not been screened, far below the goal of 80% set by the Centers For Disease Control [97]. In fact, the currently available tests have limitations (e.g., fecal sampling, bowel preparation, procedural risks) that present significant hurdles to participation. On the other hand, blood-based screening, which is usually well accepted, is not well-established for CRC and seems too expensive in comparison with procedures such as fecal occult blood test, although some interesting clues on blood-based assay for CRC screening are emerging (e.g., Septin9 marker) [42].
For all these reasons further efforts are needed to discover and test new biomarkers that can improve the diagnosis, prognosis, and treatment of different types of cancer [20, 40, 95, 134, 139]. Biomarker utilization can be fruitful for early cancer detection and for the deployment of prevention campaigns in an attempt to increase the average survival expectations.
Biomarkers for cancer detection
According to the National Cancer Institute (NCI), part of the National Institutes of Health’s (NIH), a biomarker is “a biological molecule found in blood, other body fluids, or tissues that is a sign of a normal or abnormal process, or of a condition or disease. A biomarker may be used to see how well the body responds to a treatment for a disease or condition. Also called molecular marker and signature molecule.” The World Health Organization (WHO) defines a biomarker as “any substance, structure or process that can be measured in the body or its products and influences or predicts the incidence of outcome or disease” [167]. Others accept a more general biomarker definition, which can be any measurable phenotypic parameter that characterizes an organism’s state of health or disease, or a response to a particular therapeutic intervention [83, 99, 125, 142].
Cancer biomarker investigation dates back to 1847, with the casual discovery in the urine of a multiple myeloma patient [18, 100] of a protein that was subsequently recognized as a tumor-produced free antibody immunoglobulin light chain (aka monoclonal globulin protein). The “Bence-Jones protein” was present in the urine in large quantities and could be revealed by simple heat denaturation. Recently, the Bence-Jones protein was also found in serum [153], and in 1998 a practical immunodiagnostic test was approved by the Food and Drug Administration (FDA) [145]. Nowadays, hormones produced by tumors are also utilized for their detection facility [37]. For instance, Adrenocorticotropic hormone (ACTH), and chorionic gonadotropin (hCG) are elevated in particular cancer types, but they do not achieve the high tumor specificity featured by the Bence-Jones proteins [11, 145].
A systematic approach to finding new protein biomarkers of various cancer types is functional genomics or proteomics, as discussed in [156]. Proteomics is the study of the complete protein complement, or the proteome of the cell. In contrast to the genome, the proteome is dynamic and is in constant flux due to a combination of factors. These include differential splicing of the respective mRNAs, post-translational modifications, and temporal and functional regulation of gene expression [63, 155]. Proteomic technologies allow for identification of the protein changes caused by the disease process with fair to modest accuracy. At the protein level, distinct changes occur during the transformation of a healthy cell into a neoplastic cell, including altered expression, differential protein modification, changes in specific activity, and aberrant localization, all of which may affect cellular function. Identifying and understanding these changes is the underlying theme in cancer proteomics [63, 155].
An important contribution to cancer detection and comprehension has emerged from genetic studies, habitually termed genomics. In fact, it is usually believed that underlying mechanisms at the cellular level are associated with the cancer and promote its development. From a biological standpoint there is a close link between proteomic and genomic cancer biomarkers, since proteins are produced in cells by synthesis driven by the DNA. If an abnormal level of a protein efficiently marks the cancer disease, this protein is presumably produced by some (mutant) cancer cells, being thus associated with one or more gene modifications. Initially, the field of genomics was motivated by the rush to create the first complete map of the human genome. The sequencing of the human genome, along with the development of high throughput technologies, moved the focus to gene expression profiling and the quest to identify genetic signatures of diseases [74]. Many different gene expression profiling technologies are currently in use, including cDNA microarrays, oligonucleotide arrays, and serial analysis of genes [87]. Although molecular mechanisms of tumor genesis are unclear at present, carcinogenic agents could contribute to fields of genomic instability localized to specific areas of the breast. Understanding the functional importance of genomic instability in breast cancer is important for improvement of diagnostic and treatment strategies [61, 143] gave a self-contained account of the role of genomics in the study of breast cancer and its specific biomarkers.
Cancer is also driven by epigenetic changes such as DNA methylation and altered patterns of histone modifications [15, 20, 86, 92, 101, 129]. These processes lead to alterations in the chromatin condensation status there by regulating the activation and deactivation of certain sets of specific genes. Epigenetic embraces all stable changes of phenotypic traits that are not coded in the DNA sequence [16, 66, 140]. Interestingly, epigenetic features affecting gene expression and chromatin organization very often constitute heritable characteristics. Epigenetic inheritance is a critical mechanism that allows a remarkably stable propagation of gene activity states over many cell generations [148]. Recently, the field of epigenetic has received remarkable attention, owing to the awareness that epigenetic inheritance is essential for critical cellular processes such as gene transcription, differentiation, and protection against viral genomes. In a broader sense, epigenetics can be considered as an interface between genotype and phenotype. Epigenetic mechanisms play a critical role in normal physiological responses to environmental stimuli allowing the establishment of appropriate gene expression patterns.
Recent investigations conjecture that exosomes could play an active role in cancer growth and that they could serve as reliable cancer biomarkers [93, 157, 139]. Exosomes are one of the various types of cell-derived vesicles, having a mean diameter between 30 nm and 100 nm, and transporting molecular contents of the cells from which they originate. This last circumstance is the main motivation of the conjectured ability of these entities to map cancer activity and presence. Exosome investigations can be considered as something midway in between genomics and proteomics, and the principal obstacle hindering the utilization of these structures as cancer marker is the complexity of their detection and the related molecular profiling [91].
In recent years, genomics and proteomics have generated many cancer biomarker candidates [135]. Unfortunately, only a few of these markers exhibits superior prognostic or diagnostic ability, and even fewer have been validated and approved. Several factors might play a role in the slow progression of identifying cancer biomarkers. On the one hand, available proteomics technology has limited power to detect low-abundance cancer biomarkers by distinguishing them in the mess of highly abundant plasma proteins, and many of the best markers may hence be missed until recognition technology improves. On the other hand, the ability to verify and validate existing candidate markers (through rigorous testing in large sample sets from many diseases) is limited, and in the past 20 years, fewer than 12 biomarkers have been approved by the US FDA for monitoring response, surveillance or recurrence of cancer [7, 118]. Thus it is even possible that optimal biomarkers have already been proposed but not still validated [81].
A number of books and review papers discuss promising cancer markers, but they often focus on proven or well-developed markers, or specific disease states. The case of an overproduced tumor-specific protein that reliably marks the cancer and can be easily detected is the exception rather than the rule of biomarker research. Hence, in the nearly 160 years since Bence-Jones’ discovery, about ten proteins have been approved by FDA as cancer diagnostic tests, and most of them show poor sensitivity and specificity for cancer.
The process of carcinogenesis, showing opportunities of identifying biomarkers.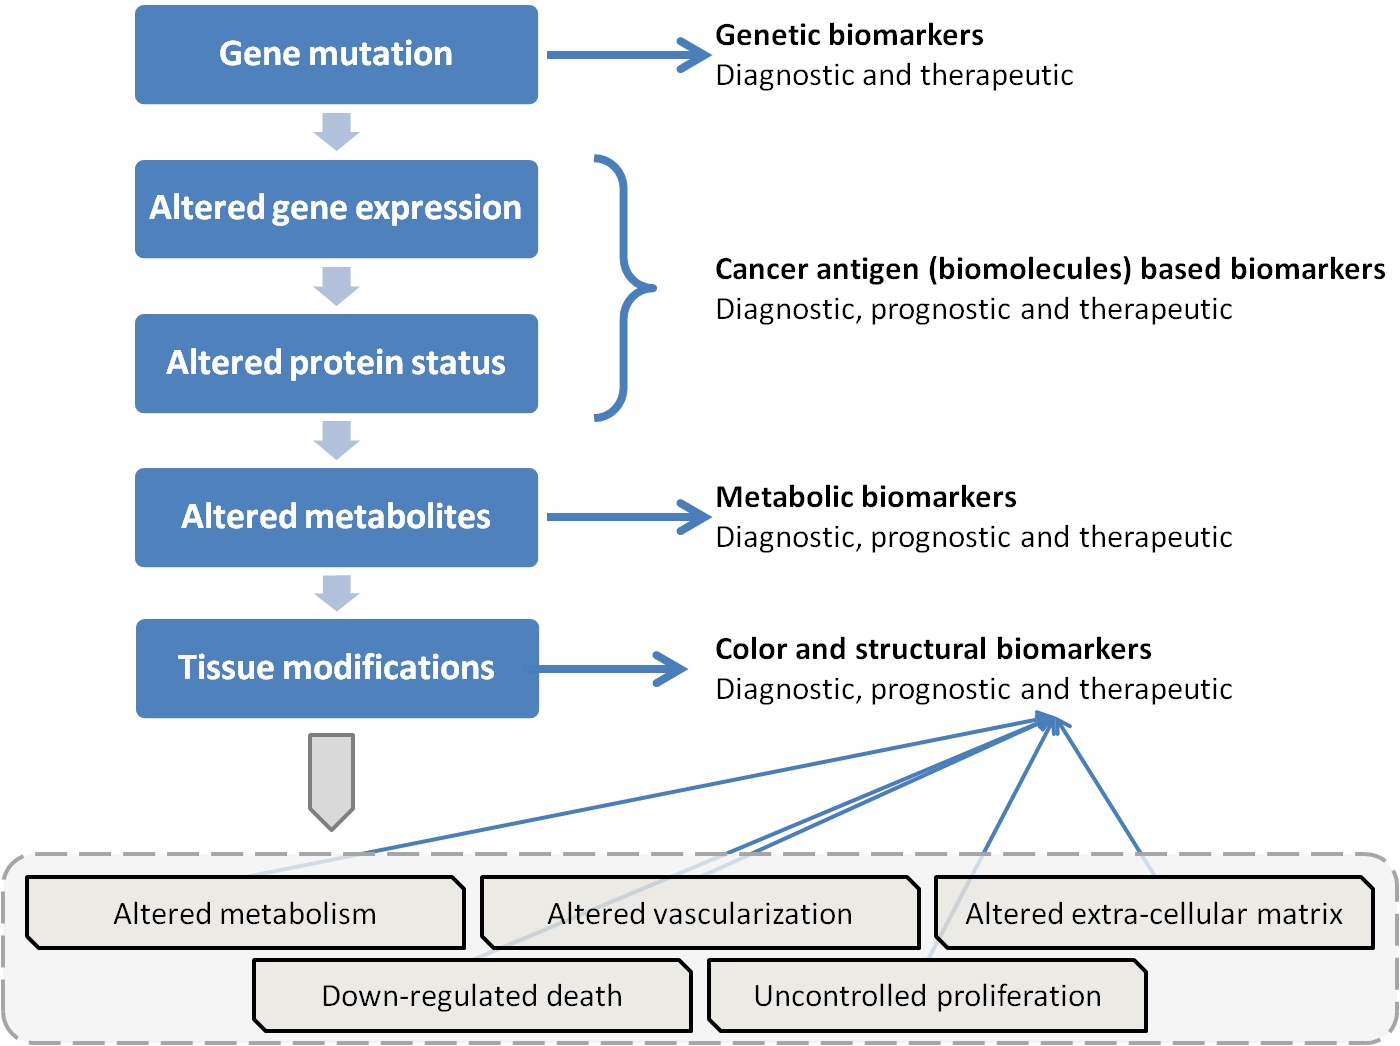
There seems to be a growing consensus that panels of markers may be able to supply the specificity and sensitivity that individual markers lack [46, 69]. A panel combining four known biomarkers (leptin, prolactin, osteopontin, insulin-like growth factor II), none of which used alone could distinguish patients from the controls, achieved a sensitivity and specificity of 95% for the diagnosis of ovarian cancer [127]. In this case a combination of known proteins in a novel panel provided a significant advance. Shen et al. in 2005 [151] identified 299 proteins in tissue culture and then used ELISA to test 13 of the most interesting in serum. They reported that CD98, fascin, the secreted chain of the polymeric immunoglobulin receptor and 14-3-3 eta provide greater sensitivity when used together as a panel than any of the markers used alone.
García-Bilbao et al. have achieved a tentative biomarker consisting in a panel of seven genes capable of correctly classifying cancerous and non-cancerous colon samples [69].
Campbell et al. [32] investigated the ability of eight independent parameters to predict breast cancer morbidity. These parameters were age, presence of lump symptoms, lumpiness, pain, and nipple discharge, signs of cancer, HRT use, and family history. These eight observables gave a 30% improvement in prediction accuracy of breast cancer. As an instance, patients with a breast lump were significantly more likely to have breast cancer than patients without a lump. According to Pedersen and Wandall [134] circulating antibodies produced by the patient’s own immune system after exposure to cancer proteins are emerging as potential biomarkers available for early detection of the disease. An advantage of using autoantibodies as biomarkers is their production in large quantities irrespective of the presence of a relatively small amount of corresponding antigen. Autoantibodies are also expected to have persistent concentrations and long half-lives due to limited proteolysis and clearance.
The discussed background of cancer biomarkers is well-represented by the scheme shown in Fig. 1, which is an extension of a similar picture pointed out by Bhatt et al. [20]. The most important aspects are the strict logical links between genetic mutations, altered gene expressions, modified protein status, and metabolites. At the first level we find genetic biomarkers associated to genetic mutations, while at level two there are epigenetic markers dependent on changed gene transcription. Both these phenomena can give rise to altered protein status (level three), which is followed by altered metabolites in level four. Antibodies and protein biomarkers are located at these two levels.
Nonetheless, additional opportunities of cancer detection have been often neglected in previous studies. These supplementary chances of cancer recognition are related to the possible modifications of tissue structure and its physical properties that could be due to ineffective gene expression, as well as alterations of protein status and metabolites. An important possible relationship between tissues’ physical properties and cancer occurrence can be found at the genotype level. Today various types of hereditary cancers are known, such as hereditary nonpolyposis colorectal cancer (HNPCC) or Lynch Syndrome. The specific gene combinations that are responsible for cancer occurrence in such subjects will also have an effect, although as yet unknown, on the mesenchyme formation and the physical properties of tissues. Therefore, one can expect the presence of some odd or unexpected characteristics of tissues at the phenotypic level, such as the alteration of some physical parameters. The observation or measurement of such changed physical characteristics of tissues might be employed as a marker of cancer or an oncogenesis-related factor. While great effort is being devoted to the emerging landscape of oncogenic signatures across different human cancers [43], the synthesis of such genetic and epigenetic panorama might be summarized in a few physical parameters observable in many tissues of a potential patient with a simple and inexpensive procedure. This reasoning could be weakened by the existence of tumors with no genetic or epigenetic cause, thus unable to affect the structure and physical properties of tissues. And this seems to be the case with most of those malignant neoplasms, which do not have any hereditary component and so are named “sporadic cancers” [107]. However, recent investigations have shown that most sporadic cancers have a deficiency in DNA repair due to mutation in a DNA repair gene, or a deficiency in DNA repair due to epigenetic alterations that reduce or silence DNA repair gene expression [4, 79, 126, 136, 151].
The occurrence of one or both of these deficiencies (genetic and epigenetic) might be in some unknown way be related to specific gene combinations of the affected individuals gene combinations that could influence the physical properties of many biological tissues.
To sum up, cancer clinical biomarkers can be found as changed physical properties of specific tissues as a potential effect of modifications at genetic or epigenetic levels. This new approach to cancer detection has been analyzed in various works [21, 22, 23, 24, 25, 26, 52, 53]. Usually, the physical parameters that are monitored for the purpose of tumor detection are derived from optical measurements carried out over the skin or the mucosa of the patients, at selected anatomical sites. These optical measurements fall into one of the following two main classes: Spectroscopic analysis, and imaging observations, although many experiments are being performed which include the application of hyperspectral imaging devices [9, 10, 113, 115, 119, 120, 121]. In this last case the instrument is able to gather a number of monochromatic images of adjacent spectral bands recording into a single dataset both spatial and spectral features of the observed tissue. Sometimes these two applications significantly overlap each other. Spectroscopic analysis also includes color measurement, a diagnostic tool that is also widely adopted to monitor patients by pulse-oximetry, to evaluate the state of newborns (e.g., the APGAR score) as well as the occurrence of inflammatory states and erythema [59]. There is no precise limit differentiating spectroscopic from colorimetric measurements, since color is strictly dependent on the lower resolution reflectance or transmittance spectrum of the sample.
Various researches [3, 77, 119, 121] have pointed out the ability of Diffuse Reflectance Spectroscopy, often termed as DRS, to measure in-vivo many metabolic and physiologic parameters relevant to define the patient healthiness and possibly to detect cancer structures. The typical DRS instrument is made up of a light source that illuminates the studied anatomical region and a spectrophotometer that measures the radiation retro-diffused by the skin or the mucosa. It is worth noting that the observed radiation is partially originated by the skin or mucosal surface due to the steep change of refraction index passing from the air into the tissue. The other and most important contribution is originated under the tissue surface by back scattering and reflection from underlying fat and bones. Often, but not necessarily, the electromagnetic radiation (i.e. the light) is guided from the source to the observed site, and from this back to the spectrophotometer by a miniaturized optical fiber bundle, thus allowing an easy development of small probes that are employed for noninvasive in-vivo measurements. The DRS instrument collects reflectance spectra of the observed tissue that usually cover the visible and near IR spectral regions [121].
Obviously, the DRS can perform accurate assessment of the total hemoglobin content and hemoglobin saturation. The ability of this method to detect cancer lesions is claimed to be connected to the reduced hemoglobin saturation recorded in malignant tissues [88, 89], and possibly to their modified vascularity mapped by the total hemoglobin content [158, 159].
Transmission spectra of normal and malignant ovarian tissues observed in the IR spectral region (adapted from Mehrotra in 2010) [121].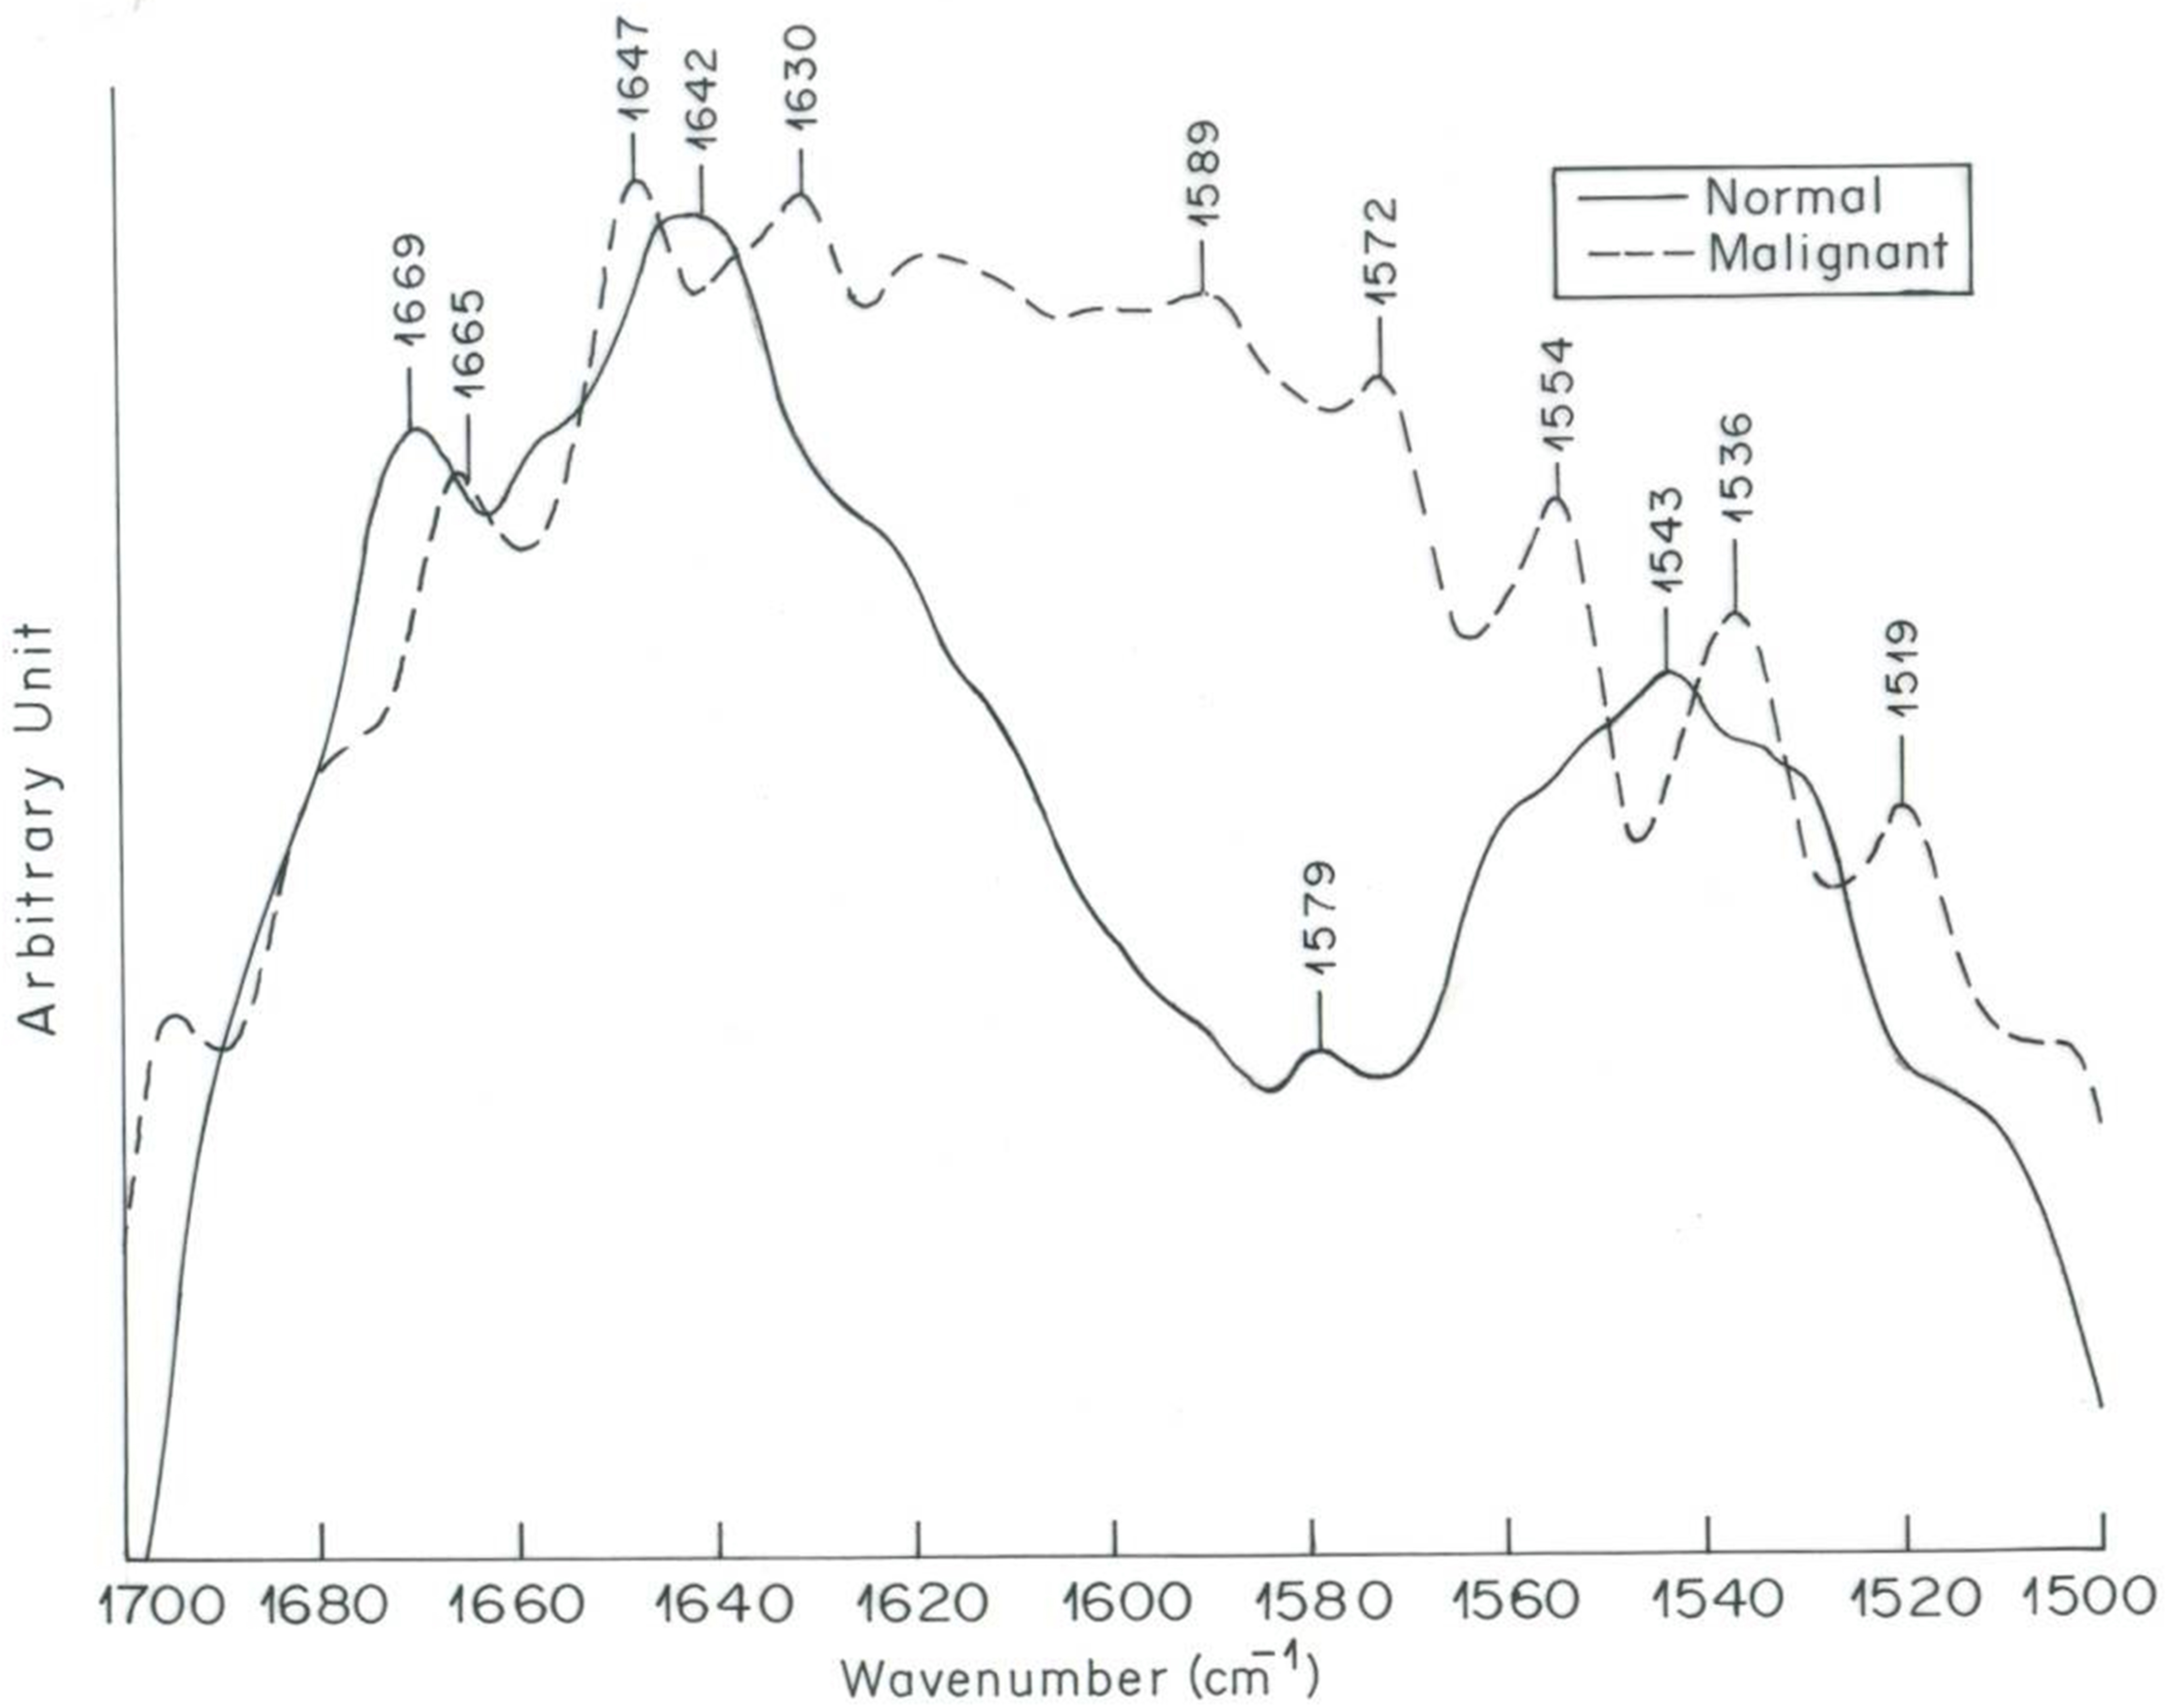
High resolution spectral measurements are usually performed to recognize the spectral signature of selected molecules or substances that are essential to defining the state of a patient. This is the case of infrared (IR) reflectometry whose utilization for assessing a patient’s glycemia has been attempted repeatedly in recent years [119].
Another instance of the detection power of material spectral signatures is represented by the application of infrared spectroscopy from 2
From a physical standpoint the absorbance (transmittance) of tissues at IR wavelengths is mainly related to the vibrational and rotational absorption spectra of molecules embedded in the observed samples (e.g., N-H and C=O stretches). Therefore, the IR transmission of the samples indirectly maps the biological composition of the observed tissues in terms of proteins, peptides, nucleic acids, and so forth. And this map would evidently be able to carefully highlight the presence of an abnormal (e.g., malignant) tissue. Usually, transmittance measurements are performed utilizing a Fourier Transform Spectrometer (FTS), and are referenced to as Fourier Transform Infrared Spectroscopy or FTIR [12, 67, 121, 144, 150, 152, 171]. An FTS instrument does not include any dispersive element such as gratings and prisms, and it is believed to provide the user with measurements of higher Signal-to-Noise Ratio (SNR) than traditional dispersive spectroscopy [12, 39, 67, 171, 138]. However, recent studies in this field have demonstrated that this expectation of a higher accuracy is not realistic and that FTIR measurements would convey a lower information content than dispersive ones [12]. Unfortunately, the above examples of FTIR application to cancer recognition necessarily implies an invasive methodology, reducing its appeal as a diagnostic tool for cancer prevention.
Since the 1990s several attempts have been made to extract physiological information regarding a specific disease from fluorescence spectroscopic data measured in vivo in the skin, head and neck, genito-urinary tract, gastro-intestinal tract, breast, and brain [39, 171]. Fluorescence is a physical phenomenon in which a material that absorbs electromagnetic radiation of short wavelengths (e.g., ultraviolet (UV) radiation at 330 nm of wavelength) emits in response a distribution of radiation of longer wavelengths (e.g., in the red part of the visible spectrum). The exact values of the excitation and re-emission wavelengths depends on the chemical composition of the considered material and its state and conditions (e.g., its temperature). Fluorescence measurements can be made at high temporal resolution, a case that is termed time-resolved fluorescence, or with long integration time that produces steady-state fluorescence data. This technique is believed to be a powerful diagnostic tool of high specificity and sensitivity also for recognizing neoplastic growth in many epithelial tissues [9, 138]. Let us note that fluorescence instruments usually employ a short wavelength light source in order to excite the observed sample. Such a light source is frequently constituted by an UV to NIR laser, hence the measurement technique is called Laser-Induced Fluorescence (LIF). Despite these expectations and results, the best accomplishments involving LIF techniques are related to cancer imaging and management in the infrared spectral range, a domain known as NIRF (Near-infrared fluorescence). One of the best applications relying on this technology is the real-time imaging of even single cancer cells during surgeries, a methodology that could considerably improves surgery results and prognosis [108, 124]. From a biological standpoint important progress has been made with the development of fluorescent nanoprobes, resulting from the integration of nanotechnology with molecular biology. The availability of suitable nanoprobes can improve detection sensitivity and specificity in molecular imaging [124]. “Functional nanomaterial-based molecular probes could target tumors either through the Enhanced Permeability and Retention (EPR) effect of the tumor microvasculature or by specific binding with tumor-associated biomarkers, such as tumor cell receptors, tumor extracellular matrix and enzymes.” [84].
Often spectroscopic measurements (of reflectance, transmittance, and fluorescence) concern a single point or a small anatomical region and do not have imaging ability. An additional characteristic of spectroscopic observations is that they aim at deducing the surface spectral reflectance, or the volume spectral transmittance or fluorescence of a tissue sample. Colorimetric observations can be made even with digital still cameras [102, 103] or similar equipment, and customarily incorporates full imaging capability.
The utilization of digital images of the skin or other tissues can also be aimed at investigating tissue structure and morphology, a case in which the apparent color is a less important feature. This kind of approach can be assisted by original geometrical concepts, such as fractal analysis, and can produce important results in identifying new biomarkers useful for cancer detection [21, 22, 23, 24, 25, 26, 53].
Morphological approaches for the characterization of cancer cell and tissues appearance can be based on quantitative image analysis. These promising techniques could be used as prognostic biomarkers to detect cancer or to follow-up anti-cancer therapies. In effect, quantitative morphometric analysis of shapes of cells and organelles or tissue textures are opening up new areas of interest. Traditional imaging methods can be performed at gross level, by optical or electron microscopy, or directly in the human subject by micro-endoscopy [115, 128, 162], computed tomography or nuclear magnetic resonance. Recently, new technical approaches are gaining visibility such as the Diffuse Optical Tomography (DOT) [17, 168], the Optical Coherence Tomography (OCT) [5, 75, 90, 132, 160, 158, 159], and the multispectral DOT [101]. DOT and OCT measurements collect three dimensional (3d) data volumes that can be organized as a stratification of images at increasing tissue depths. The OCT technique employs a fiber-optic interferometer (e.g. a Mach Zender device) to select the geometrical depth of the tissue layer to be imaged. Instead DOT utilizes the natural propagation of electromagnetic radiation throughout the biological sample in order to retrieve structural 3d information of the observed sample. DOT instrument can also include a pulsed radiation source to improve translucent tissue visibility. Both DOT and OCT can be implemented by means of cheap miniaturized instruments and seems provide clinicians with improved cancer diagnostic ability [30, 48, 70, 115, 159, 168]. Moreover, by virtue of their small size these instruments can be easily adopted for in vivo noninvasive examinations [72]. Multispectral DOT [78, 168] is realized by using light sources of controlled spectrum (color) in order to retrieve multispectral information from the observed tissue. This technique adds spectral information to the diagnostic ability of the basic imaging technique, and retrieve a 4d multispectral image data volume.
Several works [6, 36, 45, 72, 115, 154] utilize the confocal microscopy to recognize neoplastic tissues into the oral cavity. This technique is able to reconstruct 3d panchromatic images of the observed tissue with a spatial resolution of a few microns. Adopting miniaturized optical fiber instruments, the confocal microscopy can even be adopted for in vivo analysis as in [6, 47, 115, 120, 137], and has been adopted to investigate non-malignant tissue disorders like psoriasis [73].
We should note that microscopy may be also performed at the molecular level using immunohistochemistry and immunofluorescence techniques, also providing new potential biomarkers for cancer diagnosis [2, 41, 60, 122, 133].
Cells
Apoptosis disturbance, presence of micronuclei, and shape changes of the nucleus, are some of the most interesting approaches.
Apoptosis
Cancer cells harbor several features that distinguish them from normal cells, one of which is the ability to evade programmed cell death or apoptosis. It is characterized morphologically by chromatin condensation and nucleus destruction, it may be identified step by step by immunohistochemistry [60, 62, 161]. In normal tissues, apoptosis plays a pivotal role in the maintenance of tissue homeostasis and the development of the immune system. Disturbance of this process in tumor cells results in the impaired removal of mutated cells and contributes to tumor progression. In addition, evasion of apoptosis enables malignant cells to escape from tumor immune surveillance and to acquire resistance to cancer therapy. In retrospective studies, the status of the apoptotic pathway in a tumor was shown to be of prognostic value, for example in colorectal cancer, using immunohistochemistry [29], although due to the complex biology of the pathway, a combination of several markers in order to establish an “apoptotic tumor profile” is needed to have a better predictive biomarker [19, 60].
Micronuclei
During cancer cell division, defects in the nuclear lamina, filaments that provide support and stability to the cell’s nucleus cause the nuclear envelope surrounding micronuclei (small, erratic extra nuclei containing whole chromosomes or their fragments) to catastrophically collapse, leading to the loss of basic nuclear functions such as replication, transcription, and DNA damage recognition and repair, and causing the acquisition of one of the hallmarks of cancer such as the development of genomic instability [80]. Immunohistochemistry and immunofluorescent microscopy have recently revealed that in solid tumors more than 60 percent of those micronuclei undergo this dysfunction [82]. The damaged DNA can then enter the next generation of daughter cells and undergo chromothripsis, a rearrangement of genomic information in one chromosome, which leads to massive DNA damage and the formation of tumors. Surely, in pulmonary adenocarcinoma, bone cancer, melanoma and other forms of lung cancer, micronuclei disruption plays an important role in the development of the neoplasia, giving us a new potent quantitative biomarker at the microscopic level.
Interestingly, the micronucleus assay, applied in different human cells, is one of the best validated methods for biomonitoring human populations to evaluate chromosomal damage as well as exposure to carcinogenic agents [27]. Furthermore, there is now solid evidence from molecular epidemiological studies evaluating large cohorts of disease-free subjects that an increased MN frequency in peripheral lymphocytes was associated with an increased risk of cancer at the population level, supporting the notion that this biomarker could be used as an early predictor [28, 29]. In addition, the simplicity and rapidity of the MN assay make it a valuable and useful screening tool for identifying underlying repair deficiencies caused by genetic defects in order to define the development of a predictive multivariate biomarker [55].
Nucleus shape change
Alterations in nuclear morphology are a hallmark of cancer cells. Nuclei of cancer cells divide uncontrollably and contain extra chromosomes. Compared with nuclei in non-cancerous cells, nuclei in cancer cells are larger, closer together and more irregular in morphology. The optical density also appears modified. The changes in cellular and nuclear morphology correlate with clinic-pathological parameters and with the level of expression of oncogenes, for example in melanoma in light microscopy, measuring shape, size and optical density of the nuclei [123], or in Mycosis Fungoides, making use of fractal analysis of the nucleus of lymphocytes present in the skin observed in Transmission Electron Microscopy, to distinguish early cancer status by dermatitis with 100% specificity, as shown in [24]. Moreover, the detection and classification of early cancer through nuclear morphometry may also be performed, for example in breast cancer, making use of the multispectral diffuse optical tomography based on light scattering [78], a novel technique for differentiating benign from malignant lesions.
Tissues
Because histopathological interpretation by the pathologist to distinguish cancer from non-malignant status is subjective and often lacking in sensitivity, many attempts have been made to establish objective methods to perform differential diagnosis by molecular biomarkers identified by immunohistochemistry or by morphometry (classical Euclidean morphometry parameters or, better, reaching higher sensitivity and specificity, by fractal indexes). For example, in oral cancer several molecular biomarkers have been identified by making use of immunohistochemistry or immunofluorescent techniques, for detection of epithelial dysplasia with an increased risk of developing cancer [2] or by fractal analysis of the epithelial-connective tissue interface in the basal cell carcinoma of the skin where a 100% specificity resulted in distinguishing low- and high-risk tumors in order to evaluate their ability to develop metastasis [25], as well in order to distinguish among the different classes of myelodysplastic syndromes, analyzing standard bone marrow Hematoxylin-Eosin slides [23], as shown also by us.
Regarding early detection of cancer or the follow-up of anti-cancer therapies, the morphometry of the microvessel network appears is also able to provide important biomarkers. Healthy vasculature exhibits a hierarchical branching structure in which, on average, vessel radius and length change systematically with branching order. In contrast, tumor vasculature exhibits less hierarchy and more variability in its branching patterns. Regarding changes in vasculature geometric complexity, fractal analysis is emerging as a reliable model for quantifying and describing morphological aspects of microvessels, with potential implications in future clinical and surgical applications, as well as providing indications for anti-angiogenic therapy in pituitary adenoma, glioblastoma multiforme and other malignant brain tumors [57, 58]. To identify a genetic status with high risk of developing neoplasia, fractal analysis of microvessel patterns also appeared successful. An example of this approach in our hands is the analysis of the microvessel network complexity from images of the oral vestibular mucosa, which reveals a network phase transition in HNPCC [53], as well in other genetic diseases [21, 26, 103], as shown by us. Potent mathematical models based on fractal analysis of tumor vasculature are growing in order to perform diagnosis and predict response to cancer therapies [147, 163].
Fractal geometry analysis
Theoretical fractal can be described mathematically as an iterative application of a mathematical equation, or a repeated geometric transformation of a structure. Theoretical fractals have that iterative algorithm repeated at infinite level, so producing a property known as self-similarity. A self-similar structure has the same geometrical properties when observed at different levels or scales.
To understand geometrical fractals, let us consider the example below (Fig. 3).
In the above figure we start our description with a simple equilateral triangle (Initiator) with side length,
In other terms, the 3 generating elements in Fig. 1a can be subdivided into 12 generating elements to form Fig. 1b, and so on.
Natural objects also have the same self-similarity property even if, due to the discrete organization of matter (molecules, atoms, elementary particles), it is present only at certain levels of magnification or scales. Mandelbrot showed that a suitable way to define the fractal property of a natural object, such as a coast line or the texture of a biological tissue, is to extend the “self-similarity” concept utilized for defining with the abstract (theoretical) fractals. A natural self-similar structure has the same appearance and the same geometric properties when examined at various levels of magnification at least two log scales). In this sense this structure is said to be self-similar.
Unlike a smooth line, a fractal curve, which has a dimension between 1 and 2, is irregular or wrinkly. In effect, Mandelbrot’s concept of fractal geometry [164] has improved our ability to characterize natural structures and shapes, bringing essential contributions to the comprehension of complex systems and chaos.
We must consider, also, that the term “fractal” is associated with a curve, a surface or any other geometrical domain that subtends the mathematical property of this entity of having fractional dimensions. In effect, this concept characterizes the fractal geometry and distinguishes it from traditional Euclidean geometry, in which any object must have integer dimension. More irregular or wrinkly is the border of a natural object and higher is its fractal dimension, which may be described as the space-filling property of an object.
The Koch (mathematical) fractal set. (a) Initiator, a simple equilateral triangle with side length 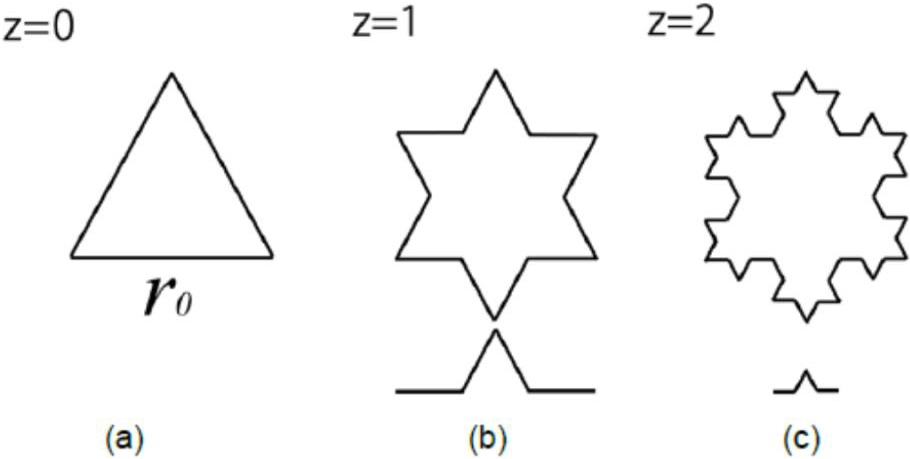
An histologic image of the bone marrow in a healthy subject (top) and its skeletonized contours (bottom). Hematoxylin-Eosin, X50.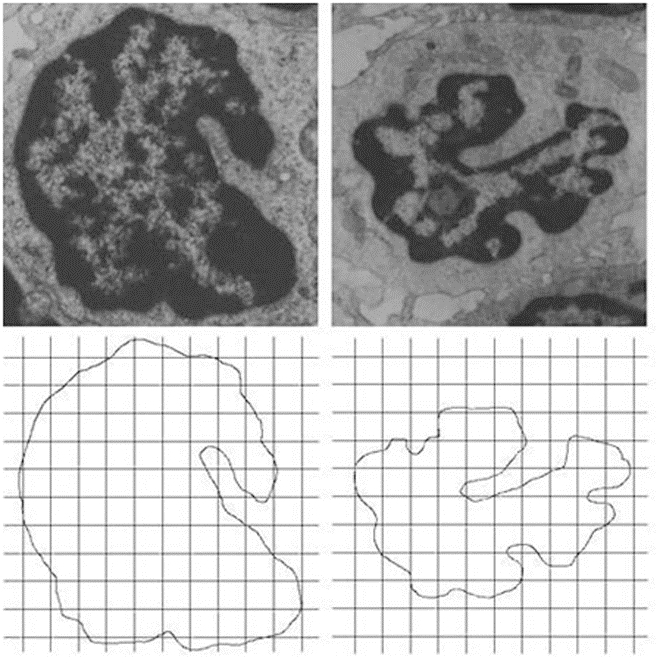
Natural structures having fractal appearance have been found in a variety of natural and biological entities: River deltas, trees, or, in the human body, cardiopulmonary structures, the ramifying tracheo-bronchial tree, the His-Purkinje network [71] the cardiac muscle bundles [14], as well as the placenta’s arterial. The meaning of these fractal structures in the human body is profound. The self-similar tracheo-bronchial tree provides an enormous surface area for exchange of gases at the vascular-alveolar interface, coupling pulmonary and cardiac functions. For vasculature, fractal branching provides a rich network for distribution of nutrients and oxygen, as well for collecting metabolic waste products [71]. A variety of other organ systems contain fractal structures that have particular functions, e.g., the fractal organization of connective tissue in the aortic leaflets relates to the efficient distribution of mechanical forces. It is worth noting that Mandelbrot also developed the mathematical branch known today as “fractal analysis”, which extends calculus to the concept of fractal geometrical dimension.
The first application of fractal geometry has been applied to histopathology, cytopathology, and other biomedical domains [109, 146]. Today, we know that is possible to make differential diagnosis between the early stage of tumors and flogosis [34] or among the different stages of Basal Cell Cancer [25], as well as to investigate the subtle alterations of the nuclear patterns in human breast tumors [111] or evaluate brain tumors [56]. Fractal analysis showed a high ability for automatic classification of cancer cells in urinary smears [65], as well as to identify prostate cancer cells [169]. Fractal analysis has been shown able to provide quantitative information on the link among molecular, cellular and histomorphological tissue changes in the development of tumors [110, 112].
In effect, to day, basic researchers and clinicians are aware of the remarkable importance of the fractal approaches in the morphological study of cells and tissues. The fractal dimension analysis may be seen as a useful objective tool in describing tissue complexity providing information for understanding pathological changes. The fractal dimension is a real-valued index, which scores the space-filling properties of an object [117]. The most commonly used methods for measuring the fractal dimension in the field of life sciences and biomedicine [21, 22, 23, 24, 25, 26] are the mass dimension, the fractal dimension of the minimum path and the box-counting dimension (perhaps the easiest to implement [64, 96].
Log-log plot of the outlines of the bone marrow in acute leukemia. Outlines of the contours present in the histologic images of the bone marrow in an acute leukemia in a X40 microscopy image (left picture), and its log-log plot (right picture). The slope of the plot is the fractal dimension (D 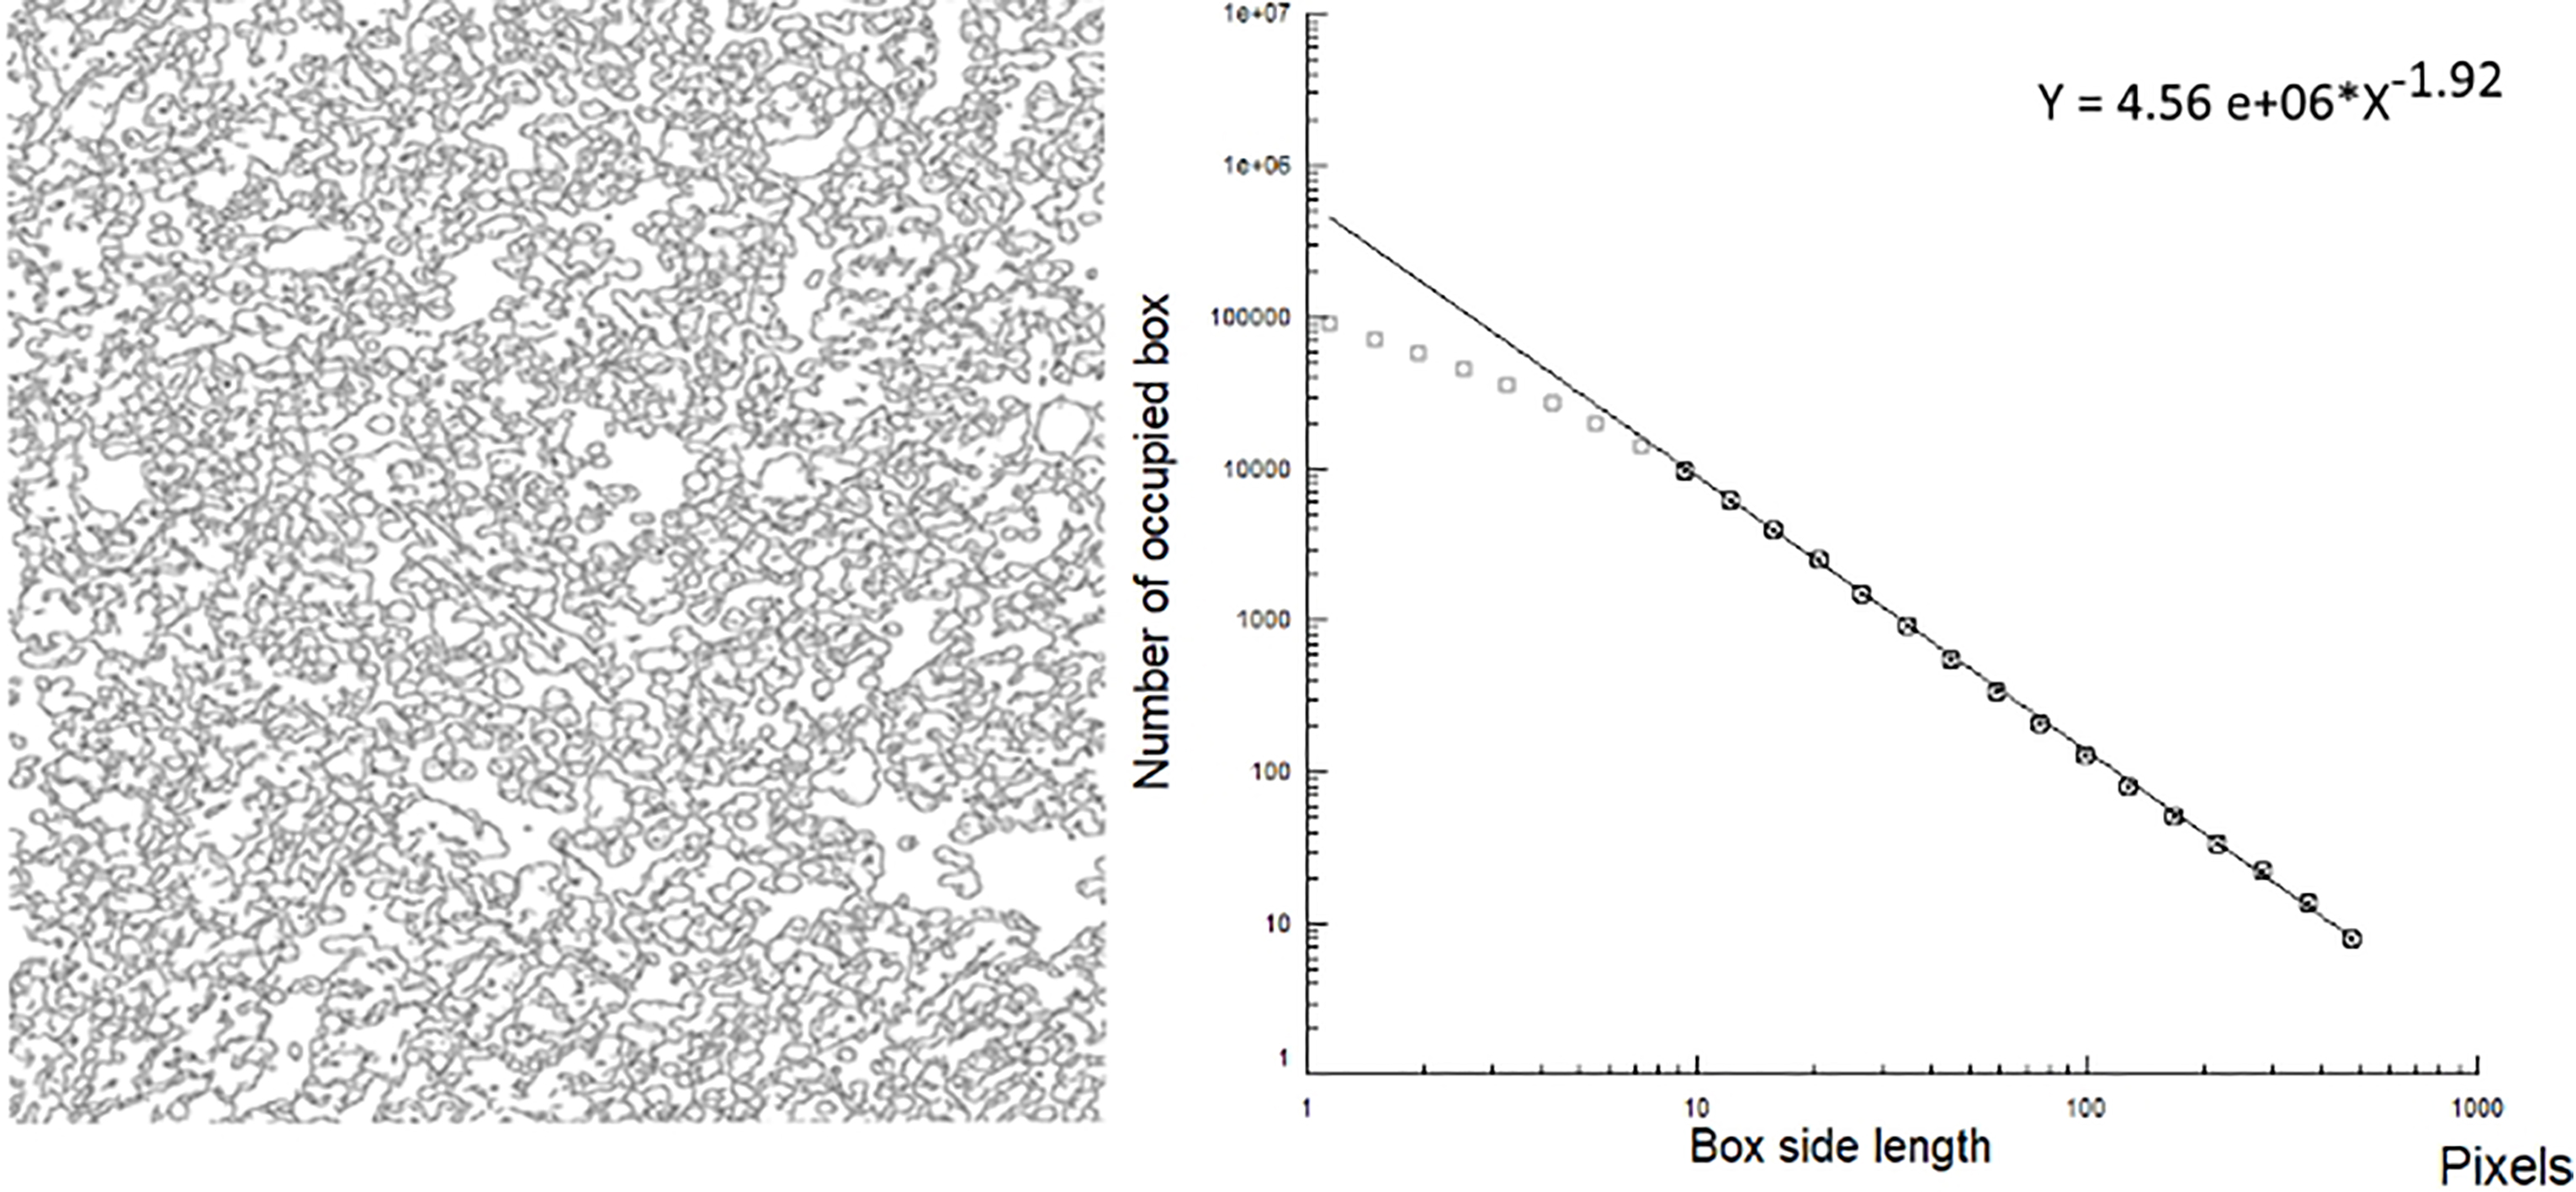
The slope of the log log plots (fractal dimension, D or space-filling properties of an image) is lower in an healthy tissue (left, prostate, 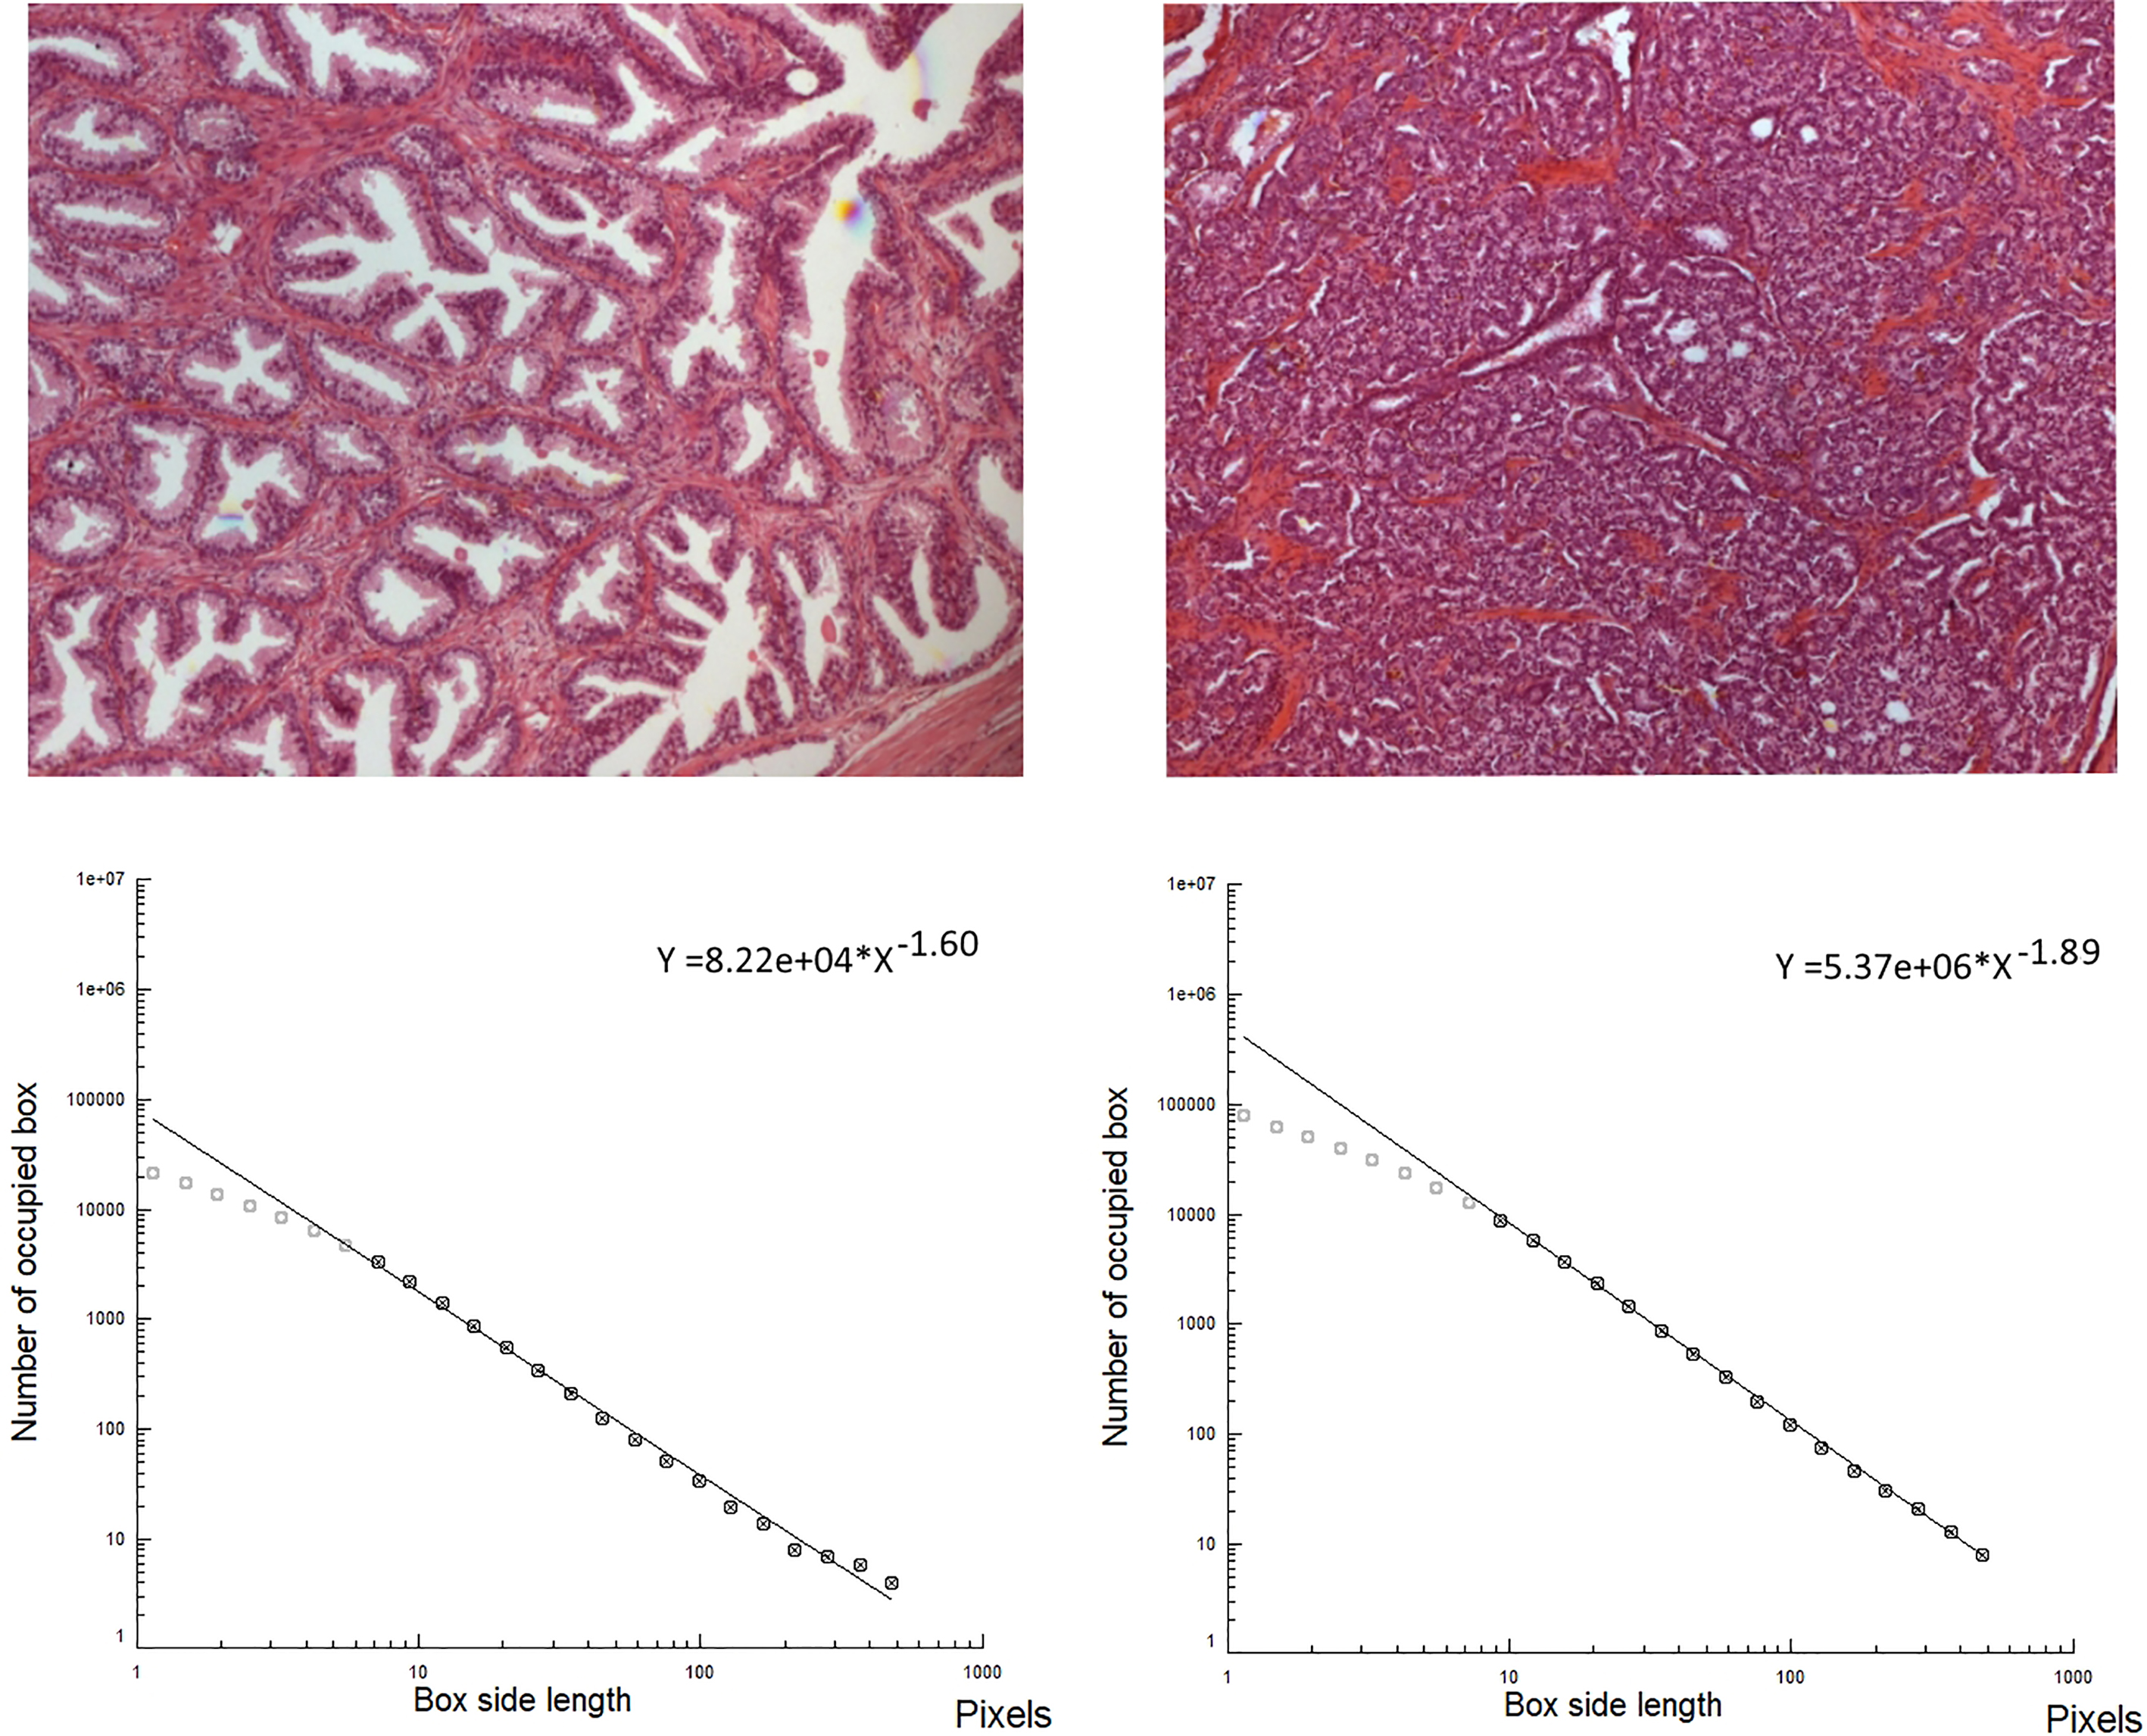
Fractal analysis of the angiogenetic pattern in stage IA pulmonary adenocarcinoma, histologic images. Fractal dimension of the microvascular network, its geometric complexity, is higher when the prognosis is worse for each growth pattern [114]. Group 1: 10 patients who developed distant metastasis within the first 36 months after surgery; Group 2: 10 patients free from disease after a follow up 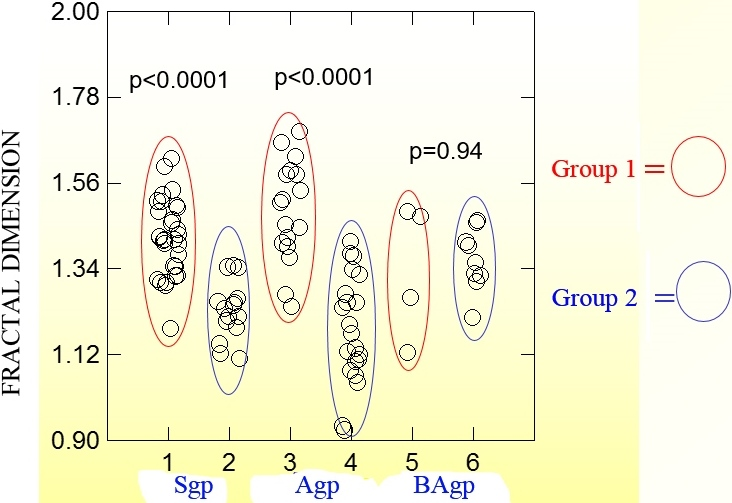
Performing the box-counting technique, target contours are extracted by means of a specific image- processing algorithm (Fig. 3), then this skeletonized image is superimposed over a grid (lattice) constituted by
Figure 4 shows a biologic image, the bone marrow in a healthy subject and its skeletonized contour. Figure 5 shows the Log-log plot of the contours revealed in a bone marrow image, at histological level, in an acute leukemia subject. Figure 6 shows the log log plot in a healthy tissue and in a malignant tissue (prostatic cancer).
Microvascular complexity in cancer
Performing fractal analysis of the angiogenetic pattern in stage IA pulmonary adenocarcinoma surgically resected link fractal dimension of the microvascular pattern to prognosis (Fig. 7). This tumor shows a lower fractal dimension in patients free from disease at 96 months than in patients with metastasis within 36 months; the fractal dimension of the microvascular network (its geometric complexity) is higher when the prognosis is worse [114].
The fractal dimension appeared able to accurately describe the altered microvascular complexity of the oral mucosa revealed in cancer-related diseases [53, 114] and in several genetic diseases [21, 26]. Figure 8 shows the outcome from a pilot study of a cancer-related genetic disease (HNPCC or Lynch syndrome); the oral mucosa has a higher geometric complexity of the microvascular network in comparison to healthy subjects of the same ages and sex [53]. This greater geometric complexity of the microvascular network in the cancer-related genetic disease could be linked to changes in the extracellular matrix (ECM); it is indicated by high values of the microvessel network geometric complexity observed by us in other pathological conditions where changes in the ECM have been described [50, 52, 53] and supported by the modifications of the oral mucosa light reflectance spectra observed in the HNPCC.
Fractal analysis of the microvessel pattern. Oral mucosa is photographed (top, left), and a small portion of it is enlarged (top right, healthy subject). Vessels are extracted: microvessel pattern in a healthy subject (bottom, left), and in a HNPCC patient (bottom, right). Geometric complexity is increased in the HNPCC patients: fractal analysis permits exact quantification of the modified pattern in the cancer-related condition (table below, D calculated for low and high scale, left and right respectively [21, 53]).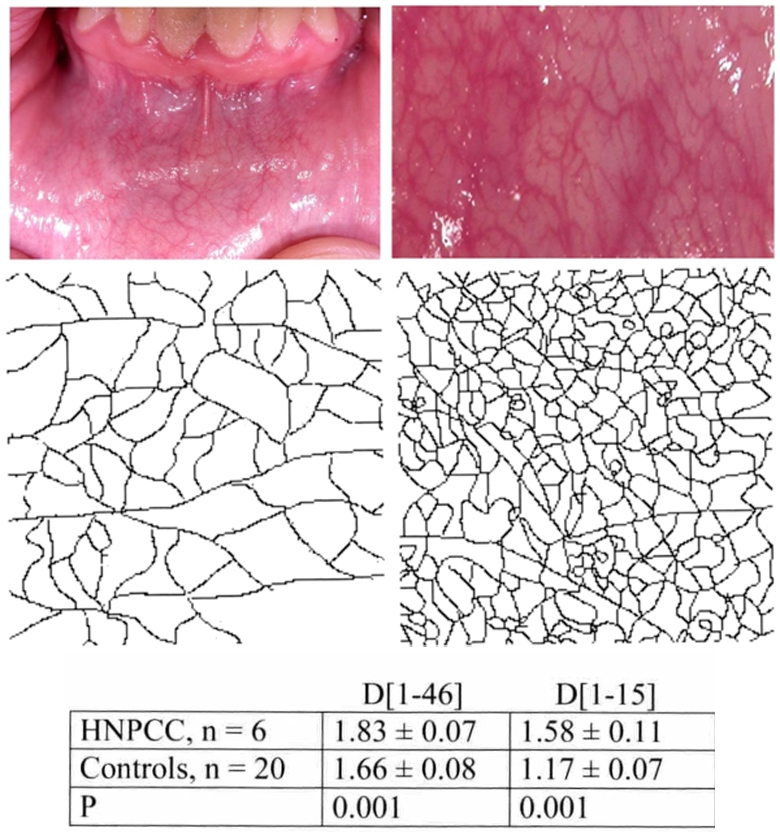
Comparison of oral mucosa light reflectance spectra between hereditary non-polyposis colorectal cancer (HNPCC) carriers and controls, both including and excluding blood vessels. Subtraction of blood vessels results in an increase in the reflectance values between 480 and 600 nm, without showing any difference between HNPCC and controls (after [35]).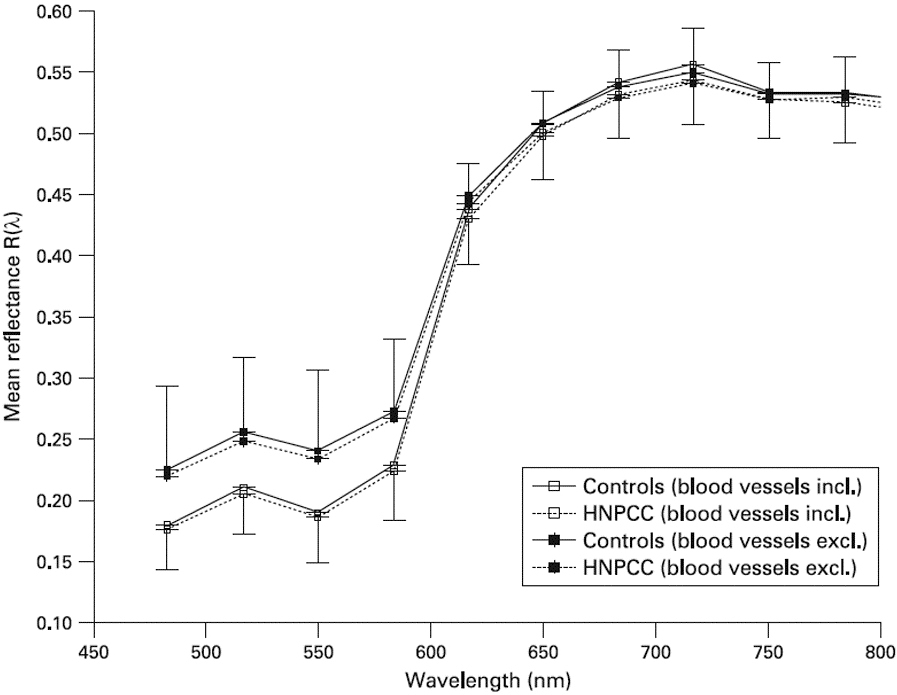
ROC curve. Y axis 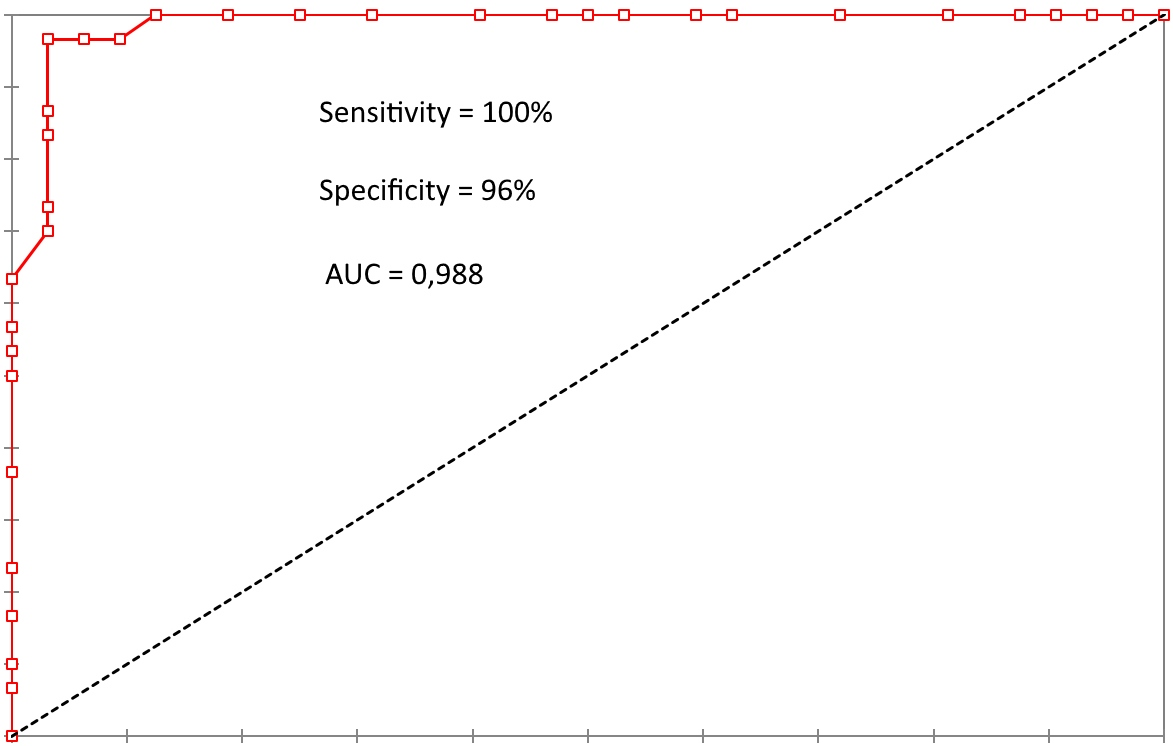
Early cancer diagnosis can be made using screening tests [31, 76]; therefore, identification of novel and reliable biomarkers for life-threatening cancers is a priority in clinical medicine [8, 95, 130]. In this context, color may be a useful parameter in clinical medicine [49]; in fact, the radiation emitted or reflected by an object is known to provide relevant information about its physical state and chemical composition [13, 38]. Some years ago we identified color changes in oral mucosa in HNPCC carriers [54]. In this regard, Extracellular Matrix (ECM), a major component of the cellular microenvironment, is an essential physical factor in establishing the resulting color of a tissue. Statistically significant lower oral mucosal spectral reflectance of HNPCC carriers has been observed in the 590700 nm wavelength range (
Nonetheless it should be noted that although the difference is smaller than the one reported by [50], also in the paper by [35], the reflectance exhibited by HNPCC carriers is slightly lower with respect to controls, and such difference is systematic and increases with increasing the wavelength. In our opinion such difference is intriguing, and could reflect a very different optical behavior.
A more recent study [102] found a similar connection between various types of cancer and the color of the gingival and vestibular oral mucosa [141]. Once again these observations point out the relevance of the modalities of signal source acquisition for the subsequent interpretation. Further data are needed before considering a widespread, routine utilization of this phenotypic marker.
Discussion
The ability of these new approaches towards morphology or physical properties in order to perform differential diagnosis is huge.
For what concerns imaging, let us show the sensitivity equal to 100% and specificity equal to 96% in a comparison between a prostatic cancer (Gleason index
We would underline, in particular, that the data discussed here indicate the diagnostic ability of these new clinical physical and structural biomarkers in oral mucosa for identifying HNPCC carriers.
To date, the mechanisms underlying the observed data are unknown. We advanced the hypothesis that the above mentioned findings may be the result of a subclinical extracellular matrix (ECM) abnormality. It is well-known that ECM is constituted by different composite structures; it is a substance produced by cells and secreted into the intercellular environment, which contains various amounts of collagen, and chromophores actually transported in the blood. ECM plays an important role in modulating the behavior of the cells, interacting with and influencing their behavior. A number of families of ECM proteins are known, including collagens, proteoglycans, and laminins. As the chemical composition of ECM plays a pivotal role in cellular and tissue development, regeneration, and differentiation, ECM may play a crucial role in several human pathophysiological processes, including cancer [50, 53, 102].
In particular, ECM is a natural barrier that can prevent cancer development, which is a complex process that relies on interaction and communication between a number of cellular compartments [98, 106]. In fact ECM is a major component of the cellular and tumor microenvironment and a significant contributor to cancer progression. In this regard it is well-known that tumors are characterized by ECM remodeling and stiffening and ECM proteins are essential in the regulation of tumor angiogenesis [33, 131]. Moreover, cancer-produced ECM proteins can be key elements in cancer growth and metastasis. As a consequence, these observations suggest that ECM degradation, facilitating tumor development, may derive from the tumor itself or the tumor microenvironment [104].
The new potential clinical biomarkers derived from spectroscopic and colorimetric measurements or mucosa imaging are particularly interesting because they imply non-invasive, easily applicable and cheap methodologies. Similar conclusions have also been pointed out by other works [88, 89, 141]. In the near future, it would be beneficial to use these procedures as screening tools for cancer detection. However, the technology embedded in these applications needs to be improved in order to facilitate their widespread application for cancer detection and screening campaigns. However, let us note that these possible clinical biomarkers have already shown their importance for early detection of cancer, thus increasing their relevance, prognostic utility and potential.
Footnotes
Acknowledgments
We wish to dedicate this work to the memory of two friends who actively collaborated in the development of the methodology and its application, i.e., Prof. Ricardo Laurini (Tromsø, Norway) an unforgotten friend who inspired our research on the subject and Mr. Roberto Casini (Prato, Florence) who supported with his farsighted vision our preliminary applications of the concepts behind this review.