Tumor-infiltrating lymphocytes (TILs) have a strong prognostic value in various forms of cancers. These data often refer to use of the pan-T cell marker CD3, or the cytotoxic T lymphocyte marker CD8. However, T cells are a heterogeneous group of cells with a wide array of effector mechanisms ranging from immunosuppression to cytotoxicity.
OBJECTIVE:
In this study we have investigated the prognostic effects of some unconventional T cell subtypes in breast cancer; T cells, IL-17 T cells and FoxP3 T cells (T) in relation to the conventional CD3 and CD8 T cell markers.
METHODS:
This was done using immunohistochemistry on a human breast cancer tissue microarray consisting of 498 consecutive cases of primary breast cancer.
RESULTS:
Infiltration of T cells and T cell infiltration in general (CD3), correlated with a good prognosis, while T infiltration with a worse. Infiltration of T cells was associated with a significantly improved clinical outcome in all breast cancer subtypes except triple negative tumors. Only infiltration of either CD3 or CD8 cells was independently associated with better prognosis for all breast cancer patients.
CONCLUSIONS:
This study sheds further light on the prognostic impact of various T cell subtypes in breast cancer.
Breast cancer is a heterogeneous disease consisting of different subtypes with varying prognosis [1]. It is however not only the breast cancer subtype that determines the prognostic outcome, but also the tumor microenvironment cell composition [2]. The cells of the immune system are an important part of the tumor microenvironment, where presence of tumor infiltrating lymphocytes (TILs) usually is associated with a better prognosis, while infiltration of myeloid cells is associated with a worse prognosis [3]. T lymphocytes is an important TIL population [3]. In breast cancer, infiltration of T cells has been linked to different outcomes in different breast cancer subtypes. In HER2 and triple negative breast cancers (TNBCs; ERPRHER2), infiltration of T cells has been associated with an improved prognosis [4], a finding that was even more evident in patients receiving neoadjuvant chemotherapy [5, 6, 7]. It has been postulated that this effect may be due to tumor cell death and expression of neoantigens that initiate tumoricidal immune responses [8, 9].
Correlations between CD3, T cell subtypes and breast cancer molecular subtypes
Breast cancer molecular subtypes
CD3
T cells
Treg
IL-17 T cells
CD8
Triple-negative
Correlation coefficient
0.181**
0.107*
0.216**
0.125**
0.151**
-value
0.001
0.03
0.001
0.012
0.001
407
412
401
404
493
Luminal A
Correlation coefficient
0.131**
0.116*
0.234**
0.021
0.05
-value
0.008
0.018
0.001
0.678
0.267
406
411
400
403
492
Luminal B
Correlation coefficient
0.000
0.034
.052
0.006
0.033
-value
0.996
0.493
0.303
0.904
0.462
406
411
400
403
492
HER2
Correlation coefficient
0.144**
0.137**
0.231**
0.023
0.033
-value (2-tailed)
0.004
0.005
0.001
0.650
0.466
406
411
400
403
492
ER status
Correlation coefficient
0.234**
0.182**
0.300**
0.096
0.119*
-value
0.001
0.001
0.001
0.054
0.008
408
413
402
405
498
Spearman’s rho. 2-tailed -value.
T cells can grossly be divided into cytotoxic T lymphocytes (CTLs; CD8), T helper cells (T [T, T, T, T, T and T]; CD4), T cells and NKT cells [10]. Regulatory T cells (T) are defined as CD4 CD25FoxP3 T cells, and T cells as CD4RORt T cells with high production of the pro-inflammatory cytokine; IL-17A [10, 11]. T are associated with immune suppression [12] and infiltration of T in ER breast cancers has been shown to correlate with a worse prognosis [4, 13], while studies regarding the prognostic effects of T infiltration in breast cancer are limited [14, 15, 16]. When it comes to CTLs, infiltration of CD8 lymphocytes does not seem to have a prognostic impact in ER breast cancer, but has been shown to correlate with an improved breast cancer specific survival (BCSS) in ER-negative tumors [17]. T cells are unconventional T cells that express invariant, canonical TCR and TCR chains. They are either CD4CD8 or express CD8 homodimers, and recognize antigen in an MHC/HLA independent manner [18]. The fact that T cells often express CD8 puts previous studies concerning the prognostic value of CD8 CTLs in breast cancer in a different light. T cells are T cells with dual functions and can thus be both tumor promoting and suppressing [19]. In breast cancer, T cell infiltration was reported to be associated with the HER2 subtype and poor prognosis in a small patient cohort [20]. However, contrasting data have been shown in recent publications where elevated expression levels of genes associated with T cells had a positive impact on patient survival [21, 22].
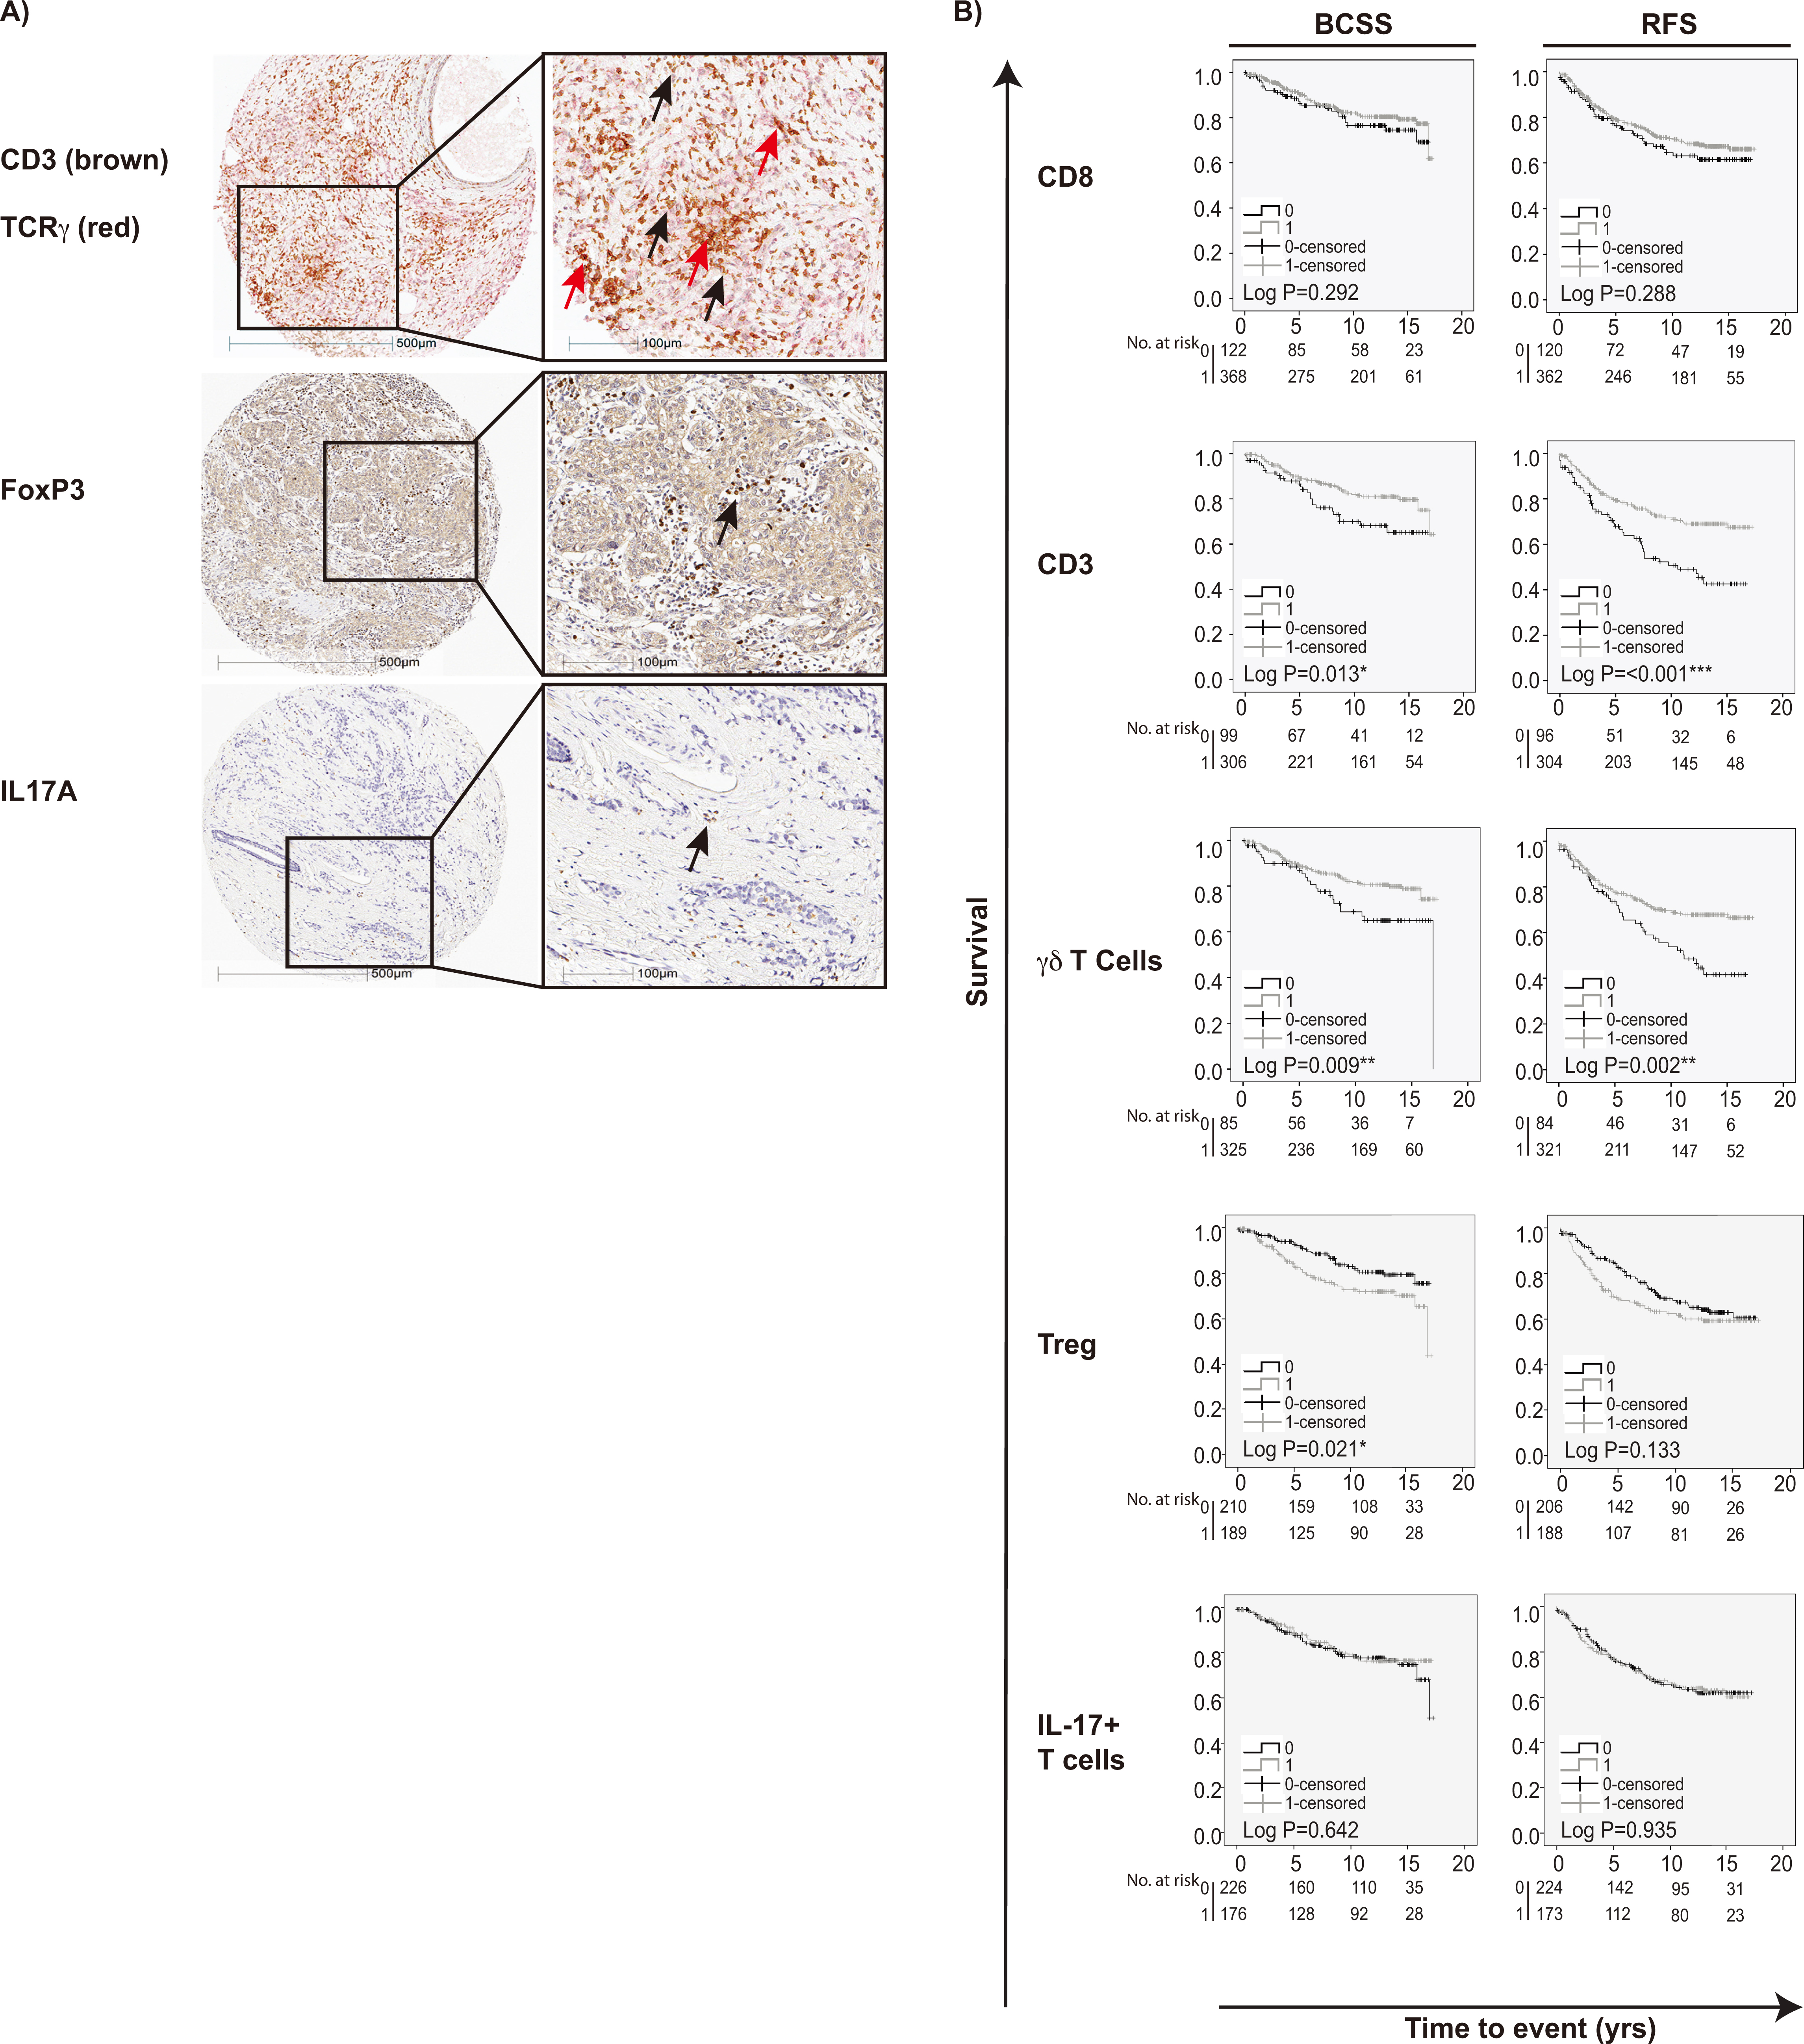
IHC staining of T cell subpopulations in breast cancers and association to survival outcome. A) IHC stainings in breast cancer TMA showing CD3; brown staining, TCR; red membranous staining, FoxP3; brown staining and IL-17; brown staining. B) BCSS and RFS according to the infiltration of pan-T cell marker CD3, cells, T and IL-17 T cells. Log-rank value 0.05 was considered significant.
There are many reports concerning the prognostic and predictive impact of infiltrating T cells on breast cancer survival, but often only CD3, CD8 or FoxP3-positive T cells have been evaluated [23]. Furthermore, the T cell subpopulations T cells, T cells and T all have been reported to have dual and opposing effects in different tumor types, therefore making them important to study for each cancer type [24, 25]. Also, the presence of IL-17 T cells has lately been proposed thus complicating the T nomenclature [26]. In this study, we therefore decided to evaluate the prognostic impact of infiltrating T cells, IL-17 T cells and FoxP3 T cells (T), as compared to the conventional TIL markers CD8 and CD3 T cells, in tumors from a retrospective, consecutive cohort of 498 patients with primary breast cancer [27]. Our findings highlight the prognostic effect of each T cell subpopulation in breast cancer and will be important for the future understanding and use of novel drugs like immune checkpoint inhibitors in this disease.
Materials and methods
Breast cancer patients
The study cohort has been previously described [27, 28, 29, 30] and included 498 patients that were diagnosed with invasive breast cancer between 1 January 1988 and 31 December 1992 at the Department of Pathology, Skåne University Hospital, Malmö. Patient characteristics are provided in Supplementary Table 1. Ethical approval for this study was obtained from the Ethics Committee at Lund University (Dnr 613/02). Informed consent was not required and patients were offered the option to opt out.
Crosstab for CD8, FOXP3, IL-17 and TCR expression in breast cancer
T cells
0
1
-value
Numbers (all breast cancers)
CD8 T cells
0
31
70
1
52
257
0.003**
FOXP3 T cells
0
62
142
1
20
169
0.001***
IL-17 T cells
0
47
173
1
33
143
0.520
Numbers (HER2)
CD8 T cells
0
2
1
1
0
20
0.001***
Pearson’s -test.
TMA, immunohistochemistry and staining assessment
Tissue microarrays (TMA) were constructed as previously described [27, 28, 29, 30]. Analysis of ER, PR and HER2 status of the tumors in the TMA, was performed according to current Swedish guidelines. For antibodies and staining procedures see Supplementary Table 2. Anti-TCR specificity was evaluated using sorted peripheral blood T cells as positive control (Supplementary Fig. 1). CD3 and TCR were manually annotated using a semiquantitative scoring system and denoted as 0 none, 1 low, 2 moderate and 3 high in each core. CD8 had been scored previously [31]. The total number of IL-17 and FoxP3 positive cells with lymphocytic morphology was annotated in each core using automated image analysis (Halo image analysis software, Indica Labs, Corrales, NM, USA). The total number of positive cells was then manually categorized as 0 none, 1 low, 2 moderate and 3 high. The core with the highest number of positive cells within each case was used in the subsequent statistical analyses.
Statistical analysis
Spearman’s Rho test was applied using non-dicho- tomized CD3, TCR, FoxP3 and IL-17 scoring for associations between T cell populations and breast cancer subtypes. For all other analyses dichotomized variables were constructed; CD3 was dichotomized into low (0, 1) or high (2, 3), TCR into absence (0) or presence (1, 2, 3), FoxP3 into low (0, 1) or high (2, 3) and IL-17 into low (0, 1) or high (2, 3). Pearson -test was used for crosstabs. Kaplan-Meier analysis was used to evaluate the impact of different T cell populations on breast cancer specific survival (BCSS) and recurrence free survival (RFS). Log rank test was applied to analyze any significant differences in Kaplan-Meier survival plots. Cox regression proportional hazards analysis was used to obtain hazard ratios (HR) for BCSS and RFS according to CD8, CD3, TCR, FoxP3 and IL-17 density in both uni- and multivariable analysis, adjusted for dichotomized clinicopathological parameters (age, lymph node metastasis, tumor size, Nottingham histological grade [NHG], ER status, HER2 status, triple negative, luminal A and luminal B), and Ki67. All P values were two-tailed. P value 0.05 was considered significant. All calculations and statistical analyses were performed with IBM SPSS Statistics version 23.0 (SPSS Inc).
Results
Infiltration of alternative T cell subpopulations and associations to molecular subtypes of primary breast cancer
Representative staining patterns of the analyzed T cell-subpopulations and correlations between different T cell populations and breast cancer subtypes are shown in Fig. 1a and Supplementary Fig. 1.
As shown in Table 1, infiltration of CD8 positive cells correlated positively with TNBC and inversely with ER-positive breast cancers. Infiltration of both CD3 and T cells was associated with TNBC and HER2 breast cancers, but inversely associated with both the luminal A subtype as well as with ER-positive breast cancers. T infiltration was associated with the TNBC and HER2 breast cancers, but inversely associated with both the luminal A subtype and ER-positive breast cancers. IL-17 T cell infiltration was inversely associated with the TNBC subtype. It is known that T cells can express CD8 homodimers [18], but also IL-17A and the transcription factor FoxP3 [19]. As shown in Table 2, there was a significant correlation between CD8 and TCR ( 0.003), as well as for FoxP3 and TCR ( 0.001), but not with IL-17 expression and TCR (Table 2).
Univariable Cox regression analysis for BCSS and RFS
BCSS
RFS
HR (CI 95%)
-value
HR (CI 95%)
-value
Univariable Cox regression analysis with no stratification
CD8
0
1.00
122
1.00
120
1
0.78 (0.49–1.24)
0.29
368
0.82 (0.56–1.19)
0.29
362
CD3
0
1.00
99
1.00
96
1
0.56 (0.35–0.89)
0.015*
306
0.50 (0.35–0.72)
0.001***
304
T cells
0
1.00
85
1.00
84
1
0.53 (0.33–0.86)
0.01**
325
0.56 (0.38–0.81)
0.002**
321
Treg
0
1.00
210
1.00
206
1
1.67 (1.08–2.60)
0.022*
189
1.30 (0.92–1.83)
0.134
188
IL-17 T cells
0
1.00
226
1.00
224
1
0.90 (0.58–1.40)
0.643
176
1.02 (0.72–1.44)
0.935
173
Univariable Cox regression analysis stratified for treated patients
CD8
0
1.00
38
1.00
37
1
0.47 (0.25–0.88)
0.019*
120
0.58 (0.34–0.99)
0.044*
120
CD3
0
1.00
39
1.00
39
1
0.72 (0.37–1.39)
0.324
106
0.59 (0.35–0.99)
0.046*
105
T cells
0
1.00
34
1.00
34
1
0.53 (0.28–1.01)
0.054
115
0.59 (0.35–1.02)
0.058
114
Treg
0
1.00
74
1.00
73
1
1.22 (0.66–2.27)
0.528
68
1.20 (0.73–1.98)
0.469
68
IL-17 T cells
0
1.00
89
1.00
88
1
0.98 (0.52–1.85)
0.952
56
0.96 (0.57–1.62)
0.886
56
Univariable Cox regression analysis stratified for untreated patients
CD8
0
1.00
56
1.00
55
1
0.84 (0.35–2.01)
0.69
161
0.71 (0.39–1.31)
0.28
160
CD3
0
1.00
38
1.00
37
1
0.35 (0.14–0.87)
0.023*
130
0.36 (0.20–0.68)
0.002**
130
T cells
0
1.00
32
1.00
31
1
0.50 (0.20–1.30)
0.157
137
0.46 (0.24–0.89)
0.021*
137
Treg
0
1.00
84
1.00
83
1
2.59 (1.00–6.67)
0.050*
81
1.23 (0.67–2.24)
0.502
81
IL-17 T cells
0
1.00
86
1.00
86
1
1.02 (0.43–2.37)
0.988
80
1.23 (0.67–2.26)
0.501
79
Abbreviations: BCSS. breast cancer specific survival; RFS. recurrence free survival; HR. hazard ration.
Multivariable Cox regression analysis for BCSS and RFS with no stratification
BCSS
RFS
HR (CI 95%)
-value
HR (CI 95%)
-value
Age (yrs)
50
1.00
52
1.00
52
50
0.44 (0.22–0.87)
0.019*
263
0.65 (0.38–1.13)
0.124
261
Lymph node status
Negative
1.00
182
1.00
181
Positive
6.53 (3.43–12.41)
0.001***
133
2.58 (1.69–3.95)
0.001***
132
Ki67 grade
0–10
1.00
120
1.00
120
11– 25
2.27 (1.08–4.76)
0.031*
195
1.46 (0.89–2.39)
0.131
193
Size (mm)
20
1.00
186
1.00
186
20
2.13 (1.22–3.73)
0.008**
129
1.55 (1.02–2.36)
0.039*
127
NHG
I and II
1.00
208
1.00
208
III
2.59 (1.34–5.02)
0.005**
107
2.46 (1.51–4.00)
0.001***
105
HER2
Negative
1.00
299
1.00
297
Positive
0.79 (0.21–2.96)
0.722
16
1.26 (0.44–3.66)
0.666
16
Triple negative
Negative
1.00
291
1.00
289
Positive
6.06 (1.32–27.70)
0.02*
24
13.36 (2.78–64.31)
0.001***
24
ER status
Negative
1.00
45
1.00
44
Positive
3.20 (0.70–14.73)
0.136
270
6.40 (1.30–31.48)
0.022*
269
Luminal A
Negative
1.00
152
1.00
151
Positive
0.34 (0.18–0.64)
0.001***
163
0.91 (0.57–1.46)
0.69
162
Luminal B
Negative
1.00
286
1.00
284
Positive
0.63 (0.26–1.55)
0.315
29
1.09 (0.54–2.20)
0.814
29
CD8
0
1.00
81
1.00
80
1
0.44 (0.24–0.82)
0.009**
234
0.57 (0.36–0.92)
0.022*
233
CD3
0
1.00
74
1.00
72
1
0.49 (0.25–0.98)
0.043*
241
0.42 (0.25–0.71)
0.001***
241
T cells
0
1.00
60
1.00
59
1
0.68 (0.35–1.32)
0.252
255
0.92 (0.55–1.54)
0.748
254
Treg
0
1.00
156
1.00
154
1
1.62 (0.88–2.98)
0.121
159
1.38 (0.88–2.16)
0.159
159
IL-17 T cells
0
1.00
172
1.00
171
1
1.31 (0.74–2.32)
0.352
143
1.41 (0.92–2.16)
0.115
142
Abbreviations: BCSS. breast cancer specific survival; RFS. recurrence free survival; HR. hazard ration; NHG. Nottingham histologic grade.
Prognostic significance of alternative T cell subpopulations in the entire cohort
We next investigated the prognostic impact of individual T cell subsets (CD3, CD8, T cells, T and IL-17 T cells) on BCSS and RFS in the entire cohort. Kaplan-Meier analysis revealed that tumor infiltration of any kind of T cells (CD3) correlated with a significantly improved BCSS and RFS (Fig. 1B). There was no significant association between CD8 lymphocyte infiltration and BCSS or RFS. T cell infiltration was associated with a significantly prolonged BCSS and RFS. In contrast, T were associated with poor BCSS, while IL-17 T cells did not have any prognostic impact (Fig. 1B).
Univariable Cox regression analysis showed that presence of T cells (CD3), had an overall significant positive impact on BCSS (HR 0.56; 95% CI 0.35–0.89; 0.015) and RFS (HR 0.50; 95% CI 0.35–0.72; 0.001). This was also true for T cells (BCSS [HR 0.53; 95% CI 0.33–0.86; 0.01] and RFS [HR 0.56; 95% CI 0.38–0.81; 0.002]), but not for CD8. In contrast, tumor infiltration of T was associated with a decreased BCSS (HR 1.67; 95% CI 1.08–2.60; 0.022). IL-17 T cell infiltration showed no significant impact on BCSS or RFS (Table 3).
When adjusted for clinicopathological parameters in multivariable Cox regression analysis, CD8 T cells were independently associated with an improved BCSS (HR 0.44 95% CI 0.24–0.82; 0.009) and RFS (HR 0.57; 95% CI 0.36–0.92; 0.022), while CD3 lymphocytes were independently associated with an improved BCSS (HR 0.49 95% CI 0.25–0.98; 0.043) and RFS (HR 0.42; 95% CI 0.25–0.71; 0.001; Table 4).
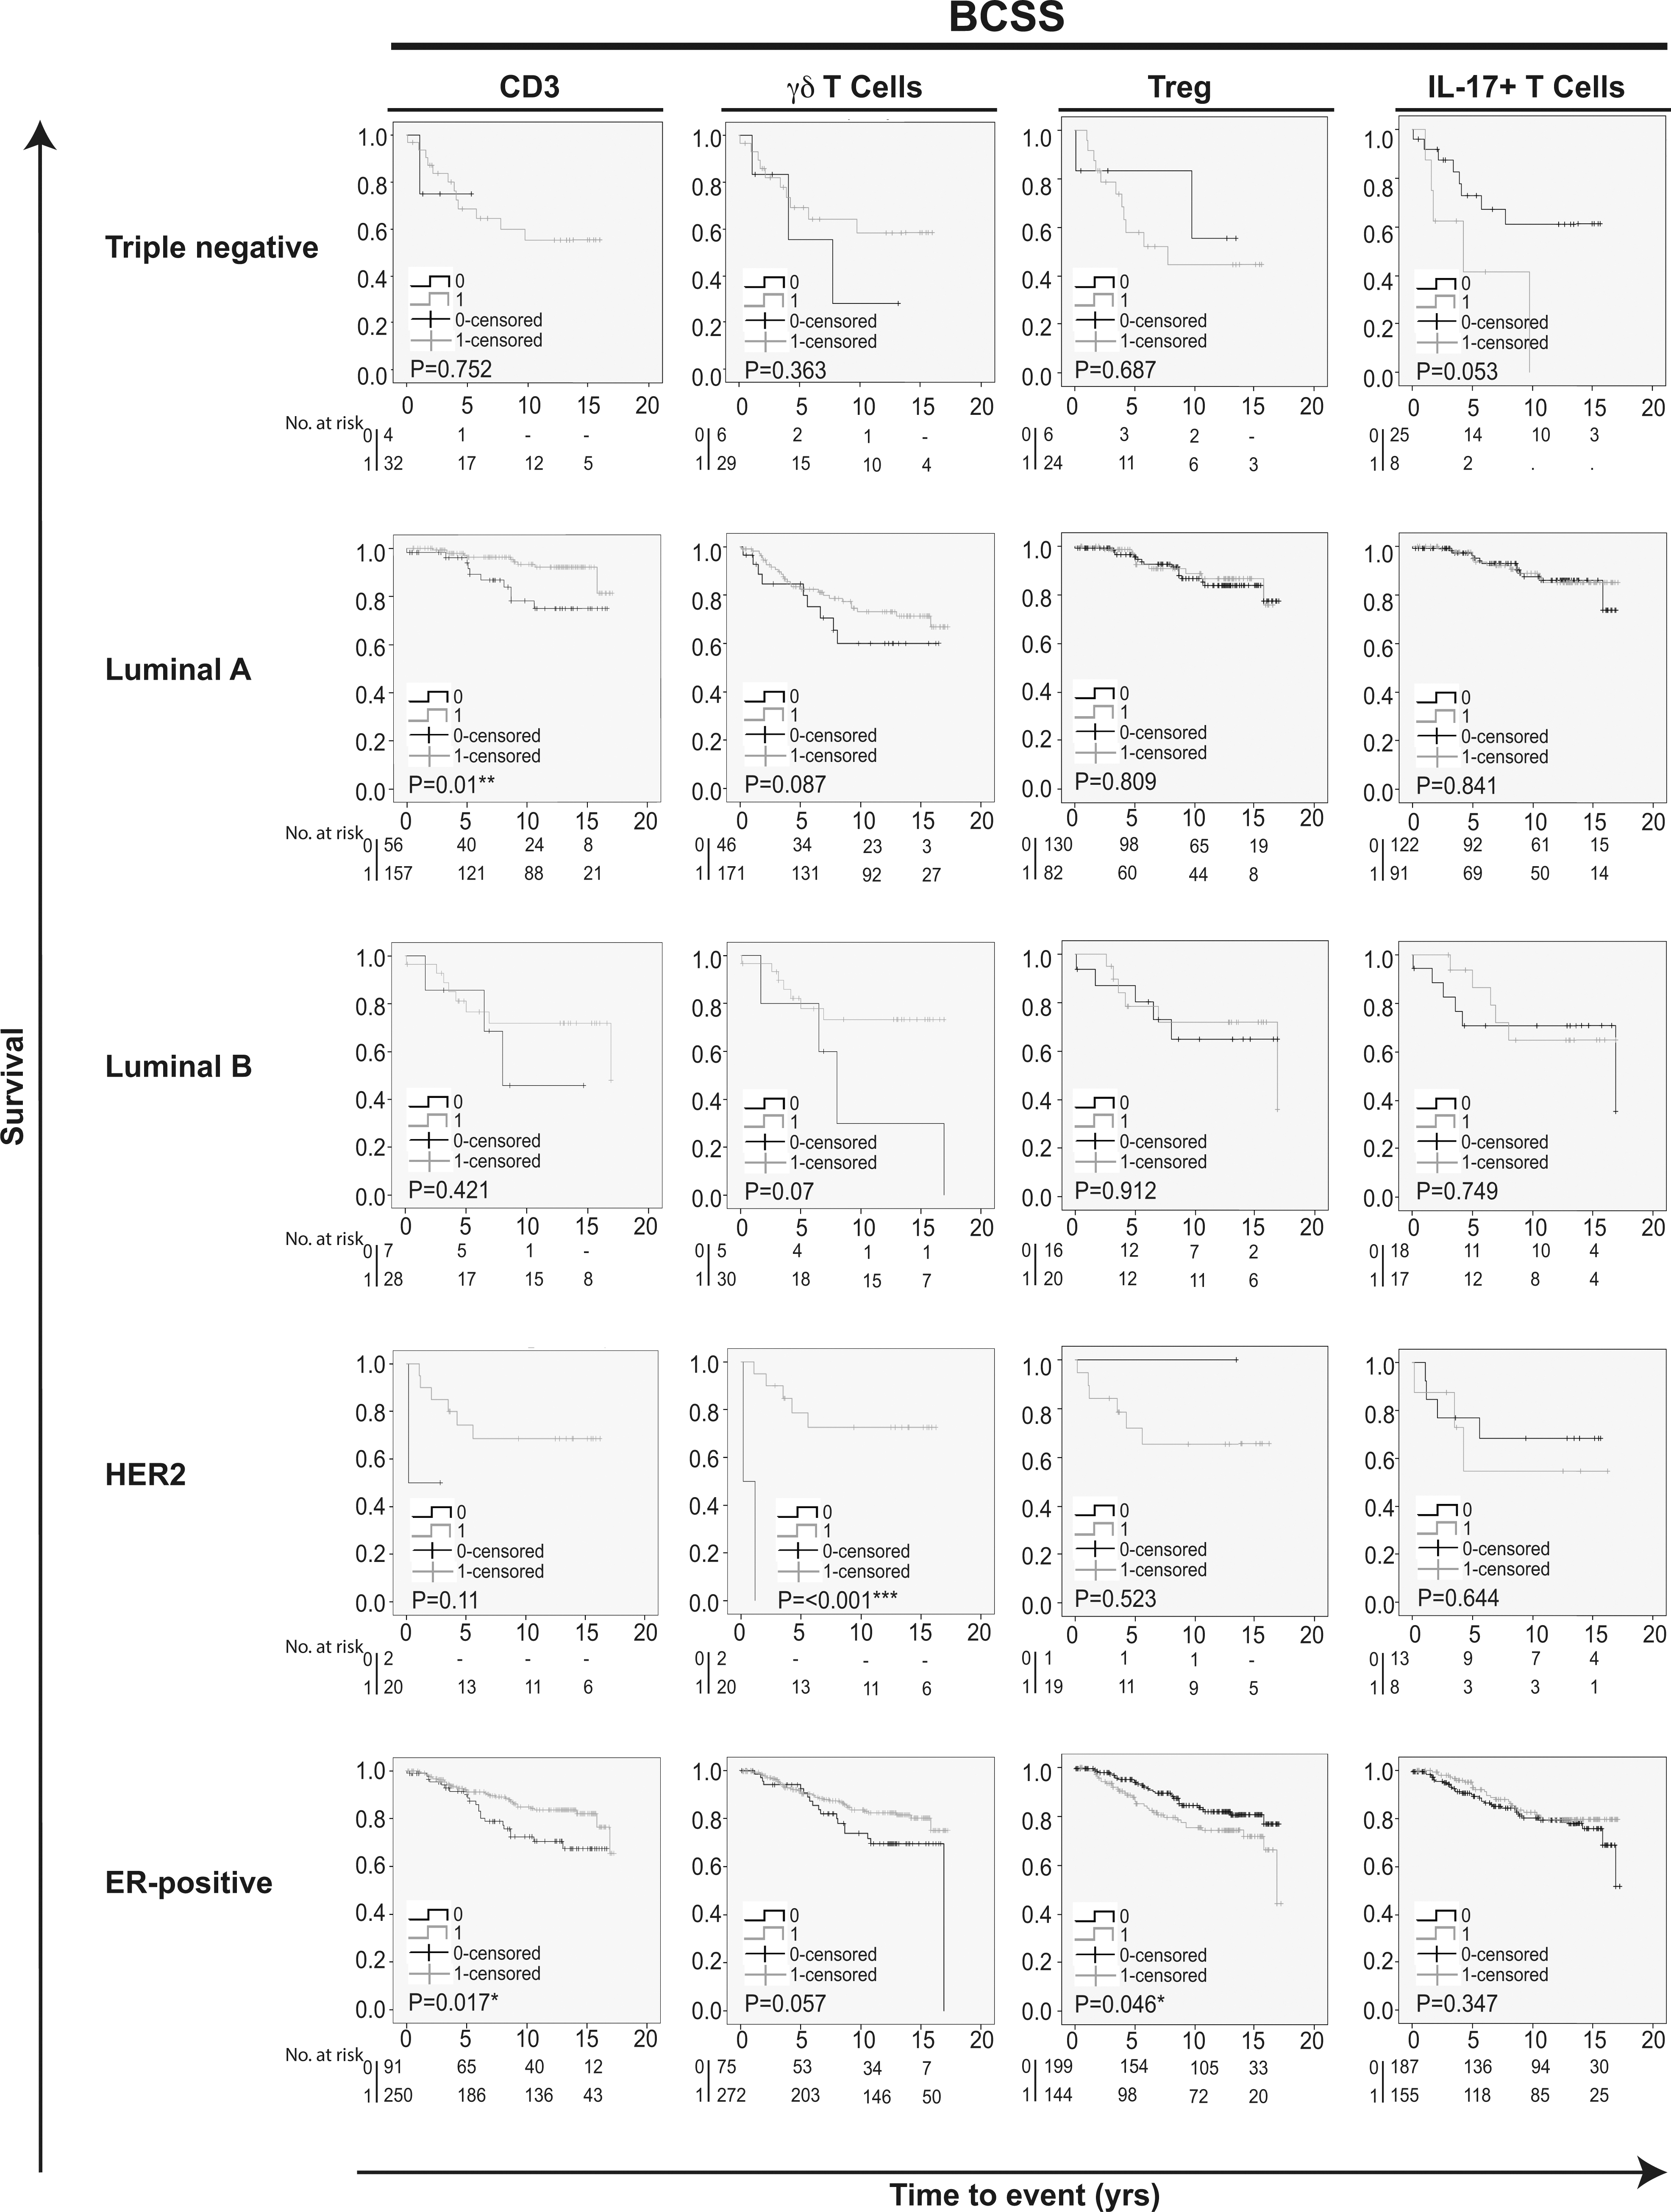
Kaplan-Meier estimates of breast cancer specific survival according to different infiltrating T cell subpopulations in breast cancer. Impact of pan-T cell CD3, T cells, T and IL-17 T cells on BCSS in different breast cancer subtypes. Log-rank P value 0.05 was considered significant.
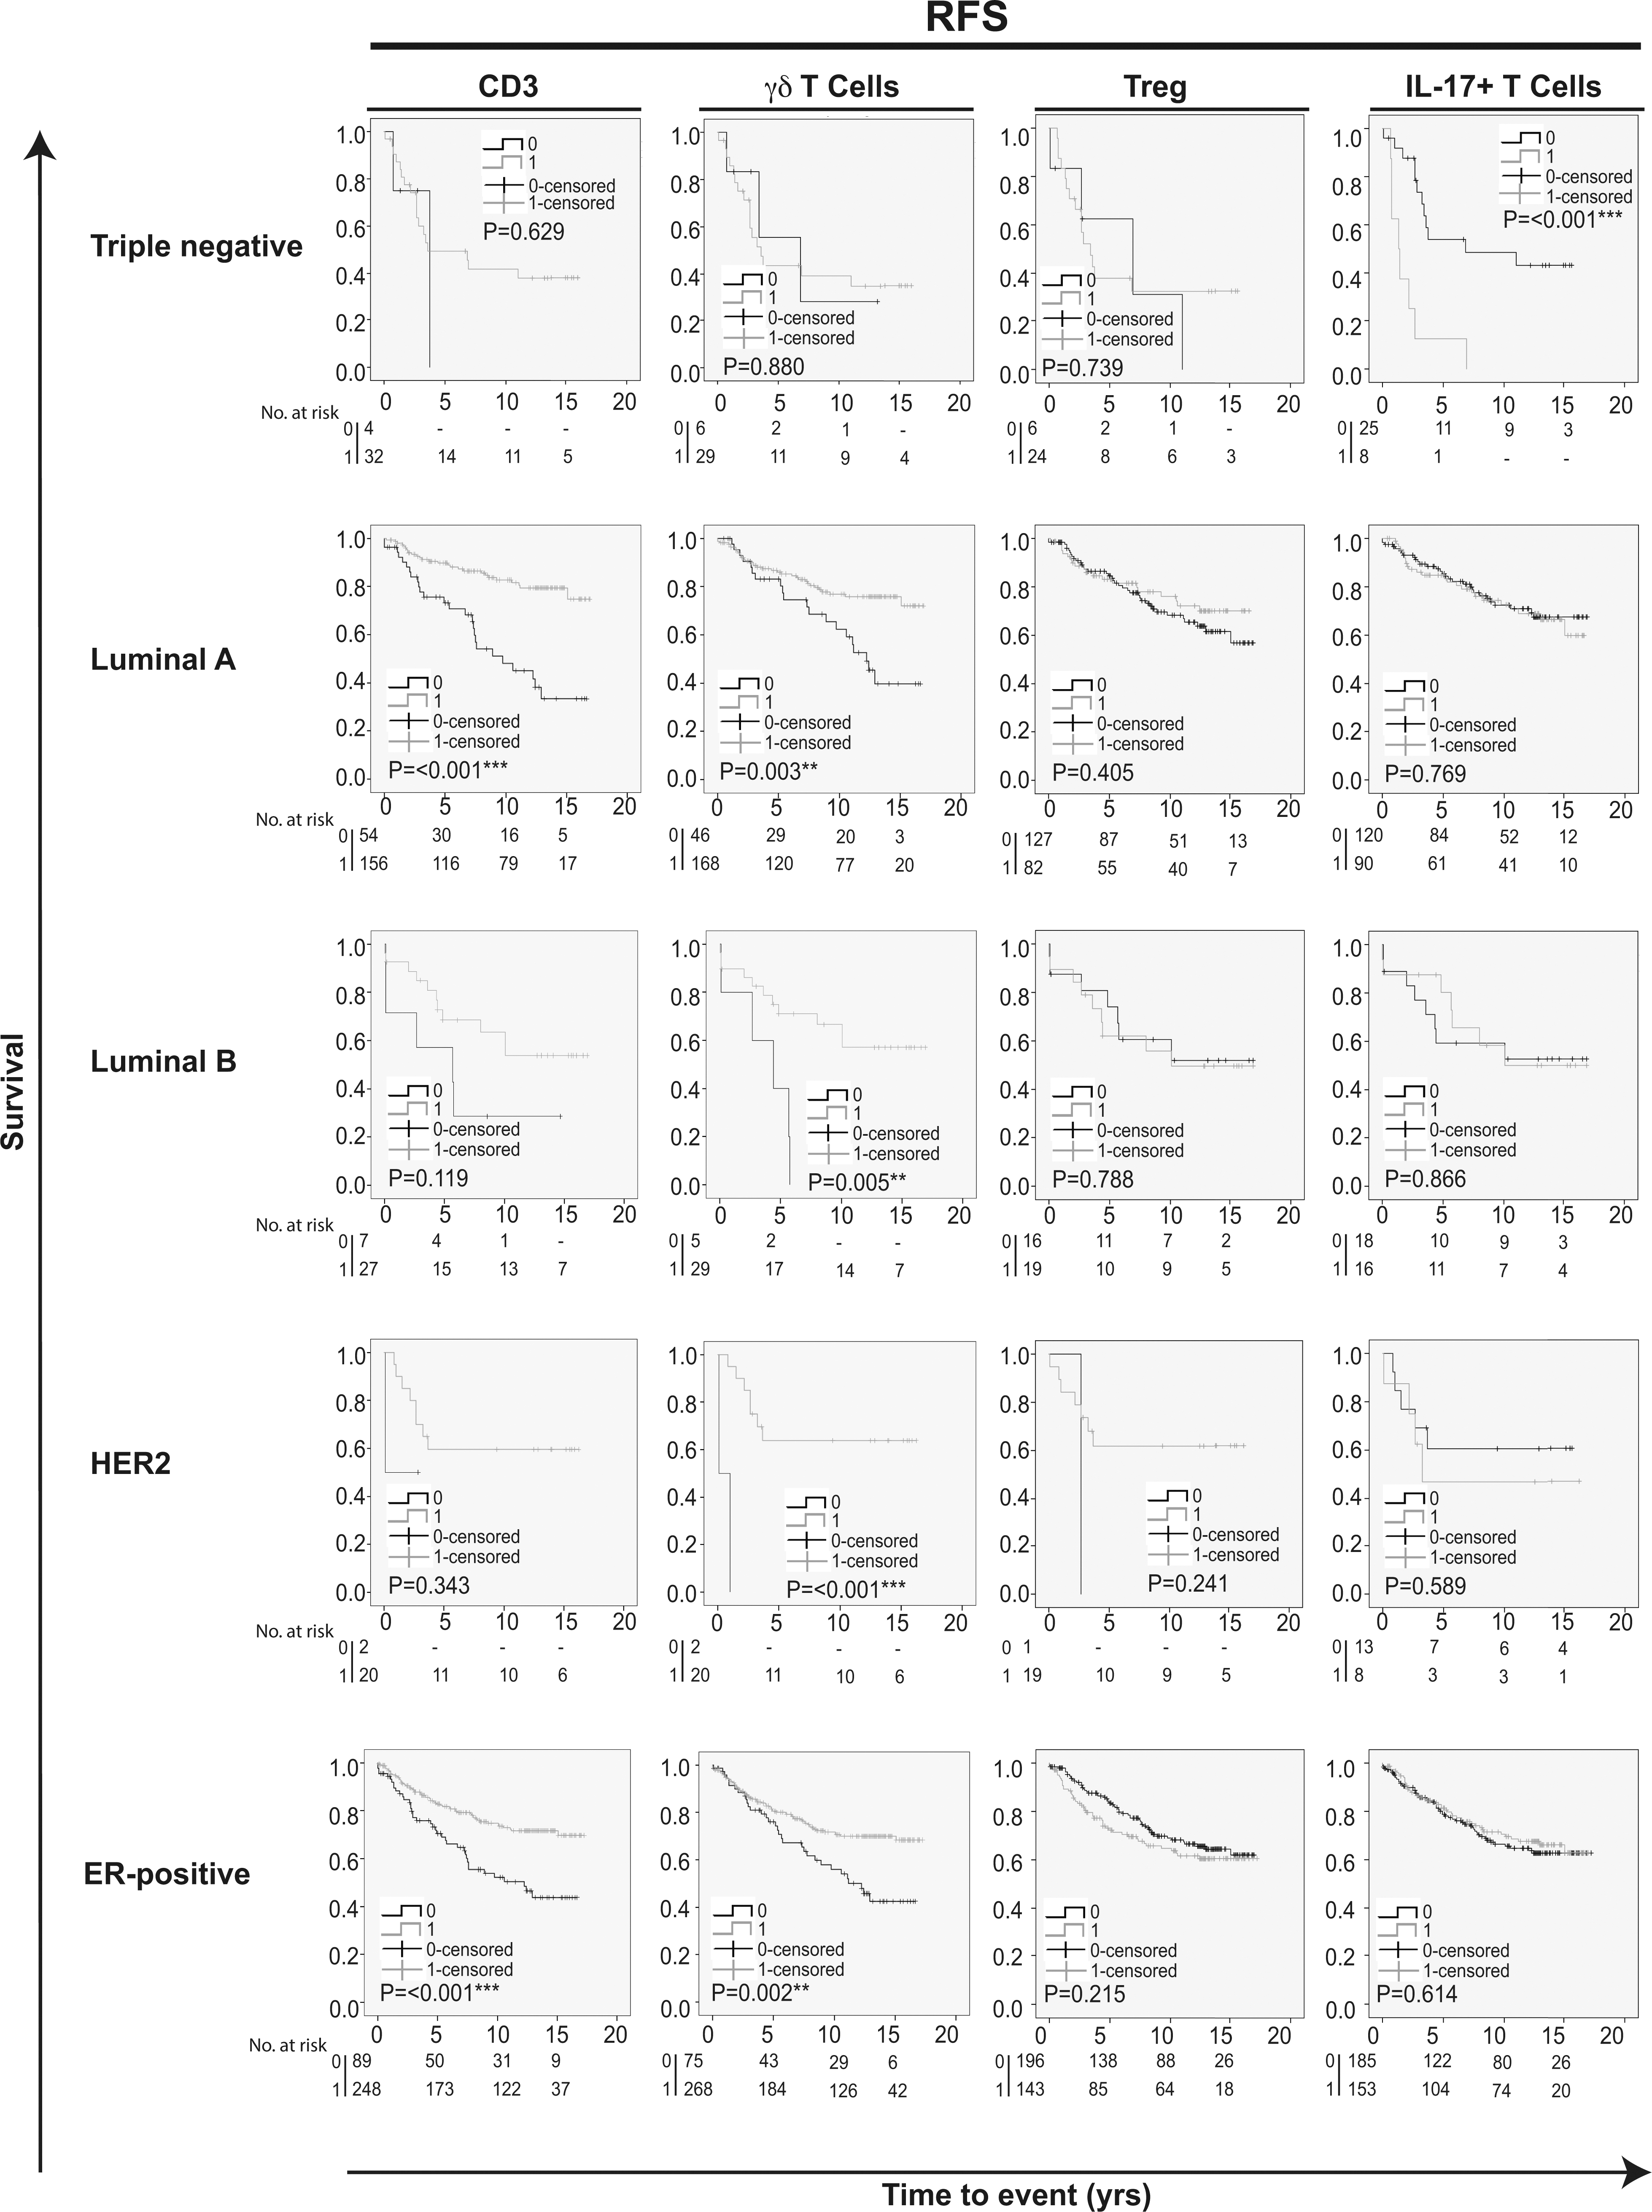
Kaplan-Meier estimates of recurrence free survival according to different infiltrating T cell subpopulations in breast cancer. Impact of pan-T cell CD3, T cells, T and IL-17 T cells on RFS in different breast cancer subtypes. Log-rank value 0.05 was considered significant.
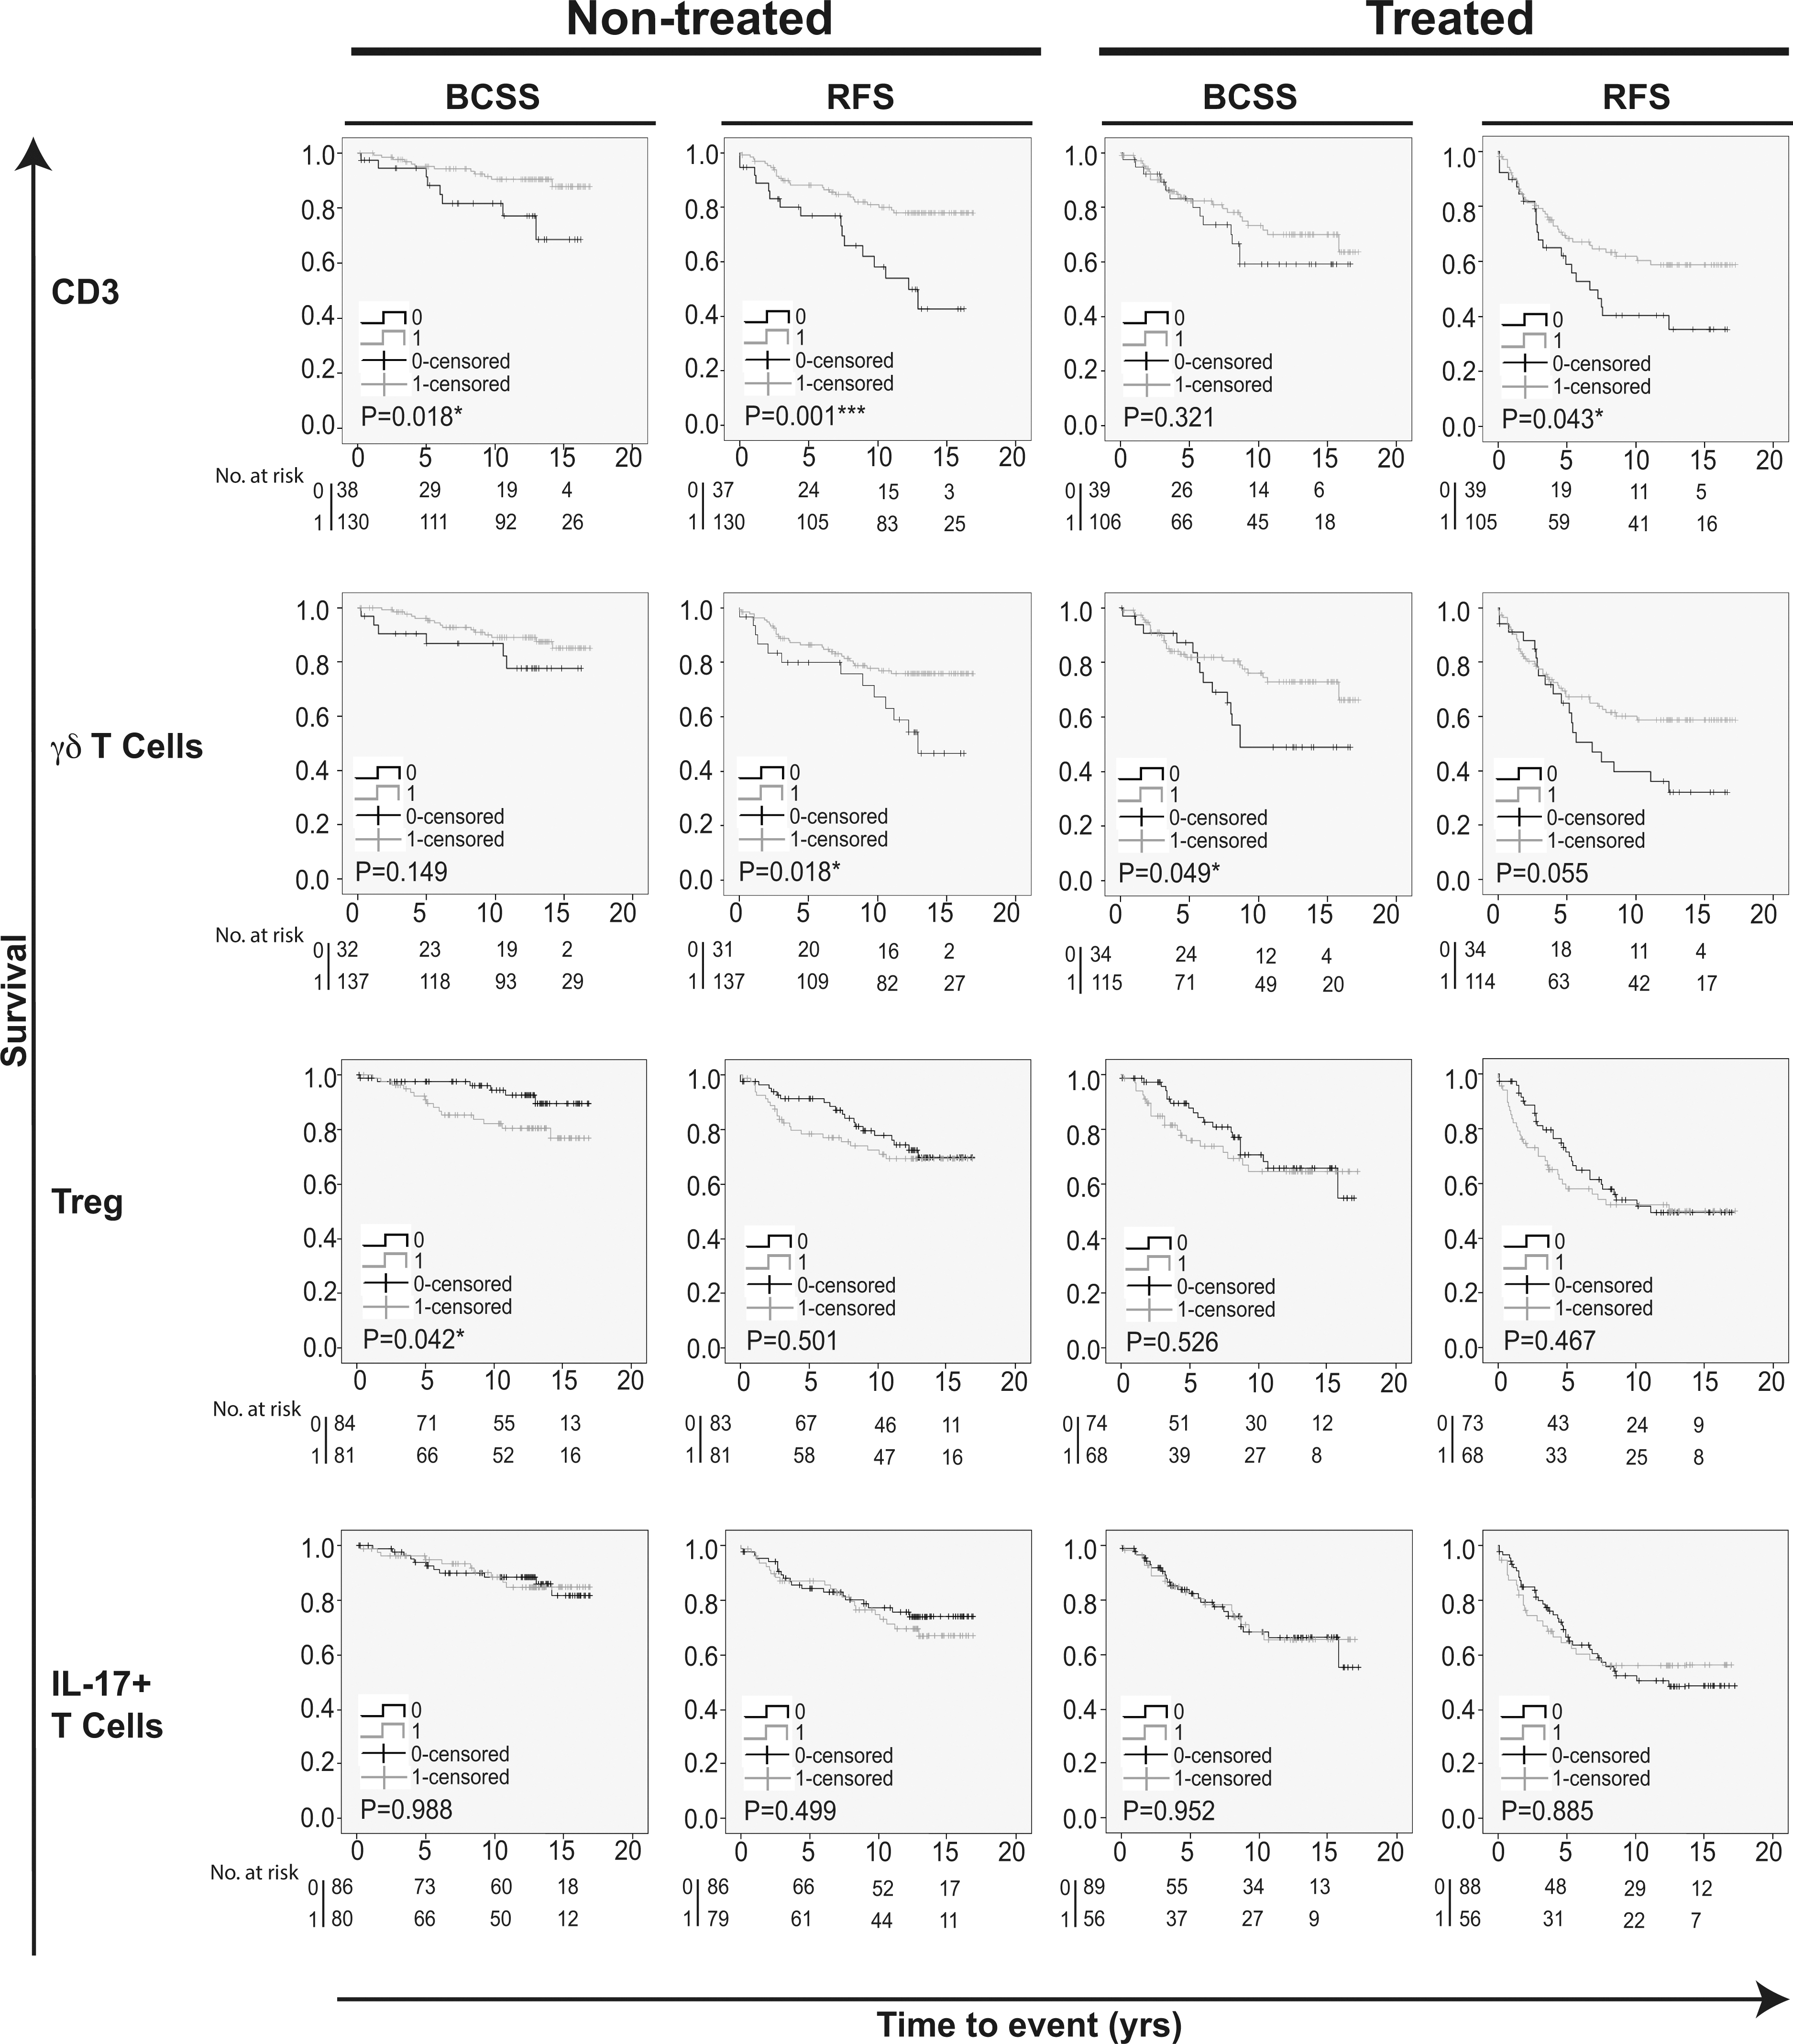
Kaplan-Meier estimates on survival according to different infiltrating T-cell populations in patients receiving and not receiving adjuvant endocrine therapy. Impact of pan-T cell CD3, T cells, T and IL-17 T cells on both BCSS and RFS in breast cancer patients receiving and not receiving adjuvant endocrine therapy. The study cohort was conceived before clinical use of ER-testing, hence both groups includes both ER-positive and ER-negative patients. Log-rank value 0.05 was considered significant.
Prognostic value of alternative T cell subpopulations according to breast cancer subtype
Kaplan-Meier analyses were also performed in strata according to different subtypes of breast cancer. This revealed that tumor infiltration of T cells overall (CD3) was associated with an improved prognosis specifically in Luminal A and ER-positive breast cancers (BCSS and RFS; Figs 2 and 3). CD8 and T cell lymphocyte infiltration was associated with a prolonged BCSS only in the HER2 breast cancers (Fig. 2), and interestingly, 20 out of 23 HER2 cases scored positive for both CD8 and T cell infiltration ( 0.001; Table 2). Importantly, T cell infiltration was associated with an improved RFS in Luminal A, Luminal B, HER2 and ER-positive breast cancers (Fig. 3). Tumor infiltration of T was associated with a poor BCSS only in ER-positive breast cancers (Fig. 2). In contrast, infiltration of IL-17 T cells was associated with a poor RFS in TNBCs (Fig. 3).
Prognostic impact of T cell infiltration in relation to endocrine therapy
Next, we evaluated whether tumor infiltration of different T cell populations had any impact on prognosis in relation to endocrine therapy. The study cohort was conceived before clinical use of ER-testing, hence both groups include both ER-positive and ER-negative patients [27]. Kaplan-Meier analysis in strata according to treatment revealed that tumor infiltration of CD8 T cells only had a positive impact on BCSS and RFS in the treated group (Fig. 2B). CD3, however, was significantly associated with a prolonged RFS in the treated group, and with a prolonged BCSS and RFS in the untreated group (Fig. 4). Infiltration of T cells was significantly associated with an improved BCSS in patients receiving adjuvant treatment, and with a significantly improved RFS, but not BCSS, in the untreated group (Fig. 4). Infiltration of T in tumors of untreated patients was significantly associated with a poor outcome on BCSS, while IL-17 T cells showed no impact on BCSS or RFS in either group (Fig. 4).
Univariable Cox regression analysis of the endocrine therapy treated group revealed that CD8 T cell infiltration was associated with an improved BCSS (HR 0.47; 95% CI 0.25–0.88; 0.019) and RFS (HR 0.58; 95% CI 0.34–0.99; 0.044). In the endocrine therapy untreated group, CD3 was associated with improved BCSS (HR 0.35; 95% CI 0.14–0.87; 0.023) and RFS (HR 0.36; 95% CI 0.20–0.68; 0.002), while in the endocrine therapy treated patient group, CD3 was associated only with a prolonged RFS (HR 0.59; 95% CI 0.35–0.99; 0.046; Table 3). Presence of tumor infiltrating T cells was significantly associated with an improved RFS in the untreated group only (HR 0.46; 95% CI 0.24–0.89; 0.021) while T were significantly associated with an impaired BCSS (HR 2.59; 95% CI 1.00–6.67; 0.050; Table 3).
Multivariable Cox regression analysis for BCSS and RFS stratified for treated patients
BCSS
RFS
HR (CI 95%)
-value
HR (CI 95%)
-value
Age (yrs)
50
1.00
6
1.00
6
50
0.33 (0.07–1.64)
0.176
105
0.19 (0.06–0.58)
0.004**
105
Lymph node status
Negative
1.00
26
1.00
26
Positive
27.39 (4.93–152.07)
0.001***
85
7.22 (2.39–21.82)
0.001***
85
Ki67 grade
0–10
1.00
40
1.00
40
11– 25
2.36 (0.71–7.85)
0.162
71
1.29 (0.58–2.89)
0.536
71
Size (mm)
20
1.00
47
1.00
47
20
2.64 (1.07–6.51)
0.035*
64
2.32 (1.18–4.55)
0.014*
64
NHG
I and II
1.00
62
1.00
62
III
1.76 (0.56–5.52)
0.333
49
1.82 (0.82–4.03)
0.142
49
HER2
Negative
1.00
106
1.00
106
Positive
0.99 (0.13–7.91)
0.995
5
0.69 (0.09–5.07)
0.715
5
Triple negative
Negative
1.00
102
1.00
102
Positive
12.21 (0.82–182.39)
0.07
9
15.78 (1.11–224.73)
0.042*
9
ER status
Negative
1.00
15
1.00
15
Positive
3.78 (0.21–67.21)
0.365
96
6.39 (0.37–108.91)
0.2
96
Luminal A
Negative
1.00
64
1.00
64
Positive
0.24 (0.09–0.66)
0.006**
47
0.66 (0.32–1.37)
0.265
47
Luminal B
Negative
1.00
101
1.00
101
Positive
0.34 (0.07–1.70)
0.189
10
1.09 (0.37–3.22)
0.882
10
CD8
0
1.00
27
1.00
27
1
0.21 (0.09–0.52)
0.001***
84
0.41 (0.20–0.84)
0.014*
84
CD3
0
1.00
30
1.00
30
1
0.73 (0.26–2.06)
0.55
81
0.66 (0.32–1.36)
0.262
81
T cells
0
1.00
21
1.00
21
1
0.32 (0.12–0.82)
0.018*
90
0.68 (0.31–1.50)
0.342
90
Treg
0
1.00
55
1.00
55
1
1.09 (0.39–3.06)
0.865
56
1.71 (0.83–3.55)
0.148
56
IL-17 T cells
0
1.00
64
1.00
64
1
1.57 (0.66–3.71)
0.309
47
1.53 (0.79–2.96)
0.21
47
Abbreviations: BCSS. breast cancer specific survival; RFS. recurrence free survival; HR. hazard ration; NHG. Nottingham histologic grade.
Multivariable Cox regression analysis for BCSS and RFS stratified for untreated patients
BCSS
RFS
HR (CI 95%)
-value
HR (CI 95%)
-value
Age (yrs)
50
1.00
37
1.00
37
50
0.47 (0.12–1.89)
0.288
105
1.15 (0.47–2.81)
0.767
104
Lymph node status
Negative
1.00
123
1.00
123
Positive
16.11 (3.95–65.65)
0.001***
19
2.95 (1.24–7.02)
0.014*
18
Ki67 grade
0–10
21.00
62
1.00
62
11– 25
6.20 (2.33–295.19)
0.008**
80
1.92 (0.82–4.47)
0.131
79
Size (mm)
20
1.00
116
1.00
116
20
13.97 (3.99–65.23)
0.001***
26
2.52 (0.97–6.51)
0.057
25
NHG
I and II
1.00
108
1.00
108
III
5.22 (1.20–22.81)
0.028*
34
3.82 (1.66–8.81)
0.002**
33
HER2
Negative
1.00
133
1.00
132
Positive
0.44 (0.04–4.98)
0.511
9
2.55 (0.60–10.81)
0.203
9
Triple negative
Negative
1.00
131
1.00
130
Positive
10.20 (0.76–137.56)
0.08
11
16.33 (1.58–169.16)
0.019*
11
ER status
Negative
1.00
23
1.00
22
Positive
7.87 (0.66- 93.92)
0.103
119
8.02 (0.79–81.24)
0.078
119
Luminal A
Negative
1.00
60
1.00
59
Positive
0.11 (0.02–0.57)
0.009**
82
1.78 (0.66–4.82)
0.256
82
Luminal B
Negative
1.00
131
1.00
130
Positive
0.28 (0.03–2.51)
0.255
11
3.14 (0.73–13.50)
0.124
11
CD8
0
1.00
40
1.00
39
1
0.36 (0.06–2.03)
0.244
102
0.67 (0.31–1.44)
0.303
102
CD3
0
1.00
32
1.00
31
1
0.03 (0.00–0.24)
0.001***
110
0.21 (0.07–0.64)
0.006**
110
T cells
0
1.00
28
1.00
27
1
2.64 (0.33–20.96)
0.358
114
1.30 (0.43–3.92)
0.644
114
Treg
0
1.00
68
1.00
67
1
17.31 (2.45–122.16)
0.004**
74
1.50 (0.68–3.31)
0.317
74
IL-17 T cells
0
1.00
74
1.00
74
1
2.12 (0.54–8.28)
0.279
68
1.65 (0.77–3.52)
0.195
67
Abbreviations: BCSS. breast cancer specific survival; RFS. recurrence free survival; HR. hazard ration; NHG. Nottingham histologic grade.
In endocrine therapy treated patients, CD8T cells remained an independent prognostic factor for a prolonged BCSS and RFS in multivariable Cox regression analysis (HR 0.21; 95% CI 0.09–0.52; 0.001 and HR 0.41; 95% CI 0.20–0.84; 0.014, respectively; Table 5). Infiltration of T cells was independently associated with an improved BCSS (HR 0.32; 95% CI 0.12–0.82; 0.018; Table 5) only in endocrine therapy treated patients. In endocrine therapy untreated patients, however, CD3 was an independent factor of a prolonged BCSS (HR 0.03; 95% CI 0.00–0.24; 0.001) and RFS (HR 0.21; 95% CI 0.07–0.64; 0.006), whereas presence tumor infiltrating T was revealed to be an independent factor of an impaired BCSS (HR 17.31; 95% CI 2.45–122.16; 0.004; Table 6).
Discussion
In this study, we investigated the prognostic value of infiltrating T cells, T and IL-17 T cells, as compared to the common TIL markers CD3 and CD8, in invasive breast cancer. The analyses were also performed in relation to adjuvant endocrine therapy.
We show that infiltration of T cells (CD3) had a positive effect on prognostic outcome in breast cancer, which supports previous studies evaluating TILs as a prognostic parameter. However, since CD3 is a pan-T cell marker, further investigation was needed to identify specific T cell subtypes that may play a role in breast cancer progression and as potential responders to immune-therapies.
The only T cell subpopulation with results similar to that of CD3, turned out to be T cells that were associated with an improved survival in general. When stratified according to breast cancer subtype, infiltration of T cells was the only T cell population that correlated with a positive outcome in all subtypes (luminal A, luminal B, HER2-positive and ER-positive breast cancers), except TNBCs. It is likely that the TNBC environment not only recruits more T cells, but also has a negative effect on T cell activity. This is a controversy that would merit further investigation at the functional level in the future.
In multivariable Cox regression analyses however, both CD3 and CD8 T cell infiltration remained independent factors of a prolonged BCSS as well as RFS. Interestingly, in contrast to general T cell infiltration (CD3), both infiltrating CD8 and T cells were revealed to be independent prognostic factors in patients receiving endocrine treatment. The fact that several immune cells can express CD8, including T cells, makes it difficult to evaluate whether it is conventional CTLs that has the major effect on prognosis in our investigation [32, 33, 34, 35]. Some studies have proposed that T cells can acquire both pro- or anti-tumor properties depending on the tumor microenvironment [25]. Furthermore, the regulation of T cells by inhibitory co-receptors is slightly different as compared to conventional T cells [36, 37]. Indeed, the majority of tumors that scored positive for T cell infiltration in our cohort also scored positive for CD8 T cells and these may therefore be T cells, rather than conventional TCR CTLs. This was especially clear in the HER2 group, however, due to the small size of this patient group no conclusions should be drawn. In line with our findings, it has already been shown that T cell gene expression signatures were associated with a favorable prognosis across multiple malignancies, also in breast cancer [21, 22].
In the herein studied cohort, infiltration of T was associated with a worse prognosis, but not in multivariable Cox regression analyses. When stratified according to breast cancer subtypes it was revealed that infiltration of T was associated with worse prognosis primarily in ER-positive breast cancers, indicating that T could serve as a potential therapeutic target in ER-positive breast cancers specifically. Also, a significant association between presence of FoxP3 and T cells was found. However, the fact that the prognostic impact of infiltrating T cells and T was contradictory suggests that these are not regulatory FoxP3 T cells [38].
We show that infiltration of IL-17 T cells in general has no prognostic impact. However, when stratified according to breast cancer subtype it was revealed that infiltration of IL-17 T cells was associated with a worse prognosis in TNBC, specifically. TNBCs often produce inflammatory mediators and it is likely that T cells are either attracted to or even play a role in regulating the TNBC microenvironment [39]. Studies on the clinical relevance of T infiltration in breast tumors has been performed previously, but on small patient cohorts and with opposing results [14, 15, 16, 40]. Nonetheless, these studies point out the complex nature of T cell behavior in a tumor context. Tumor infiltrating T cells have been associated with both tumor promoting and inhibiting properties [39]. Indeed, reports investigating the plasticity of T in breast cancer have shown that T even might be immunosuppressive [16, 41]. Lately, the presence of IL-17 T cells that promotes myeloid cell accumulation and polarization has been reported as an important mechanism in breast cancer progression and metastasis in mice [26] and supporting evidence was recently shown also for human colorectal cancers [42]. The strength of our study lies in the size of the breast cancer cohort, but also that IL-17 T cell and T cell infiltration was analyzed in parallel. We found no correlation between presence of IL-17 cells and T cells in this study.
Conclusions
In conclusion, our results demonstrate that in breast cancer, infiltration of T cells (CD3) and T cells are associated with good clinical outcome, while T are associated with worse clinical outcome. Infiltration of T cells was associated with a significantly improved prognosis in all breast cancer subtypes except TNBC. However, when adjusted for clinicopathological parameters, only CD8 T cells and CD3 infiltration proved to be independently associated with clinical outcome. Furthermore, except for CD3, infiltration of T cells was the only marker that correlated with an improved clinical outcome in both endocrine treated and untreated patients. When adjusted for clinicopathological parameters, both CD8 T cells and T cell infiltration was independently associated with an improved prognosis for patients receiving adjuvant endocrine therapy, while CD3 and T infiltration was associated with clinical outcome in untreated patients. Finally our findings indicate that in breast tumors, the infiltrating CD8 T cells may indeed be T cells, which merit further investigation concerning regulation and checkpoint inhibitors. This study renders new light on previously unexplored aspects of tumor infiltrating lymphocytes, and highlights potential prognostic aspects of T cells, IL-17 T cells and T in breast cancer, with particular reference to molecular subtypes and endocrine adjuvant treatment.
Footnotes
Acknowledgments
The authors wish to thank Ms Elise Nilsson and Mrs Kristina Ekström-Holka for professional help with IHC. This work was generously supported by grants from the Swedish Cancer Society, Gunnar Nilsson Cancer Foundation, MAS Cancer Foundation, Åke Wibergs Foundation and Percy Falks Foundation.
Conflict of interest
The authors declare no conflict of interest.
Supplementary data
The supplementary files are available to download from http://dx.doi.org/10.323/CBM-170026.
References
1.
SorlieT.PerouC.M.TibshiraniR.AasT.GeislerS.JohnsenH.HastieT.EisenM.B.van de RijnM.JeffreyS.S.ThorsenT.QuistH.MateseJ.C.BrownP.O.BotsteinD.LonningP.E. and Borresen-DaleA.L., Gene expression patterns of breast carcinomas distinguish tumor subclasses with clinical implications, Proc Natl Acad Sci U S A98 (2001), 10869–10874.
2.
MedrekC.PontenF.JirstromK. and LeanderssonK., The presence of tumor associated macrophages in tumor stroma as a prognostic marker for breast cancer patients, BMC Cancer12 (2012), 306.
3.
MantovaniA.AllavenaP.SicaA. and BalkwillF., Cancer-related inflammation, Nature454 (2008), 436–444.
4.
StantonS.E. and DisisM.L., Clinical significance of tumor-infiltrating lymphocytes in breast cancer, J Immunother Cancer4 (2016), 59.
5.
DenkertC.von MinckwitzG.BraseJ.C.SinnB.V.GadeS.KronenwettR.PfitznerB.M.SalatC.LoiS.SchmittW.D.SchemC.FischK.Darb-EsfahaniS.MehtaK.SotiriouC.WienertS.KlareP.AndreF.KlauschenF.BlohmerJ.U.KrappmannK.SchmidtM.TeschH.KummelS.SinnP.JackischC.DietelM.ReimerT.UntchM. and LoiblS., Tumor-infiltrating lymphocytes and response to neoadjuvant chemotherapy with or without carboplatin in human epidermal growth factor receptor 2-positive and triple-negative primary breast cancers, J Clin Oncol33 (2015), 983–991.
6.
AdamsS.GrayR.J.DemariaS.GoldsteinL.PerezE.A.ShulmanL.N.MartinoS.WangM.JonesV.E.SaphnerT.J.WolffA.C.WoodW.C.DavidsonN.E.SledgeG.W.SparanoJ.A. and BadveS.S., Prognostic value of tumor-infiltrating lymphocytes in triple-negative breast cancers from two phase III randomized adjuvant breast cancer trials: ECOG 2197 and ECOG 1199, J Clin Oncol32 (2014), 2959–2966.
7.
OnoM.TsudaH.ShimizuC.YamamotoS.ShibataT.YamamotoH.HirataT.YonemoriK.AndoM.TamuraK.KatsumataN.KinoshitaT.TakiguchiY.TanzawaH. and FujiwaraY., Tumor-infiltrating lymphocytes are correlated with response to neoadjuvant chemotherapy in triple-negative breast cancer, Breast Cancer Res Treat132 (2012), 793–805.
8.
ApetohL.GhiringhelliF.TesniereA.ObeidM.OrtizC.CriolloA.MignotG.MaiuriM.C.UllrichE.SaulnierP.YangH.AmigorenaS.RyffelB.BarratF.J.SaftigP.LeviF.LidereauR.NoguesC.MiraJ.P.ChompretA.JoulinV.Clavel-ChapelonF.BourhisJ.AndreF.DelalogeS.TurszT.KroemerG. and ZitvogelL., Toll-like receptor 4-dependent contribution of the immune system to anticancer chemotherapy and radiotherapy, Nat Med13 (2007), 1050–1059.
9.
LakeR.A. and RobinsonB.W., Immunotherapy and chemotherapy – a practical partnership, Nat Rev Cancer5 (2005), 397–405.
10.
Lakshmi NarendraB.Eshvendar ReddyK.ShantikumarS. and RamakrishnaS., Immune system: A double-edged sword in cancer, Inflamm Res62 (2013), 823–834.
11.
AlizadehD.KatsanisE. and LarmonierN., The multifaceted role of Th17 lymphocytes and their associated cytokines in cancer, Clin Dev Immunol2013 (2013), 957878.
12.
SakaguchiS.YamaguchiT.NomuraT. and OnoM., Regulatory T cells and immune tolerance, Cell133 (2008), 775–787.
13.
LiuS.FoulkesW.D.LeungS.GaoD.LauS.KosZ. and NielsenT.O., Prognostic significance of FOXP3+ tumor-infiltrating lymphocytes in breast cancer depends on estrogen receptor and human epidermal growth factor receptor-2 expression status and concurrent cytotoxic T-cell infiltration, Breast Cancer Res16 (2014), 432.
14.
YangL.QiY.HuJ.TangL.ZhaoS. and ShanB., Expression of Th17 cells in breast cancer tissue and its association with clinical parameters, Cell Biochem Biophys62 (2012), 153–159.
15.
ChenW.C.LaiY.H.ChenH.Y.GuoH.R.SuI.J. and ChenH.H., Interleukin-17-producing cell infiltration in the breast cancer tumour microenvironment is a poor prognostic factor, Histopathology63 (2013), 225–233.
16.
ThibaudinM.ChaixM.BoidotR.VegranF.DerangereV.LimagneE.BergerH.LadoireS.ApetohL. and GhiringhelliF., Human ectonucleotidase-expressing CD25high Th17 cells accumulate in breast cancer tumors and exert immunosuppressive functions, Oncoimmunology5 (2016), e1055444.
17.
MahmoudS.M.PaishE.C.PoweD.G.MacmillanR.D.GraingeM.J.LeeA.H.EllisI.O. and GreenA.R., Tumor-infiltrating CD8+ lymphocytes predict clinical outcome in breast cancer, J Clin Oncol29 (2011), 1949–1955.
18.
CardingS.R. and EganP.J., Gammadelta T cells: Functional plasticity and heterogeneity, Nat Rev Immunol2 (2002), 336–345.
19.
PaulS. and LalG., Regulatory and effector functions of gamma-delta (gammadelta) T cells and their therapeutic potential in adoptive cellular therapy for cancer, Int J Cancer139 (2016), 976–985.
20.
MaC.ZhangQ.YeJ.WangF.ZhangY.WeversE.SchwartzT.HunborgP.VarvaresM.A.HoftD.F.HsuehE.C. and PengG., Tumor-infiltrating gammadelta T lymphocytes predict clinical outcome in human breast cancer, J Immunol189 (2012), 5029–5036.
21.
GentlesA.J.NewmanA.M.LiuC.L.BratmanS.V.FengW.KimD.NairV.S.XuY.KhuongA.HoangC.D.DiehnM.WestR.B.PlevritisS.K. and AlizadehA.A., The prognostic landscape of genes and infiltrating immune cells across human cancers, Nat Med21 (2015), 938–945.
22.
BenseR.D.SotiriouC.Piccart-GebhartM.J.HaanenJ.B.van VugtM.A.de VriesE.G.SchroderC.P. and FehrmannR.S., Relevance of tumor-infiltrating immune cell composition and functionality for disease outcome in breast cancer, J Natl Cancer Inst109 (2017).
23.
WangK.XuJ.ZhangT. and XueD., Tumor-infiltrating lymphocytes in breast cancer predict the response to chemotherapy and survival outcome: A meta-analysis, Oncotarget (2016).
24.
FridmanW.H.PagesF.Sautes-FridmanC. and GalonJ., The immune contexture in human tumours: Impact on clinical outcome, Nat Rev Cancer12 (2012), 298–306.
25.
Silva-SantosB.SerreK. and NorellH., gammadelta T cells in cancer, Nat Rev Immunol15 (2015), 683–691.
26.
CoffeltS.B.KerstenK.DoornebalC.W.WeidenJ.VrijlandK.HauC.S.VerstegenN.J.CiampricottiM.HawinkelsL.J.JonkersJ. and de VisserK.E., IL-17-producing gammadelta T cells and neutrophils conspire to promote breast cancer metastasis, Nature522 (2015), 345–348.
27.
BorgquistS.HolmC.StendahlM.AnagnostakiL.LandbergG. and JirstromK., Oestrogen receptors alpha and beta show different associations to clinicopathological parameters and their co-expression might predict a better response to endocrine treatment in breast cancer, J Clin Pathol61 (2008), 197–203.
28.
LaniganF.GremelG.HughesR.BrennanD.J.MartinF.JirstromK. and GallagherW.M., Homeobox transcription factor muscle segment homeobox 2 (Msx2) correlates with good prognosis in breast cancer patients and induces apoptosis in vitro, Breast Cancer Res12 (2010), R59.
29.
PCO.L.PennyS.A.DolanR.T.KellyC.M.MaddenS.F.RexhepajE.BrennanD.J.McCannA.H.PontenF.UhlenM.ZagozdzonR.DuffyM.J.KellM.R.JirstromK. and GallagherW.M., Systematic antibody generation and validation via tissue microarray technology leading to identification of a novel protein prognostic panel in breast cancer, BMC Cancer13 (2013), 175.
30.
SvenssonS.JirstromK.RydenL.RoosG.EmdinS.OstrowskiM.C. and LandbergG., ERK phosphorylation is linked to VEGFR2 expression and Ets-2 phosphorylation in breast cancer and is associated with tamoxifen treatment resistance and small tumours with good prognosis, Oncogene24 (2005), 4370–4379.
31.
DeNardoD.G.BrennanD.J.RexhepajE.RuffellB.ShiaoS.L.MaddenS.F.GallagherW.M.WadhwaniN.KeilS.D.JunaidS.A.RugoH.S.HwangE.S.JirstromK.WestB.L. and CoussensL.M., Leukocyte complexity predicts breast cancer survival and functionally regulates response to chemotherapy, Cancer Discov1 (2011), 54–67.
32.
ChurlaudG.PitoisetF.JebbawiF.LorenzonR.BellierB.RosenzwajgM. and KlatzmannD., Human and mouse CD8(+)CD25(+)FOXP3(+) regulatory T cells at steady state and during interleukin-2 therapy, Front Immunol6 (2015), 171.
33.
GajewskiT.F.SchreiberH. and FuY.X., Innate and adaptive immune cells in the tumor microenvironment, Nat Immunol14 (2013), 1014–1022.
34.
FerrariniM.HeltaiS.ChiesaG. and SabbadiniM.G., V delta 1+ gamma/delta T lymphocytes infiltrating human lung cancer express the CD8 alpha/alpha homodimer, Scand J Immunol40 (1994), 363–367.
35.
AddisonE.G.NorthJ.BakhshI.MardenC.HaqS.Al-SarrajS.MalayeriR.WickremasingheR.G.DaviesJ.K. and LowdellM.W., Ligation of CD8alpha on human natural killer cells prevents activation-induced apoptosis and enhances cytolytic activity, Immunology116 (2005), 354–361.
36.
IwasakiM.TanakaY.KobayashiH.Murata-HiraiK.MiyabeH.SugieT.ToiM. and MinatoN., Expression and function of PD-1 in human gammadelta T cells that recognize phosphoantigens, Eur J Immunol41 (2011), 345–355.
37.
Gertner-DardenneJ.FauriatC.OrlanducciF.ThibultM.L.PastorS.FitzgibbonJ.BouabdallahR.XerriL. and OliveD., The co-receptor BTLA negatively regulates human Vgamma9Vdelta2 T-cell proliferation: A potential way of immune escape for lymphoma cells, Blood122 (2013), 922–931.
38.
KangN.TangL.LiX.WuD.LiW.ChenX.CuiL.BaD. and HeW., Identification and characterization of Foxp3(+) gammadelta T cells in mouse and human, Immunol Lett125 (2009), 105–113.
39.
WilkeC.M.KryczekI.WeiS.ZhaoE.WuK.WangG. and ZouW., Th17 cells in cancer: Help or hindrance? Carcinogenesis32 (2011), 643–649.
40.
KaewkangsadanV.VermaC.EreminJ.M.CowleyG.IlyasM. and EreminO., Crucial contributions by T lymphocytes (effector, regulatory, and checkpoint inhibitor) and cytokines (TH1, TH2, and TH17) to a pathological complete response induced by neoadjuvant chemotherapy in women with breast cancer, J Immunol Res2016 (2016), 4757405.
41.
YeJ.SuX.HsuehE.C.ZhangY.KoenigJ.M.HoftD.F. and PengG., Human tumor-infiltrating Th17 cells have the capacity to differentiate into IFN-gamma+ and FOXP3+ T cells with potent suppressive function, Eur J Immunol41 (2011), 936–951.
42.
WuP.WuD.NiC.YeJ.ChenW.HuG.WangZ.WangC.ZhangZ.XiaW.ChenZ.WangK.ZhangT.XuJ.HanY.ZhangT.WuX.WangJ.GongW.ZhengS.QiuF.YanJ. and HuangJ., gammadeltaT17 cells promote the accumulation and expansion of myeloid-derived suppressor cells in human colorectal cancer, Immunity40 (2014), 785–800.