
Abstract
In pandemic times, like the one we are witnessing for COVID-19, the discussion about new efficient and rapid techniques for diagnosis of diseases is more evident. In this mini-review, we present to the virological scientific community the potential of attenuated total reflection Fourier-transform infrared (ATR-FTIR) spectroscopy as a diagnosis technique. Herein, we explain the operation of this technique, as well as its advantages over standard methods. In addition, we also present the multivariate analysis tools that can be used to extract useful information from the data towards classification purposes. Tools such as Principal Component Analysis (PCA), Successive Projections Algorithm (SPA), Genetic Algorithm (GA) and Linear and Quadratic Discriminant Analysis (LDA and QDA) are covered, including examples of published studies. Finally, the advantages and disadvantages of ATR-FTIR spectroscopy are emphasized, as well as future prospects in this field of study that is only growing. One of the main aims of this paper is to encourage the scientific community to explore the potential of this spectroscopic tool to detect changes in biological samples such as those caused by the presence of viruses.
Introduction
Diseases caused by viruses are among the main public health problems. There is an incalculable number of viruses circulating in our environment, many already known by the scientific community and several still unknown. The Human Immunodeficiency Virus (HIV) [8] and arboviruses such as Dengue [44], Zika [38], Chikungunya [13] and Yellow Fever [26,27] are examples of well-known viruses that cause great damage to society, either because of their severity or because of their ability to change, giving rise to new serotypes. The Dengue virus, for example, is found in four different serotypes (DENV-1, -2, -3 and -4), so the same individual can contract the dengue virus up to four times [44]. In the case of new viruses, the most important case in the world is currently the new Coronavirus (COVID-19), responsible for the outbreak that began in December 2019 in Wuhan, China, and which is already in a pandemic situation, given the seriousness in which it occurs. As of March 11, 2020, more than 118,000 cases have been confirmed for COVID-19 in 114 countries, of which 4,291 people have died. [15,21,36,60,62,63]
Outbreaks such as COVID-19, currently in evidence, as well as other recent outbreaks, such as the Ebola Virus outbreak in Guinea in 2014 [3], the various outbreaks of arboviruses (Dengue, Zika, Chikungunya, Yellow Fever) in tropical countries at times of the year due to transmitting mosquitoes, and the constant public health problem with the various influenza viruses [54], such as the H1N1 virus that emerged in Mexico and the United States of America in the first half of 2009, being also declared a pandemic state by the World Health Organization (WHO) [12], make evident the importance of reliable, accurate and fast diagnostic methods. It is evident that fast response (diagnosis) means fast treatment and less damage caused by the illnesses.
The most commonly available methods in diagnostic clinics or hospitals are serological methods. These methods are based on the detection of antibodies produced against the viruses. Once a certain antibody is detected, there is evidence of which virus is present. [5] This is the case, for example, of the widely used enzyme-linked immunosorbent assay (ELISA) method. [30] The big problem with using techniques based on the detection of antibodies is that, generally, for viruses of the same family as Dengue, Zika and Yellow fever, for example, cross reactions can occur. That is, the immune system produces antibodies to a virus different from the virus that is present in the body. Studies also show that the production of specific antibodies to Dengue can worsen the condition of patients infected with Zika virus. [9] This suggests that the same can occur for other viruses and from different families.
Spectroscopic techniques are based on the interaction between electromagnetic radiation with the sample. This interaction can provide valuable information from the sample compositional point of view. The technique of attenuated total reflection Fourier-transform infrared spectroscopy (ATR-FTIR) is one of the most well-known spectroscopic techniques, which works in the mid-infrared region. [24] This region of the electromagnetic spectrum comprises the 4000 to 400
The infrared spectra obtained using ATR-FTIR are an example of multivariate data. This is because in each spectrum there are several variables (wavenumbers) that inform the absorbance for a sample. To better interpret this type of data, multivariate analysis techniques can be used; this comprises statistical and mathematical tools capable of analyzing the data and provide reliable quantification or classification responses. [17,24]
In this mini-review, we will address the use of ATR-FTIR in conjunction with multivariate analysis techniques for classification and detection of viruses. We will highlight the operation of ATR-FTIR and some multivariate classification techniques, such as Principal Component Analysis (PCA), Successive Projections Algorithm (SPA), Genetic Algorithm (GA), Linear Discriminant Analysis (LDA) and Quadratic Discriminant Analysis (QDA). The potential of this approach, the limitations and future perspectives in the field are discussed in order to disseminate to the medical and virological community this methodology that has great potential in detecting viruses in a quick, accurate and reliable fashion.
General structure of viruses
It is important to know the biomolecular structure to be able to associate spectral information with the presence or absence of viruses. Viruses can vary in structure, size and even composition, however, in most cases there are similarities. Viruses are mainly made up of proteins. A general structure can be described as an outer membrane formed by a lipid bilayer, which is called a viral envelope (in the case of enveloped viruses); surface proteins responsible for the first contact of the virus with host cells are usually found encrusted in the viral envelope; and more internally, there is another protein membrane called a capsid (or nucleocapsid), which is responsible for protecting genetic information (RNA or DNA). [14,19,40] Fig. 1 shows a scheme for the general structure for viruses such as Dengue, Zika, Chikungunya, Yellow fever, among others. For these viruses, the viral genome is a positive single-stranded RNA according to the Baltimore Class IV classification.
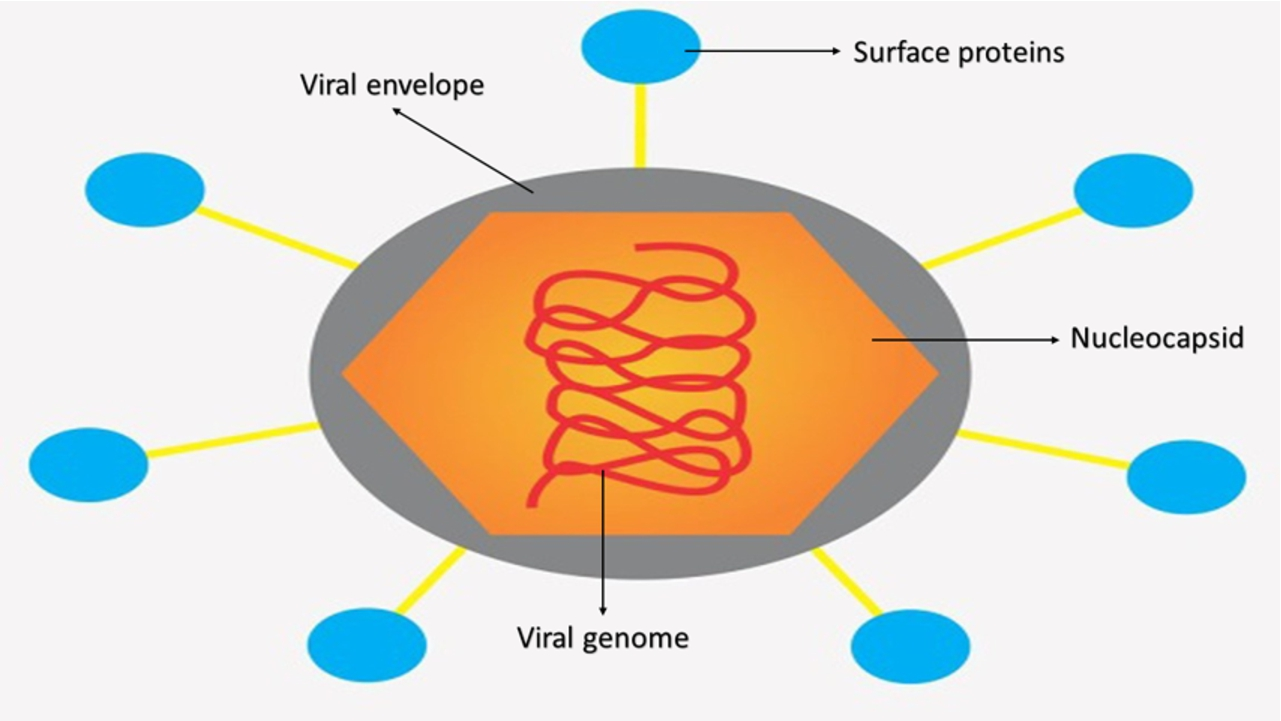
General structure of a flavivirus with its identified parts. For viruses such as Dengue, Zika, Chikungunya and Yellow Fever, the viral genome is a positive single-stranded RNA according to the Baltimore Class IV classification.
In the literature, several research articles and review articles that address the main methods of virus diagnosis can be found for Influenza [59], Ebola [7,11], Hepatitis B [33], Dengue [5,60], Zika [16,37,49], Chikungunya [1,32], among others. In view of the large number of existing viruses, here we will focus on the arboviruses Dengue, Zika and Chikungunya, since they are viruses that cause very similar symptoms and coexist in the same geographic regions. Viruses that coexist and exhibit similar symptoms are very common worldwide, and since the ELISA and PCR diagnostic methods are used for the vast majority, the discussion in this topic can be used for other viruses as well.
In 2017, the WHO published a document entitled “Tool for the diagnosis and care of patients with suspected arboviral diseases” where methods are provided that can be used in differential diagnosis by laboratories with installed capacity to identify Dengue, Chikungunya and Zika viruses antigenically, molecularly and serologically. [57] In Fig. 2, we can see the methods for the differential diagnosis using RT-PCR (Fig. 2a), and for differential diagnosis using ELISA (Fig. 2b), according to WHO. As demonstrated in the figure, it is necessary to repeat the analysis several times for both RT-PCR and ELISA method. This is because each analysis is specific to each virus. Thus, it is necessary to rule out co-infections. Still, for the ELISA technique, the diagnosis is not accurate. At best, infection with a particular virus can only be presumed.
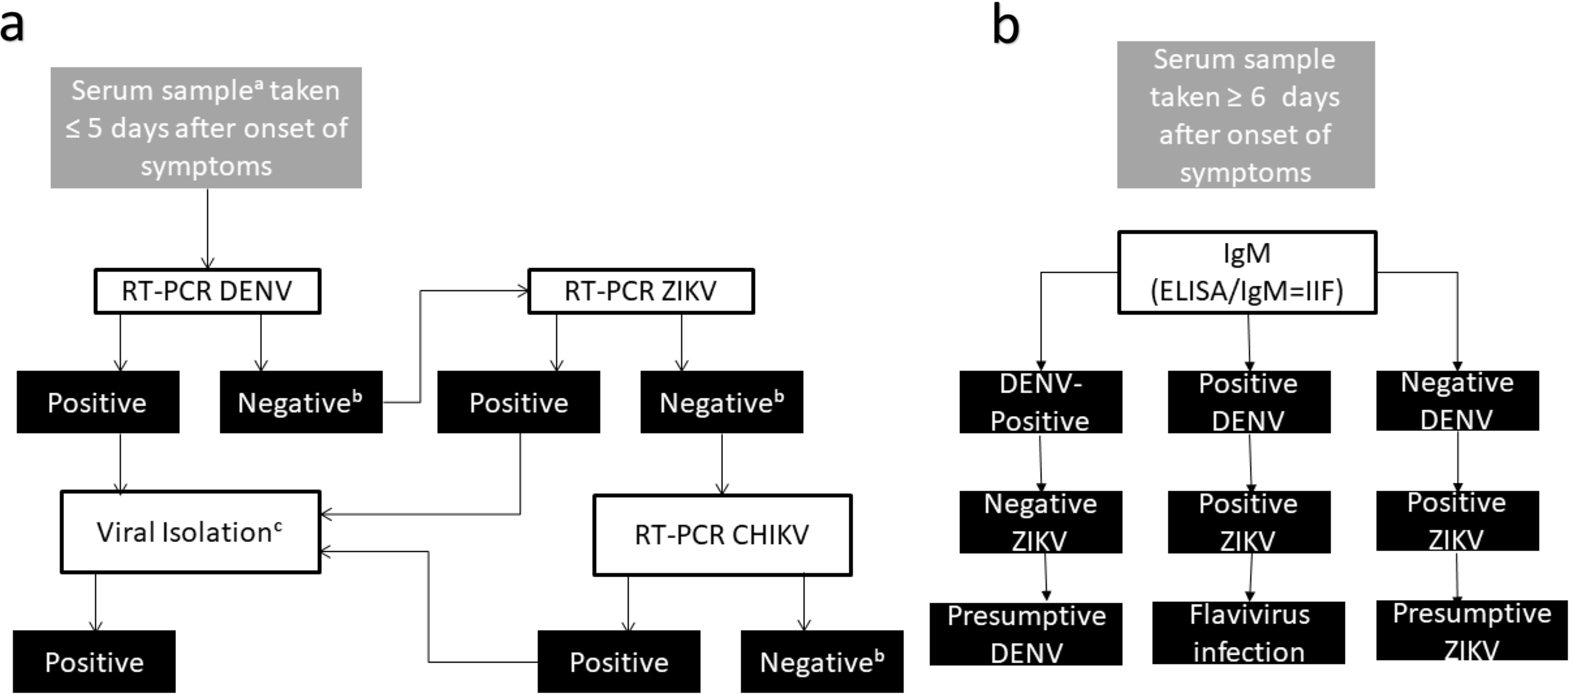
Algorithm for laboratory diagnosis for (a) RT-PCA: suspected cases of arbovirus: acute phase; (b) ELISA: suspected cases of arbovirus: convalescent phase. Inspired by reference [57]. aA urine sample is also recommended for PCR ZIKV. bConsider dengue NS1 antigen for determining DENV infection. cIsolation is not required in order to confirm infection; it is considered complementary information for identifying serotypes, genotypes, and strains of the arbovirus in question.
ATR-FTIR spectroscopy can be an advantageous alternative both from the point of view of time consumed for analysis and financial, since the use of reagents is not required. When interrogating biological samples with radiation in the mid-infrared region (4000–400
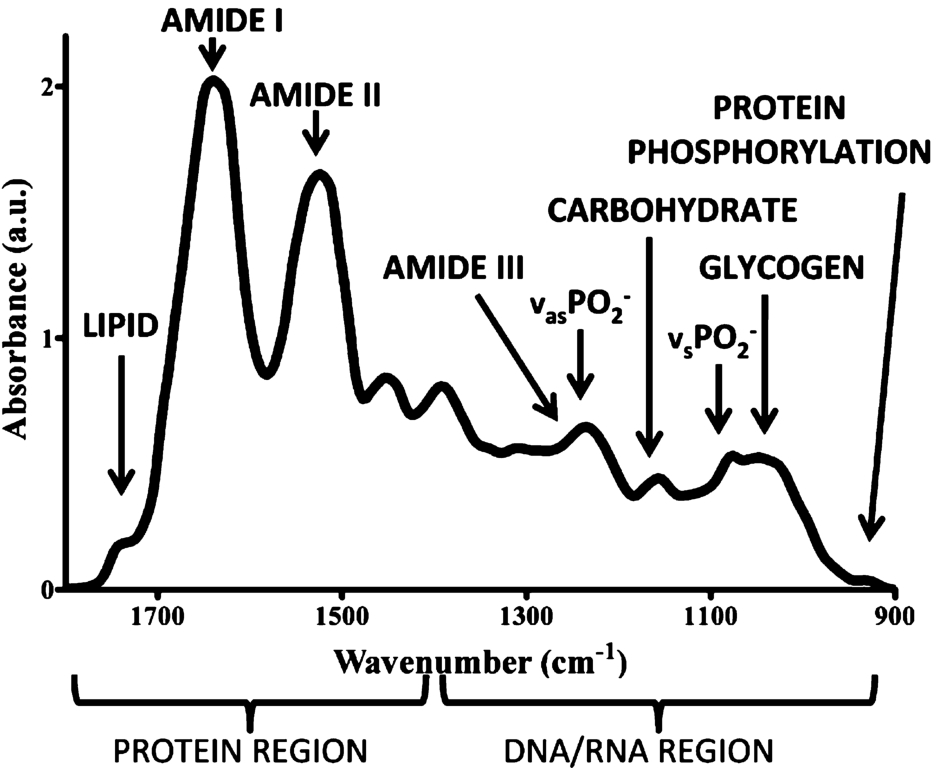
Example of a biological sample spectrum in the biofingerprint region of the mid infrared range. Reprinted (adapted) with permission from reference [17] (J.G. Kelly, et al., Biospectroscopy to metabolically profile biomolecular structure: a multistage approach linking computational analysis with biomarkers, Journal of Proteome Research
When acquiring spectra using an ATR-FTIR, a crystal (e.g., diamond size
The process of total reflection generates an evanescent wave that can penetrate for a few micrometers in the sample. The sample then absorbs part of this radiation, attenuating it, so that the instrument detects when it has been absorbed (or transmitted) and provides a spectrum. [4,17,24,35] Fig. 4 shows the process taking place on the ATR crystal. It is important to note that, as absorption is related to vibrations, the spectra provide compositional information for the analyzed sample in terms of vibration signals. This means that the presence or absence of viruses can translate into spectral variations. However, these variations are subtle, and generally cannot be detected just by viewing the spectra. For this reason, it is necessary to use mathematical tools capable of finding spectral features that best differentiate one class from another (e.g., infected vs. uninfected).
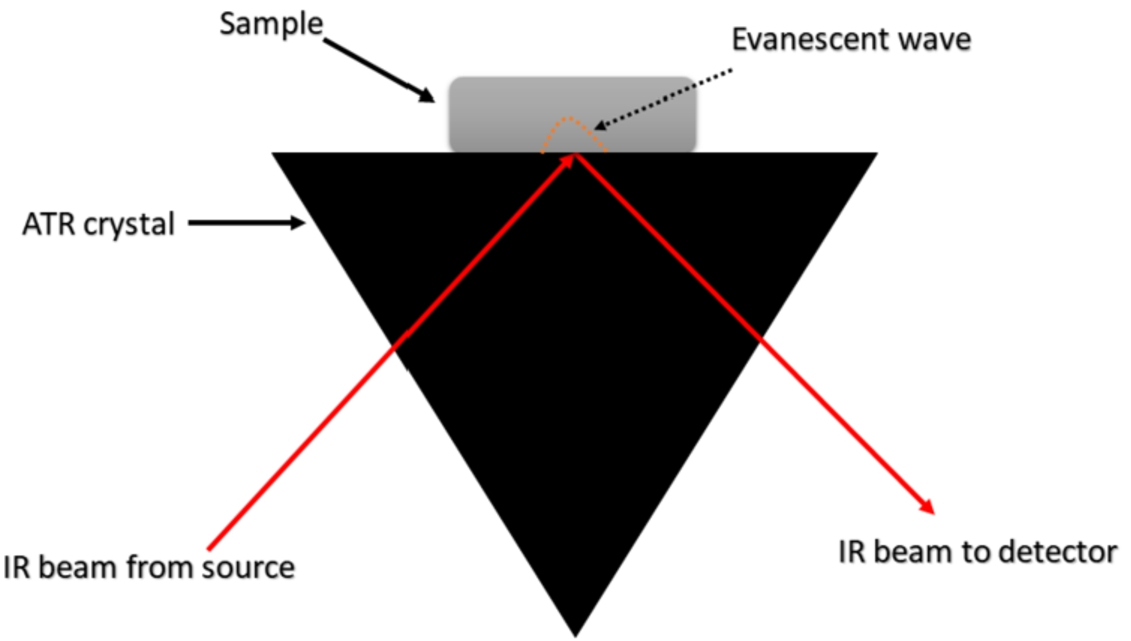
Illustration of the operation of the ATR device in spectral acquisition. An evanescent wave is generated by the total reflection of the incident radiation. This evanescent wave can penetrate through a few micrometres in the sample, which absorbs part of the radiation. This absorption can be detected by the instrument, generating the spectrum. Inspired by reference [35].
Infections caused by viruses involve complex processes, with changes in the structures of biomolecules and consequent spectral variations. These changes, of course, could make it difficult to detect these viral infections by ATR-FTIR; however, if properly investigated, they may provide specific information on the infection stage. As an example, we can analyze what happens to viral RNA during the infection phase. As mentioned here earlier, recent studies have demonstrated the dimensions and diversity of the viral epitranscriptome, demonstrating that they are much larger than formerly believed. It was observed that the Zika, Dengue, hepatitis C, poliovirus and human immunodeficiency type 1 viruses significantly altered the global PTM landscape. Direct comparison of viral epitranscriptomes identified specific and MTPs common to all viruses. This suggests that the study of MTPs, that is, the study of changes involving the genetic material of the virus during infection, may be an important way to detect viral infections by ATR-FTIR. Specific modifications of dimethylcytosine were present only in the total RNA of virus-infected cells and in the intracellular RNA of HCV and viral RNA of Zika and HCV virions. On the other hand, ZIKV and DENV encode a methyltransferase responsible for introducing this modification into viral RNA, which helps to guarantee the efficient translation of viral proteins and camouflages the viral RNA from cellular defense mechanisms against foreign RNA. In contrast, HCV and PV have no methyltransferase activity and are known to achieve similar goals by different means. [25] These are just one of several processes that are involved in the complex dynamics of a viral infection. The characteristics of each virus can be a differential for spectral discrimination between one virus and another.
Although ATR-FTIR is a non-target technique greatly affected by the sample environment and the virus type, spectral changes after viral infection will primarily occur due to protein, cell DNA, and RNA changes (Fig. 3). [46] Blood compounds such as total cholesterol, high-density lipoprotein (HDL) and low-density lipoprotein (LDL) cholesterol, triglycerides, albumin and total protein has been reported to decrease in concentration in patients infected with hepatitis B and C, while immunoglobulin G (IgG), A (IgA) and M (IgM) increase in concentration in infected patients when compared to controls. [41] Moreover, for hepatitis, several spectral features change for infected patients. [41] Table 1 summarizes these main spectral biomarkers that change after viral infection.
Main spectral markers associated with hepatitis infection. [41]
Main spectral markers associated with hepatitis infection. [41]
After spectral acquisition, the spectra are imported into some suitable software in order to carry out pre-processing and multivariate analysis. Among the available software options, MATLAB (MathWorks, Inc., United States) stands out. However, other interesting options are The Unscrambler (Camo Analytics, Norway), Pirouette (InfoMetrix, Inc., United States), and freely available software such as GNU Octave (
Preprocessing
One of the main steps after spectral acquisition is data pre-processing. Pre-processing can be applied to improve the signal-to-noise ratio of the data, adjust the baseline, among other reasons related to the physical nature of the samples, instruments and environment. In short, pre-processing works by eliminating physical interferences and highlighting the signal of interest.
The main pre-processing technique used to eliminate noise is Savitzky-Golay smoothing. However, attention must be taken and the correct parameters must be used since this technique can introduce distortions in the spectra and also “smooth” important information. As a result, parameters need to be chosen so that noise is reduced and peaks are valued. [48,58]
For removal of physical distortions in the data, differentiation techniques can be applied to correct baseline problems and solve band overlapping problems. Differentiation works by improving the differences between the spectral bands of interest and the existing baselines. First-order differentiation has been widely used in pre-processing steps, however, second-order differentiation provides symmetry which the absorption value. However, it is important to be careful when using second-order differentiation, as each order of differentiation greatly increase the noise. To reduce this effect, a Savitzky-Golay differentiation can be used which has the implicit smoothing. [48,58] Physical phenomena can also translate into distorted baselines. Rubberband baseline correction is one of the techniques capable of solving this problem. In this approach, a convex polygonal line whose edges are ‘valleys’ within the spectrum are found. Another possibility is to use manual point baseline correction. In this case, the user chooses the regions of wavenumbers of the polygonal line to be subtracted from the absorption spectra. [17,50] Manual baseline correction has been successfully applied by Zucchiatti et al. [64] In this study, the contribution of ribonucleic acid (RNA) to Fourier transform infrared (FTIR) spectra of eukaryotic cells was investigated. [64]
When analyzing biofluids such as plasma or serum, samples usually contain differences in the concentrations of some species. These concentration differences are one of the main sources of spectral variations between samples, thus affecting information of structural biochemical differences of interest (i.e., molecular structural changes caused by the presence or absence of viruses) in the spectrum. To minimize this problem, the spectra can be scaled through normalizations using some specific criteria. Two examples of widely used normalization are normalization by the peak of Amide I (1650
Multivariate analysis
After the pre-processing step, the mathematical tools capable of finding features in the data that differentiate samples can be applied. Since mid-infrared spectra are multivariate data (each spectrum is composed of many wavenumbers associated with their respective absorbance intensities), the analysis of these data can be done using multivariate analysis techniques. There are numerous techniques that can be used for this purpose, here we will describe some that have been used in studies involving virus analysis.
Principal component analysis (PCA) is an unsupervised analysis technique widely applied in chemometric studies. Undoubtedly, among unsupervised multivariate analysis techniques, PCA is the best known. This technique is called unsupervised because it does not work with training-labelled information, that is, no information is given about the spectra that are provided. Therefore, PCA is used mainly for exploratory analysis where similarities and dissimilarities can be observed between the samples in the principal components space. The principal components are those that have the greatest observed variance in the data after applying a linear transformation to the original data. This transformation provides new variables, which are the principal components (PCs). The PCs are composed of scores, representing the variance on sample direction, and loadings, representing the variance on wavenumber direction. The PCA scores are used to assess similarities/dissimilarities between the samples and the loadings to identify important wavenumbers responsible for the scores distribution pattern. PC1 is the component with the largest amount of information (largest observed variance), PC2 is the one that has the second largest observed variance, and so on. [35] Fig. 5 explains the structure of the PCA model in mathematical terms, where
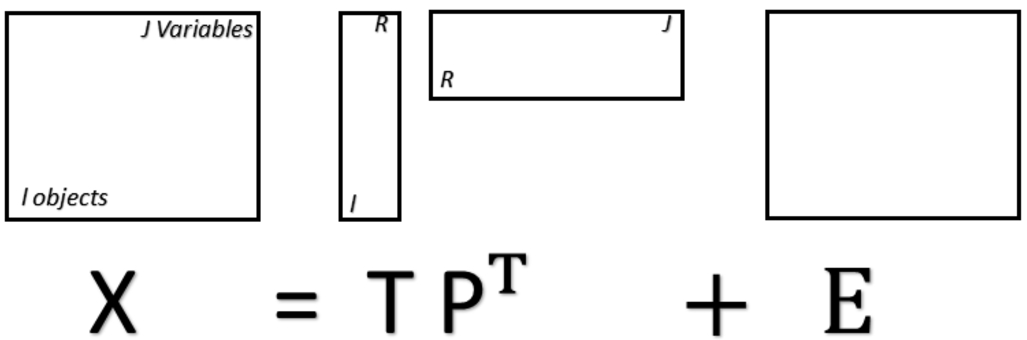
Matrixial representation of the PCA model, where X is a matrix with rows representing spectra and columns representing spectral variables (wavenumbers). T is a matrix containing the PCA scores, P is a matrix containing the PCA loadings, and E is a residual matrix. Superscript T represents the matrix-transpose operation.
PCA has been applied in the exploration of data for studies involving virus, where, for example, plasma samples with and without HIV virus have been discriminate by PCA [34]. However, this technique is not much efficient in distinguishing samples based on biofluids’ spectra in the presence or absence of viruses due to the large sample complexity in some cases. [40,45–47,52] This probably happens due to the high similarity observed in the samples and, consequently, in the spectra. Viruses represent the smallest part of the sample, therefore, spectral differences are minimal. That is, the similarity of the data is high, so that, is not possible to identify differences only by exploring the data in a unsupervised way. For this type of problem, a supervised approach is often necessary.
The term “supervised” refers to the fact that sample label information is provided in the training stage, where a pattern classification or recognition model is trained to recognize and associate information with their respective classes, for later, be proven in a test step where new samples (MIR spectra, in this case) are provided “blindly”. In the construction of this model, the samples can be separated into a training and test set randomly, or using sampling algorithms such as Kennard–Stone [18] or MLM [28]. Two of the most common supervised techniques are Linear Discriminant Analysis (LDA) and Quadratic Discriminant Analysis (QDA).
LDA is one of the most used supervised techniques in chemometric and multivariate classification studies. LDA is based on a Mahalanobis distance calculation between the samples that fits a linear plane of separation perpendicular to the main direction of data variance. [55] In order to obtain the discriminant profile, the LDA calculates the classification score (
QDA works similar to LDA; however, in QDA the covariance matrices are not considered equal (if they are really equal, the decision limit will be linear and the QDA will be reduced to LDA). [51] The classification score for QDA is found based on Eq. (2):
Based on the principle of using covariance matrices that are similar for all classes in LDA, and different in QDA, we can assume that, normally, for more complex data where the variance between the classes is highly different, QDA will obtain a better response. On the other hand, for simpler data sets with unique variance structure, LDA should get better results. Therefore, both LDA or QDA can be applied for supervised classification purposes. However, for big multivariate data such as spectra of biological samples, where the number of spectra variables is often larger than the number of training samples and a high degree of spectral overlapping features is present, a previous method is generally applied to reduce the sample size before applying LDA or QDA. This assists the LDA or QDA in the classification work, since the dataset is reduced and a large amount of redundant information is eliminated. A method widely used for dimensional reduction is precisely the PCA previously described. Therefore, PCA with LDA or QDA can be used together, which is called PCA-LDA or PCA-QDA, respectively.
Other techniques can be used instead of the PCA for feature extraction/selection. For example, techniques of variables selection, such as the Successive Projections Algorithm (SPA) and the Genetic Algorithm (GA). The SPA considers each variable present in the training set as a vector. These vectors are subjected to projection operations resulting in the creation of K chains of variables. A given chain starts with a variable and progressively increases with variables that have the least redundancy in relation to the previous ones (least collinearity) [46], and the collinearity is assessed based on the projections.
GA selects variables based on a computational approach following Darwin’s natural selection process. In the process, GA creates an initial population formed by subsets of variables. Each variable is initially randomly assigned a value of 0 (variables not initially selected) or a value of 1 (variables initially selected). Each subset of variables is assigned a fitness value based on a fitness function. Based on this fitness criterium, the selection stage takes place where the subset of lesser fitness is eliminated, and those of greater fitness can be duplicated. In a second step, the mutation and crossover genetic operators can change selected variables to unselected (or the opposite), and cross two subsets of variables, respectively. This whole process is called generation. This process is repeated for a number of generations, and in the end, the subset of the best fitness is that of the selected variables. [53] Finally, it is also possible to associate SPA and GA with LDA or QDA for classification. In this case, we call these algorithms SPA-LDA, SPA-QDA, GA-LDA or GA-QDA.
To measure the predictive capacity of the model, we rely on true positives (TP), true negatives (TN), false positives (FP) and false negatives (FN). Based on these values, quality measures such as sensitivity and specificity can be calculated. Sensitivity (SENS) represents the portion of positive samples correctly classified and specificity (SPEC) represents the portion of negative samples correctly classified. Equations (6) and (7) show how to calculate sensitivity and specificity, respectively. Other figures of merit can be found easily in the literature. [46]
In Fig. 6 we can see a flow chart summarizing the fundamental steps for a study based on the fundamentals presented here.
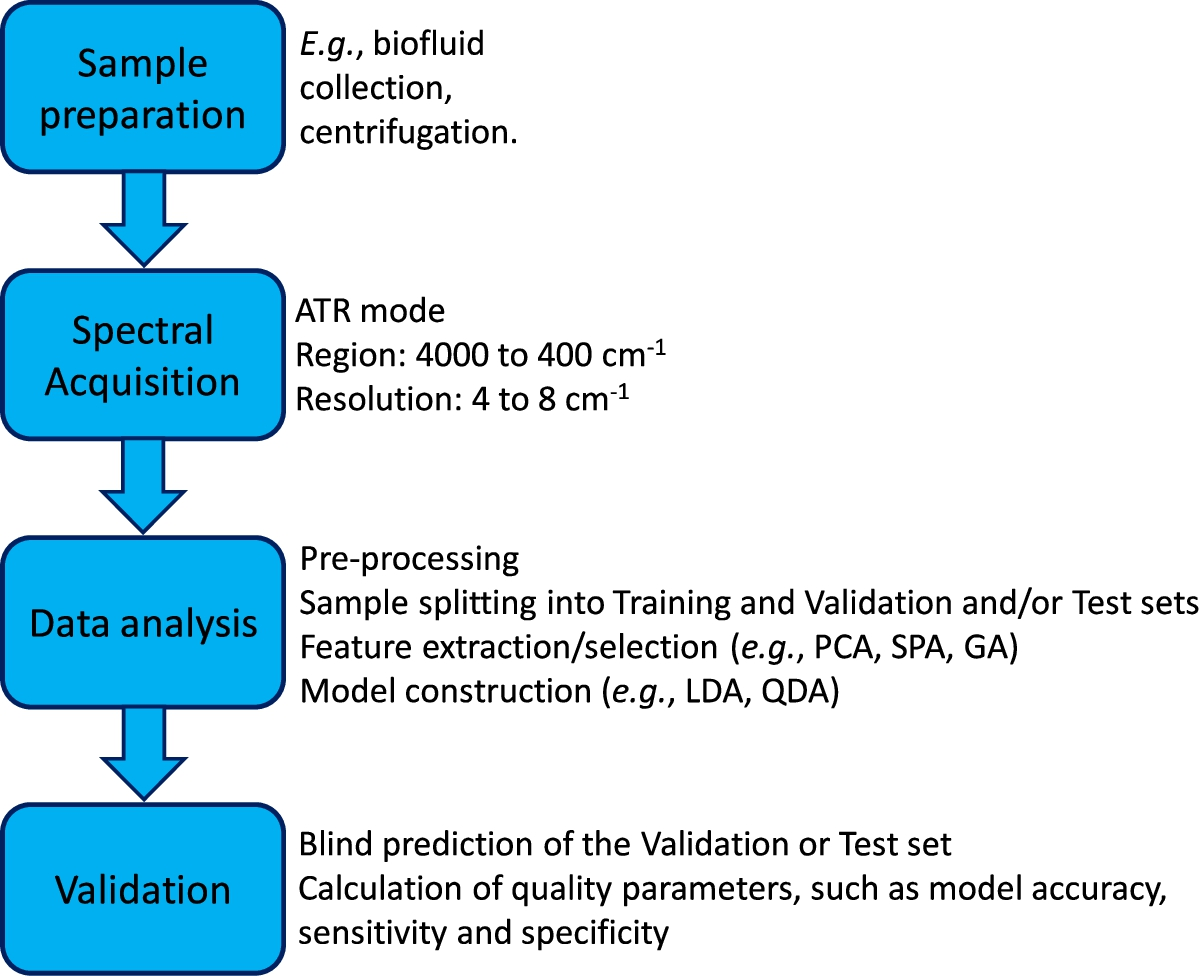
Flowchart summarizing the fundamental steps of a multivariate classification study based on ATR-FTIR spectra.
Detection and quantification of poliovirus infections using FTIR spectroscopy and cell culture has been done by Lee-Montiel and collaborators. [20] In this study, the authors explain the problems found in current virus detection methods. They are complex and time-consuming, making detection at the point-of-care difficult. For this, they suggest the use of ATR-FTIR spectroscopy as a fast, sensitive and highly specific method to quantify potentially dangerous viral pathogens and to determine whether suspicious materials contain viable viral particles. Therefore, poliovirus (PV1) was used to evaluate the usefulness of FTIR spectroscopy with cell culture for rapid detection of infectious viral particles. For this, buffalo green monkey kidney cells (BGMK) infected with different virus titers were studied from 1 to 12 hours after infection (h.p.i.). It was concluded that this approach for the detection and quantification of poliovirus has the potential to be extended to other viruses, and can be adaptable to an automated scheme for use in water safety monitoring, medical diagnosis, among others. [20]
In another study, Santos et. al. [45] used ATR-FTIR spectroscopy in conjunction with multivariate analysis techniques to detect different viral loads of dengue serotype 3 (DENV-3) in blood and serum. In this study, 40 blood and serum samples were infected with four different viral loads of DENV-3 (10 samples for each viral load). Then, spectra in the 1800 to 900
Naseer et. al. [31] also studied ATR-FTIR spectroscopy in the diagnosis of dengue. In this study, they sought to identify biochemical marks differentially expressed in lyophilized human blood sera infected with dengue and healthy. They used a total of 77 samples, where 57 were infected with DENV and 20 were healthy. As multivariate analysis algorithms, they used principal component analysis (PCA), linear discriminant analysis (LDA) and partial least squares regression (PLSR) in the differentiation between classes based on the region between 1601 and 1501
ATR-FTIR spectroscopy was also employed in the diagnosis of hepatitis C and B viruses. [41] In this study, the capacity of the technique was evaluated together with multivariate analysis techniques in the classification of human serum samples based on the presence of HBC and HCV infections. The classification technique used by them was the partial least squares discriminant analysis (PLS-DA), which is a variation of the PLS algorithm used in the discriminant analysis. The samples were separated into training (70%) and test sets (30%). The positive spectra for HBC and HCV showed an intense band observed at 1631
Advantages and disadvantages of the technique
Among the advantages of ATR-FTIR spectroscopy we can highlight the high signal-to-noise ratio, reduced dispersion, good spatial resolution, non-destructiveness, no sample preparation (or minimal preparation), low relative cost, and automated analysis. Among the disadvantages, we can highlight that the analysis can be destructive if too much pressure is applied on the sample,
Future perspectives
As has been seen, viral diagnostic techniques that are used nowadays are a double-edged sword, where advantages and disadvantages are mutually observed. Direct methods are more specific, however, they take time and are more expensive. Indirect methods are faster and cheaper, but are less specific. Based on this assessment, ATR-FTIR spectroscopy emerges as a tool with the potential to solve the deficiencies found by standard techniques. ATR-FTIR spectroscopy is known to have a fast response and provide reliable information about the sample composition, and has been used in several virological applications for screening or diagnosis of viral infections.
Knowing that vibrational spectroscopy is fast, non-destructive and has a low-cost, we can imagine that, with new studies developed in this area, soon we can count with spectroscopic tools in clinics and hospitals, being used for routine diagnostic or acting as a reliable diagnostic aiding tool. For this, only a minimal amount of collected biofluid would be needed. Spectral acquisition of this biofluid would be done by an instrument coupled to a computer where this spectral information would be automatically imported into software that would perform all computational procedures in real time (pre-processing and multivariate classification), based on a previously constructed and optimized model.
Conclusions
It cannot be denied that ATR-FTIR spectroscopy has several advantages that attribute to this technique a great potential towards viral diagnostic routines. This technique cannot be overlooked, and must be considered an possible alternative for viral diagnosis especially when experiencing global problems such as the one caused by COVID-19. Several people die every day for lack of a quick, reliable and relatively inexpensive diagnosis. In conjunction with spectroscopic analysis, multivariate data analysis provides powerful support for interpretation and pattern recognition. Finally, spectroscopy approaches combined with multivariate analysis provide a powerful weapon in studies for development of rapid diagnostics, which can be extended to several viruses of different types and strains. With that, we encourage the scientific community to explore this field of study.
Footnotes
Acknowledgements
M.C.D. Santos would like to thank PPGQ/UFRN and CNPq grant (140968/2018-0) for financial support. C.L.M. Morais would like to thank the Coordenação de Aperfeiçoamento de Pessoal de Nível Superior (CAPES) – Brazil (grant 88881.128982/2016-01) for his research grant.
Conflict of interest
The author has no conflict of interest to report.