Objective timing of stroke in emergency departments is expected to improve patient stratification. Magnetic resonance imaging (MRI) relaxations times, and , in abnormal diffusion delineated ischaemic tissue were used as proxies of stroke time in a rat model.
Methods:
Both ‘non-ischaemic reference’-dependent and -independent estimators were generated. Apparent diffusion coefficient (ADC), and , were sequentially quantified for up to 6 hours of stroke in rats () at 4.7T. The ischaemic lesion was identified as a contiguous collection of voxels with low ADC. and in the ischaemic lesion and in the contralateral non-ischaemic brain tissue were determined. Differences in mean MRI relaxation times between ischaemic and non-ischaemic volumes were used to create reference-dependent estimator. For the reference-independent procedure, only the parameters associated with log-logistic fits to the and distributions within the ADC-delineated lesions were used for the onset time estimation.
Result:
The reference-independent estimators from and data provided stroke onset time with precisions of and minutes, respectively. The reference-dependent estimators yielded respective precisions of and minutes.
Conclusions:
A ‘non-ischaemic anatomical reference’-independent estimator for stroke onset time from relaxometric MRI data is shown to yield greater timing precision than previously obtained through reference-dependent procedures.
The current pharmacological treatments of an ischaemic stroke, including recombinant plasminogen activator, can only be administered within strict time limits [6]. This is due to two key reasons, as (i) irreversible damage to brain parenchyma advances with time [26] and (ii) the benefits of pharmacotherapy are outweighed by adverse effects [4]. Estimates of the number of neural cells and functionality lost per minute of ischaemia [21] stress the earliest possible administration of thrombolytic and/or anti-ischaemic therapy. Thus, stroke duration is seen as a crucial proxy of both brain state and a predictor of functional recovery, and consequently will play a pivotal role in the objective determination of onset time in the clinical settings.
A growing body of evidence indicates magnetic resonance imaging (MRI) protocols provide clinically acceptable timing of stroke onset [9,20,27,29]. The difference between MRI relaxation times and in ischaemic brain tissue, as defined by its low apparent diffusion coefficient (ADC), and contra-lateral non-ischaemic tissue has been observed to increase linearly with time, thus, providing the means for estimating the onset of ischaemic stroke [9,25]. For example, an application of the difference approach for stroke timing has yielded promising results in patients [27], and a similar approach using -FLAIR as a proxy of stroke duration [29] has been trialled in patients with variable success [3]. Of these, the latter apparently has an acceptable specificity for clinical exploitation, however, the sensitivity remains low [29] when compared with the use of quantitative relaxation times [27].
The key difficulty in the application of MRI relaxation times in stroke timing clinically is that it is difficult to know the baseline value at each voxel of the ischaemic lesion before the onset of ischaemia, such that the deviation from baseline due to ischaemia cannot be calculated with certainty. For this reason, some authors have sought to select a set of non-ischaemic voxels as a ‘reference’ region, representative of the lesion prior to the onset of ischaemia [27]. However, this approach is confounded by the inherently varying MRI relaxation times across the brain [30], such that the ‘reference’ voxels may not faithfully represent those of the lesion prior to the onset of ischaemia. Given that the distribution of relaxation times in the human brain is broader than the change caused by ischaemia, the challenge of selecting an appropriate set of reference voxels, and the consequences of failing to do so, have presented a major barrier.
Motivated by these factors, we present here a mathematical procedure for ‘non-ischaemic reference’-independent stroke time estimation. Relaxometric MRI data from permanent focal ischaemia in rats was used to assess the capability of the mathematical model for timing of stroke onset.
Methods
Animal model
Male Wistar rats (, approximately 300 g) underwent permanent middle cerebral artery occlusion (MCAO) to induce focal stroke [17]. Animals were euthanized by intravenous injection of saturated KCI at the end of the experiment. Animal procedures were conducted according to European Community Council Directives 86/609/EEC guidelines and approved by the Animal Care and Use Committee of the University of Eastern Finland.
Image acquisition
MRI data were acquired according to the methods described by Jokivarsi et al. [9]. The trace of the diffusion tensor (), and MR images from a single 2 mm slice were obtained at 30–60 min intervals for 6 h after induction of focal brain ischaemia using a horizontal Varian UnityInova MRI system operating at 4.7T with a volume coil transmit/quadrature half-volume receive set-up (Rapid Biomedical GmbH, Rimpar, Germany). The ADC was determined from spin echo images with 4 bipolar gradients along each axis with 4 b-values ranging from 0 to 1,370 s mm2 (field of view , data points, echo time 55 ms). Fast spin-echo (FSE) readout data ( pixels, echo spacing 10 ms, FOV ) was used for and MRI. The on-resonance spin-lock MRI was acquired with a continuous wave approach. A contrast formation block of AHP-SL-AHP (AHP = adiabatic half passage, SL = spin-lock) segment was added before readout. Adiabatic spin-lock pulses ranging from 8 to 64 ms were used [SL amplitude (B1,SL) 0.4 G, time to repetition (TR) 2.5 s and time to echo (TE) 6 ms]. images were collected using the above FSE readout in front of a preparation block consisting of adiabatic pulses (AHP-TE/4-AFP-TE/2-AFP-TE/4-reverse; five TEs of 10, 20, 40, 60 and 80 ms). The adiabatic refocussing pulses in a single slice mode was used to minimise contributions of non-spin echo coherences [23]. Total acquisition time for , and was 24 min.
Image processing
All image post-processing was performed using in-house designed software written in the MATLAB programming environment (MathWorks, Natick, Massachusetts, USA).
and weighted MR images were filtered with a squared Hamming window function in the phase and frequency encoded dimensions of k-space prior to computing parametric maps. and relaxation maps were computed from a voxel-wise monoexponential fit, where the data were first transformed to a logarithmic space then fitted via linear least squares. and weighted images were generated by summing all echo and spin-lock time images, respectively.
Lesion detection was performed on reciprocal ADC images where regions of hyperintensity are suggestive of an ischaemic assault. More formally, we have defined a lesion as the largest connected cluster of voxels whose values all exceed one median absolute deviation above the whole brain median value [13]. The output from the detection procedure was a binary mask, where ischaemic voxels were flagged with the value of one and all others set to zero.
Statistical models for estimating onset time
At present, the state-of-the-art estimators for time from stroke onset are based upon measuring or , i.e. the difference between the mean or within the lesion and some user-defined reference region, for example, the contra-laterally mirrored lesion [20,25,27]. The mean value is typically estimated via the average of the voxel values within a given region. These averages are then used to train a linear regression model that is the main tool through which estimation is performed.
One of the primary disadvantages associated with these estimators is the arbitrary choice of the reference region, which if not chosen appropriately, in terms of the anatomical and/or tissue type match with respect to the ischaemic lesion, can dramatically affect their reliability. Furthermore, their robustness is governed by the ability to accurately estimate the mean or values, which is challenging given that the number of ischaemic voxels can vary considerably between strokes and with time in stroked tissue. Also, voxel values can exhibit heavy-tailed empirical distributions for which the mean value is not well defined, making the average estimator potentially unreliable.
Motivated by the disadvantages mentioned above, we have explored the idea of designing robust reference-independent estimators that exploit information from the full empirical distribution of the or data in ischaemic voxels only. For improved robustness with large as well as small regions, we underpin the linear regression estimators with a parametric statistical model of the empirical distribution that provides a low-dimensional structure with favourable regularity properties.
Distributional models for MR parameters
Appropriate parametric statistical models for and voxel values within ischaemic lesions were identified by using the MATLAB statistical distribution fitting toolbox. In particular, histograms of and within the lesion were computed, then area-normalised to represent probability densities. Individual (specified below) distributions were fitted to the data by maximum likelihood estimation and compared with their empirical distributions. The model that on average scored the best Akaike information criteria (AIC) value was then selected to design the regression method.
Training and testing of estimators
As with the state-of-the-art, our estimators were chosen to take the form of a multiple linear regression. Here, it is important to note that the assumption of linearity applies only to the coefficients of the estimators and does not necessarily imply that MR parameters vary linearly in time.
To mitigate the possibility of over-fitting we used a leave-one-out cross-validation approach to split the data used to train and to test the estimators. Precisely, our dataset of 8 rats (total of 45 sets of relaxometric data) was iteratively separated into a training set consisting of the scans of 7 rats, and a testing set consisting of the scans of the remaining rat. For each scan in the training set, the parameters associated with the statistical model of ischaemic were estimated by maximum likelihood and then used collectively to train a polynomial regression estimator (this procedure was iterated over all rats, yielding a total of 8 and 8 reference-independent estimators). A similar approach was used for signal intensities in and weighted images. Finally, the performance of the regression estimates was assessed by measuring the root mean-squared-error (RMSE) with respect to the true onset times.
To serve as a comparison, we also computed linear regressions based on and predictors, where the reference region was defined as the contra-lateral mirrored lesion as described previously [25].
Results
Lesion detection
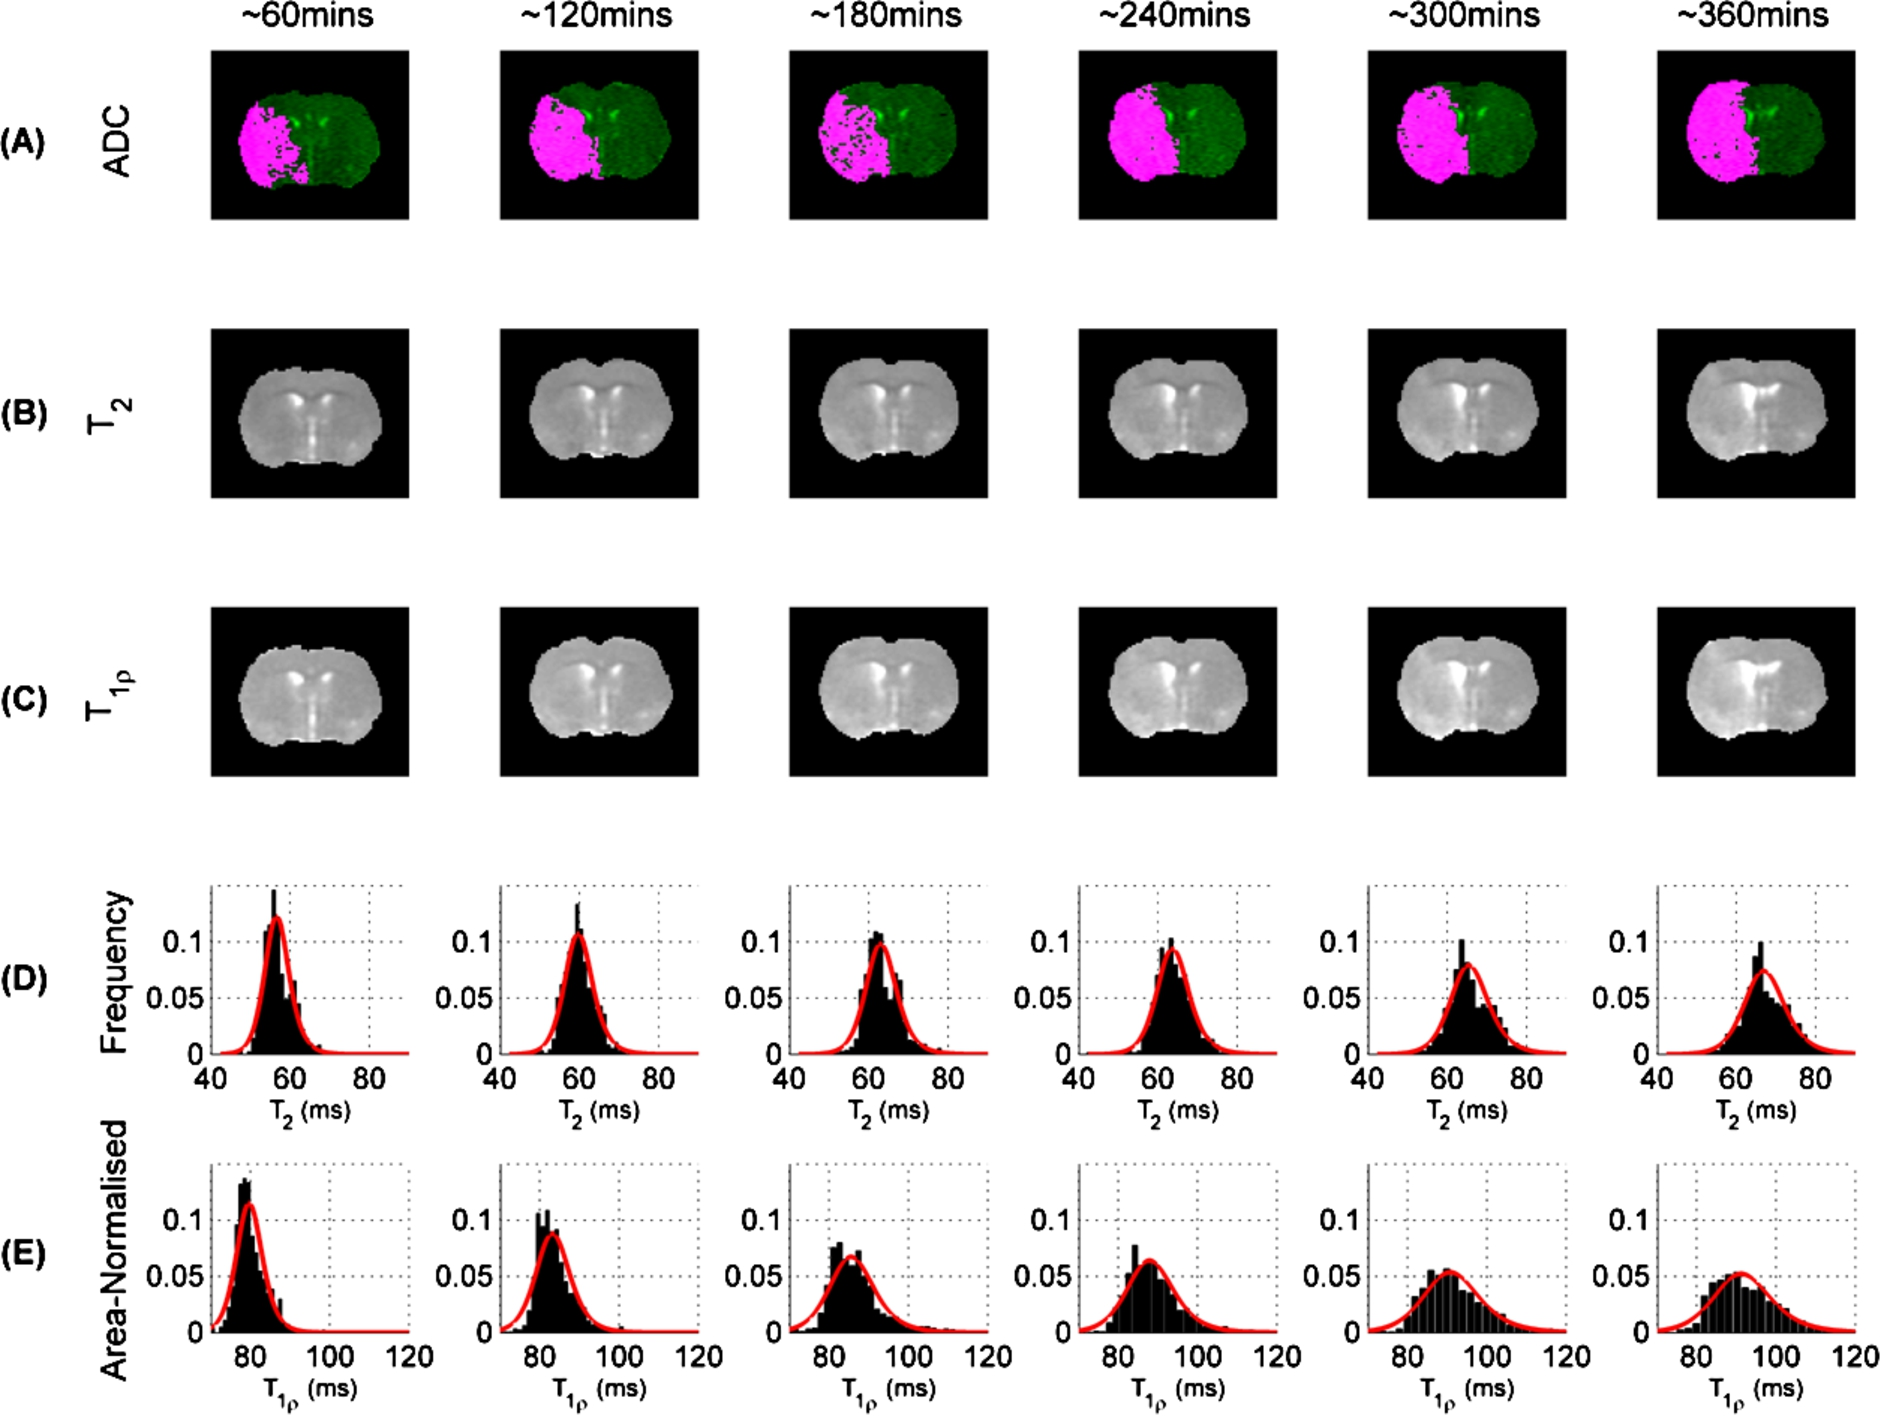
ADC images, including lesion mask overlays, from a typical rat brain acquired over multiple time-points are given in Figure 1(A). As indicated in the images, the lesion masks form a single contiguous region and their volumes generally increase from time of stroke onset reaching % of the MRI slice area by 6 hours. ADC values of voxels in the lesion were % from those determined in the contralateral non-ischaemic brain parenchyma confirming presence of severe ischaemia [7].
(A) ADC images (green) with lesion masks (pink), (B) and (C) maps from a typical rat across multiple time points (separated by approximately 1-hour intervals). (D) Distribution of within ADC lesion and (E) distribution of within ADC lesion across multiple time-points.
Statistical models for MR parameters
Histograms are given for (Figure 1(D)) and (Figure 1(E)) within the identified lesions for a typical rat (see Figure 1(A) for ADC, 1(B) for and 1(C) for images). The histograms show that there was a right-shift in both and distributions within the lesion as time from stroke onset increased. It is precisely this information that is exploited in the current and estimators [9]. In addition to the value shift, the histograms also reveal that the general spread of the and distributions increases with time from stroke onset. A similar investigation focusing now on the contra-lateral mirror reference was also performed and found that both and distributions remain approximately stationary across time-points (not shown).
As mentioned earlier, in order to identify a low-dimensional representation of the empirical distribution, several statistical distributions were fitted to the data. Namely, the normal, lognormal, log-logistic [5] and scaled Burr distributions [1]. Of these models the 2-parameter log-logistic distribution, i.e. was found to be the most suitable for both and values within the lesion, as determined by obtaining, on average, the best AIC value (Figure 1(D) and (E) display the distribution fits in red). Here, the log-logistic parameters respectively denote the log-median value and distributional shape for a given MR parameter within the lesion.
The log-logistic model was also found to be suitable for describing the distributions of and signal intensities within the lesion. However, very little difference was observed between time-points, i.e. little to no drift or spread (Supplementary Information, Figure S1).
Regression estimators
The anatomical reference-independent regression estimators were designed using (functions of) the parameters associated with the log-logistic fits, i.e. the μ and σ parameters. For the -based estimator, a 3-parameter regression (including one constant term) was found to be most accurate: (), with an associated RMSE of .
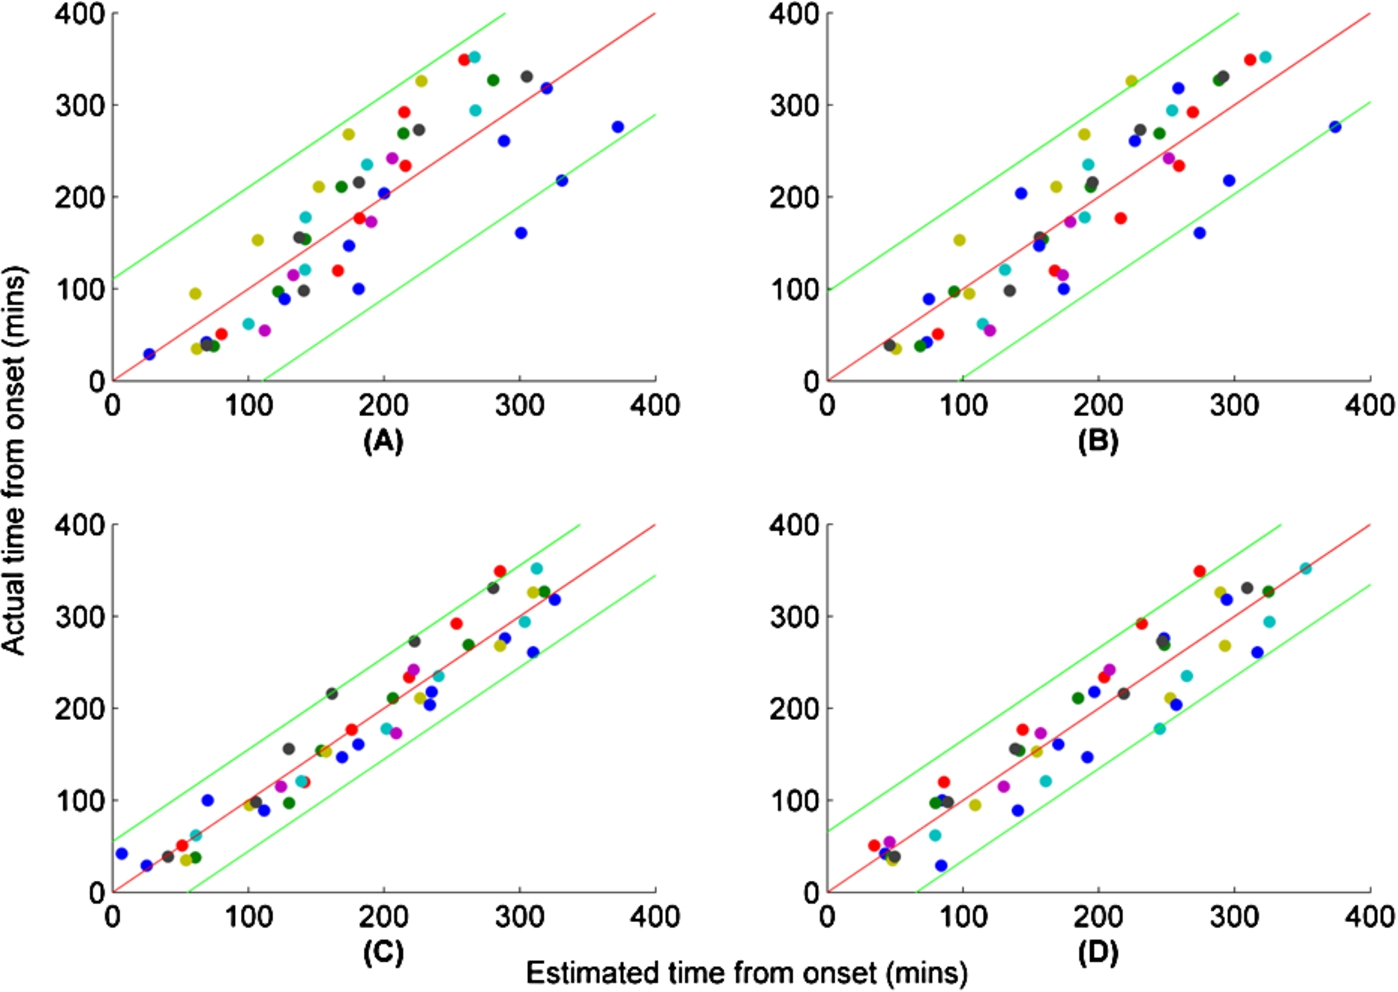
Estimated time vs. actual time of onset for several regression estimators. (A) Reference-dependent (B) Reference-dependent (C) Reference-independent multiple linear regression. (D) Reference-independent multiple polynomial regression. 95% prediction intervals are given by green curves. Zero residual error is indicated by red curves. Coloured dots correspond to estimates from individual rats. Both axes are in minutes.
For the -based estimator, a 7-parameter estimator based on a third-order polynomial was chosen: (), with an associated RMSE of .
Figures 2(C) and (D) show the fits for the and estimators, respectively, where 95% prediction intervals are given by green curves. These results were notably more accurate than those associated with the 2-parameter regression based on (Figure 2(A), , pairwise Bartlett test) and (Figure 2(B), , pairwise Bartlett test), which only achieved RMSEs of and respectively. It is worth noting that uncertainties here are larger than previously reported [25]. This is primarily due to different uncertainty quantification approaches. Rogers et al. [25] used an analytical uncertainty propagation method that is liberal to approximate precision at a given time point, whereas here we assess precision empirically by cross-validation and report RMSE across all time points. An interval-wise breakdown of the results for all estimators is given in Table 1.
In addition to measuring the precision of reference-dependent estimators, we investigated their robustness through consideration of randomly-shifted reference regions (Supplementary Information, Figure S2 and S3). The results showed that overall precision is sensitive to reference placement, with RMSEs often larger than those reported for the mirrored contra-lateral reference.
Interval-wise breakdown of estimated vs. actual onset times. Values are displayed as mean ± SD. 95% confidence intervals for estimated means were computed from , where SEM is standard error of mean, and is the Student t-value for the 95% interval and N degrees of freedom
reference-independent ()
Timing (mins)
Parameters
Estimation (mins)
Interval
Mean time
(log ms)
()
95% CI
000–060 ()
41.3 ± 8.4
50.3 ± 14.5
37–63
060–120 ()
97.0 ± 16.4
99.7 ± 22.4
81–118
120–180 ()
157.8 ± 16.8
166.9 ± 31.6
143–191
180–240 ()
218.4 ± 11.0
225.5 ± 30.0
199–252
240–300 ()
271.9 ± 15.6
264.7 ± 39.4
233–297
300–360 ()
333.8 ± 12.4
307.4 ± 25.6
282–333
reference-independent ()
Timing (mins)
Parameters
Estimation (mins)
Interval
Mean time
(log ms)
()
95% CI
000–060 ()
41.9 ± 10.4
37.5 ± 22.6
23–60
060–120 ()
102.4 ± 11.6
115.3 ± 22.1
84–120
120–180 ()
160.4 ± 11.2
172.2 ± 24.2
141–180
180–240 ()
219.4 ± 12.9
218.0 ± 23.5
200–239
240–300 ()
274.1 ± 11.5
275.2 ± 28.6
249–300
300–360 ()
331.8 ± 12.4
305.3 ± 16.6
315–348
reference-dependent ()
Timing (mins)
Parameters
Estimation (mins)
Interval
Mean time
(ms)
95% CI
000–060 ()
41.3 ± 8.4
−2.92 ± 1.71
59.0 ± 41.6
22–96
060–120 ()
97.0 ± 16.4
−0.02 ± 1.49
129.6 ± 36.3
100–159
120–180 ()
157.8 ± 16.8
1.77 ± 1.97
173.1 ± 47.9
137–209
180–240 ()
218.4 ± 11.0
3.16 ± 2.01
206.8 ± 48.9
163–251
240–300 ()
271.9 ± 15.6
5.14 ± 2.07
255.0 ± 50.3
214–296
300–360 ()
333.8 ± 12.4
6.29 ± 1.36
282.8 ± 33.0
250–316
reference-dependent ()
Timing (mins)
Parameters
Estimation (mins)
Interval
Mean time
(ms)
95% CI
000–060 ()
41.9 ± 10.4
2.17 ± 1.28
74.3 ± 23.9
55–94
060–120 ()
102.4 ± 11.6
5.38 ± 1.79
134.1 ± 33.3
107–161
120–180 ()
160.4 ± 11.2
7.42 ± 2.96
172.1 ± 55.1
127–217
180–240 ()
219.4 ± 12.9
9.21 ± 2.76
205.4 ± 51.3
164–247
240–300 ()
274.1 ± 11.5
11.66 ± 3.25
251.0 ± 60.4
197–305
300–360 ()
331.8 ± 12.4
13.03 ± 1.63
276.4 ± 30.3
246–307
Estimators based on and signal intensities, averaged over their respective echo and spin-lock times, were also considered. However, they performed poorly because the statistical distributions lacked any significant time-dependence (Supplementary Information, Figure S1). A reference-independent estimator that combined both and log-logistic parameters was also constructed. However, our results indicated that these were highly correlated, and therefore no significant improvement in precision was observed.
Discussion
The current study has established a stroke onset timing procedure using quantitative relaxometric MRI data only from the ischaemic lesion delineated by low ADC. The use of low ADC for selection of tissue for relaxometric data assures that only ischaemic volumes [7] are used for timing. Low ADC eliminates non-ischaemic regions from timing analyses, because reperfusion in the early hours of ischaemia normalises ADC [11,16]. It should be noted that quantitative ADC alone provides no time information [15], neither does the rate at which ADC lesion expands [13] in the early hours of ischaemia in permanent MCAO. This ‘anatomical reference-independent’ procedure performs better in timing than the one using MRI data from a non-ischaemic reference region. As the quantitative (which is commonly available in standard clinical MRI systems) provides excellent precision for stroke time estimates in the preclinical model, the presented procedure is thought to bear significant potential for stroke patient stratification.
The current MRI-based timing estimation procedures rely on the differences in average values of distributions of relaxation times between ischaemic tissue and non-ischaemic reference, i.e. and . A substantial body of evidence shows that the time dependence of both and in the rat brain can be adequately described by a linear function [9,20,25] and similarly in human brain [27]. The -based estimators have been reported to classify stroke onset within 3 hours with a precision of 0.850 in rats [19] and 0.757 in humans [27] indicative of clinical utility. However, the precision of timing by these reference-dependent estimators strictly depends on the selection of an anatomically identical non-ischaemic reference region for the ischaemic lesion. This is a non-trivial task even for the simple rat brain (see Supplementary Information Figure S3). In humans, reference selection will become even more problematic due to inherent relaxation time differences in GM and WM [30], variation of in WM due to microstructure [14], as well as the lack of ‘perfect anatomical symmetry’ of hemispheres to choose a suitable ‘mirror reference’ over the midline. Furthermore, stroke lesions in humans vary in location and size.
The stroke time estimators introduced in this paper use only the or data from low ADC-defined ischaemic brain tissue. Our data indicate that information embedded within the distributions of and can be exploited to build multiple linear regression estimators independent of MRI data from a non-ischaemic reference, provided relaxation data from multiple time points are available. In other words, the time dependency of the parameters in regression estimators needs to be determined similar to the and time dependencies used in the recent estimators [9,27]. The pathophysiological basis underpinning the estimators is likely to be that the volume of brain tissue with abnormally elevated MRI relaxation times increases linearly with time [20]. This is due to the effects of cytotoxic oedema on both [10] and relaxation times with macromolecular breakdown [13] followed by vasogenic oedema on hydrodynamics within ischaemic tissue [28]. In addition to cytotoxic and vasogenic oedema, altered chemical exchange processes may influence relaxation in ischaemia [8]. The spread of effects of ischaemia in the brain tissue in the early hours of the insult has been proposed to be the critical factor underpinning the time-dependent increase in relaxation time due to cytotoxic oedema [13]. We speculate that this spread is captured by the log-logistic fits of the relaxation time distributions to provide accurate stroke time estimation.
Regarding the utility of the current time estimator in stroke imaging, several points should be considered. Firstly, while both and MRI are in use in general radiology, is not part of brain MRI protocol in clinics due to specific absorption rate of energy concerns. Therefore, the estimator based on data may bear clinical potentials. Secondly, it should be stressed that the time estimators are generated from the quantitative MRI data obtained during early hours of permanent ischaemia. Thus, the current estimators provide timing only from the tissue where residual perfusion is below the ischaemia threshold [2]. A previous study showed that reperfusion of ischaemic tissue, but not of that with compromised blood flow and normal ADC, leads to prolongation of tissue [12]. Against this, reperfusion of previously ischaemic tissue during MRI data acquisition would invalidate the established vs stroke onset time relationships [9,20] and potentially also the relaxation time distribution characteristics used by the current log-logistic-based estimator. In clinical settings reperfusion, either spontaneous or pharmacologically induced, is most likely to take place when the clot is small and/or the occlusions involves small vessels; instead, reperfusion of proximal branches of cerebral arteries is uncommon [22]. Thirdly, in the current data set the number of voxels in ADC lesions varied from 180 to 1,330. A human stroke lesion of 5 cm3 in volume would have voxels in a maps acquired at routine spatial resolution of 3 mm3, i.e. even small strokes would have enough data for generation of reference-independent estimators. Finally, a matter to be considered is that the ischaemic rat tissue is almost entirely gray matter and our time estimator apparently holds only for this tissue type.
Conclusions
The current study indicates that relaxometric MRI data may provide stroke time estimators without the need for non-ischaemic reference data. Critical issues in the clinical implementation of such protocols include both scan time and data post-processing. A recent study demonstrated a comprehensive stroke MRI protocol can be acquired in six minutes [24]. Investigational MRI scan procedures, such as magnetic resonance finger printing [18], have been shown to further shorten scan times, thus paving the way for expedited clinical brain examination. As far as the post-processing is concerned, the current standard computers are capable of analysing MRI data sets in seconds. Overall, quantitative MRI-based stroke timing taking minutes is likely to become reality for clinical exploitation in the near future.
Footnotes
Acknowledgements
The expert technical assistance by Ms Maarit Pulkkinen is greatly acknowledged. MP holds a Marie Curie Intra-European Fellowship for Career Development. BLM is a recipient of EPSRC PhD studentship. MJK is funded by Elizabeth Blackwell Institute Early Career Fellowship and by the Wellcome Trust international strategic support fund ISSF2: 105612/Z/14/Z. KTJ and OHJG are funded by Academy of Finland, Finnish Technology Funding (TEKES) and Biocenter Finland. RAK and MP are funded by the Dunhill Medical Trust.
References
1.
BurrI.W., Cumulative frequency functions, Ann Math Sci.13 (1942), 215–232.
2.
BuszaA.L.AllenK.L.KingM.D.van BruggenN.WilliamsS.R. and GadianD.G., Diffusion-weighted imaging studies of cerebral ischemia in gerbils. Potential relevance to energy failure, Stroke.23 (1992), 1602–1612. doi:10.1161/01.STR.23.11.1602.
3.
ChengB.BrinkmannM.ForkertN.D.TreszlA.EbingerM.KohrmannM.WuO.KangD.W.LiebeskindD.S.TourdiasT.SingerO.C.ChristensenS.LubyM.WarachS.FiehlerJ.FiebachJ.B.GerloffC.ThomallaG. and Stir, and V. I. Investigators, Quantitative measurements of relative fluid-attenuated inversion recovery (FLAIR) signal intensities in acute stroke for the prediction of time from symptom onset, J Cereb Blood Flow Metab.33 (2013), 76–84. doi:10.1038/jcbfm.2012.129.
4.
EmbersonJ.LeesK.R.LydenP.BlackwellL.AlbersG.BluhmkiE.BrottT.CohenG.DavisS.DonnanG.GrottaJ.HowardG.KasteM.KogaM.von KummerR.LansbergM.LindleyR.I.MurrayG.OlivotJ.M.ParsonsM.TilleyB.ToniD.ToyodaK.WahlgrenN.WardlawJ.WhiteleyW.del ZoppoG.J.BaigentC.SandercockP.HackeW. and G. Stroke Thrombolysis Trialists’ Collaborative, Effect of treatment delay, age, and stroke severity on the effects of intravenous thrombolysis with alteplase for acute ischaemic stroke: a meta-analysis of individual patient data from randomised trials, Lancet.384 (2014), 1929–1935. doi:10.1016/S0140-6736(14)60584-5.
5.
ForbesC.EvansM.HastingsN. and PeacockB., Statistical Distributions, 4th edn, John Wiley & Sons, 2011.
6.
HackeW.DonnanG.FieschiC.KasteM.von KummerR.BroderickJ.P.BrottT.FrankelM.GrottaJ.C.HaleyE.C.Jr.KwiatkowskiT.LevineS.R.LewandowskiC.LuM.LydenP.MarlerJ.R.PatelS.TilleyB.C.AlbersG.BluhmkiE.WilhelmM. and HamiltonS., Association of outcome with early stroke treatment: Pooled analysis of ATLANTIS, ECASS, and NINDS rt-PA stroke trials, Lancet.363 (2004), 768–774. doi:10.1016/S0140-6736(04)15692-4.
7.
Hoehn-BerlageM.NorrisD.G.KohnoK.MiesG.LeibfritzD. and HossmannK.A., Evolution of regional changes in apparent diffusion coefficient during focal ischemia of rat brain: The relationship of quantitative diffusion NMR imaging to reduction in cerebral blood flow and metabolic disturbances, J. Cereb. Blood Flow Metab.15 (1995), 1002–1011. doi:10.1038/jcbfm.1995.126.
8.
JinT.AutioJ.ObataT. and KimS.G., Spin-locking versus chemical exchange saturation transfer MRI for investigating chemical exchange process between water and labile metabolite protons, Magn Reson Med65 (2011), 1448–1460.
9.
JokivarsiK.T.HiltunenY.GrohnH.TuunanenP.I.GrohnO.H.J. and KauppinenR.A., Estimation of the onset time of cerebral ischemia using and MRI in rats, Stroke.41 (2010), 2335–2340. doi:10.1161/STROKEAHA.110.587394.
10.
KettunenM.I.GrohnO.H.SilvennoinenM.J.PenttonenM. and KauppinenR.A., Effects of intracellular pH, blood, and tissue oxygen tension on T1rho relaxation in rat brain, Magn Reson Med.48 (2002), 470–477. doi:10.1002/mrm.10233.
11.
KettunenM.I.GröhnO.H.J.LukkarinenJ.A.VainioP.SilvennoinenM.J. and KauppinenR.A., Interrelations of and diffusion of water in acute cerebral ischemia of the rat, Magn Reson Med.44 (2000), 833–839. doi:10.1002/1522-2594(200012)44:6<833::AID-MRM3>3.0.CO;2-F.
12.
KettunenM.I.GröhnO.H.J.SilvennoinenM.J.PenttonenM. and KauppinenR.A., Quantitative assessment of the balance between oxygen delivery and consumption in the rat brain after transient ischemia with -BOLD magnetic resonance imaging, J Ceber Blood Flow Metab22 (2002), 262–270.
13.
KnightM.J.McGarryB.L.RogersH.J.JokivarsiK.T.GrohnO.H. and KauppinenR.A., A spatiotemporal theory for MRI T2 relaxation time and apparent diffusion coefficient in the brain during acute ischaemia: Application and validation in a rat acute stroke model, J Cereb Blood Flow Metab.36 (2016), 1232–1243. doi:10.1177/0271678X15608394.
14.
KnightM.J.WoodB.CoulthardE. and KauppinenR.A., Anisotropy of spin echo T2 relaxation in the human brain in vivo, Biomed Spectr Imag.4 (2015), 299–310. doi:10.3233/BSI-150114.
15.
KnightR.A.DereskiM.O.HelpernJ.A.OrdidgeR.J. and ChoppM., Magnetic resonance imaging assessment of evolving focal cerebral ischemia. Comparison with histopathology in rats, Stroke.25 (1994), 1252–1261. doi:10.1161/01.STR.25.6.1252.
16.
LiF.HanS.S.TatlisumakT.LiuK.F.GarciaJ.H.SotakC.H. and FisherM., Reversal of acute apparent diffusion coefficient abnormalities and delayed neuronal death following transient focal cerebral ischemia in rats, Ann Neurol.46 (1999), 333–342. doi:10.1002/1531-8249(199909)46:3<333::AID-ANA9>3.0.CO;2-X.
17.
LongaE.Z.WeinsteinP.R.CarlsonS. and CumminsR., Reversible middle cerebral artery occlusion without craniectomy in rats, Stroke.20 (1989), 84–91. doi:10.1161/01.STR.20.1.84.
18.
MaD.GulaniV.SeiberlichN.LiuK.SunshineJ.L.DuerkJ.L. and GriswoldM.A., Magnetic resonance fingerprinting, Nature.495 (2013), 187–192. doi:10.1038/nature11971.
19.
McGarryB.L.RogersH.J.KnightM.J.JokivarsiK.GrohnH. and KauppinenR.A., Determining stroke onset time using quantitative MRI: High accuracy, sensitivity and specificity obtained from magnetic resonance relaxation times, Cerebrovasc Dis Extra.6 (2016), 60–65. doi:10.1159/000448814.
20.
McGarryB.L.RogersH.J.KnightM.J.JokivarsiK.T.SierraA.GrohnO.H. and KauppinenR.A., Stroke onset time estimation from multispectral quantitative magnetic resonance imaging in a rat model of focal permanent cerebral ischemia, Int J Stroke (2016), 677–682. doi:10.1177/1747493016641124.
21.
MeretojaA.KeshtkaranM.SaverJ.L.TatlisumakT.ParsonsM.W.KasteM.DavisS.M.DonnanG.A. and ChurilovL., Stroke thrombolysis: Save a minute, save a day, Stroke.45 (2014), 1053–1058. doi:10.1161/STROKEAHA.113.002910.
22.
MillerJ.B.MerckL.H.WiraC.R.MeurerW.J.SchrockJ.W.NomuraJ.T.SiketM.S.MadsenT.E.WrightD.W.PanagosP.D. and LewandowskiC., The advanced reperfusion era: Implications for emergency systems of ischemic stroke care. Ann Emerg Med (2016), in press. doi:10.1016/j.annemergmed.2016.06.042.
23.
MitsumoriF.WatanabeH.TakayaN.GarwoodM.AuerbachE.J.MichaeliS. and MangiaS., Toward understanding transverse relaxation in human brain through its field dependence, Magn Reson Med.68 (2012), 947–953. doi:10.1002/mrm.23301.
24.
NaelK.KhanR.ChoudharyG.MeshksarA.VillablancaP.TayJ.DrakeK.CoullB.M. and KidwellC.S., Six-minute magnetic resonance imaging protocol for evaluation of acute ischemic stroke: Pushing the boundaries, Stroke.45 (2014), 1985–1991. doi:10.1161/STROKEAHA.114.005305.
25.
RogersH.J.McGarryB.L.KnightM.J.JokivarsiK.T.GrohnO.H.J. and KauppinenR.A., Timing the ischaemic stroke by MRI: Improved accuracy using absolute relaxation times over signal intensities, NeuroReport.25 (2014), 1180–1185. doi:10.1097/WNR.0000000000000238.
SiemonsenS.MouridsenK.HolstB.RiesT.FinsterbuschJ.ThomallaG.OstergaardL. and FiehlerJ., Quantitative t2 values predict time from symptom onset in acute stroke patients, Stroke.40 (2009), 1612–1626. doi:10.1161/STROKEAHA.108.542548.
ThomallaG.ChengB.EbingerM.HaoQ.TourdiasT.WuO.KimJ.S.BreuerL.SingerO.C.WarachS.ChristensenS.TreszlA.ForkertN.D.GalinovicI.RosenkranzM.EngelhornT.KohrmannM.EndresM.KangD.W.DoussetV.SorensenA.G.LiebeskindD.S.FiebachJ.B.FiehlerJ. and GerloffC., DWI-FLAIR mismatch for the identification of patients with acute ischaemic stroke within 4.5 h of symptom onset (PRE-FLAIR): A multicentre observational study, Lancet Neurol.10 (2011), 978–986. doi:10.1016/S1474-4422(11)70192-2.