
Abstract
OBJECTIVE:
In this study, the profiling of the expression of major histocompatibility complex (MHC) class I-related chain A and B (MICA/B) in human breast cancer tumor tissue, saliva, and urine samples of breast cancer patients and control is carried out. MICA/B is ligand of NKG2D receptor expressed on malignant cells. The release of MICA/B from tumor tissue comprises an immune escape mechanism that impairs antitumor immunity. Based on this literature we explored the potential of soluble MICA (sMICA) as a marker in breast cancer (BC).
METHODS:
The expression was profiled by using immunohistochemistry (MICA/B), western blot (MICA/B) and ELISA (MICA).
RESULTS:
The optical density of western blot of MICA/B in different stages of BC illustrated significant difference as per one way analysis of variance and significant difference with stage III and IV by Dunnett’s multiple comparisons test respectively. Analysis of sMICA in serum, saliva and urine of BC patients revealed significantly higher levels (median 41.0 ± 4.1 pg/ml in pre-treatment sera, 181.9 ± 1.6 pg/ml in saliva and 90.7 ± 1.7 pg/ml in urine) than in control (median <1.2 pg/ml). The elevated levels of sMICA were related to the cancer stage.
CONCLUSIONS:
The elevated levels of sMICA were observed in patients with well differentiated cancer while the poor expression of sMICA was observed in patients with poorly differentiated tumors. Tumor immunity is impaired by the release of MICA in the biofluids and may be useful for detection and diagnosis of the stage of BC.
Keywords
Introduction
Breast cancer (BC) is the most common cancer worldwide, representing a quarter of predictable 1.67 million all cancer cases. India is facing a challenging situation for almost one-third of the global BC burden that has surpassed cervical cancer. The observed hike in mortality is due to deficient BC screening and late diagnosis [1–3]. Although treatable, BC remains almost incurable with an overall survival of approximately 3 to 5 years of only 25% [3–6]. MICA/B is a membrane anchored highly polymorphic, glycosylated, a non-classical molecule present on the short arm of chromosome 6 (6p21.33). It is a cell-stress-inducible glycoprotein that activates the expression of NKG2D immunoreceptor on NK cells, CD8+, 𝛼𝛽 and 𝛾𝛿 T cells. Normally it is expressed on the intestinal epithelial cells but upregulated under the stress and expressed in the various malignant tumors of epithelial origin [4,7]. MIC proteins act as ligands for NKG2D receptor, expressed by immune response of NK cells, CD8, T cells and 𝛾𝛿 cells to tumors. The interaction of NKG2D with MICA/B expressed on tumor epithelia elicit the cytolytic responses of NK and T cells [8–10]. The downregulation of NKG2D ligand expression comprises the tumor immune escape mechanism. This study has exhibited the MICA/B expression in tumor biopsies of BC patients with different stages of disease. The significant soluble MIC (sMIC) was detected in progressive cancers, indicating that breast tumors counteract MIC-NKG2D mediated immunity via MIC shedding. Importantly, sMIC significantly correlated with the tumor stages [11–13]. As a result of MICA shedding by tumor cells, soluble MICA (sMICA) is detected in serum, saliva and urine of the patients. There is no data available yet regarding the correlation of sMICA levels of saliva and urine of BC entities with tumor stages. In this comprehensive study, we demonstrated sMICA levels are significantly elevated in BC compared with healthy controls and correlate with cancer stage and metastasis. Here we analyzed sMICA levels in sera, saliva and urine of BC patients and compared them with healthy individuals. Furthermore, we correlated sMICA with tumor stage as well as with MICA/B expression to elucidate the potential diagnostic and prognostic benefit of a combination of markers.
Material and methods
Patients and sample specimens
The use of specimens from human subjects was approved by Institutional Ethical Committee. Provided informed consent of patients were obtained from each patient. Patients (n = 56) who underwent elective surgical resection of histologically proven BC tumor between 2015–2018 were included in the study. The record of clinicopathological data of tumor size, lymph node metastasis, distant metastasis, TNM staging, histological tumor type, grade, Modified Richardson bloom score, and hormone receptor status had been maintained. The tumor tissue and adjacent non tumor tissue from the same patients were incised and obtained following resection in the operation theatre, snap frozen in LN2 immediately and placed in −80 °C for further use of western blot analysis and ELISA. The original histopathological reports of each case were obtained to confirm the diagnosis. Simultaneously follow-up data of these patients have been recorded for 6 month prospectively from the hospital. Follow up was calculated from the date of resection of the tumor. Paraffin-embedded tissue blocks of the same patients were obtained from the Department of Pathology for immunohistochemical (IHC) analysis. The retrospective colon cancer tissue biopsies were used for comparative study. Pretreatment and post-treatment blood samples from same patients were obtained. Serum from 50 age matched healthy blood donors, free from systematically screened abnormalities was collected as controls. Unstimulated saliva and urine samples were collected from 50 BC patients diagnosed via biopsy and from BC-free control individuals. The inclusion criteria include untreated cancer patients are within age group of 31 to 73 years. The exclusion criteria included previous chemotherapy settings or radiotherapy. The inclusion criteria for control required that the subjects be within same age group. The exclusion criteria for control individuals included systemic conditions and pregnancy or lactation. The group of 50 BC and 50 control patients enrolled in this study were instructed to abstain from smoking and alcohol before the collection of saliva and urine. All the blood and urine samples were centrifuged at 12,000 rpm for 10 min and supernatant was isolated for further studies. It was stored at −80 °C.
Immunohistochemical staining analysis
Previously obtained formalin fixed Paraffin-embedded tissue blocks from Department of Pathology were sectioned (5 μm) on positively charged glass slides (Pathnsitu Biotechnologies, Hyderabad). Colon cancer tissue biopsies were used as a positive control for comparative analysis. Sections were deparaffinized with xylene, rehydrated through successive grades of alcohol. Sections were incubated with the mouse monoclonal IgG antibody (Santa Cruz Biotechnology, CA; USA) diluted at 1:100 (v/v) and goat anti-mouse IgG, HRP conjugated (Santa Cruz Biotechnology, CA; USA). Visualization of the MICA/B was achieved using 3,3-diaminobenzidine tetrahydrochloride (DAB Chromogen; BioGenex, Fremont CA; USA). Crispy coppery colored cytoplasm and membrane of tumor cells present in the tumor and mucosal tissues was considered as positive reaction for MICA/B. Sections were lightly counterstained with hematoxylin (HiMedia; India) and evaluated in a Nikon EclipsTi microscope (Japan). Two investigators graded expression of MICA/B in a blinded fashion. MICA/B expressions were graded as having weak (+), moderate (++) or intense (+++) MICA/B signal. Negative MICA/B expression was defined as no MICA/B signal (−).
Western blot analysis
Snap frozen breast tumor tissues weighing 10 mg were homogenized in LN2 with a mortar pastel and lysed with RIPA buffer (50 mM Tris-HCl at pH 8.0, 150 mM NaCl, 0.1% sodium dodecyl sulfate, 1% Nonidet P-40, and 0.5% deoxycholic acid) with an addition of protease inhibitor (Sigma Aldrich; India). Homogenates were then centrifuged in cooling centrifuge at 10,000 RPM for 10 min. Bradford Coomassie assay (Bio-Rad, CA, USA) was used to find out the protein concentration. 30 μg total protein of each sample were separated by Bolt TM 10% Bis-Tris plus precast gels (Invitrogen, India) and transferred to mini tank at 120 V for 1 h. Gel was allowed to dry blot on 0.45 μm nitrocellulose membranes (Thermo scientific, India) for 7 min. The membranes were blocked by PBST (10 mmol/L Tris–HCl, pH 7.4, 150 mmol/L NaCl, 0.05% Tween-20) containing 5% nonfat dry milk for 2 h. Nitrocellulose membranes were incubated with mouse monoclonal anti-MIC A/B (Santa Cruz, CA; US) with 1:2000 dilution in iBind TM flex solution (500 ul flex additive and 10 ml flex 5X buffer in 39.5 ml D/W; Invitrogen India) and HRP conjugated Goat anti-mouse (Santa Cruz, CA; US) with 1:7000 dilution in flex solution overnight. The membranes were developed with the ECL substrate reagent (Invitrogen India). The proteins were detected using the enhanced chemiluminescence reaction and quantified using Image J software. The optical density was measured and expressed in arbitrary units.
Enzyme-linked immunosorbent assay
Serum levels of sMICA from BC patients were determined by sandwich enzyme-linked immunosorbent assay (ELISA) by using Duoset kit (R&D systems, MN; USA) as per manufacturer’s protocol. The ELISA plates were incubated overnight with the Human MICA capture antibody (5.6 ul/ml) in ELISA plate coating buffer at room temperature, and then blocked by 1X reagent diluents. It is followed by incubation with patient sera. Next, plates were washed/aspirated and incubated with Human MICA detection antibody diluted in reagent diluents with 2% goat serum, washed again and then incubated with streptavidin HRP A (5 ul in 1 ml reagent diluents). Finally, plates were washed and developed using the Substrate A and B. Finally incubated with stop solution for 10 min. Absorbance was measured at 450 nm by using LISA Microplate Reader (China) according to the manufacturer’s instructions. In order to validate the sMICA levels in saliva and urine of BC patients (n = 50) and control (n = 50), saliva and urine samples were centrifuged and the supernatant was used for incubation. The sMICA concentrations in saliva and urine samples were determined with LISAplus Microplate Reader according to the manufacturer’s instructions. The sMICA levels ≥1 pg/ml were considered positive according to the detection limit of the ELISA.
Statistical analysis
The data are expressed as the mean ± standard deviation (SD). Statistical significance was determined using the Student’s t-test. A p-value of < 0.05 was considered to indicate statistical significance in all the statistical evaluations. In the figures, statistical significance is denoted as ∗ for p-value ≤ 0.05, ∗∗ for p-value ≤ 0.001, ∗∗∗ for p-value ≤ 0.0001.
MICA/B Expression in different stages of breast cancer.
MICA/B tissue expression
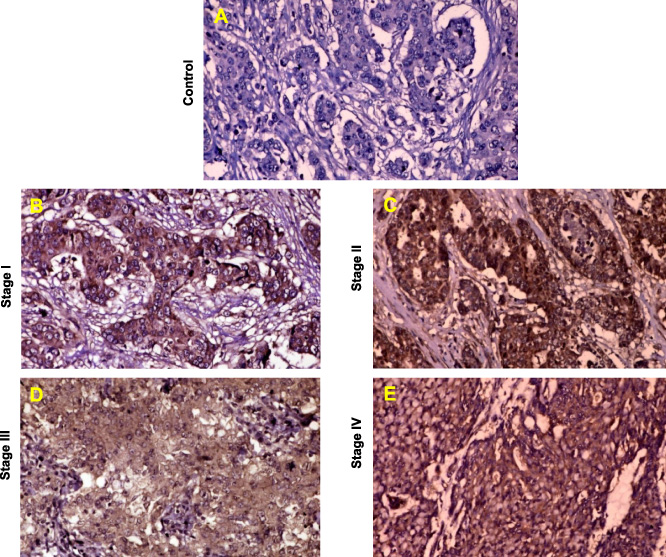
IHC expression with mouse monoclonal IgG antibody within the BC tumors revealed strong dark shiny brown signal of MICA/B expression. The non-tumor tissue taken as a control do not show any signal for MICA/B expression (Fig. 1A). Paraffin embedded blocks of BC tissue samples from 56 patients with infiltrating duct carcinoma, invasive carcinoma, invasive solid papillary carcinoma, invasive pleomorphic lobular carcinoma, high grade duct carcinoma within age range 31–73 years were analyzed for MICA/B expression by IHC staining. All tumors evaluated showed MICA/B expression, with the majority of tumor cells staining positively in all the cases. Despite the MICA/B expression in each subtype, the intensity of staining varying between tumors was noted. Therefore data was categorized into two groups for the analysis purpose. Intense to moderate MICA/B expression was present in 24 (42.8%) and moderate expressions were present in 32 (57.1%) of 56 BC patients. All cells within obtained tumor samples displayed intense to moderate intensity of MICA/B staining. The poorly differentiated tumor specimens showed intense to moderate staining for MICA/B (Figs 1B, 1C) and well differentiated tumor specimens showed moderate staining (Figs 1D, 1E). MICA/B expression in the tumor was significantly increased in patients with poorly differentiated, low invasive with no lymphatic involvement tumors at early TNM stages (I and II) as compared to well differentiated, deeper invasion status at advanced TNM stages (III and IV). Highly considerable relationships were established between TNM stages, tumor histological grade and tumor differentiation. In contrast, no significant correlations were found between tissue expressions of MICA/B and tumor size, patient age and survival rate.
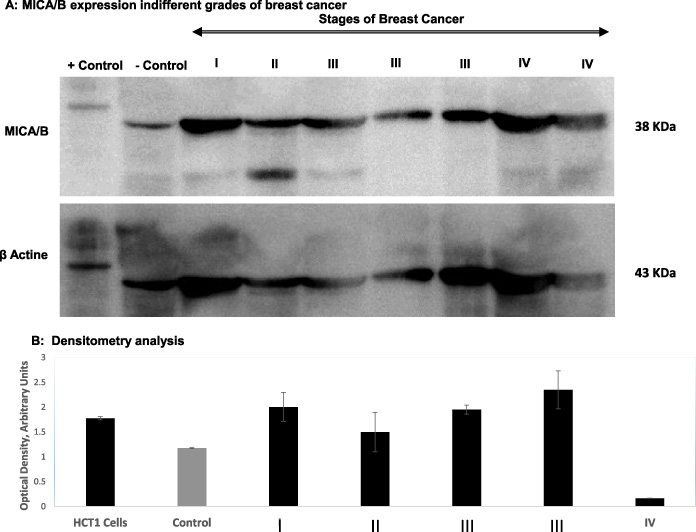
A: MICA/B expression indifferent grades of breast cancer. B: Densitometry analysis.
Western blot analysis was carried out on RIPA extracted homogenized BC tissue to quantify tissue levels of MICA/B in non tumor (breast tissue adjacent to tumor obtained from cancer patients but containing no tumor) and tumor breast tissue. The MICA/B antibody showed bands with strong immunoreactivity. Optical density (OD) was evaluated for the band at ∼38 kDA. A representative blotting image is shown in Fig. 2A. Visual observation revealed that MICA/B expression in the 38-kDa band was lower in non-tumor breast tissue compared to tumor tissue. MICA/B protein levels were considerably higher in stage I, II and IV breast tumor tissue as compared to non-tumor tissue (p < 0.001 for both). Stage I and II and IV tumors had higher MICA/B expression than stage III. The 38-kDa band of a stained gel was subjected to β-actin housekeeping gene analysis to verify MICA/B specificity. Protein fragments in the gel-band were matched to the MICA/B protein sequence of 38-kDa band. The MICA/B expression in various stages of BC showed significant difference as per one way analysis of variance (∗∗∗∗P value < 0.0001). Dunnett’s multiple comparisons test show significant difference in MICA/B expression of positive control with stage III and IV with ∗∗P value 0.0094 and ∗∗∗∗P value < 0.0001 respectively. There is no significant difference in MICA/B expression of positive control and stage I, II, III (Fig. 2B).
ELISA
Pretreatment serum sMICA of breast cancer patients
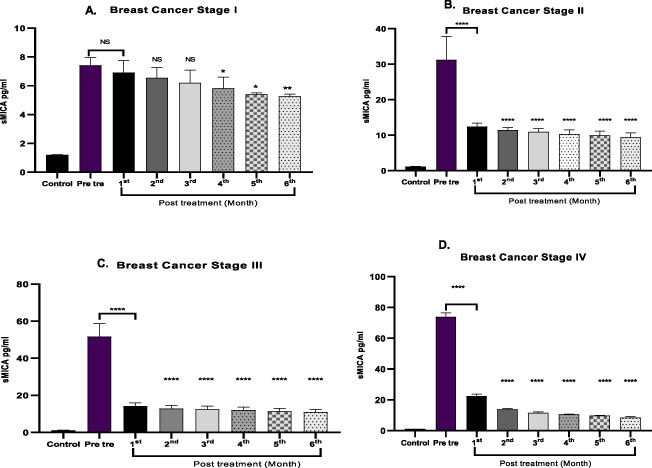
Elevated serum levels of sMIC have been reported in certain gastrointestinal, pancreatic and colorectal malignancies [14]. We analyzed the sMICA levels in serum of same 56 BC patients enrolled for study. In parallel, we analyzed control sera from 50 healthy age matched individuals free from systematically screened abnormalities for comparative study. Age matched control sera revealed significant lower sMICA values close to the detection limit of the ELISA reader. Significant high levels of sMICA were detected in the patient sera in both pre and post treatment as compared to the sera of control (Table 1). The sMICA levels in serum correlated with the disease stage and TNM staging. There was an association between serum sMICA levels and tumor size, grade or lymph node involvement. It is not associated with Modified Richardson bloom score. Furthermore, pretreatments MICA levels were more elevated in patients with well differentiated tumors than poorly differentiated tumors. The sMICA in pretreatment illustrated significant difference as per one way analysis of variance in all stages (∗∗∗∗P value < 0.0001) (Fig. 3). The sMICA levels in patients correlated with the stages of disease. The resulting stage wise serum sMICA values demonstrate the diagnostic potential in this subgroup. Though significantly higher serum sMICA levels were detected in pretreatment; sMICA levels did not differ significantly between every month F/W. The difference range of sMICA levels in the F/W was very less.
Pre-treatment and post treatment levels of sMICA in sera of patients with breast cancer and control
Pre-treatment and post treatment levels of sMICA in sera of patients with breast cancer and control
(Data presented as Mean ± SD; P value < 0.0001; The sMICA in pretreatment illustrated significant difference as per one way analysis of variance in all stages. (∗∗∗∗P value < 0.0001). As per Tukey’s multiple comparisons test, sera concentration of sMICA show all stages are significantly different corresponding to each other with ∗∗∗∗P value < 0.0001 in all stages).
Pre treatment and post treatment levels of sMICA (pg/ml) in sera of patients with breast cancer stages and control.
Total 50 BC patients and 50 age matched BC-free control subjects were recruited to study sMICA/B in saliva and urine. The age range of BC patients and control was 31–70 with an average age of 50 years. To identify sMIC in saliva and urine, comparison of the sMICA/B profiles between BC-free unrelated healthy control subjects and BC patients was performed using ELISA analysis. The control saliva and urine contained lower levels of sMICA close to the detection limit of the ELISA reader. The results revealed that the average levels of sMICA in BC patients were higher than in control. The mean sMICA/B concentration was ≤2 pg/ml for saliva samples and ≤1 pg/ml for urine samples in the BC-free group. The mean sMICA/B concentration of saliva and urine in stage I, II, III and IV is summarized in Table 2.
sMICA concentration in saliva and urine
sMICA concentration in saliva and urine
(Data presented as Mean ± SD; P value < 0.0001).
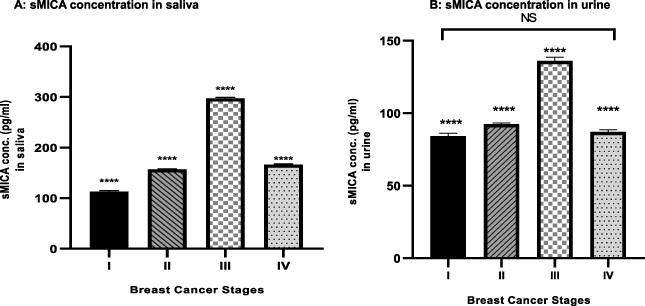
The MICA level of is successively increased from stage I to stage III, and again decreased in the stage IV. The results are summarized in Table 2 and indicate that the sMICA level varies in BC patients and controls, with no correlation with the tumor size or grade or survival rate. The sMICA concentration in saliva sample of BC at different stages showed significant difference as per one way analysis of variance (∗∗∗∗P value < 0.0001). As per Tukey’s multiple comparisons test sMICA concentration in saliva show all stages are significantly different corresponding to each other with ∗∗∗∗P value < 0.0001 (Fig. 4A). The sMICA concentration in urine sample of breast cancer at different stages shows significant difference as per one way analysis of variance (∗∗∗∗P value < 0.0001). As per Tukey’s multiple comparisons test sMICA concentration in urine show all stages are significantly different corresponding to each other with ∗∗∗∗P value < 0.0001 except stage I and IV as they are non-significant (Fig. 4B).
It has been reported that, the NKG2D ligands- MICA/B are broadly expressed on various tumor cell surface. MICA/B is upregulated in response to physical stress; this may make them more prone to immune attack by NKG2D present on CD8, NK and T cells, resulting in cell apoptosis. During the tumor progression mechanism, one of the strategies is to evade immune surveillance by cytolytic cells. The strategy is to NKG2D ligands shedding from the tumor cells results in the release of sMICA in body fluids, which impairs NKG2D-dependent cell activation [15–17]. In addition, the expression of low levels of NKG2D ligands on the tumor cell surface results in intracellular deposits of immature forms NKG2D ligands which also prevents NK cell-mediated lysis and favors tumor development [18,19]. This reduced expression of MICA/B on the tumor surface by proteolytic shedding constitutes a novel tumor immune escape mechanism [20,21].
In the present study, we conducted IHC, WB and ELISA to determine the MICA/B expressions. We focused on correlation of MICA/B expression in tumor tissue, serum, saliva and urine. The IHC analysis revealed intense to moderate MICA/B expression in 24 (42.8%) and moderate expressions in 32 (57.1%) of 56 BC patients. Different studies on MICA/B in tumors express conflicting results to some extent. Colorectal cancer studies showed increased survival and prognosis in correlation with increased MICA/B expression in tumor [22] and opposing results in pancreatic cancers [6,16].
Consequently elevated levels of sMICA were found in patient’s serum with different malignancies. A correlation between sMICA in serum and disease progression was studied in prostate cancer. Prevalent expression of the immunostimulatory MHC class I chain–related molecule is counteracted by shedding in prostate cancer [23,24].
The levels of sMICA (pg/ml) in saliva and urine breast cancer of patients.
So far, no systematic evaluation has been carried out on the diagnostic approach of sMICA levels in malignancies and their correlation with stage and survival rate. Here, this study analyzed sMICA levels in sera, saliva and urine of BC patients and compared with different tumor stages to evaluate sMICA as a diagnostic marker in BC stages. Serum analysis of revealed that control had significantly lower sMICA values than BC patients. While analyzing the tumor entities and serum for sMICA, early stages of BC display markedly increased expressions of MICA/B at tissue level and diminished sMICA levels in sera. Well differentiated stages display moderate expressions at tissue level and elevated sMICA. It reveals a clear correlation of MICA/B expressions and sMICA levels with tumor stage. This might reflect relationship in different tumor stages with regard to expression and shedding of MICA. The sMICA levels were particularly elevated in well differentiated stages but showed no correlation with tumor size, Modified Richardson bloom score, grade or lymph node involvement. Furthermore, pretreatments MICA levels were more elevated in patients with well differentiated tumors than poorly differentiated tumors. Thus, the presence of sMICA in sera appears rather to be an indicator for systemic manifestation of carcinoma than for local tumor differentiation. Elevated sMICA levels in well differentiated tumors may reveal consequence of enhanced MICA/B shedding, which might have damaged the immunosurveillance by cytotoxic lymphocytes. Though higher sMICA levels were detected in pretreatment; difference range of sMICA levels in the follow up was very less. It indicates that after treatment, sMICA level in sera decreased significantly but monthly monitoring did not show remarkable variability in sMICA levels in sera of BC patients.
Furthermore, we compared the sMICA profile of saliva and urine from BC with control group. The study outcome indicated that sMICA level in sera is successively increased from stage I to IV. In saliva ad urine samples, it is successively increased from stage I to III, and decreased in the stage IV (Figs 4A, 4B). Poorly differentiated tumor revealed intense expressions as compared to well differentiated tumor. The protein separated on gel electrophoresis and analysed by Western blot also confirmed MICA/B expressions are higher in poorly differentiated tumor. Thus, in poorly differentiated tumor, the MICA/B expression may be restricted to tissue surface. By proteolytic shedding, tumor cells release the NKG2D ligands in soluble form in biofluids-serum, saliva and urine by metalloproteases. Elevated sMIC levels in sera, saliva and urine can be correlated with tumor grade and presence of metastasis. As tumor aggravates, NKG2D ligands shed from tumor surface, so well differentiated tumor surface may render moderate to less MICA/B expressions.
We observed that sMICA was a more reliable prognostic indicator compared with MICA/B cell surface expression, as it is easier to detect. Importantly, considering the feasibility of urine and saliva for the quantitation MICA far easy compared to detecting MICA/B expression in cancer cell surface. Moreover, MICA/B detection by IHC for all patients with cancer are not suitable. Therefore, sMICA in serum or saliva or urine is more appropriate in such situations. Overall, sMICA in saliva and urine will be a potential candidate as a diagnostic marker for BC, allowing for the development of diagnostic assays.
This study provides comprehensive information concerning the values of sMICA/B in sera, saliva and urine analysis. We demonstrated that sMICA/B levels are significantly higher in sera of patients with well differentiated malignancies than in patients with poorly differentiated tumors, with significant high levels than control. MICA/B expressions linked to clinicopathological data with long term follow up would be useful tool for determining new prognostic indicators in BC that can be used in future patient management. Tissue specific MICA/B expressions and soluble MICA/B would be an independent marker with good prognosis in BC. Further studies to illuminate the correlation of value of sMICA in sera, saliva and urine for monitoring response to therapy, its prognostic relevance and its link with long term the survival rate in breast cancer should be elucidated.