
Abstract
Background:
There is now increasing evidence that type 2 diabetes mellitus (T2DM) is associated with Alzheimer’s disease (AD). However, it is unclear whether the two are causally related.
Objective:
To reveal the causal association between T2DM and AD, we performed a bidirectional Mendelian randomization (MR) analysis.
Methods:
Genetic instrumental variables were systematically screened, and inverse-variance weighting, MR—Egger regression, weighted median, simple mode, and weighted mode were applied to assess the pathogenic associations between the two diseases, and sensitivity analyses were used to further validate the robustness of the results.
Results:
The results of forward MR analysis with T2DM as the exposure were [OR = 0.998, 95% CI (0.975∼1.021), p = 0.857], and the results of reverse MR analysis with AD as the exposure were [OR = 0.966, 95% CI (0.934∼0.999), p = 0.043]. The results showed no significant association between T2DM and AD at the gene level (p < 0.025). Sensitivity analyses were consistent with the results of the main analysis, confirming the robustness of the study.
Conclusions:
T2DM and AD may not be genetically causally associated.
INTRODUCTION
With the aging of the world’s population and the improvement of living standards, the incidence of geriatric and metabolic diseases is increasing year by year. Type 2 diabetes mellitus (T2DM) and Alzheimer’s disease (AD) are common chronic progressive diseases associated with old age [1]. The traditional view is that AD and T2DM are independent diseases, but in recent years, some scholars believe that the two diseases are affected by a variety of common risk factors and mechanisms, such as obesity, dyslipidemia, insulin resistance (IR), inflammatory response, oxidative stress, mitochondrial dysfunction, vascular injury, and glycogen synthase kinase 3β (GSK-3β) signaling mechanism; therefore, AD and T2DM may be correlated [2–4]. AD is a neurodegenerative disease characterized by progressive cognitive dysfunction and learning and memory loss, which usually manifests as progressive loss of memory and cognitive function [5]. T2DM is a chronic metabolic disease characterized by hyperglycemia due to insufficient insulin secretion or IR, which can lead to a wide range of structural and functional alterations of tissues and organs [6], mainly in terms of a responsive decrease in the number of insulin receptors and attenuation of downstream signaling [7]. Insulin plays an important role as a neurotrophic factor in the regulation of blood glucose and energy metabolism [8]. High concentrations of glucose may cause damage to nerve cells by affecting the supply of neurotrophic nutrients, ion channel effects, etc. It has been shown that patients with AD develop IR in the brain [9] and that the prevalence of AD in diabetes patients over 60 years of age is 10% [10]. Researchers first proposed in 2002 that T2DM causes AD by impairment of insulin signaling pathways in brain tissue [11], while the new idea that AD is type 3 diabetes was first proposed in 2005 [12]. Epidemiologic investigations have shown [13] that 80% of AD patients have diabetes or impairment in glucose tolerance, and that T2DM increases the probability of AD by 1.5 to 2.5 times [14], with a higher probability of later complications of cognitive dysfunction than in nondiabetic patients followed by progression to AD. Although there is substantial evidence of an epidemiologic association between diabetes and AD, and the pathological and physiological mechanisms of their disease onset are similar, not all studies have shown a definitive causal association between the two diseases, and pathologic studies such as those with autopsies have not found an association between diabetes and AD [15]. In addition, most of the current studies on those two diseases are cross-sectional cohort studies, in which the causal association cannot be fully determined because of the observational nature of those studies.
Mendelian randomization (MR) is widely used in the field of genetic epidemiology as a method of etiologic inference [16]. In recent years, with the deeper utilization of MR research methods, it has been gradually applied to infer the pathogenic association between two complex diseases as a more ideal method for gene-level research [17]. Some studies have shown that T2DM is associated with the development of AD; however, there is uncertainty regarding the causal association between the two [18]. Therefore, in this study, we analyzed whether there is a causal association between T2DM and AD using the MR method to provide genetic support for the association between T2DM and the risk of developing AD and provided theoretical and experimental bases for the modernization of AD and T2DM research.
METHODS
Research design
In this study, a two-sample bidirectional MR study method was used, with forward MR using T2DM as the exposure factor and AD as the study outcome, and reverse MR using AD as the exposure factor and T2DM as the study outcome. Single nucleotide polymorphisms (SNPs) with significant correlations with exposure factors were used as instrumental variables (IVs) and used the TwoSample MR package in the R language to perform causal association analyses, as well as the Cochran Q dissimilarity test, test of multiplicity, and sensitivity analyses to validate the reliability of the results.
The research methodology follows three principle assumptions [19]: 1) the IV was significantly associated with exposure factors; 2) the IV was not associated with any potential confounders; and 3) the IV was not significantly associated with outcome factors (Fig. 1).
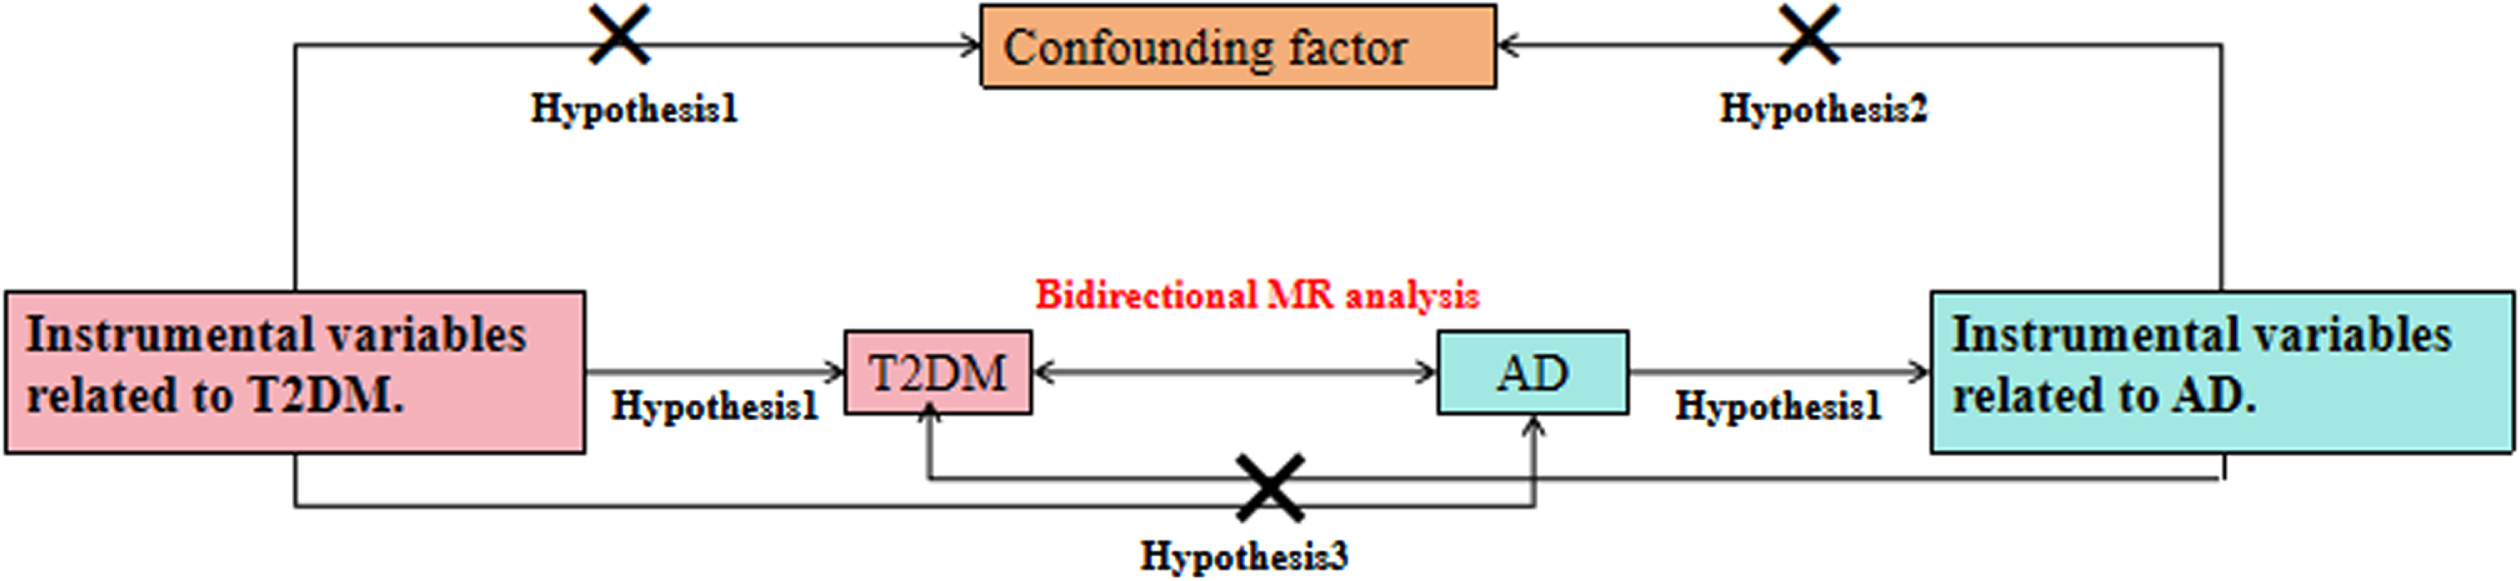
Schematic diagram of a two-sample MR analysis.
Data sources
Pooled data related to T2DM were obtained from Mahajan et al. (2022) [20], which included 180,834 individuals in the case group and 1,159,055 individuals in the control group, and the study covered a total of 19,829,461 SNPs. The data related to AD included in this study were obtained from the article published by Bellenguez et al. (2022) [21]. This dataset had a total of 85,934 individuals in the case group and 401,577 individuals in the control group, which contained 21,101,114 SNPs. AD diagnosis was established by a multidisciplinary working group-including neurologists, neuropsychologists, and social workers-according to the DSM-IV criteria for dementia and the National Institute on Aging and Alzheimer’s Association’s (NIA-AA) 2011 guidelines for diagnosing AD. The above data were from European populations, and the sexes were male and female.
Instrumental variables
After obtaining data from the website using R software, to avoid analytical bias due to strong linkage disequilibrium (LD) between SNPs, the screening criteria were as follows [22]: 1) p < 5×10⁻⁸; 2) physical distance M > 10 000 kb between every two genes; and 3) r2 threshold of LD between genes < 0.001, F value >10, and ultimately obtain SNPs that are independent of each other and significantly correlated with exposure factors, which were used as final IVs.
MR analysis
Statistical software R package (R 4.3.1) was used in this study with a test level of α=0.05. The main ones are inverse-variance weighting (IVW), MR—Egger regression, weighted median (WME), simple mode (SM), and weighted mode (WM) in the TwoSampleMR package. IVW is the most commonly used test for calculating the weighted average of all IV effect values, and MR analyses were performed with the IVW method as a reliable result. MR—Egger, which is capable of both MR analysis and application to multiple validity evaluation, was fitted using the inverse of the variance of the endings as weights. WME has the advantage of being able to analyze MR and obtain valid results if at least half of the valid IVs are analyzed. SM and WM are estimated based on multinomial models that cluster SNPs with similar causal effects and return causal effect estimates for most clustered SNPs. WM weights the effect of each SNP on clustering by the inverse variance of its outcome effect [23].
Sensitivity analysis
The heterogeneity test was used to test the differences between individual IVs, and p > 0.05 indicated the absence of heterogeneity. Heterogeneity was assessed using the p value of Cochran’s Q-test, and p < 0.05 indicated the presence of heterogeneity; in contrast, p > 0.05 indicated no heterogeneity. The pleiotropy test is used to verify the reliability of the MR analysis results. The commonly used MR—Egger method of the intercept term indicated that the intercept term p > 0.05 indicates that there is no level of pleiotropy; if there is the presence of pleiotropy, it indicates that the results of the MR analysis are unreliable. The “leave-one-out” method was adopted to test the sensitivity, which is based on the principle of gradually eliminating the results of a single SNP to determine whether it is an outlier or not and to be able to observe the stability of the results of the elimination of individual SNPs [24].
RESULTS
SNP information for instrumental variables
In this study, T2DM and AD were used as exposure factors respectively, SNP loci with genome-wide significance were screened according to the screening criteria using R software.149, 56 SNPs were obtained as IVs, respectively (Supplementary Material).
Forward MR analysis
MR analysis results
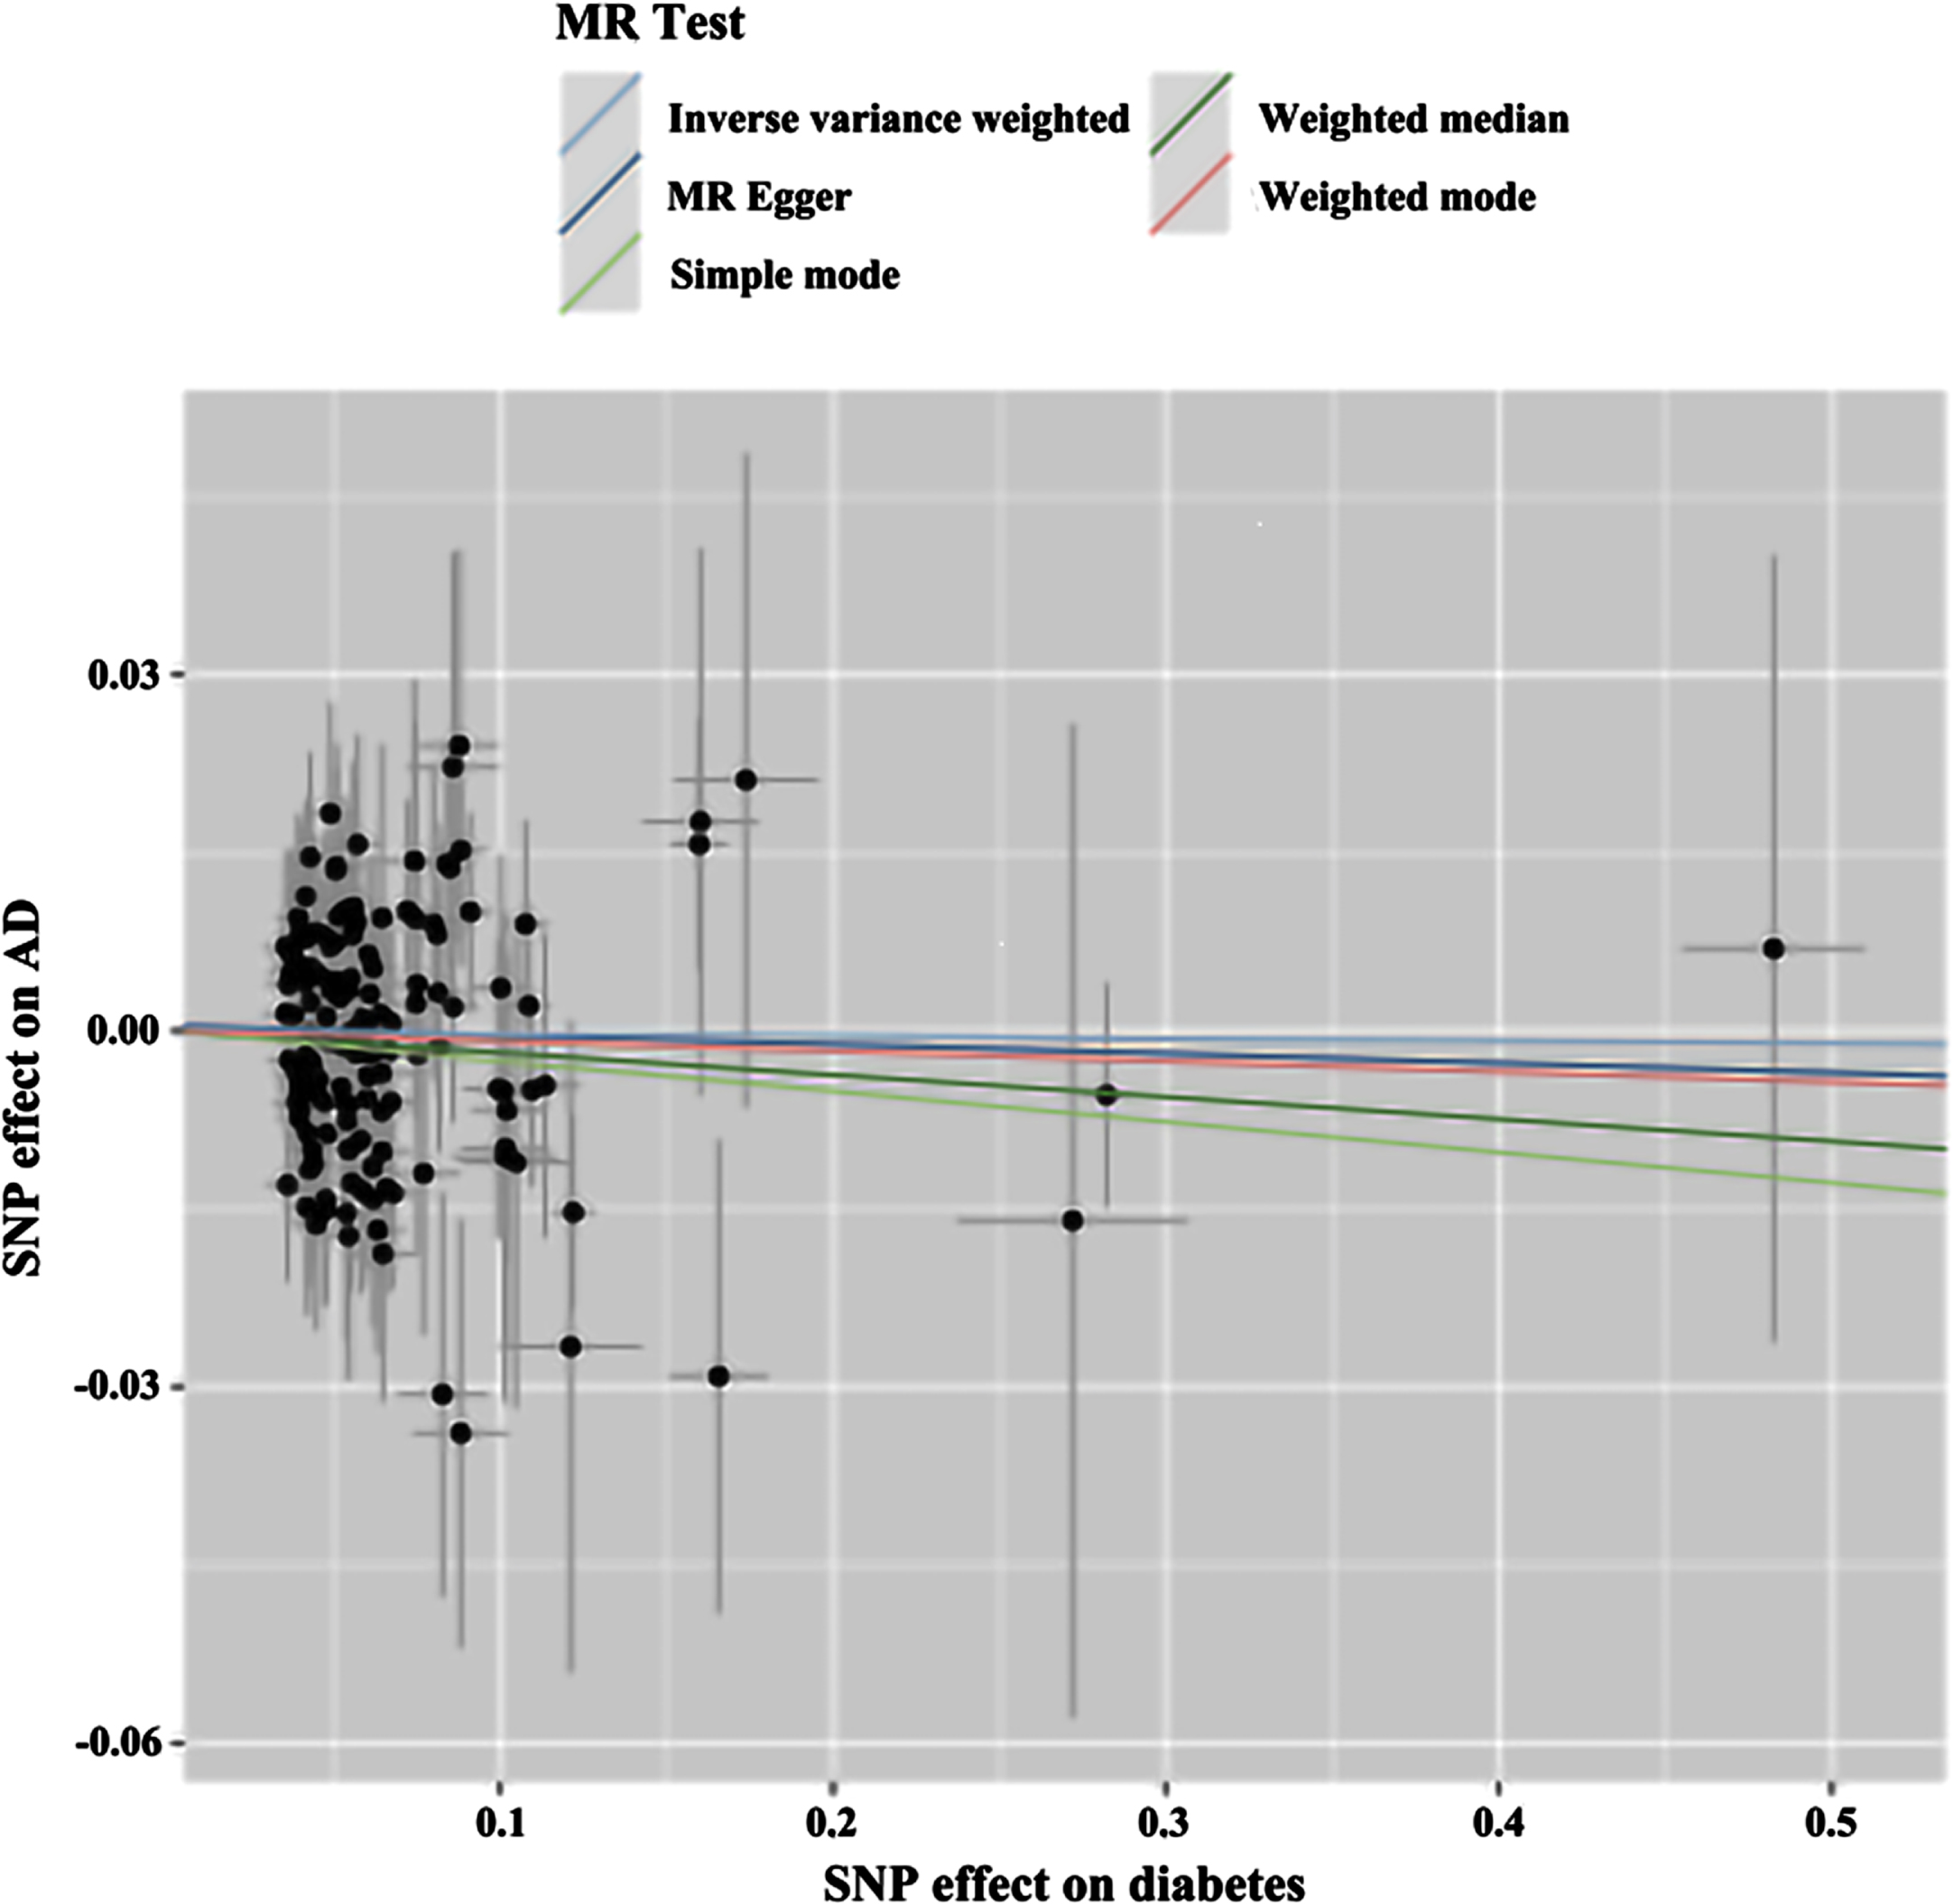
The MR of T2DM with AD was analyzed by MR—Egger, WME, IVW, SM, and WM in the TwoSampleMR package, and the results are shown in Table 1, showing ORs and 95% CIs of 0.992 (0.943–1.044), 0.981 (0.940–1.024), 0.998 (0.975–1.021), 0.975 (0.882∼1.077), and 0.991 (0.939∼1.047), respectively. From the results, it can be seen that the p values of the five tests of MR—Egger, WME, IVW, SM, and WM were 0.761, 0.394, 0.857, 0.615, and 0.756, respectively, the results were greater than 0.025, and thus the differences were not statistically significant; therefore, through the perspective of the MR analysis, it can be concluded that there is no causality between T2DM and AD. The results are visualized in Fig. 2.
Forward MR results of T2DM on AD
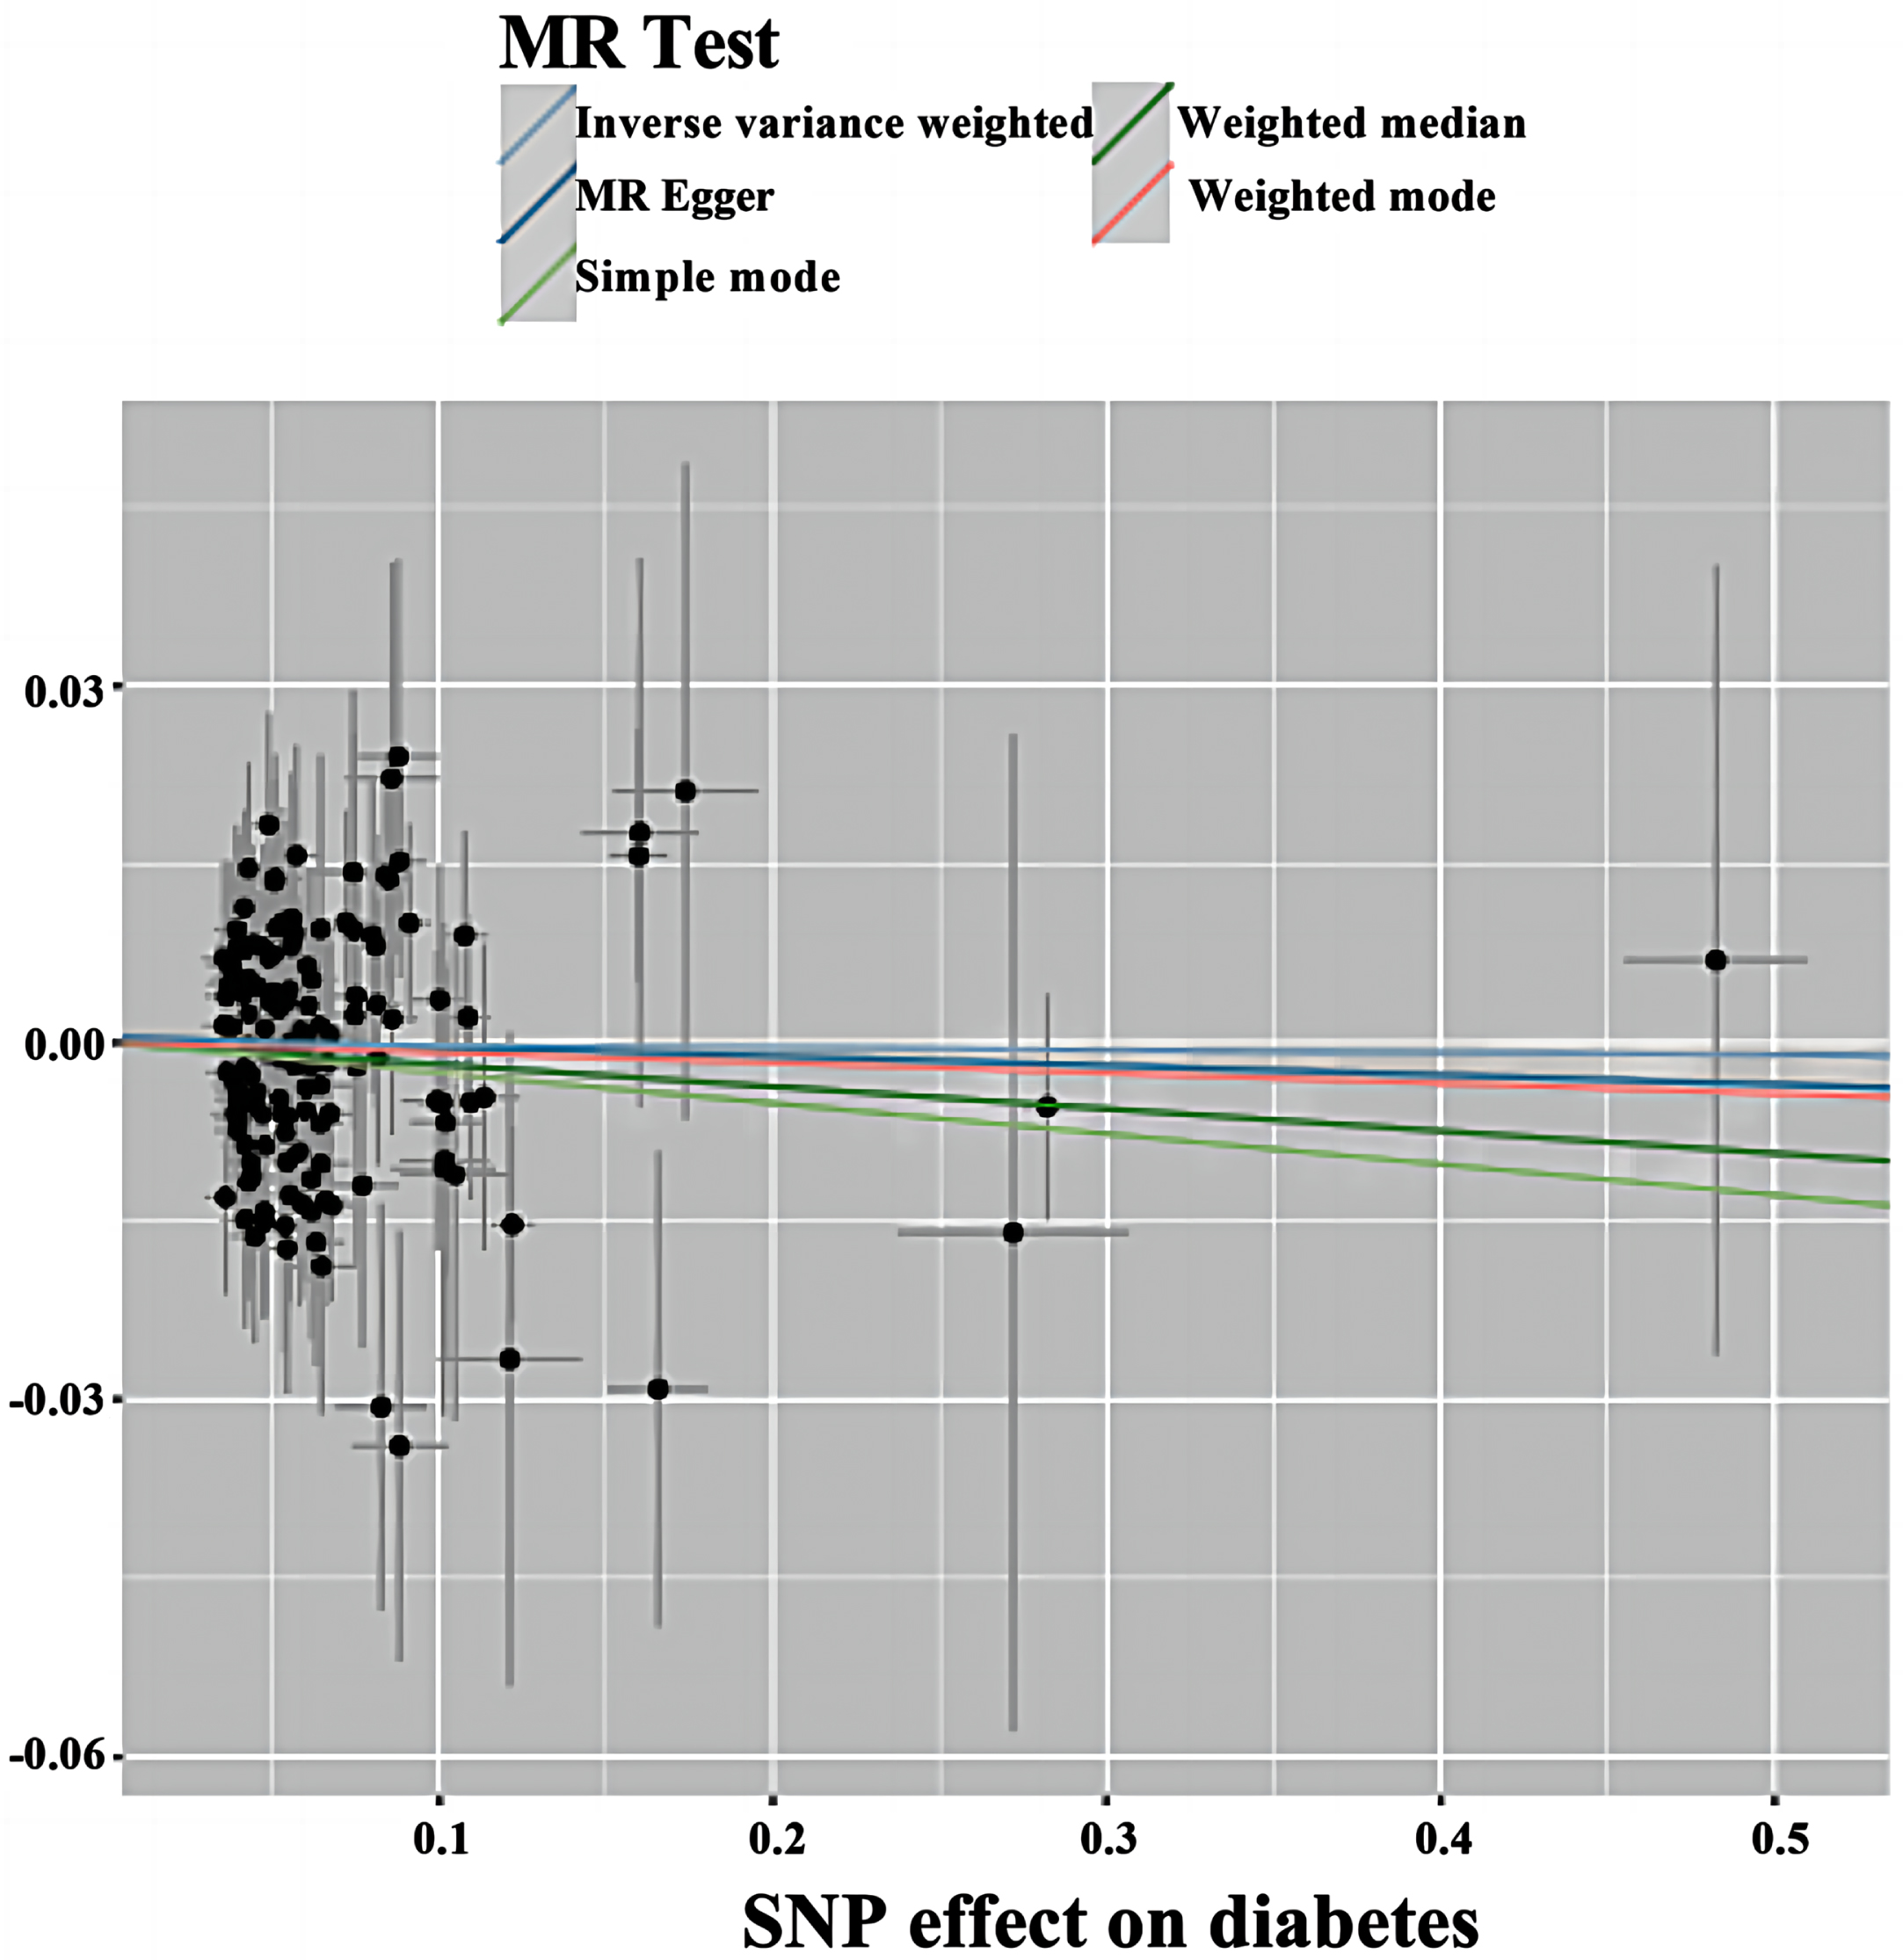
Scatterplot of forward MR. Scatter plot of genetic correlations of T2DM on AD using different MR methods. The slopes of line represent the causal effect of each method, respectively. MR Test, Mendelian Randomization Test; MR Egger, Mendelian Randomization Egger; SNP, single nucleotide polymorphism.
Sensitivity analysis results
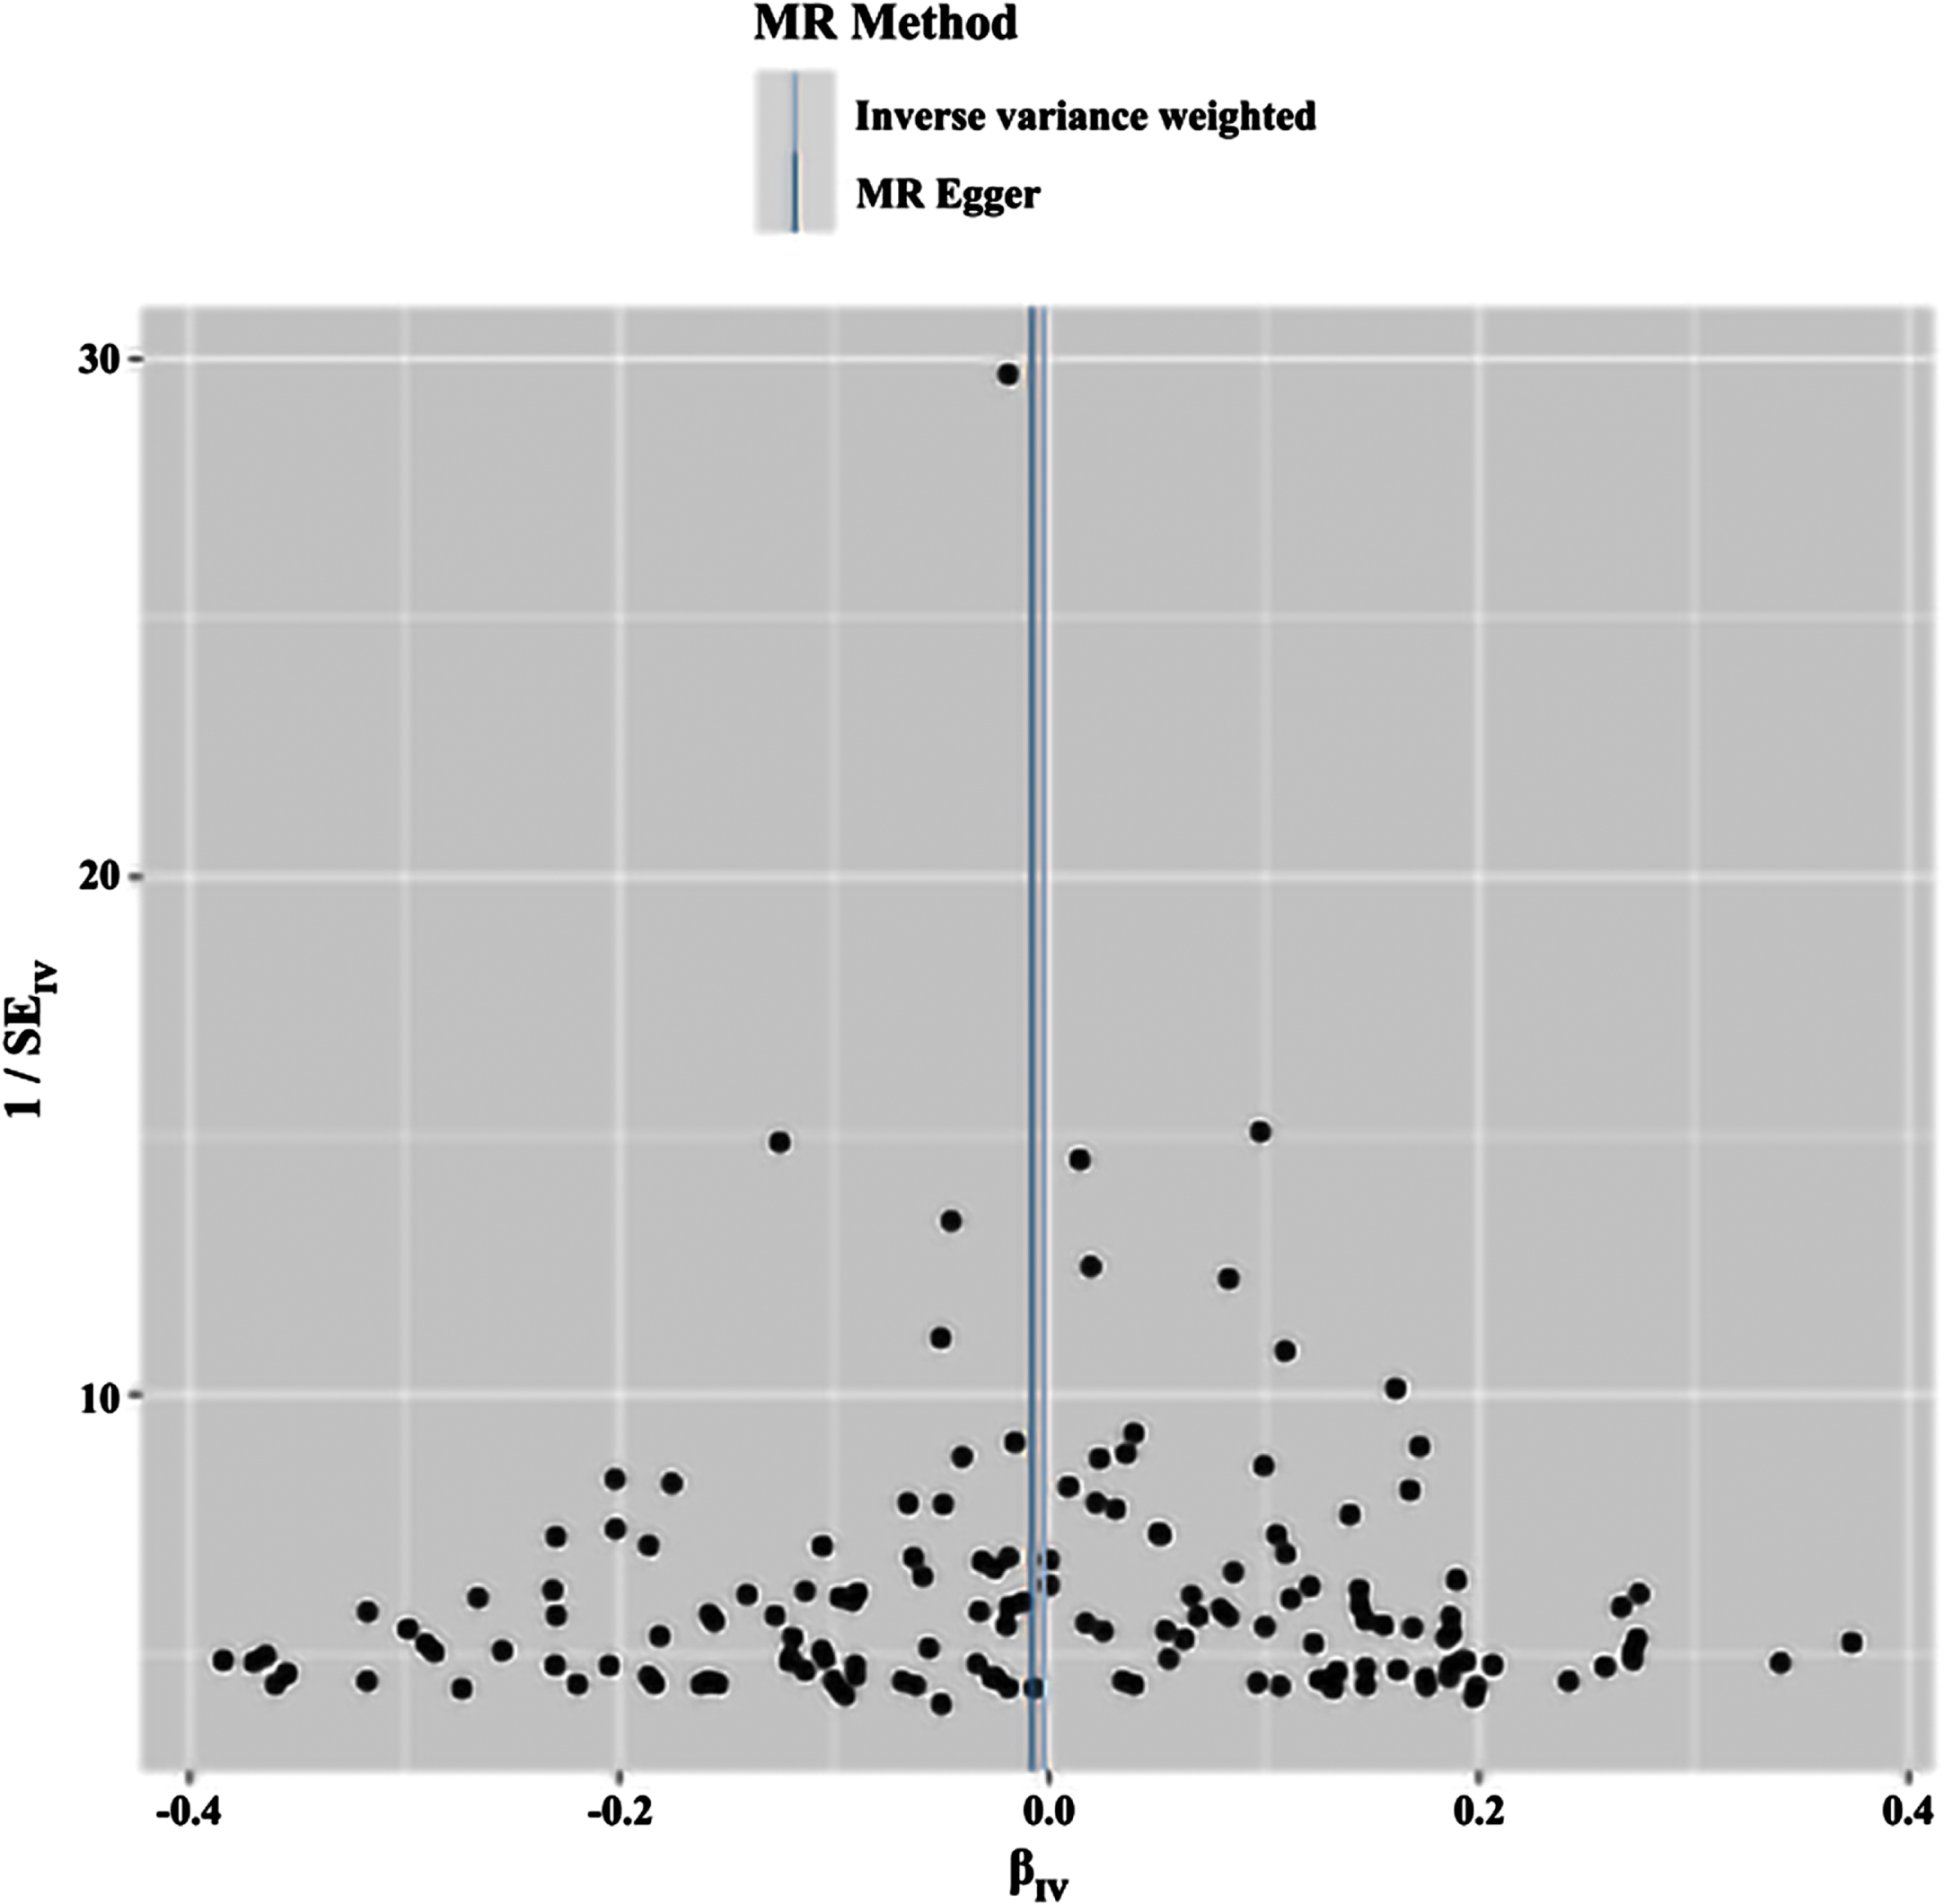
In this study, the screening criteria for IVs were strictly followed, and the population of the same species was included, so the possibility of false-negative results was unlikely. The results were tested for heterogeneity, and the Q-values and Qp-values of IVW and MR—Egger were 126.595 (0.887) and 126.657 (0.897), respectively, which were greater than 0.05, indicating that there was no heterogeneity. The results are visualized in Fig. 3.
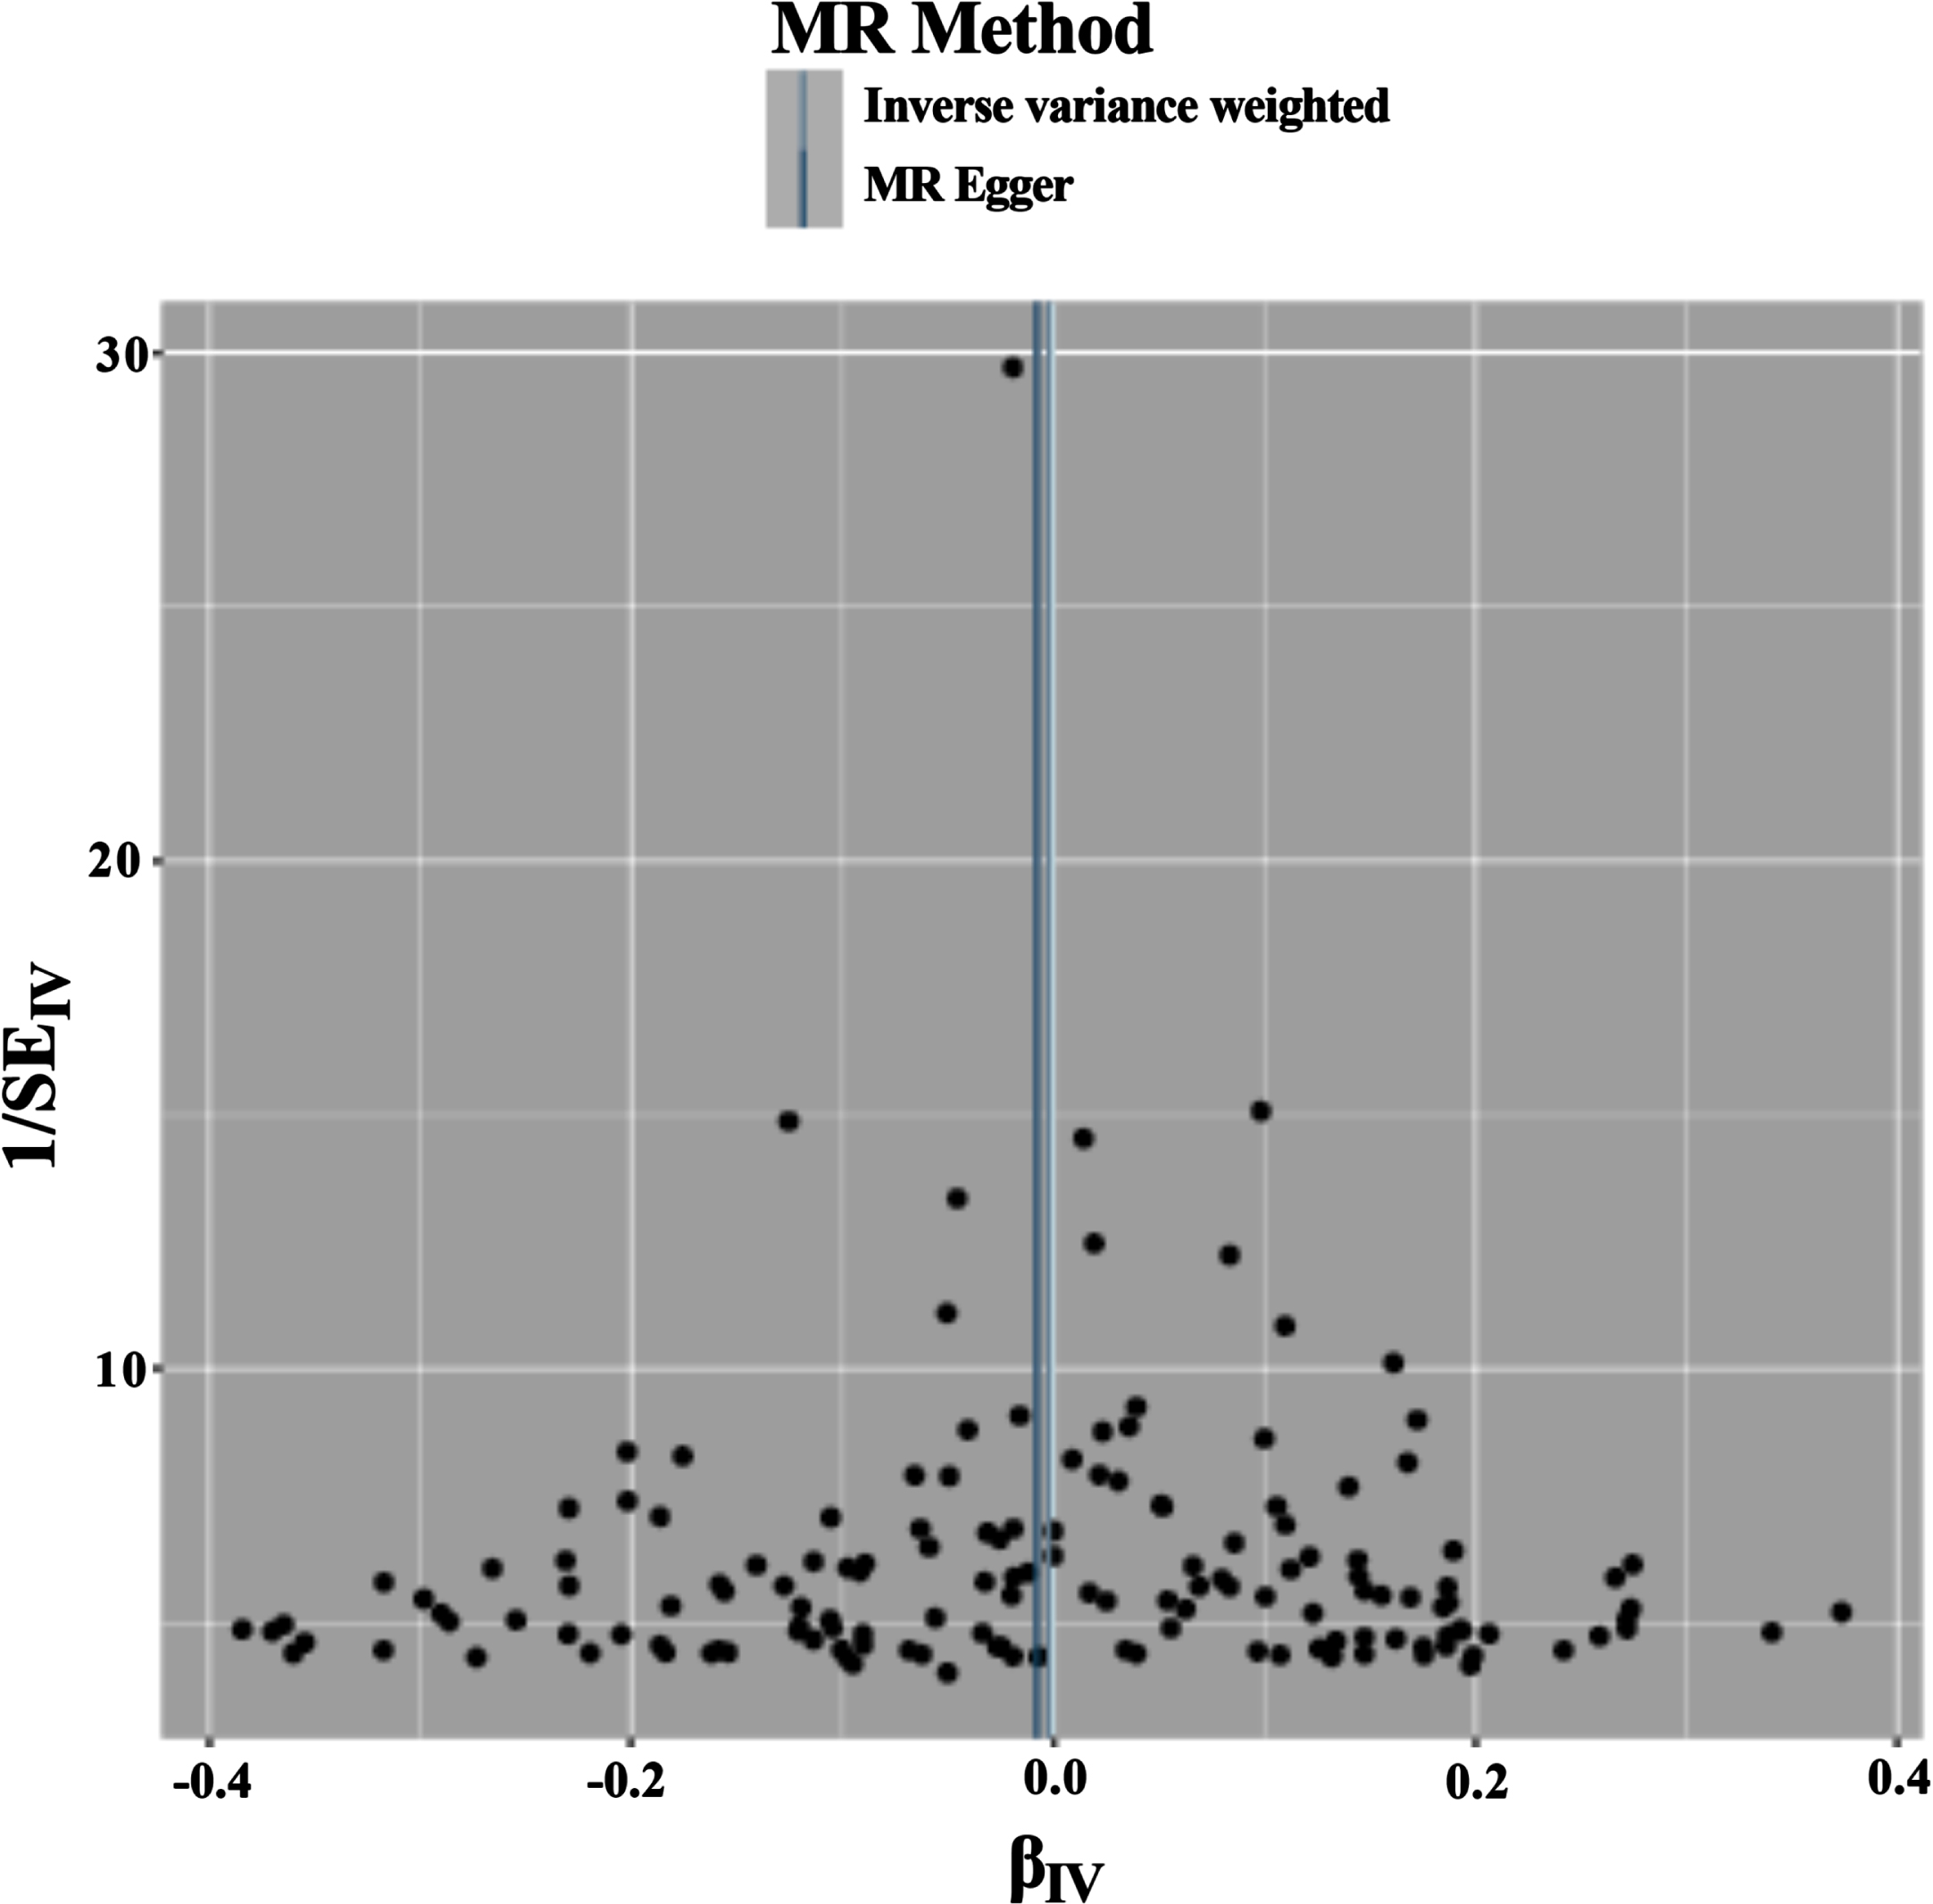
Funnel plot of the results of the heterogeneity test for forward MR method analysis. The funnel plot demonstrates that a single SNP is a causally relevant point for IV generation and exhibits a symmetrical distribution, suggesting minimal variation between IVs. MR Method, Mendelian Randomization Method; MR Egger, Mendelian Randomization Egger; IV, instrumental variables.
The intercept of MR—Egger regression was used to verify the presence of polyvalence in the study, and its results showed that the value of Egger’s intercept was 0.0004351, which is close to 0 (SE = 0.002, p = 0.803), meaning that there is no horizontal polyvalence, and the results of MR are not altered by multiple effects.
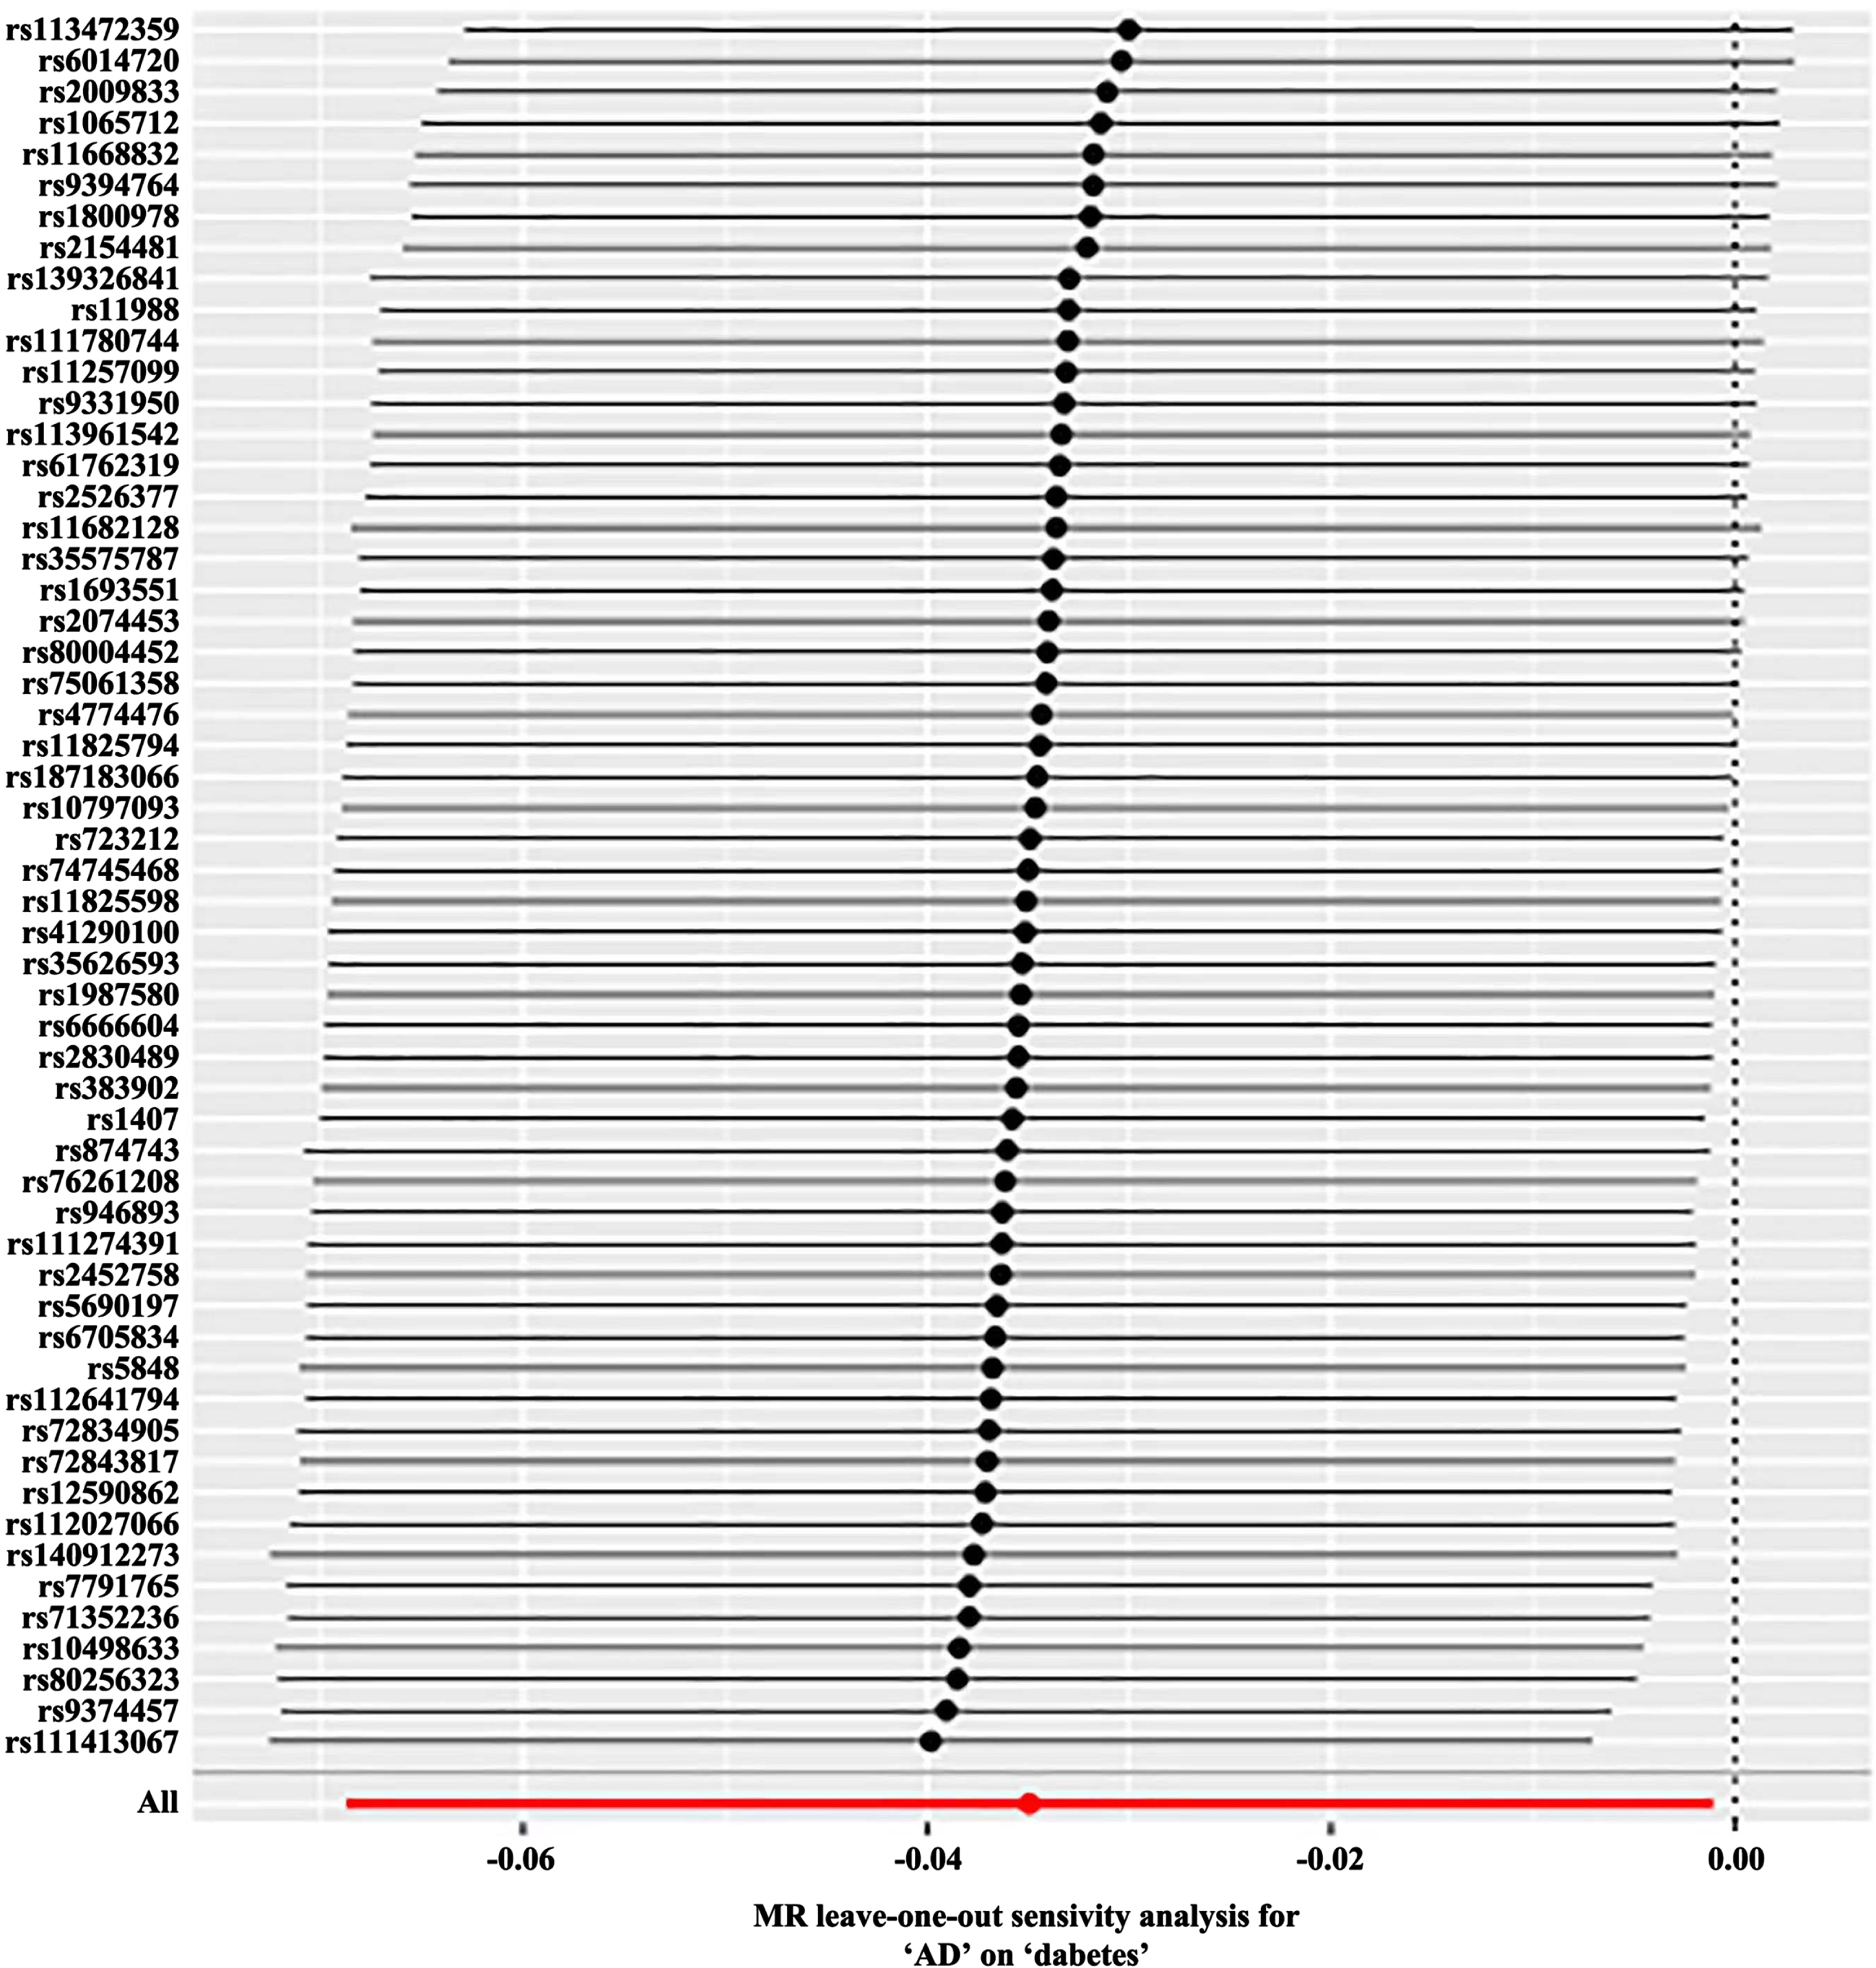
The “Leave-one-out” sensitivity analysis was used to visualize the results of the IVW method, and after sequentially eliminating single SNPs, the IVW effect values of the remaining SNPs did not fluctuate greatly, and all of them were close to the position of the red dots in the figure; this indicated that there were no SNPs in the IVs that had a strong influence on the results and showed that the previous results obtained by the IVW method were stable and reliable (Fig. 4).
Forward MR ‘Leave-one-out’ sensitivity analysis results. Sensitivity analysis employs the ‘leave-one-out ‘ method to systematically remove SNPs one at a time. By comparing the causal effects of the remaining SNPs with the MR analysis results of all SNPs to determine if the causal association is driven by a single instrumental variable. The MR analysis results demonstrate stable. MR, Mendelian Randomization.
Reverse MR analysis
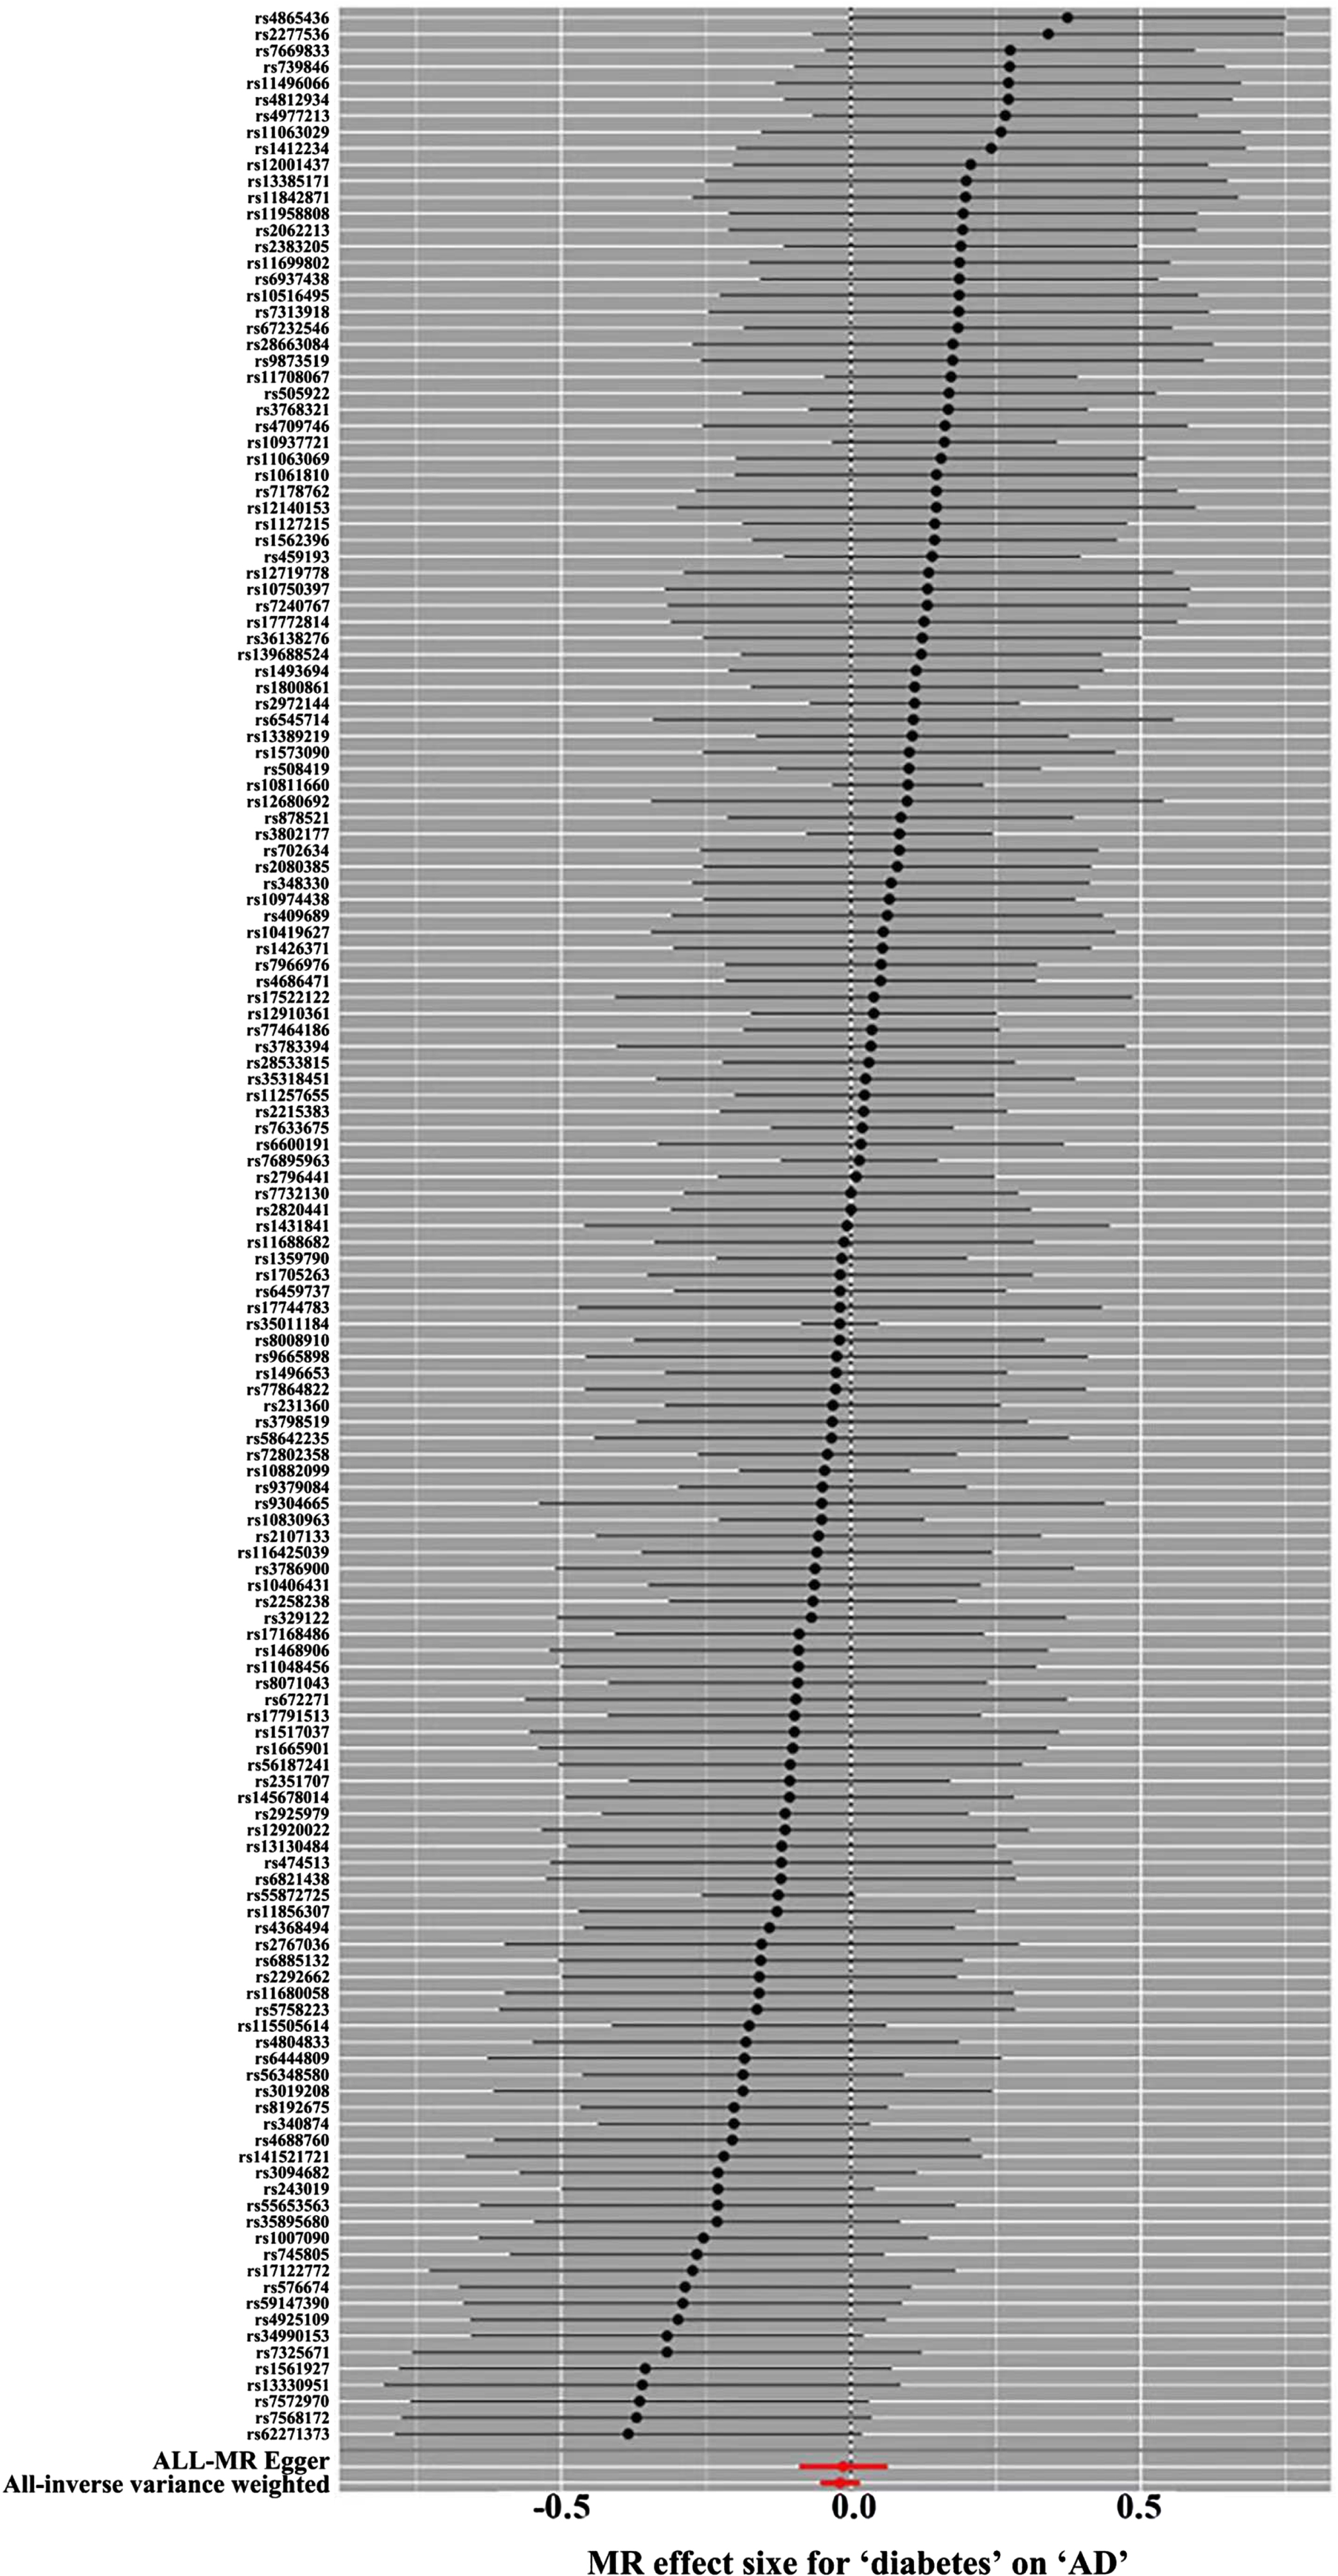
In the reverse two-sample MR analysis, AD was used as the exposure and T2DM was used as the outcome, and the same SNP screening conditions were set as in the forward MR, and a total of 56 SNPs were finally included as the IV for the reverse MR analysis. The results of the MR analysis did not support a causal relationship between genetic susceptibility to AD and the risk of T2DM (MR-Egger, OR (95% CI)=0.989 (0.921∼1.062), p = 0.767; WME, OR (95% CI)=0.975 (0.928∼1.024), p = 0.313; IVW, OR (95% CI)=0.966 (0.934∼0.999), p = 0.043; SM, OR (95% CI)=0.975 (0.876∼1.084), p = 0.641; WM, OR (95% CI)=0.978 (0.896∼1.069), p = 0.629) (Table 2 and Fig. 5). The results were tested for heterogeneity, and the Q-values and Qp-values of IVW and MR—Egger were 61.827 (0.245) and 61.174 (0.234). The results of the pleiotropy test showed SE = 0. 003, p = 0. 451.Sensitivity analysis did not detect any heterogeneity as well as the presence of horizontal pleiotropy (Fig. 6), and the leave-one-out method did not reveal any aberrant SNPs (Fig. 7).
Scatterplot of reverse MR. Scatter plot of genetic correlations of AD on T2DM using different MR methods. The slopes of line represent the causal effect of each method, respectively. MR Test, Mendelian Randomization Test; MR Egger, Mendelian Randomization Egger; SNP, Single-Nucleotide Polymorphism.
Funnel plot of the results of the heterogeneity test for reverse MR method analysis. The funnel plot demonstrates that a single SNP is a causally relevant point for IV generation and exhibits a symmetrical distribution, suggesting minimal variation between IVs. MR Method, Mendelian Randomization Method; MR Egger, Mendelian Randomization Egger. IV, instrumental variables.
Reverse MR ‘Leave-one-out’ sensitivity analysis results. Sensitivity analysis employs the ‘leave-one-out ‘ method to systematically remove SNPs one at a time. By comparing the causal effects of the remaining SNPs with the MR analysis results of all SNPs to determine if the causal association is driven by a single instrumental variable. The MR analysis results demonstrate stable. MR, Mendelian Randomization.
Reverse MR results of AD on T2DM
DISCUSSION
T2DM and AD
Clinical observations have shown [25] that the risk of AD in T2DM patients over 60 years of age is 10%, suggesting that T2DM may be a predisposing factor. Epidemiologic data have shown that [26] the risk of delayed-onset AD is increased 1.4 to 4.3 times in the T2DM population compared to the non-T2DM population [27]. This suggests that AD and T2DM are two different diseases, but that there may be some association between them. Traditionally, diabetes mellitus is divided into two categories, type 1 and type 2, of which type 1 diabetes is characterized by an attack on the pancreatic islet cells by the autoimmune system, resulting in impaired pancreatic β-cell function, which leads to a decline in insulin levels; IR is the primary characteristic of T2DM, with the main manifestations being the decline in the number of responsive insulin receptors and the attenuation of downstream signaling [7]. T2DM is a metabolic disease that may lead to a variety of complications, such as cardiovascular disease and neurodegenerative disease [28]. AD is a neurodegenerative disease characterized by progressive loss of memory and cognitive abilities, eventually leading to severe cognitive impairment [29]. Several studies have suggested [30] that T2DM may increase the risk of developing AD. This may be because T2DM affects the health of the blood vessels in the brain, leading to ischemia and hypoxia, which can damage nerve cells. In addition, T2DM may lead to an inflammatory response and oxidative stress, which may also accelerate the development of AD [31]. Based on the correlation between T2DM and AD pathogenesis, scholars have explored the use of hypoglycemic agents in the treatment of AD. The results of several studies have shown that a variety of hypoglycemic agents can alter the pathophysiologic course of AD and improve cognitive function in AD patients [32]. For example, thiazolidinediones reduce memory and cerebrospinal fluid levels of amyloid-β (Aβ) in AD patients, but the results of a phase 3 clinical study trial failed to achieve the desired effect [33]. The results of animal experiments have shown that metformin counteracts Aβ formation, tau protein hyperphosphorylation, oxidative stress, and neuroinflammation, and can act on neurons or astrocytes/microglia to reduce AD occurrence [34], but the results may be bidirectional. Although antidiabetic drugs may have a role in AD treatment, phase III clinical trials have not yet been able to obtain clear positive results, and the relationship between the two needs to be further explored. However, there is no conclusive evidence of a direct causal relationship between T2DM and AD.
Mendelian randomization results analysis
MR, an effective method for causal inference that has become popular in recent years, uses genetic variation as an IV to derive causal relationships between outcomes and exposures, effectively avoiding the confounding bias of traditional epidemiological studies because genotypes are randomly assigned and fixed at the time of conception, and so their use as an IV in MR can overcome the limitations of observational studies [35]. Therefore, we utilized a mendelian randomization approach to assess the relationship between AD and T2DM and to explore ways to prevent and treat both diseases. Although, we found no causal relationship between AD and T2DM through MR, it is still possible that T2DM contributes to the onset and progression of AD by acting as a confounding factor. First, IR can lead to diabetic hyperglycemia, inflammation, and oxidative stress, while IR is also an important feature of AD. Insulin-degrading enzymes are responsible for the degradation of insulin, glucagon, and Aβ protein, among others, and IR may lead to lower levels of insulin-degrading enzymes, which may reduce Aβ clearance [36]. At the same time, there are insulin-signaling abnormalities in the brain of AD patients, such as reduced levels of insulin, insulin receptor and insulin receptor substrate-1 (IRS1) mRNA and/or protein expression; and reduced indicators of downstream insulin signaling pathway protein activity, such as IRS1, alkaline phosphatase (AKT), and GSK-3β [37]. Under normal conditions, insulin promotes α-secretase activity, which converts amyloid precursor protein to soluble and neurotrophic amyloid-β protein precursor and reduces Aβ deposition [38], and when insulin efficacy is reduced in IR, Aβ deposition increases and promotes amyloid plaque formation. It is well known that the deposition of Aβ protein in the brain is one of the key factors in AD and can begin years or even decades before the disease progresses to the dementia stage [39].
Another major pathological feature of AD is the formation of neurofibrillary tangles by hyperphosphorylation of tau proteins, and elevated levels of phosphorylated tau proteins also occur in the cerebral cortex and hippocampus during the pathogenesis of T2DM. GSK-3β is a key enzyme in glycogen synthesis, and in AD, GSK-3β is one of the important kinases for tau protein phosphorylation. In the insulin-sensitive state, insulin binds to the receptor and activates insulin receptor tyrosine kinase, which initiates a cascade phosphorylation reaction via the IRS/PI3K/AKT and Ras/Raf/ERK pathways, and AKT phosphorylates the serine site 9 of GSK-3β and inhibits its activity so that tau proteins maintain their physiological function of binding to microtubules. In the IR state, the tyrosine 216 site of GSK-3β is activated by phosphorylation, which puts the tau protein in a hyperphosphorylated state and separates it from the microtubules, ultimately forming a neurofibrillary tangle [40]. It has been shown that [41] tau protein levels in spinal fluid and brain fluid of diabetes patients are as high as 16 pg/ml on average, which may imply the presence of more neurofibrillary tangles in the brain of diabetes patients [42]. There is a correlation between T2DM and reduced cortical thickness, and studies have shown that diabetes patients with mild cognitive impairment or AD have an average cortical tissue thickness of approximately 0.03 mm, which is lower than that of nondiabetic individuals [43].
Diabetic IR or insulin deficiency reduces choline acetyltransferase (ChAT) levels in patients; ChAT gene expression is regulated by insulin and insulin-like growth factor-1 receptor; IR or insulin deficiency reduces ChAT production, which in turn reduces acetylcholine production and leads to cognitive impairment; and the Braak staging of AD is associated with reduced ChAT expression in cortical neurons. At the same time, IR occurs in T2DM patients, resulting in increased peripheral insulin levels and transportation into the brain; prolonged high insulin levels in the brain can induce neuronal IR, reduce the activity of the key enzyme of glucose metabolism, hexokinase 2, and impair neuronal glycolysis. At the same time, hexokinase 2 regulates cyclin-dependent kinase 5 (CDK5) to activate and overaccumulate P35 protein and abnormally activate GSK-3β, thus impairing the cell cycle of neurons, leading to neuronal senescence, synaptic dysfunction, and other injuries [44]. In recent years, the discovery of enteric insulin and its use in the treatment of diabetes has resulted in some progress [45]. Enteric insulin analogs, which are designed to overcome the short half-life of enteric insulin and the need for continuous injections, such as exendin-4, liraglutide, and lixisenatide, have been developed to overcome the shortcomings of enteric insulin [46]. These three GLP-1 analogs are currently marketed as prescription drugs for diabetes, not only in the treatment of diabetes, but have been shown to have some cardiovascular effects [47]. GLP-1 has been shown to be neuroprotective in both AD cellular models and in vitro model studies [48]. A study showed that mice injected with liraglutide in the lateral ventricle had significantly lower levels of Aβ in the brain, improved synaptic plasticity and improved cognitive functions [49]. Liraglutide can enter the brain through the blood—brain barrier, enhance synaptic plasticity in the hippocampus, promote synaptic repair, prevent synaptic loss, reduce amyloid plaque deposition in the brain, and protect against neurotoxicity in APP/PS1 model mice. It is clear that both AD and T2DM can be ameliorated by GLP-1 and that clinical trials of liraglutide or exendin-4 in AD patients are proceeding on schedule. AD has been termed type 3 diabetes mellitus, which has brought a new entry point for the study of AD. At present, only two of the aspects of the relationship between type 3 diabetes mellitus and AD, insulin receptor function decline and signaling pathway disorders, have been investigated in preliminary research; the pathogenesis of AD has not yet had a clear answer, and interrelationships between the various concepts need to be studied further.
Limitations and advantages
However, this study did not find a direct causal association between AD and T2DM, which may be due to the small sample size of this study, resulting in insufficient statistical power and limited variation explained by genetic variants, as well as the fact that the samples in this study were taken mainly from individuals of European descent, and the results of the study may be affected by the unique dietary, behavioral, and other lifestyle characteristics of the local populations [50]. Moreover, numerous previous positive studies of AD and T2DM have been based on observational epidemiologic and case—control studies. Studies of AD and T2DM are susceptible to genetic risk, changes in neurotransmitter systems, autoimmunity, and psychosocial factors, as well as the inability to assess the sequential timing of the onset of AD and T2DM and the susceptibility to reverse causality, which can lead to a false association [51]. In summary, although T2DM is not causally related to AD, it can still indirectly increase the chances of AD through the development of cognitive deficits, and early detection of T2DM may help to prevent the onset of AD and indirectly reduce the incidence of AD.
The present study has the following strengths: it is the first study to assess the causal association between AD and T2DM from a genetic perspective using the MR framework, and the application of genetic studies can largely minimize the confounding factors and reverse causality effects that are present in traditional observational studies [52]. In addition, heterogeneity and sensitivity tests ensured the reliability of the findings. However, this study still has some limitations. First, the data used in this study may not be appropriate for the assessment of the nonlinear relationship between the two diseases. Second, the SNPs included in this study were all from individuals of European descent, so the results may not be applicable in other ethnic populations; however, this factor helps control for the bias caused by ethnographic stratification. Finally, the sample size of the current database is still limited, and MR analyses with larger sample sizes are necessary in the future [53]. Our MR study provides a discussion and analysis of the causal relationship between AD and T2DM. However, future studies are still needed to further validate and explore the intrinsic mechanism for the absence of a causal association between the two.
Conclusion
In conclusion, no causal relationship between T2DM and AD was found in our study. Epidemiologic studies have found a correlation between T2DM and AD, and many of the associations between T2DM and AD have come from observational studies or through mechanisms such as intermediary mediated effects of insulin and insulin receptor function, amyloid deposition, cerebral microvascular lesions, inflammation, oxidative stress and mitochondrial dysfunction, which predispose to AD and contribute to the progression of AD, but this is not evidence of a robust causal relationship.
AUTHOR CONTRIBUTIONS
Cong Li (Writing – original draft); Haifeng Qian (Methodology); Lina Feng (Writing – review & editing); Mingquan Li (Writing – review & editing).
Footnotes
ACKNOWLEDGMENTS
The authors have no acknowledgments to report.
FUNDING
This study was supported by the Natural Science Foundation of Shandong (ZR2023QH159); Shandong Province Medical Health Science and Technology Development Plan Project (202313011384).
CONFLICT OF INTEREST
The authors have no conflict of interest to report.
DATA AVAILABILITY
All data used to support the findings of this study are included within the article.