
Abstract
Background:
Application of visual scoring scales for regional atrophy in Alzheimer’s disease (AD) in clinical settings is limited by their high time cost and low intra/inter-rater agreement.
Objective:
To provide automated atrophy scoring using objective volume driven from deep-learning segmentation methods for AD subtype classification using magnetic resonance imaging (MRI).
Methods:
We enrolled 3,959 participants (1,732 cognitively normal [CN], 1594 with mild cognitive impairment [MCI], and 633 with AD). The occupancy indices for each regional volume were calculated by dividing each volume by the size of the lateral and inferior ventricular volumes. MR images from 355 participants (119 CN, 119 MCI, and 117 AD) from three different centers were used for validation. Two neuroradiologists performed visual assessments of the medial temporal, posterior, and global cortical atrophy scores in the frontal lobe using T1-weighted MR images. Images were also analyzed using the deep learning-based segmentation software, Neurophet AQUA. Cutoff values for the three scores were determined using the data distribution according to age. The scoring results were compared for consistency and reliability.
Results:
Four volumetric-driven scoring results showed a high correlation with the visual scoring results for AD, MCI, and CN. The overall agreement with human raters was weak-to-moderate for atrophy scoring in CN participants, and good-to-almost perfect in AD and MCI participants. AD subtyping by automated scores also showed usefulness as a research tool.
Conclusions:
Determining AD subtypes using automated atrophy scoring for late-MCI and AD could be useful in clinical settings or multicenter studies with large datasets.
INTRODUCTION
Alzheimer’s disease (AD) is the most common form of dementia and involves a decline in memory, cognition, language, and activities of daily living. With amyloid-targeting drugs currently on trial and expected to be on the market soon, the identification of AD biomarkers for adequate clinical intervention is of growing interest to clinicians, researchers, and public health service providers. To promptly introduce precision-medicine treatments, increased knowledge on the diverse subtypes of degenerative dementia, including AD, is necessary. Moreover, for the differential diagnosis of the degenerative dementia subtypes, the range and combination of atrophy findings across brain regions on brain magnetic resonance (MR) images are fundamental.
Brain magnetic resonance imaging (MRI) may provide essential information for diagnosing the etiology of dementia, also allowing to exclude secondary or reversible causes of dementia [1]. Thus, several brain structures are known to present atrophy earlier than others during the progression of AD, as widely reported in several MRI studies [2, 3]. Previous studies have also reported that hippocampal volume and cortical thinning in the entorhinal cortex are highly sensitive measures of structural change both in AD and mild cognitive impairment (MCI) [4, 5].
Brain atrophy scales, which are generally graded visually by clinicians and radiologists, have been proposed as an objective approach to quantify the degree of atrophy. Brain atrophy scales if they could reflect the actual clinical symptoms may be further utilized to identify AD subtypes. Common visual rating scales include the medial temporal atrophy (MTA) scale [6], global cortical atrophy scale –frontal subscale (GCA-F) [7], and posterior atrophy (PA) scale [8]. Prior studies have also compared visual atrophy scores with measured brain volume, cortical thickness, memory performance, non-memory function, and disease progression [2, 9–17].
Automated atrophy scoring and MR image scoring for identifying AD subtypes have several advantages over the use of biomarkers extracted from the cerebrospinal fluid and positron emission tomography (PET) images. MRI is a non-invasive, more accessible approach than other diagnostic approaches. For example, cerebrospinal fluid biomarkers provide a way to obtain Amyloid/Tau/Neurodegenerative (A/T/N) biomarkers simultaneously; however, they require an invasive procedure accompanied by cerebrospinal fluid (CSF) lumbar tapping. The CSF lumbar tapping procedure presents potential risks, such as post-lumbar puncture headache, back discomfort or pain, bleeding, and brainstem herniation. PET images provide functional and early diagnostic measurements non-invasively, and with higher reliability; however, the disadvantages include the risks associated with radiation exposure and high costs [18]. In contrast, MR images can be obtained without radiation exposure and have a relatively lower cost than PET images [1].
Visual scoring, however, has low inter- and intra-rater reliability and is a time-consuming and labor-intensive task. Visual quantification of brain volumes and measurement of cortical thickness can differ, along with visual atrophy scale scoring, even between neuroradiologists and dementia specialists. These caveats can make it difficult for doctors to trust the atrophy scales scored by others, and can also be a barrier in integrating multi-rater or multi-center datasets. Hence, many efforts are ongoing to convert conventional visual atrophy scoring into quantitative measuring methods to help reduce the workload and provide a higher degree of concordance. Furthermore, the utility of quantifiable and objective methods could also be expanded to differentiate the four AD subtypes of minimal atrophy, limbic-predominant, hippocampal-sparing, and typical AD [19, 20].
The purpose of this study was to introduce an automated rating approach for atrophy scales (MTA, GCA-F, and PA scales) using volumetric measurements. Integrable indices were used for quantification and automation. We then validated our automated rating approach by comparing them with visual ratings of MTA, GCA-F, and PA scales obtained from radiologists. In addition, a comparison between human raters and our method was provided, and appropriate cutoff values to differentiate between normal and abnormal cases were described for each region. Finally, we presented the implications of our method for use in AD subtype classification based only on volumetric atrophy information from MR images, without the need to integrate any other modality data or biomarkers.
METHODS
Study design overview
This study aimed to develop an automated atrophy scoring system based on volumetric measurements and utilized these scores for AD subtype classification. A total of 3,959 participants, including cognitively normal (CN), MCI, and AD subjects, were enrolled in the atrophy score development set. Regional volumes were quantified, and occupancy indices were calculated by normalizing each volume against the sum of inferior lateral ventricular volumes, which were then categorized into quintiles. To validate our automated score, MR images from 355 participants across three different centers were used. Visual assessments by neuroradiologists and automated atrophy scoring using Neurophet AQUA were compared for consistency and reliability, with cutoff values determined based on age-related data distributions and previous studies [21–23]. Subsequently, we compared the ability of identifying AD subtypes using the atrophy scores by using previous definitions [2] and comparing the neuroradiologists’ score-based subtypes and the automated score-based subtypes. Our study flowchart is presented in Fig. 1.
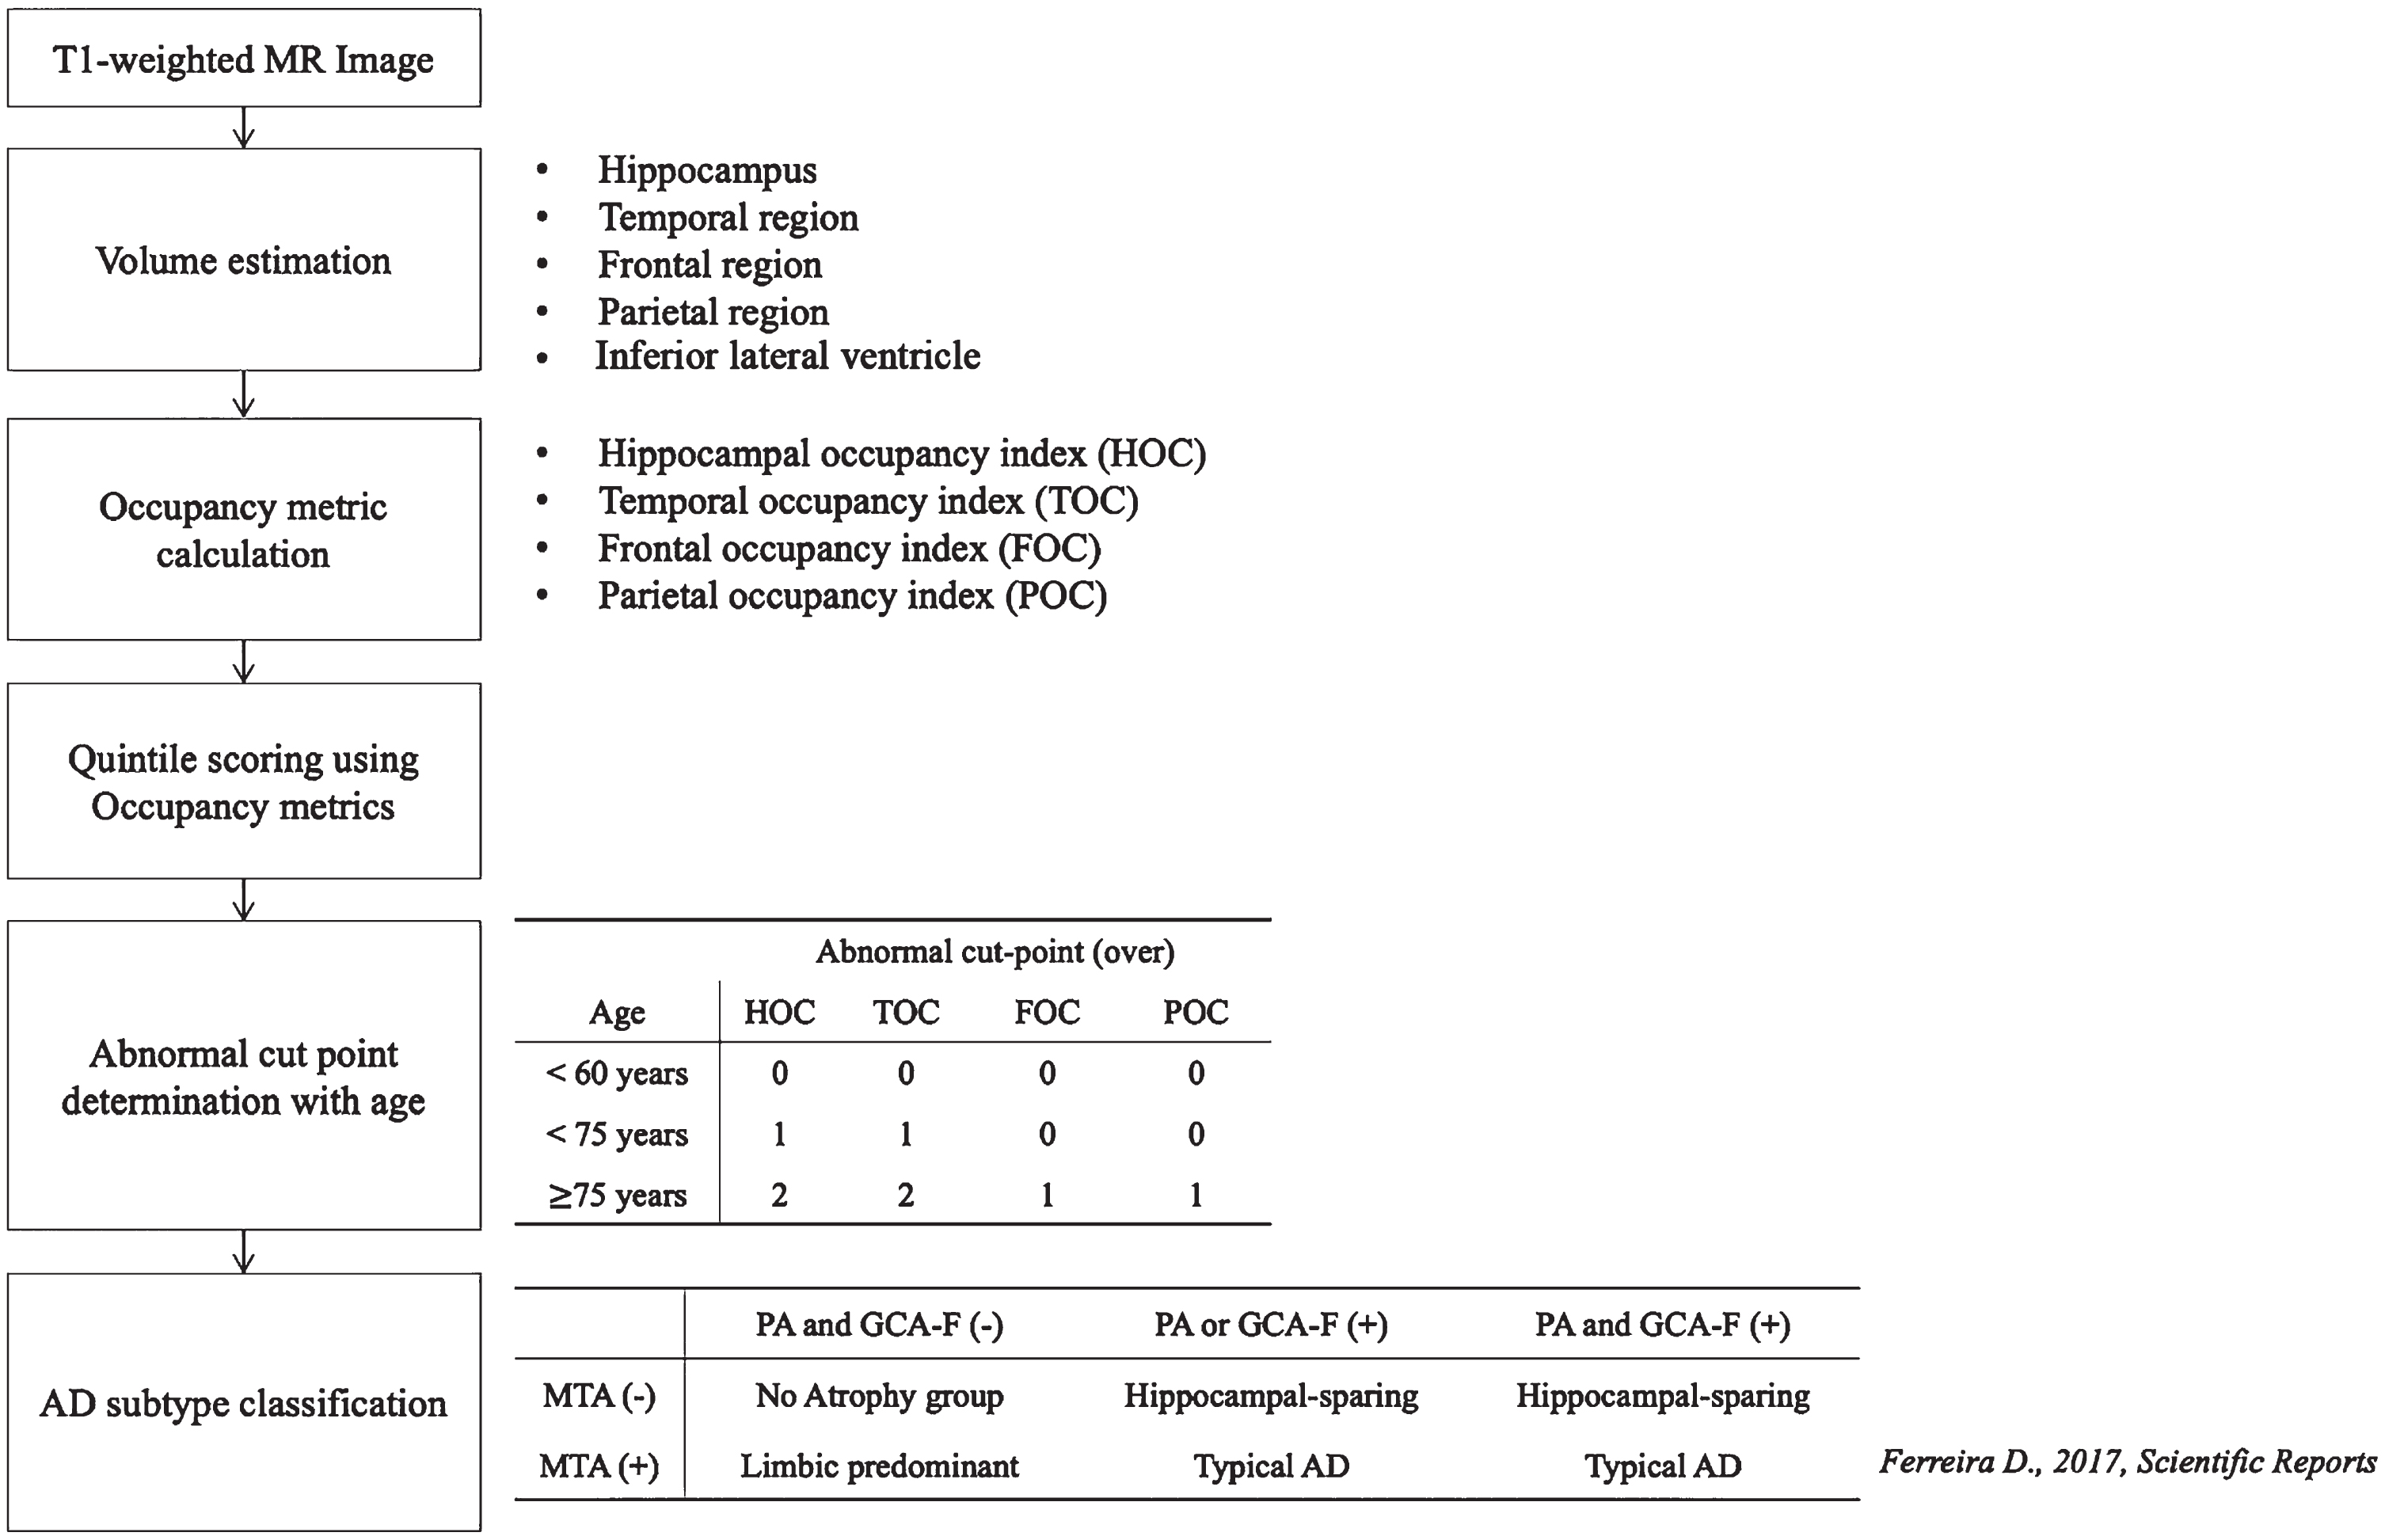
Flowchart of study pipeline. AD, Alzheimer’s diseases; MTA, medial temporal atrophy score; GCA-F, global cortical atrophy score of the frontal lobe; PA, posterior atrophy score; HOC, hippocampus occupancy index; TOC, medial temporal lobe occupancy index; FOC, frontal lobe occupancy index; POC, parietal lobe occupancy index; (–), normal; (+), abnormal.
Participants
In total, 3,959 participants were included in this study for the development and validation groups in seven different centers. The age range was between 20 and 110 years, and three diagnosis groups (CN, n = 1,732; MCI, n = 1,594; and AD, n = 633) were available. The validation dataset was also composed of elderly participants, including CN, MCI, and AD cases from three centers (The Catholic University of Korea Yeouido St. Mary’s Hospital, SMG-SNU Boramae Medical Center, and The Yonsei University Severance Mental Health Hospital). For all centers, the diagnosis groups were identified by all qualified clinicians based on the National Institute on Aging Alzheimer’s Association (NIA-AA) research criteria for the probable disease group [24] for AD. Participants diagnosed with MCI according to Peterson’s criteria reported memory impairment (considered in the context of their age, education, and sex by clinicians) or were reported to exhibit memory impairments by a relative, with mostly intact function of daily living and Clinical Dementia Rating (CDR) of 0.5 [25–28]. The CN group had normal cognitive function without any significant impairment in memory function assessed by word list memory, word list recall, and word list recognition domains according to their age, sex, and education status, and a CDR score and Memory Box score of 0 [29].
This study has obtained Institutional Review Board (IRB) approval from each individual center. The development dataset was approved by Wonkwang University Hospital (approval no. 2019-09-002-002), the Catholic Aging Brain Imaging (CABI) database, which holds brain MRI scans of patients enrolled at the Catholic Brain Health Center, Yeouido St. Mary’s Hospital, and Eunpyeong St. Mary’s Hospital at the Catholic University of Korea (approval no. XC20RIDI0035V, PC20EISI0007, SC20RISI0198), and Seoul National University Hospital (approval no. D-2106-221-1233). The validation dataset was approved by the IRB of Yonsei University Health System (approval no. 1-2021-0025), Yeouido St. Mary’s hospital (approval no. 2020-3348-0007), and SMG-SNU Boramae Medical Center (approval no. 30-2020-325).
MR images acquisition and image processing
All brain MR images were collected using 3T 3D T1-weighted images (T1-w) at individual centers. Detailed parameters are described in Supplementary Table 1. Brain volumes from the participants were estimated using T1-w MR images with a deep-learning-based MRI segmentation software, Neurophet AQUA (Neurophet Inc., Seoul, Republic of Korea) version 2.1.4. Neurophet AQUA is a brain MRI segmentation software based on the deep-learning algorithm, the Split-attention U-net (SAU-Net), as previously described [30]. Briefly, regions of interest (ROIs) were defined based on the Desikan–Killiany atlas as in FreeSurfer [31]. Neurophet AQUA was then trained with the ROI definitions reviewed and corrected by neuroradiologists. The validation of the software was conducted through comparison (dice overlap and the average symmetric surface distance) on 22 major ROIs (in the two hemispheres of cerebral gray matter, cerebral white matter, cerebellum, lateral ventricle, caudate, accumbens, putamen, amygdala, hippocampus, pallidum, and thalamus) and showed a higher performance than that of well-known software FastSurfer [32] or QuickNAT [33].
Demographics of the participants in the development and validation datasets
CN, cognitively normal group; AD, Alzheimer’s disease; MCI, mild cognitive impairment. ap < 0.001 between CN and AD.
ROIs for volumetric estimation were based on the radiologists’ visual assessment, referring to regions decided based on discussion with psychologists. Individual lobe definitions were as follows: medial temporal lobe (entorhinal, parahippocampus, and hippocampus), parietal lobe (inferior and superior parietal, postcentral, precuneus, and supramarginal), and frontal lobe (caudal and rostral middle frontal, lateral and medial orbitofrontal, paracentral, pars opercularis, pars orbitalis, pars triangularis, precentral, superior frontal, and frontal pole) [2].
MR image visual assessment
Visual interpretation of the atrophy scale was conducted by two radiologists (J.Y.K. and M.Y.L.) in a blinded test without any patient information, including diagnostic information, age, sex, or other radiologists’ rating results. The atrophy score was composed of three regional scores: MTA, PA, and GCA-F. MTA scale scores are based on the degree of atrophy in the medial temporal area, including the hippocampus, parahippocampal gyrus, and entorhinal cortex, divided by the size of inferior ventricle. The PA scores in the posterior atrophy involve the posterior cingulate sulcus, precuneus, parieto-occipital sulcus, and overall parietal cortex. Finally, the GCA-F scores represent the frontal lobules surrounding the central sulcus, frontal bone, and fissure of Sylvius [34]. PA and GCA-F were composed of 0-to-3 scales and considered the widening of the sulci [35]. After the individual rating process was performed, both radiologists determined the final visual assessment result by discussion until an agreement was reached.
Visual atrophy scores were converted into a binary value considering age differences[21]. The MTA score ranges from 0 to 4, GCA-F scores from 0 to 3, and PA scores from 0 to 3. The definition of an abnormal MTA score varied according to age: abnormal MTA scores were 1–3, 2–3, and 3 for the under 70 years, 70–80 years, and ≥80 years age groups, respectively [21]. GCA-F and PA scores were defined as abnormal when the value was above zero (GCA-F or PA > 0) [34].
Development of automated atrophy scoring using population distribution and abnormality.
To estimate the automatic regional atrophy scores, we considered four occupancy indices [27]: the frontal occupancy index (FOC), parietal occupancy index (POC), temporal occupancy index (TOC), and hippocampal occupancy index (HOC); using the following equation:
TOC, POC, and FOC were originated from the HOC score, which is one of the features related with hippocampal atrophy measurement. Once the occupancy indices of the corresponding ROIs were calculated, they were further categorized into quintiles for automated regional atrophy scoring. These quintile cutoffs were used for automatic regional atrophy scoring from 0 to 4. All participants were included in this analysis.
The automatic regional atrophy scores were then further divided into normal and abnormal atrophy. The binary cutoff values according to age for automatic regional atrophy scores were determined after investigating the distribution of four occupancy indices (Fig. 2). The medial temporal regional age cutoff value was set at 0 for participants under 60 years of age, 1 for participants between 60 and 75 years of age, and 2 for those above 75 years of age. However, participants above 75 years of age were assigned a lower cutoff value in the frontal and posterior lobes (0 for those under 75 years, and 1 for those above 75 years). These age-based cutoff values had been confirmed in previous studies [21–23].
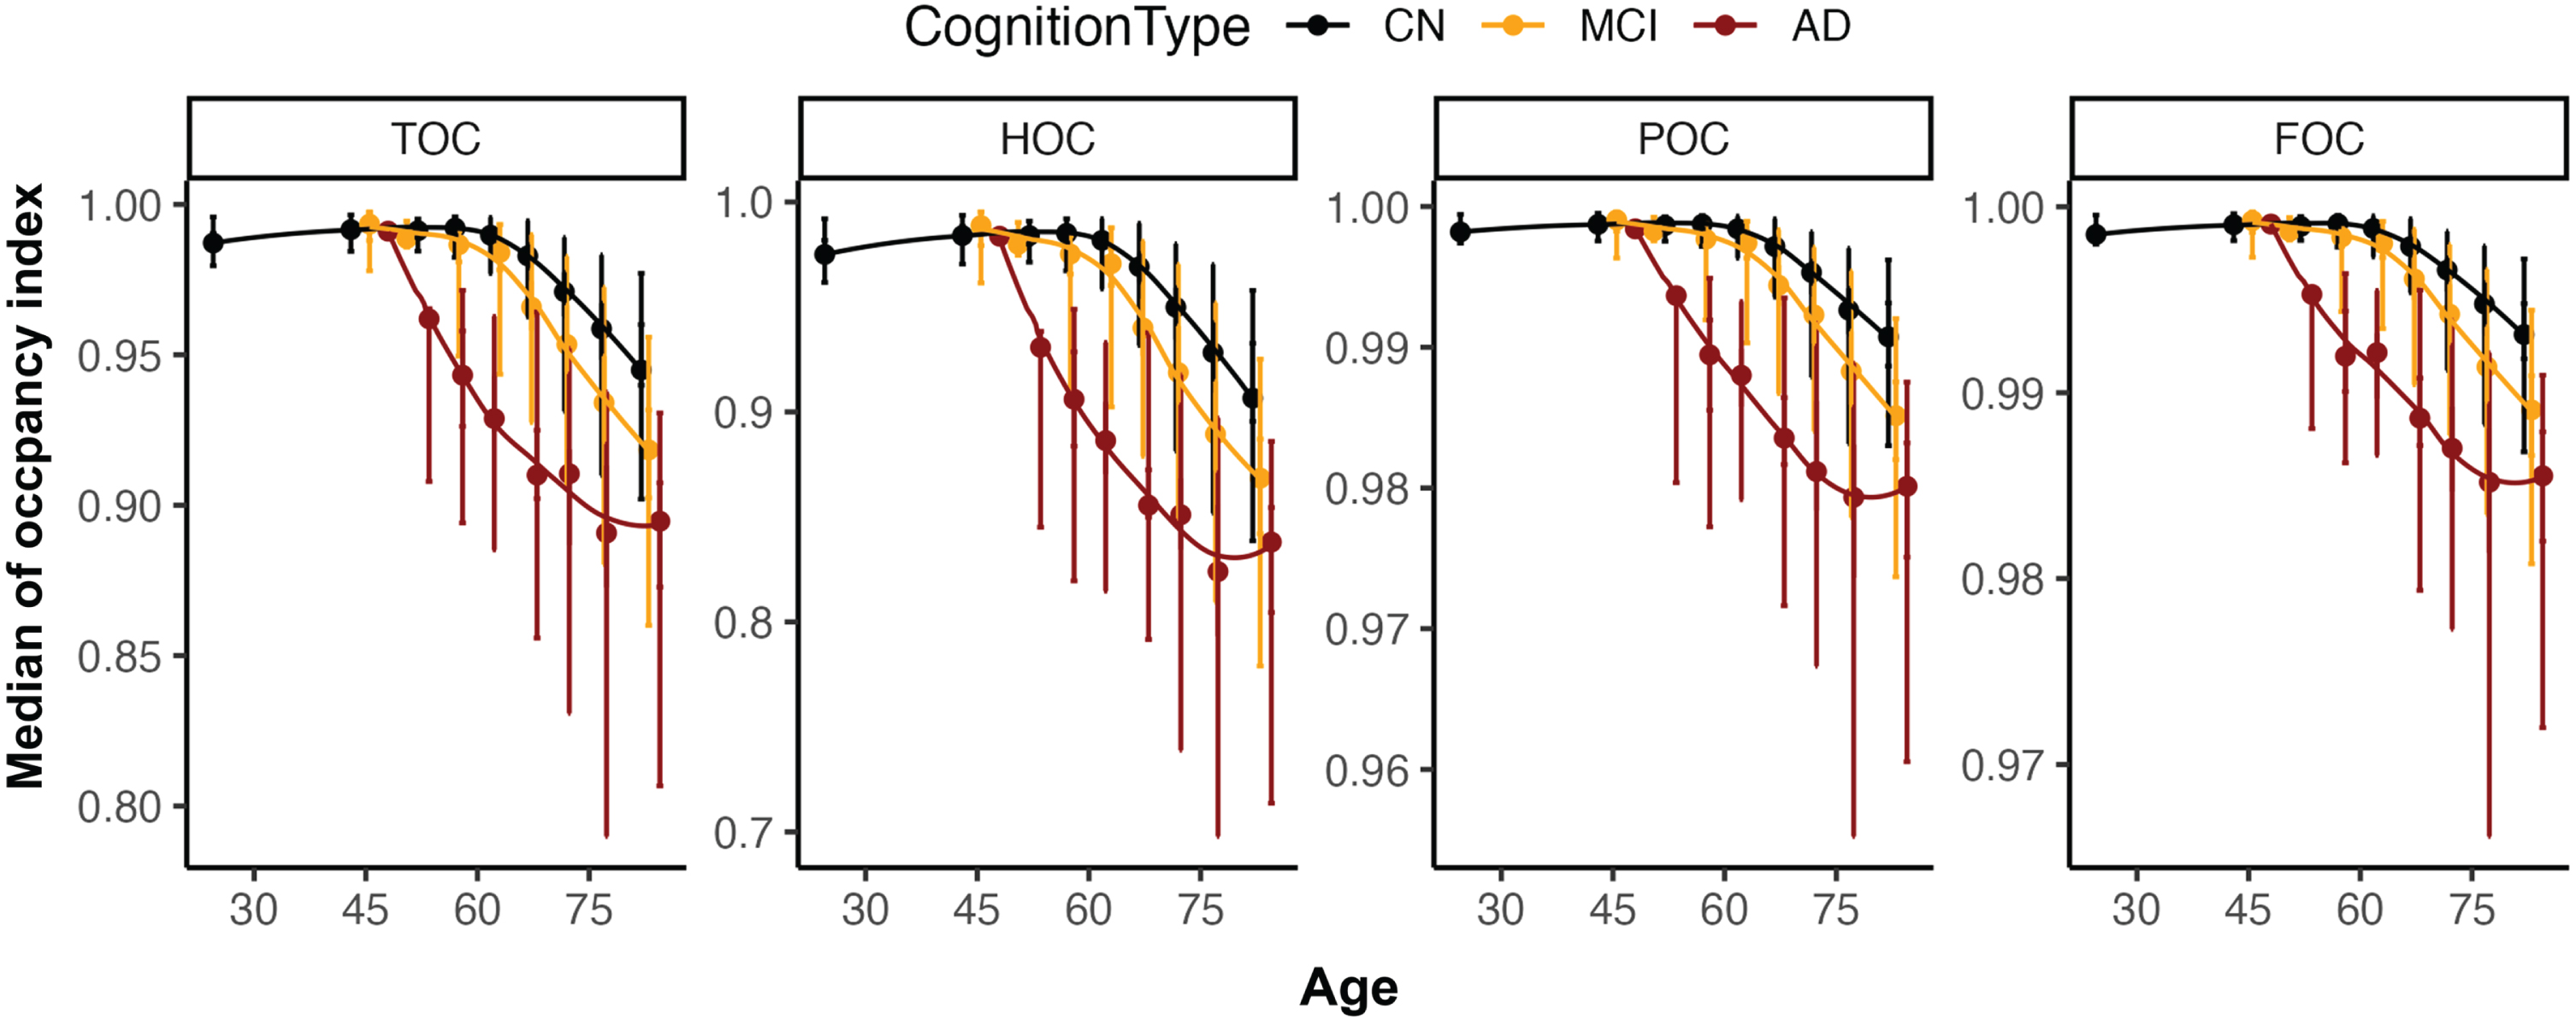
Distribution overview for four occupancy indices (TOC, HOC, POC, and FOC) according to age. For the <30, 31–49, 50–54, 55–59, 60–64, 65–69, 70–74, 75–79, and 80–100 age groups, the median age and median occupancy indices were plotted with quintiles (Q1, Q2, Q3, and Q4 from the top to bottom as error bar). TOC, medial temporal lobe occupancy index; HOC, hippocampus occupancy index; POC, parietal lobe occupancy index; FOC, frontal lobe occupancy index; CN, Cognitive normal; MCI, mild cognitive impairment; AD, Alzheimer’s disease.
Subtyping in Alzheimer’s disease participants
In this study, AD cases were then divided into four types (typical AD, limbic-predominant, minimal atrophy, and hippocampal-sparing types) entirely based on automated atrophy scoring. Those AD subtyping using volumetric features from MR images which are independent from other clinical information or neuropsychological status were suggested previously [2]. In the previous study [2], the typical AD type was defined as participants with overall atrophy pattern in the parietal, temporal, and frontal cortices. The limbic-predominant type included those participants with medial temporal lobe atrophy only and normal posterior and frontal cortices. The minimal atrophy type included participants who did not show any atrophy pattern in the lobes related to AD. Within the minimal atrophy type, participants without atrophy in the medial temporal cortices were categorized into the hippocampal-sparing type. Following those previous definitions for the subtypes, we utilized our automated atrophy scoring of TOC, POC, and FOC, which correspond to MTA, PA, and GCA-F. For MTA, the TOC index was utilized instead of the HOC index because the MTA score was estimated using multiple correlations in the medial temporal, hippocampus, and inferior horn of the lateral ventricle [23]. In addition, we recruited patients with AD and MCI who showed a CDR sum of boxes (SOB) higher than 3.5 as a subtyping type.
Statistical analysis
We used a diverse statistical test to compare the differences between each group for numeric variables (an independent sample t-test, and one-way analysis of variance (ANOVA) and the qualitative variables (a chi-square test). After one-way ANOVA, the Bonferroni correction was adopted for post-hoc analysis [36] and a p-value <0.001 was considered significant. Accuracy and Gwet’s AC2 [37] were conducted to compare the visual ratings of the two radiologists (JY. K and M.Y.L). Accuracy, sensitivity, and specificity are values that estimate the corrected sample number compared to the total sample number. Gwet’s AC2, a second-order agreement coefficient with ordinal weighting applied, was shown to have a higher inter-rater reliability coefficient and stable reliability coefficient because it was established to overcome the limitations of Cohen’s kappa [38] when score properties were different between groups [39,40, 39,40]. The probabilistic method for benchmarking, as suggested by Gwet. The minimal inter-rater agreement was 0.21–0.39 and 0.40–0.59, 0.60–0.79, 0.80–0.90, and >0.90 as minimal, weak, moderate, strong, and almost perfect [41, 42]. In addition, we used accuracy and Gwet’s AC2 score as indicators of the agreement between the two raters and the performance score of the proposed atrophy scoring system compared to the visual atrophy scores. All statistical analyses were performed using R software version 3.6.3 and used the following R packages: caret [43], irr [44], and irrCAC [45] to compare the accuracy and inter-rater reliability.
RESULTS
Patients demographics
The demographics of participants in the development (N = 3,959) and validation (N = 355) datasets are presented in Table 1. Patients in both datasets showed similar mean age and sex distribution, while the development dataset showed a wider age range due to the inclusion of younger participants (<50 years, 206 participants, 1 AD, 8 MCI, and 197 CN) (p = 0.003). There was no significant difference in the sex distribution between the development and validation datasets (p = 0.729). However, the cognitive-type distribution showed a significant difference among AD and CN patients (p < 0.001), but not among MCI patients (p = 0.015). As expected, there were significant differences in age according to the diagnosis group, both in the development dataset (p = 0.015) and in the validation dataset (p < 0.001), with slightly younger ages registered in the CN and MCI groups.
Correspondence between atrophy scores across radiologists
The correspondence between the ratings of the two radiologists estimated using the validation dataset showed moderate similarity for all three atrophy scores in Table 4. The accuracy of the atrophy scores between the two radiologists was 0.619, 0.627, and 0.547 for MTA, GCA-F, and PA, respectively. After dichotomizing the atrophy scores to normal and abnormal groups using age-adjusted cutoffs, the accuracy was improved to 0.834, 0.927, and 0.972, respectively. While sensitivity was similarly high across the three scores (0.791, 0.991, and 0.977), specificity showed quite a different pattern between MTA and PA or GCA-F (0.900, 0.207, 0.333, respectively). In addition, Gwet’s AC2 was moderate in MTA (0.673) and almost perfect in GCA-F and PA (0.919 and 0.971).
Quantitative atrophy scoring using MR-driven measurements
The distributions of the four regional occupancy indices in our development dataset are shown in Fig. 2. As expected, all the occupancy indices decreased with age, since the volume of ROI also decreases with age. In particular, AD patients showed a faster decline in occupancy indices in TOC and HOC, including MTA-specific regions, than MCI or CN patients aged between 50 and 75 years. In contrast, POC and FOC regions showed a relatively moderate decline both with age and disease severity (Fig. 2). The four regional occupancy indices showed significant differences among AD, MCI, and CN patients (p < 0.001), and significantly decreased with age (p < 0.001). As shown in Table 2, the mean occupancy index significantly decreased from Q1 to Q5 (p < 0.001). The largest difference was observed for HOC (from 0.990 [Q1] to 0.742 [Q5]: –0.248), and the smallest difference was observed for FOC (from 0.999 [Q1] to 0.975 [Q5]: –0.024). Thresholds for each occupancy index were determined by including all CN participants and the age-specific cutoff values suggested in previous studies [21–23].
Four regional occupancy indices summarized across quintiles for the development dataset including young and elderly cognitive normal
Q1–Q5, Quintile range 1–5; HOC, hippocampus occupancy index; TOC, medial temporal lobe occupancy index; FOC, frontal lobe occupancy index; POC, parietal lobe occupancy index.
Application of quantitative atrophy scoring
To demonstrate the clinical application of our quantitative atrophy scoring system, the regional atrophy score and the corresponding age-weighted cutoff value were applied to our validation set. The trend of the occupancy index in the validation set was similar to that in the development set. The average of four indices was negatively correlated with the visual score, and the standard deviation increased with the visual score. In the case of low occupancy indices, we did not find any high atrophy scores determined by the radiologists. In contrast, in the case of low scores on the visual scale, a low occupancy index was included for PA and GCA-F (Fig. 3 and Supplementary Table 2). In general, the association of GCA-F with age was relatively gradual compared to that of MTA or PA.
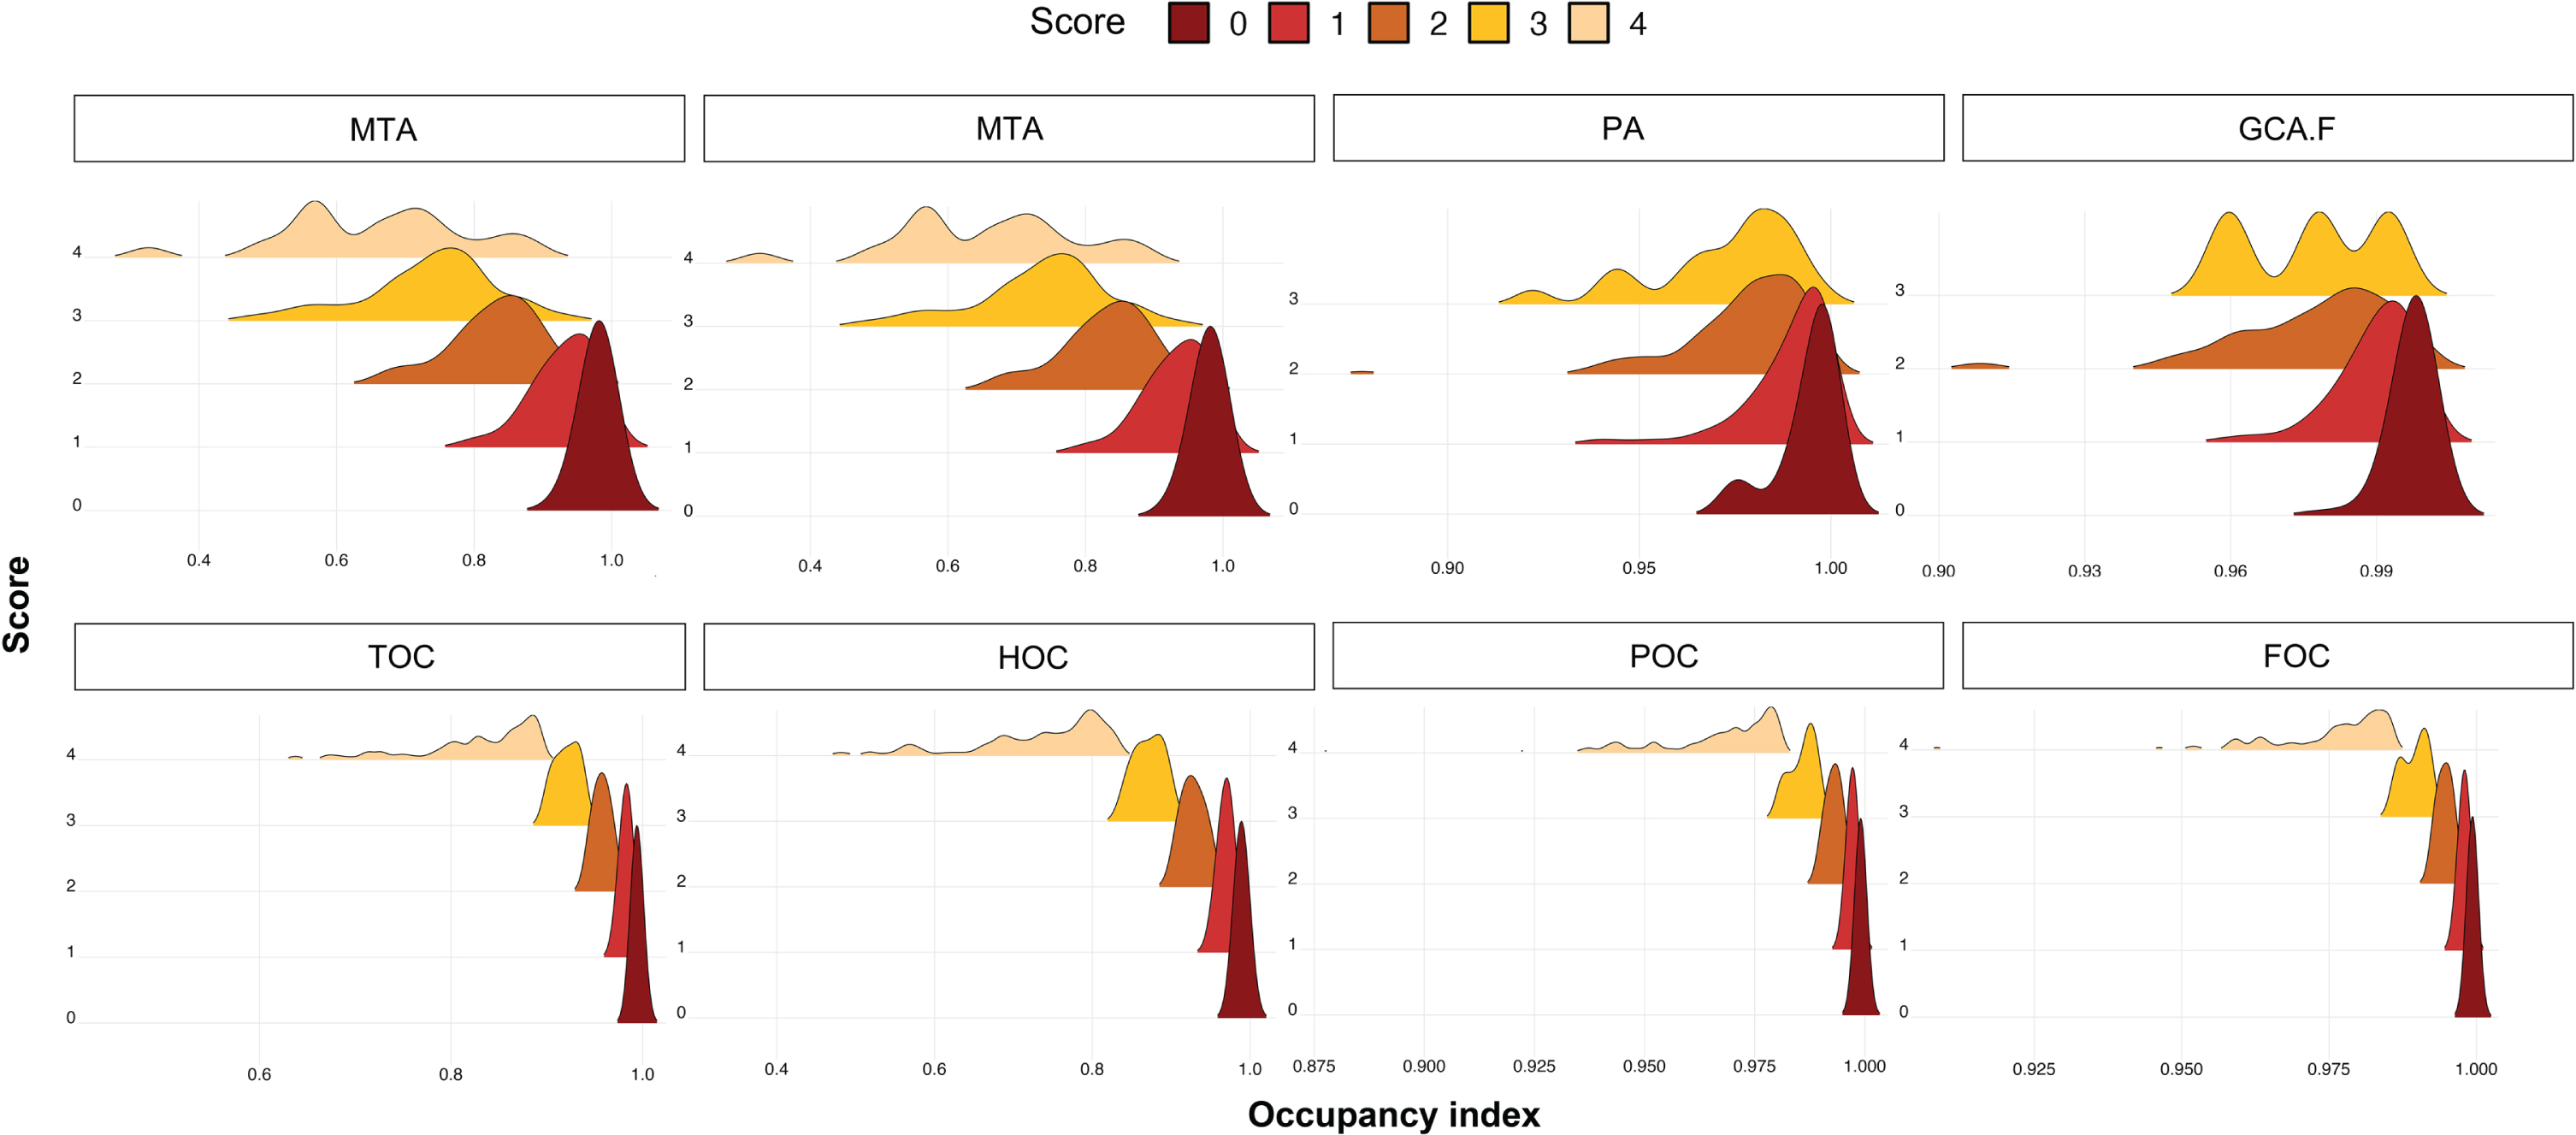
Comparison of regional score data distribution between visual assessment (upper figures) and automated scores (bottom figures) across regional occupancy indices. MTA, medial temporal atrophy score; GCA-F, global cortical atrophy score of the frontal lobe; PA, posterior atrophy score; HOC, hippocampus occupancy index; TOC, medial temporal lobe occupancy index; FOC, frontal lobe occupancy index; POC, parietal lobe occupancy index.
After converting the atrophy score to a dichotomized abnormality score using age-adjusted cutoffs, most of AD and MCI cases were included in the abnormal group (Table 3). The correspondence between the radiologists’ rating and the automated score improved for all four indices (Table 4). The highest accuracy and AC2 score corresponded to the score for the parietal lobe (accuracy/AC2 : 0.876/0.853), while the lowest values were registered for the temporal lobe (accuracy/AC2 : 0.721/0.483). We selected the TOC score from the medial temporal scoring index, and discarded the HOC score in our further analysis because of its lower accuracy, sensitivity, specificity, and Gwet’s AC2 score.
Demographics across the occupancy index abnormality groups
TOC, medial temporal lobe occupancy index; HOC, hippocampus occupancy index; POC, parietal lobe occupancy index; FOC, frontal lobe occupancy index; AD, Alzheimer’s disease; MCI, mild cognitive impairment; CN, cognitively normal. aNormal: Q0, Abnormal: Q1–Q5 for participants under 60 years; Normal: Q0–Q1, Abnormal: Q2–Q5 for participants between 60 and 75 years; Normal: Q0–Q2, Abnormal: Q3–Q5 for participants aged 75 years or above. bNormal: Q0, Abnormal: Q1–Q5 for participants under 75 years; Normal: Q0–Q1, Abnormal: Q2–Q5 for participants over 75 years.
Comparison of sensitivity, specificity, accuracy, and Gwet’s AC2 score: 1) between raters, and 2) between methods (occupancy index and visual assessment) after converting multiple scores to binary scores with disease group
AD, Alzheimer’s disease group; MCI, mild cognitive impairment; CN, cognitive normal group; Sen, Sensitivity; Spec, Specificity; ACC, Accuracy; AC2, Gwet’s AC2 score; MTA, medial temporal atrophy score; GCA-F, global cortical atrophy score of the frontal lobe; PA, posterior atrophy score; HOC, hippocampus occupancy index; TOC, medial temporal lobe occupancy index; FOC, frontal lobe occupancy index; POC, parietal lobe occupancy index.
Comparison of AD subtyping based on radiologists’ score and volume-driven score
Atrophy scores derived from occupancy indices and from radiologists’ rating were used to categorize AD subtypes, as summarized in Table 5 and Fig. 4. The minimal atrophy type was found in fewer participants based on both the radiologists’ and the quantitative scores, with one identification driven by the radiologists and two by the occupancy indices. Furthermore, patients with the minimal atrophy type were younger than those in the cognitively normal control group (59.0±5.7 and 63.0 years). The hippocampal-sparing and typical AD types showed significant age differences, Mini-Mental State Examination scores, and CDR SOB compared with the control group (p < 0.001) in data-driven subtyping results; however, age showed no significant difference in the radiologists-driven results. In the subtyping results from the radiologists, the hippocampal sparing type was older than the typical AD type (p < 0.05). However, there were no significant differences in sex, cognitive type, and apolipoprotein E ɛ4 allele carrier status between the visual and volume scores predicted as reflecting the same subtype.
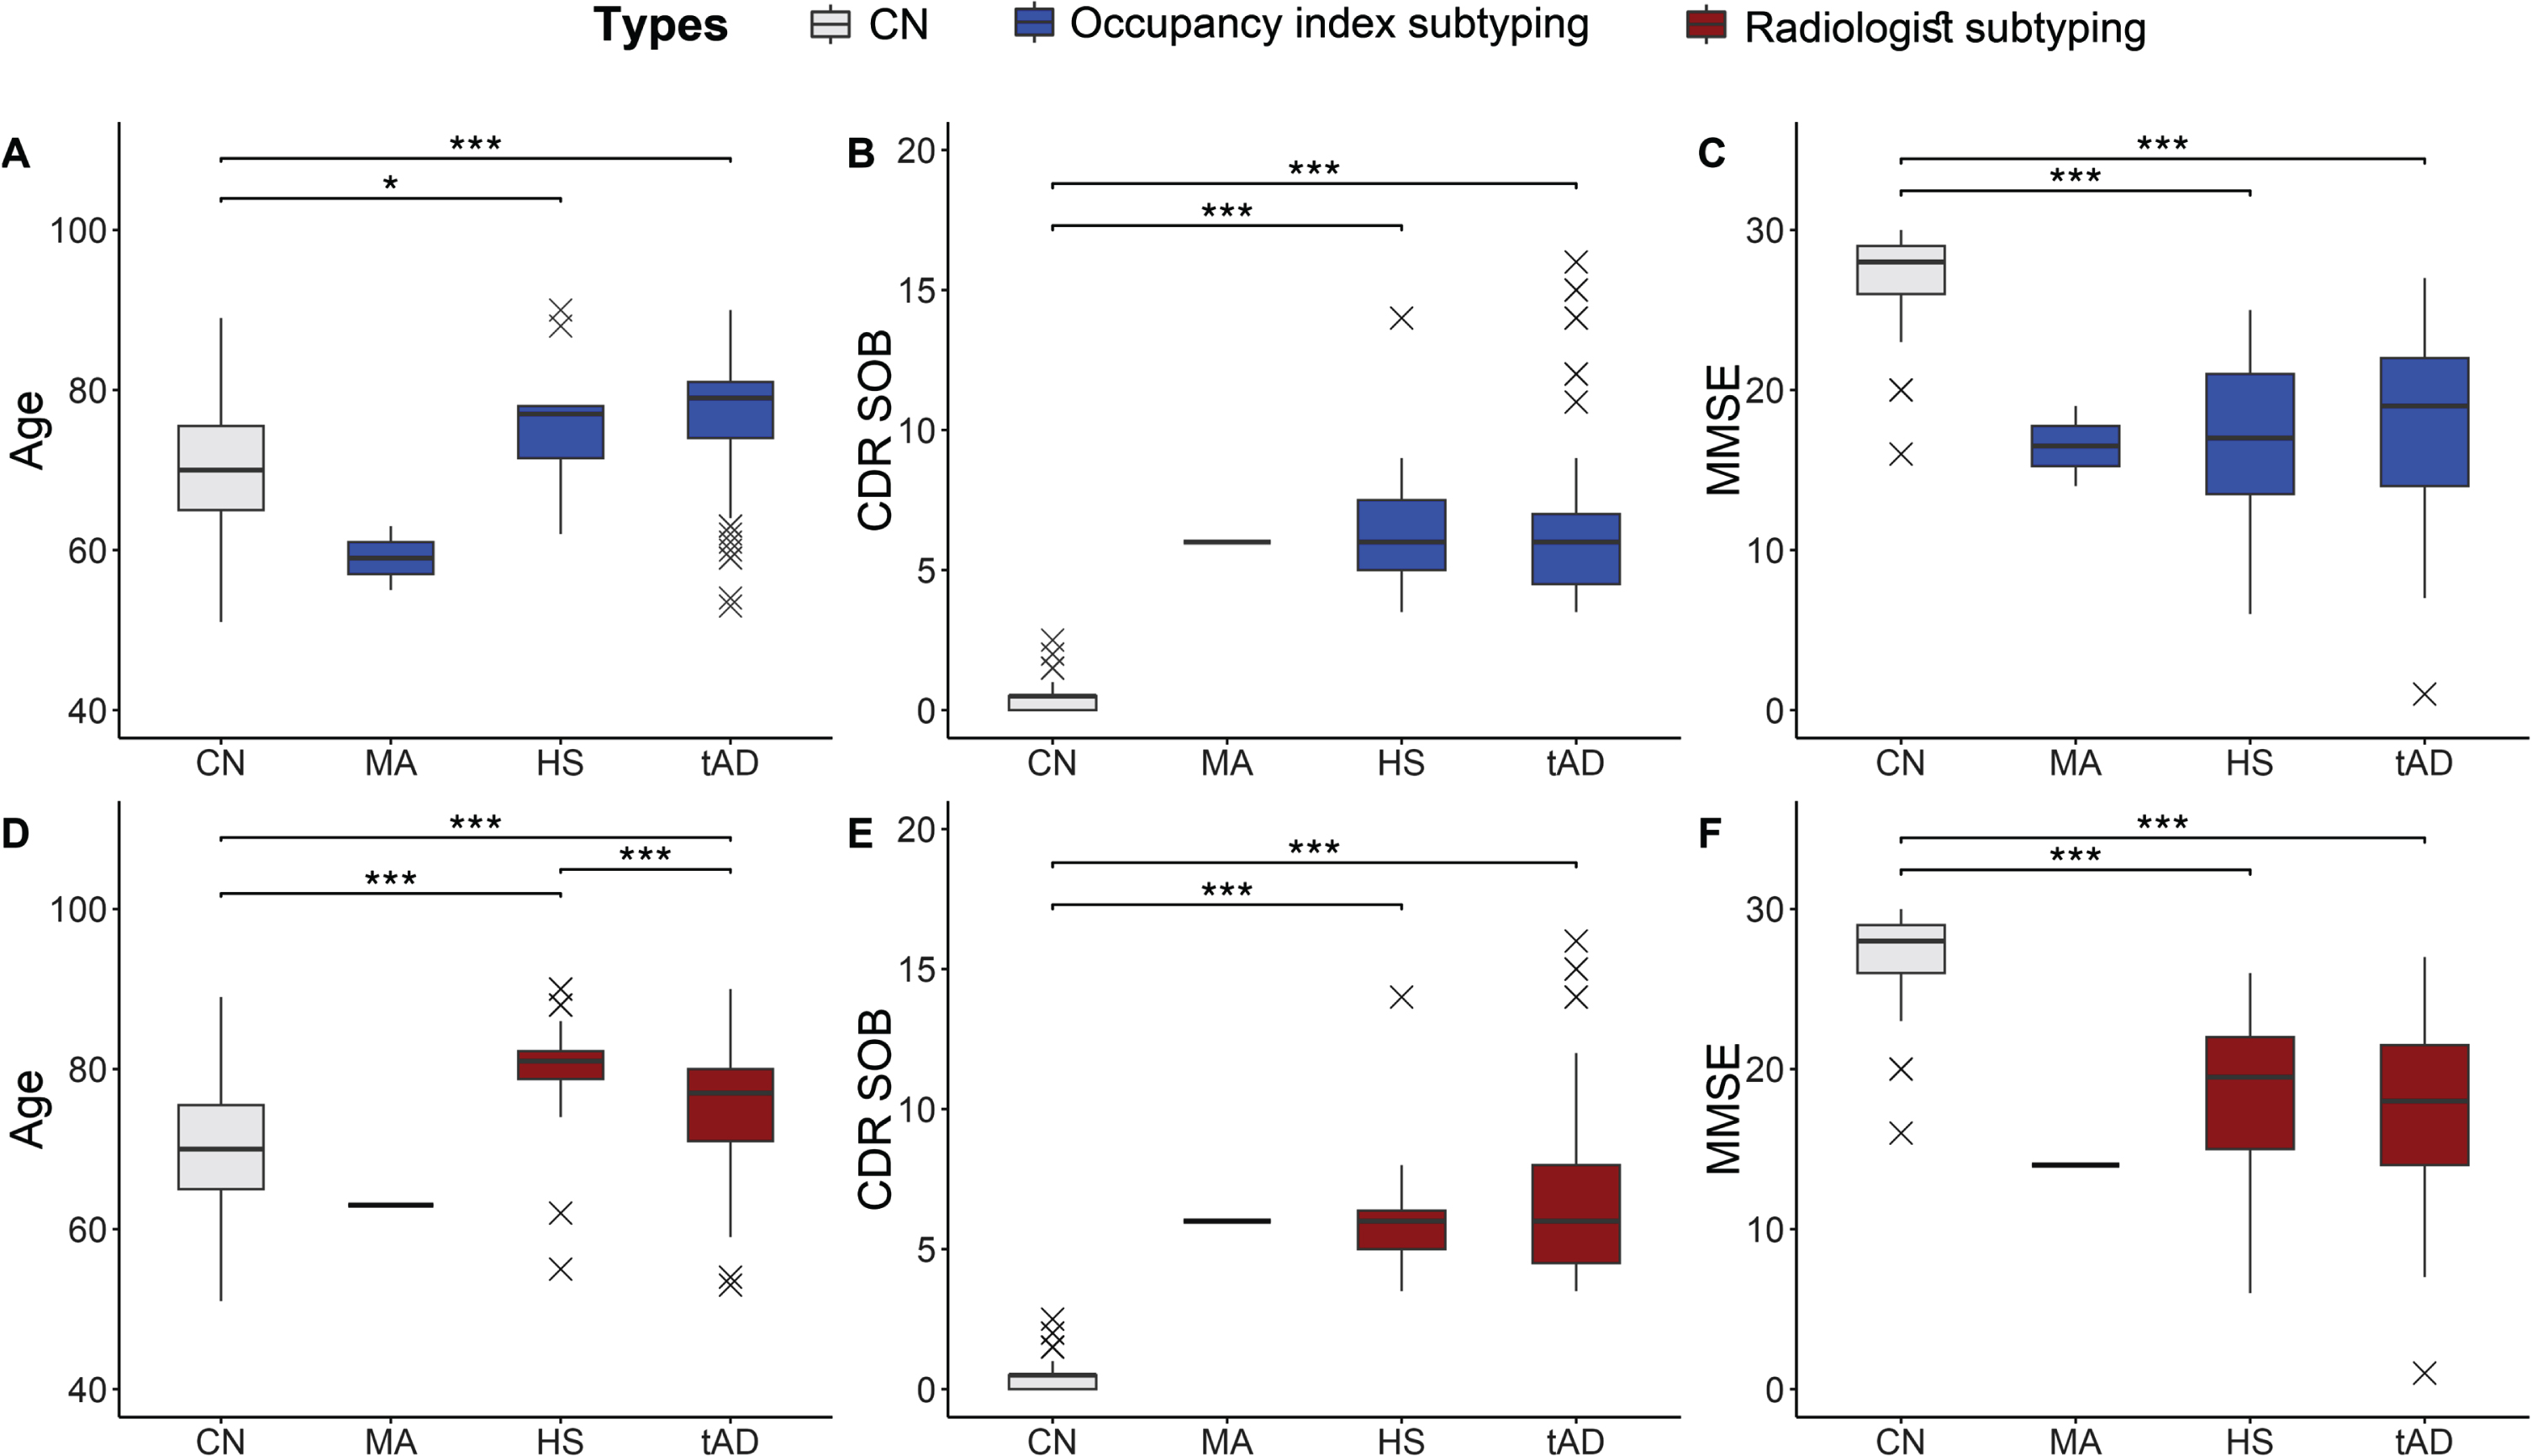
Comparison of Alzheimer’s disease (AD) subtype between visual assessment and automated scores. Age, CDR sum of boxes, and MMSE scores were compared between four AD subtypes based on the quantitative approach (A–C) and visual scoring approach (D–F). Occupancy and subtypes based on radiologists’ assessment exhibit a similar trend for age (A, D), CDR SOB (B, E), and MMSE scores (C, F). The cognitively normal (CN) group is provided as a reference. ***significantly different with p < 0.001. *significantly different with p < 0.05. CN, Cognitive normal; MA, Minimal atrophy; HS, Hippocampal sparing; tAD, Typical Alzheimer’s disease; CDR SOB, Clinical Dementia Rating Score Sum of Boxes.
Comparison of patients’ demographic information according to occupancy index-based atrophy and radiologist visual scores
CN, cognitively normal group; AD, Alzheimer’s disease group; MCI, mild cognitive impairment; M/F, male/female; APOE E4, apolipoprotein E ɛ4 allele; CDR SOB, clinical dementia rating sum of boxes; MMSE, Mini-Mental State Examination; HOC, hippocampus occupancy index; TOC, medial temporal lobe occupancy index; FOC, frontal lobe occupancy index; POC, parietal lobe occupancy index. asignificant difference with CN (p < 0.001).
DISCUSSION
We proposed an automated atrophy scoring scheme based on quantified volumetric information to provide objective and consistent scoring. In this study, our automated atrophy scoring scheme incorporating the inferior lateral ventricle size showed moderate-to-good agreement with the radiologists’ visual ratings and an enhanced correlation with age. Furthermore, we showed that the cutoff value for each atrophy score adjusted by age is better than that without adjustment, because natural aging accompanies brain atrophy to a certain degree. Our validation dataset demonstrated the usefulness of our automated scoring approach in classifying AD subtypes based on MR-driven measurements. In addition, the results of this study demonstrated that the patients in the AD subtypes derived from our automated scoring method share similar demographic characteristics, and that our method shows reasonable classification results as compared to a visual scoring approach.
The highest atrophy scores determined by experts matched well the higher automated atrophy scores, which had lower volumes. The high scores provided by the radiologists consistently correlated with the automated scores, while the low visual scores showed some discrepancy due to the inclusion of high scores from the automated scoring. Although HOC presented slightly lower correspondence against visual scoring, both TOC and HOC, which are based on different ROIs, shared a similar classification pattern and could be used as MTA surrogates, as suggested by previous studies [2, 22].
In general, our automated atrophy scores corresponded well with the radiologists’ scores. Moreover, our atrophy score was not significantly different from the radiologist-driven visual assessment score in each related region, that is, MTA, GCA-F, and PA. This finding supports the hypothesis that volume-driven atrophy scores could provide objective surrogates for radiologists. This is consistent with previous studies reporting a strong correlation between visual scoring and brain measurements (of the cortical thickness and hippocampal volume) when classifying AD subtypes based on atrophy scores [2]. Typical AD showed broad atrophy patterns in the frontal, parietal, and temporal regions, including the hippocampus, while the hippocampal-sparing type showed a statistically significant difference only in hippocampal volume compared to the CN group [2]. Previous AD subtyping using the cortical thinning pattern [46] was also comparable to neuropsychological test results and clinical characteristics. Taken together, these results suggested that brain volume is highly related to cognition and clinical symptoms.
We also showed that an age-specific cutoff value, which was blinded to sex or any other clinical information, could be important in determining the degree of atrophy in the general population. This is because we utilized a large population dataset with ages ranging from 20 to 110 years. Furthermore, an age-specific cutoff value was also implemented using data including the heterogeneous cognitive states of CN, MCI, and AD. We believe that our proposed automated atrophy scoring with the suggested age-specific cutoff value is easily generalizable to a larger population regardless of age, sex, and other clinical information.
Our results indicate that AD subtypes determined by volume-based atrophy scores showed trends similar to those of clinical AD categorized using visual atrophy rating scales. AD subtyping is mostly based on tauopathy and atrophy pattern observations with cognitive functional changes and clinical symptoms. In our study, participants classified in the typical AD type showed more severe atrophy in TOC and HOC than CN participants, compared with other subtypes. Both typical AD types, categorized either automatically or based on radiologists’ assessment, had smaller volumes in the medial temporal lobe and hippocampal region than in the parietal or frontal lobe [47–49]. Furthermore, participants in the hippocampal-sparing type had a younger age distribution than typical AD participants [50]. This finding was similar to that for the clinical characteristics of traditional AD subtypes and suggests that contiguous AD subtypes related only to brain volume could be applicable without other clinical criteria.
Visual assessment may be labor-intensive with large inter- and intra-rater variations. In particular, the challenge of reliable visual scoring of minimal-to-moderate atrophy scores causes low inter-rater correspondence. In our dataset, the visual scoring results from two neuroradiologists showed moderate agreement. To incorporate more consistent visual scoring into our automated scoring system, we sought to derive consensus scoring results from the two radiologists. The final visual score was converted into a binary score. There is a high correlation between the concordance visual score and our data-driven atrophy score without any agreement. This implies that atrophy scoring with visual assessment requires a high ability from individual radiologists, and the automated volumetric score could support radiologists with adequate reliability.
Compared with PET, MRI has several advantages as it is inexpensive and does not require radiation exposure. In addition to tauopathy and neurodegeneration, a variety of biomarkers in AD are systematically connected, and studies of MR biomarkers need to be developed [51–55].
Limitations
One limitation of this study lies in the use of MR-based measurements for AD classification. MR-based atrophy features could only be used for assessing the present situation or very-near future, but not for early detection or for prevention. The AD subtyping introduced in this study could be useful for categorizing participants with advanced disease status, such as late MCI and AD. In addition, our study had small sample sizes to validate the subtyping results from MR-based automated atrophy scoring. Our validation data only included three types (hippocampal-sparing, minimal atrophy, and typical AD) and did not include the limbic-predominant type, which was suggested to also exist by the MRI-based measurements [2, 46]. There were also only one or two participants with minimal atrophy at younger ages. Furthermore, disease progression or severity, two of the most important features in AD, could not be assessed due to the absence of longitudinal or amyloidosis and tauopathy datasets. Comparison with conventional biomarkers, namely CSF amyloid-β, p-tau, and t-tau levels, and amyloid, tau, and FDG PET, should be pursued in future studies. Age-specific cutoff values were comprehensively considered using large-scale data from previous studies [21, 56–58], which were heterogeneous. In previous studies, age thresholds for the MTA score were considered at 75 or 80 years [22, 57]; however, Korean [21] and Chinese [58] studies described younger and more precise age ranges. In particular, the government’s public health policy on dementia in Korea was systematically implemented in 2008 [59] based on the prominent public health care system [60] that could affect the careful observation of clinicians and the attention of elderly people. Of course, changes in brain volume could be affected by differences in race or environment, and future studies should compare more diverse populations. Finally, only two radiologists undertook the visual assessment, and there were several difficulties, including the high time cost, cumbersome visual assessment task in each region and across scales, and the uncertainty among radiologists.
CONCLUSION
This study suggested that our new automated atrophy scoring system could offer comparable results to those obtained from human raters with multiple and binary scores in the medial temporal, parietal, and frontal lobes. In the future, an AD subtype study could be conducted using a larger number of population datasets.
AUTHOR CONTRIBUTIONS
Yeong Sim Choe (Conceptualization; Data curation; Formal analysis; Investigation; Methodology; Validation; Visualization; Writing – original draft); Regina E.Y. Kim (Conceptualization; Formal analysis; Investigation; Methodology; Project administration; Validation; Visualization; Writing – original draft; Writing – review & editing); Hye Weon Kim (Investigation; Writing – original draft; Writing – review & editing); JeeYoung Kim (Conceptualization; Data curation; Methodology; Resources; Validation); Hyunji Lee (Formal analysis; Investigation; Methodology; Writing – original draft); Min Kyoung Lee (Data curation; Investigation; Resources); Minho Lee (Resources; Software); Keun You Kim (Data curation; Investigation; Resources); Se-Hong Kim (Resources); Ji-hoon Kim (Resources); Jun-Young Lee (Project administration; Resources); Eosu Kim (Project administration; Resources); Donghyeon Kim (Funding acquisition; Project administration; Software; Supervision); Hyun Kook Lim (Funding acquisition; Project administration; Resources; Supervision).
Footnotes
ACKNOWLEDGMENTS
We would like to thank our colleagues at Neurophet Inc. for their feedback and support throughout the research process.
FUNDING
This research was supported by the Korea Health Technology R& D Project through the Korea Health Industry Development Institute (KHIDI) and the Korea Dementia Research Center (KDRC), funded by the Ministry of Health & Welfare and the Ministry of Science and ICT, Republic of Korea (grant number: HU20C0315).
CONFLICT OF INTEREST
This article utilized the segmentation tool, AQUA developed by Neurophet Research Institute, Inc., Seoul, South Korea. Y.S.C, R.E.K, H.W.K, H.L, M.L, D.K, and H.K.L are employees of Neurophet Inc. All other authors have no conflict of interest to report.
DATA AVAILABILITY
The data supporting the findings of this study are available on request from the corresponding author. The data are not publicly available due to privacy or ethical restrictions.