
Abstract
Background:
A carbohydrate-restricted diet aimed at lowering insulin levels has the potential to slow Alzheimer’s disease (AD). Restricting carbohydrate consumption reduces insulin resistance, which could improve glucose uptake and neural health. A hallmark feature of AD is widespread cortical thinning; however, no study has demonstrated that lower net carbohydrate (nCHO) intake is linked to attenuated cortical atrophy in patients with AD and confirmed amyloidosis.
Objective:
We tested the hypothesis that individuals with AD and confirmed amyloid burden eating a carbohydrate-restricted diet have thicker cortex than those eating a moderate-to-high carbohydrate diet.
Methods:
A total of 31 patients (mean age 71.4±7.0 years) with AD and confirmed amyloid burden were divided into two groups based on a 130 g/day nCHO cutoff. Cortical thickness was estimated from T1-weighted MRI using FreeSurfer. Cortical surface analyses were corrected for multiple comparisons using cluster-wise probability. We assessed group differences using a two-tailed two-independent sample t-test. Linear regression analyses using nCHO as a continuous variable, accounting for confounders, were also conducted.
Results:
The lower nCHO group had significantly thicker cortex within somatomotor and visual networks. Linear regression analysis revealed that lower nCHO intake levels had a significant association with cortical thickness within the frontoparietal, cingulo-opercular, and visual networks.
Conclusions:
Restricting carbohydrates may be associated with reduced atrophy in patients with AD. Lowering nCHO to under 130 g/day would allow patients to follow the well-validated MIND diet while benefiting from lower insulin levels.
Keywords
INTRODUCTION
Due to a lack of effective pharmacological treatments for Alzheimer’s disease (AD), patients at risk for AD and those with cognitive impairment (CI) are seeking non-pharmacological approaches to reduce symptoms and disease progression. There is significant evidence from epidemiological studies that diet can protect against cognitive decline and neurodegeneration [1–6].
The rationale behind restricting carbohydrate intake in patients with CI is to reduce insulin levels. Brain cells rely on the insulin signaling through insulin receptors to transport and metabolize glucose [7, 8]. Cerebral glucose hypometabolism, an early sign of AD-related etiology, is linked to insulin resistance, which increases with age and is prevalent in AD [9, 10]. AD and type 2 diabetes have shared, underlying molecular mechanisms such as impaired insulin signaling and mitochondrial dysfunction [11, 12]. Both are strongly associated with cognitive decline [13] and lead to amyloid-β (Aβ) and neurofibrillary tangle formation [14]. Lowering blood glucose and insulin levels may also facilitate the clearance of Aβ peptides [15], which form plaques that disrupt brain cell signaling [10, 16].
Individuals consuming a carbohydrate-restricted diet may experience lower levels of insulin resistance compared to older adults who eat the standard American diet, which typically consists of 900 calories (225 g) from carbohydrate intake per day in a 2000 calorie diet, as reported by the National Center for Health Statistics [17]. This level of carbohydrate intake would be considered moderate. In contrast, intake of approximately 100–130 g of net carbohydrates (nCHO), or total carbohydrate intake minus fiber intake per day [18] would be considered within the low nCHO range. Evidence from a randomized controlled trial (RCT) conducted at Framingham State University showed that that a carbohydrate-restricted diet led to lowered insulin secretion and improved insulin resistance in adults [19]. Additionally, a recent meta-analysis of twenty-three trials studying the efficacy of a carbohydrate-restricted diet on type 2 diabetes found that patients had higher rates of remission when eating a carbohydrate-restricted diet (defined as < 130 g/day) [20]. There is little research on the effects of nCHO intake on brain atrophy. A recent study found that higher carbohydrate intake was associated with thinner cortex within the medial temporal lobe [21]. However, there are no RCTs registered on clinicaltrials.gov or peer-reviewed publications researching carbohydrate-restricted diets with this threshold in patients with AD or with confirmed AD-related neuropathology.
Adherence to Mediterranean-style (MeDi) and MIND diets, rich in nutrient-dense carbohydrates like whole grains, fruits, and vegetables, is linked with improved cognitive [22, 23] and neurodegenerative outcomes [5, 22]. A 100–130 g nCHO cutoff allows individuals to follow MIND diet guidelines, and incorporates well into a carbohydrate-restricted nutrition program.
The goal of this small sample, observational study is to explore the neurological benefits of a carbohydrate-restricted diet in a cross-section of patients with AD and confirmed amyloid burden. In this study, we defined the threshold for a carbohydrate-restricted diet as less than 130 g nCHO/day [22]. This particular cutoff was selected based on evidence from the diabetes and obesity literature, which indicates that maintaining carbohydrate intake below this level effectively reduces insulin resistance [19, 25]. Additionally, research in older adults indicates that insulin resistance is associated with cortical thickness and is likely one of the earliest modifiable risk factors for AD [6]. We hypothesized that participants with a history of eating lower nCHO levels would have thicker cerebral cortices compared to those with higher nCHO intake. Widespread cortical thinning is a hallmark neurological feature of AD [26], and we expected to find preservation of cortical gray matter in the lower nCHO group, especially within brain regions commonly associated with AD [27–30], particularly within the default mode [31] and dorsal attention networks [32, 33], which are functionally impaired in AD. Understanding the impact of diet on gray matter is important because AD-associated cortical atrophy is linked to clinical symptoms of AD such as aphasia and dementia [27–30].
MATERIALS AND METHODS
Participants
All participants evaluated in this study were recruited as part of a larger study detailed in recent work using the inclusion/exclusion criteria detailed in [34]. Study approval was obtained from the WIRB-Copernicus Group Institutional Review Board (WCG® IRB) (Protocol # 20190583) with informed consent obtained from each of the participants. This research was conducted in accordance with the Helsinki Declaration of 1975. Eligibility criteria include: aged at least 50 years old, FAST [35] Stage 2–4 (subjective cognitive decline (SCD), MCI or early AD no functional impairment, amyloid positivity, English fluency, possess and ability to operate a computer, ability to converse with a coach telephonically, normal or corrected visual and hearing acuity, answers “no” to all items of the PAR-Q+ [36] or provides physician clearance to participate in a moderately intensive exercise program. Exclusion criteria: non-AD neurodegenerative disorder (e.g., Lewy body dementia, frontotemporal dementia), existing diagnosis of cerebrovascular disease as the primary cause of cognitive impairment, participant or immediate family members with known AD mutation in the PSEN or APP genes, MMSE below 19 or Clinical Dementia Rating Scale > 2, as evidenced in their patient medical history.
Screening of individuals for the study for biomarker evidence of Alzheimer’s disease [37] was done by either PET imaging with Florbetapir (18F) [38] or CSF amyloid [39]. Briefly, 42 individuals were evaluated at the Pacific Brain Health Center (PBHC), located in Santa Monica, California at Providence St. John’s Health Center as part of a larger clinical trial [34]. PBHC promotes healthy brain aging through a combination of multidisciplinary team medical management and patient education encouraging a healthy lifestyle. All individuals enrolled in the study prior to our data freeze (June 1, 2022) were included if they provided a Food Frequency Questionnaire (FFQ) and received T1-weighted structural magnetic resonance imaging (sMRI). Two participants were excluded due to having contraindications for receiving sMRI. We excluded 9 participants because they were unable to complete their FFQ. A total of 31 participants were analyzed for this study.
Participants or their care partners provided a detailed medical history along with demographic information, including sex, date of birth, handedness, ethnicity, and race. See Table 1 for participant demographics. Medical history was confirmed through manual review of patient medical records through an Electronic Medical Record (EMR) system.
Demographic, clinical, and lifestyle characteristics
Group differences are indicated by p values from two-tailed t-tests for numerical variables and chi-squared tests for categorical variables. Carbohydrate intake groups are based on Food Frequency Questionnaires (FFQ) scored using the FFQ EPIC Tool for Analysis (FETA). nCHO, estimated daily carbohydrate intake (g) –estimated daily fiber intake (g); Lower nCHO group, intake of ≤130 g; Higher nCHO group, intake of > 130 g; CAC, coronary artery calcification; % 10-y risk, risk of coronary heart disease; kcal, estimated daily kilocalorie intake. METs are collected using the International Physical Activity Questionnaire. A MET-minute is computed by multiplying the MET score by the minutes performed.
Clinical characteristics
Clinical blood labs were conducted on all participants [34]. Cardiovascular risk was calculated using the Multi-Ethnic Study of Atherosclerosis (MESA) 10-year coronary heart disease risk [40–42], without coronary artery calcification (https://github.com/vcastro). The Functional Assessment Staging Tool for Dementia (FAST), also known as the Reisberg Functional Assessment Staging Scale, was assessed by a study clinician [35]. Apolipoprotein (APOE) genotype was assessed in 28 participants. Additionally, we collected height and weight. From these measures, body mass index (BMI) in kg/m2 was calculated in all individuals. Insulin sensitivity was calculated using the Quantitative Insulin Sensitivity Check Index (QUICKI) in 27 participants [43]. See Table 1 for detailed clinical characteristics.
Lifestyle information
Lifestyle information including diet and physical activity were collected with the assistance of care partners as needed. In instances where patients experienced minor memory complaints, they independently completed the assessments. If a patient was unable to provide questionnaire responses and lacked a care partner who could supply their lifestyle information, those data were not collected. It should be noted that these assessments primarily captured recent habits rather than lifetime behaviors, thereby limiting the ability to establish typical behaviors prior to the onset of the disease. A FFQ adapted by the University of Cambridge for the EPIC (European Prospective Investigation into Cancer) Norfolk study [44] was collected to assess diet. This version of the FFQ utilizes food list items derived from an FFQ used widely in the United States [45, 46]. To complete an FFQ, individuals describe their typical diet over the past year by reporting on the frequency and sometimes portion size of a variety of food and beverage items based on a context-specific food list. For example, patients were asked about the number of medium servings of bacon they consumed on average over the past year. They were provided with several frequency options to choose from, including, but not limited to, the following: never or less than once per month, 1–3 per month, 5–6 per week, and 2–3 per day. Estimated daily total carbohydrate, fiber, and calorie intake were computed using FFQ data as input to the validated FFQ EPIC Tool for Analysis (FETA) [47]. The following formula was used to calculate nCHO intake:
International Physical Activity Questionnaire (IPAQ), which estimates Metabolic Equivalent of Task (MET-min/week) for the past week from a series of questions related to an individual’s level of low, moderate, and high intensity physical activity [36, 48] was completed by 27 of these participants (see Table 1 for lifestyle measures).
Neurocognitive measures
The neurocognitive assessment battery was previously described [34]. Global cognitive assessment was collected using the Montreal Cognitive Assessment (MoCA) [49].
Quantitative magnetic resonance imaging
Brain MRI scans were done on a 3T General Electric Discovery MR 750 Scanner. Acquisitions included a T1-weighted fast spoiled gradient echo (FSPGR) scan. Scan parameters were as follows: repetition time, 7.91 ms; echo time, 2.96 ms, flip angle, 8°; field of view, 240×240; image voxel size, 1×1×1 mm; acquisition time, 2.53 min.
Cortical reconstruction was performed using the FreeSurfer image analysis suite (https://surfer.nmr.mgh.harvard.edu/) [50–62]. Briefly, this processing included motion correction [61], removal of non-brain tissue using a hybrid watershed/surface deformation procedure [60], automated Talairach transformation, segmentation of the subcortical white matter and deep gray matter volumetric structures [55, 56], intensity normalization [63], tessellation of the gray matter white matter boundary, automated topology correction [54, 64], and surface deformation following intensity gradients to optimally place the gray/white and gray/cerebrospinal fluid borders [50, 53].
Cortical models were followed by surface inflation [52], registration to a spherical atlas which was based on individual cortical folding patterns to match cortical geometry across subjects [57], and creation of surface-based maps of cortical thickness. Procedures for the measurement of cortical thickness have been validated against histological analysis [65] and manual measurements [66,67, 66,67]. FreeSurfer morphometric procedures have been demonstrated to show good test-retest reliability across scanner manufacturers and across field strengths [58,62, 58,62].
Statistical analysis
We divided our participants in two groups based on the average daily number of nCHO, where the lower nCHO group consumed nCHO < 130 g and the higher nCHO group reported eating nCHO ≥ 130 g [18]. Study data were collected and managed using Research Electronic Data Capture (REDCap) tools hosted at Providence Health & Services [68]. All statistical analyses were conducted within SYSTAT 13 [69].
Prior to analyses, data were inspected for outliers and homogeneity of variance to ensure appropriateness of parametric statistical tests. Lower and higher nCHO groups were compared on demographics, clinical characteristics, and lifestyle measures using a two-tailed two-sample t-test or a χ2 test, where appropriate, with an alpha level of 0.05. We also assessed the relationship between common confounders (age and sex), our primary independent variable (nCHO), and our dependent variable (mean cortical thickness) with an alpha level of 0.10.
All cortical surface-based analyses were conducted within the FreeSurfer statistical software package. Analyses looking at the differences between our two groups were conducted using a two-tailed two-independent sample t-test with a voxel-wise alpha level of 0.05 (uncorrected) and cluster-wise probability (CWP) correction for multiple comparisons of 0.05. We also conducted a secondary cortical surface-based analysis evaluating the linear association between nCHO intake, as a continuous variable, and cortical thickness controlling for age at an alpha level of 0.05 (for both voxel-wise and CWP).
Significant clusters obtained from FreeSurfer results were further analyzed using SYSTAT 13 [69]. Cortical thickness of the clusters resulting from primary analysis were examined with respect to nCHO group, controlling for age, sex, education, and BMI. Cortical thickness of the clusters resulting from secondary analysis were examined with respect to continuous nCHO intake, controlling for same covariates. These additional linear regression models were conducted to ensure that the observed findings were not caused by common confounders.
RESULTS
Participants
See Table 1 for participant demographics and clinical and lifestyle characteristics. Of the 31 participants, 58% (18) were classified into the lower and 42% (13) into the higher nCHO group. We found no significant or trend differences between groups in demographic, clinical, or lifestyle characteristics (average daily kcal consumption or weekly activity level). Mean cortical gray matter thickness was not associated with age (β= –0.06, SE = 0.003, t = –0.25, p = 0.8) or sex (β= –0.06, SE = 0.04, t = –0.31, p = 0.8). Continuous nCHO showed a trend association with age (β= 0.31, SE = 1.66, t = 1.73, p = 0.095) but not sex (β= –0.09, SE = 24.09, t = –0.50, p = 0.6).
Quantitative image analysis
There was a significant effect after CWP correction of nCHO group on cortical thickness within primary and secondary visual and somatomotor networks (Fig. 1). Specifically, we found significant clusters included voxels from primary sensory cortex (1, 2, 3a, 3b), primary motor cortex, area 5 m, primary visual cortex (V1), second, third, and sixth visual areas (V2, V3, V6), and the dorsal transitional visual area (DVT), with cluster peaks located in primary motor (mean difference = 0.266 mm2; Cohen’s d = 2.1; CWP = 0.001; cluster size = 1343 mm2) and secondary visual cortices (mean difference = 0.188 mm2; Cohen’s d = 1.65; CWP = 0.005; cluster size = 1154 mm2). Results within these clusters remained significant after controlling for age, sex, education, and BMI (p < 0.0001).
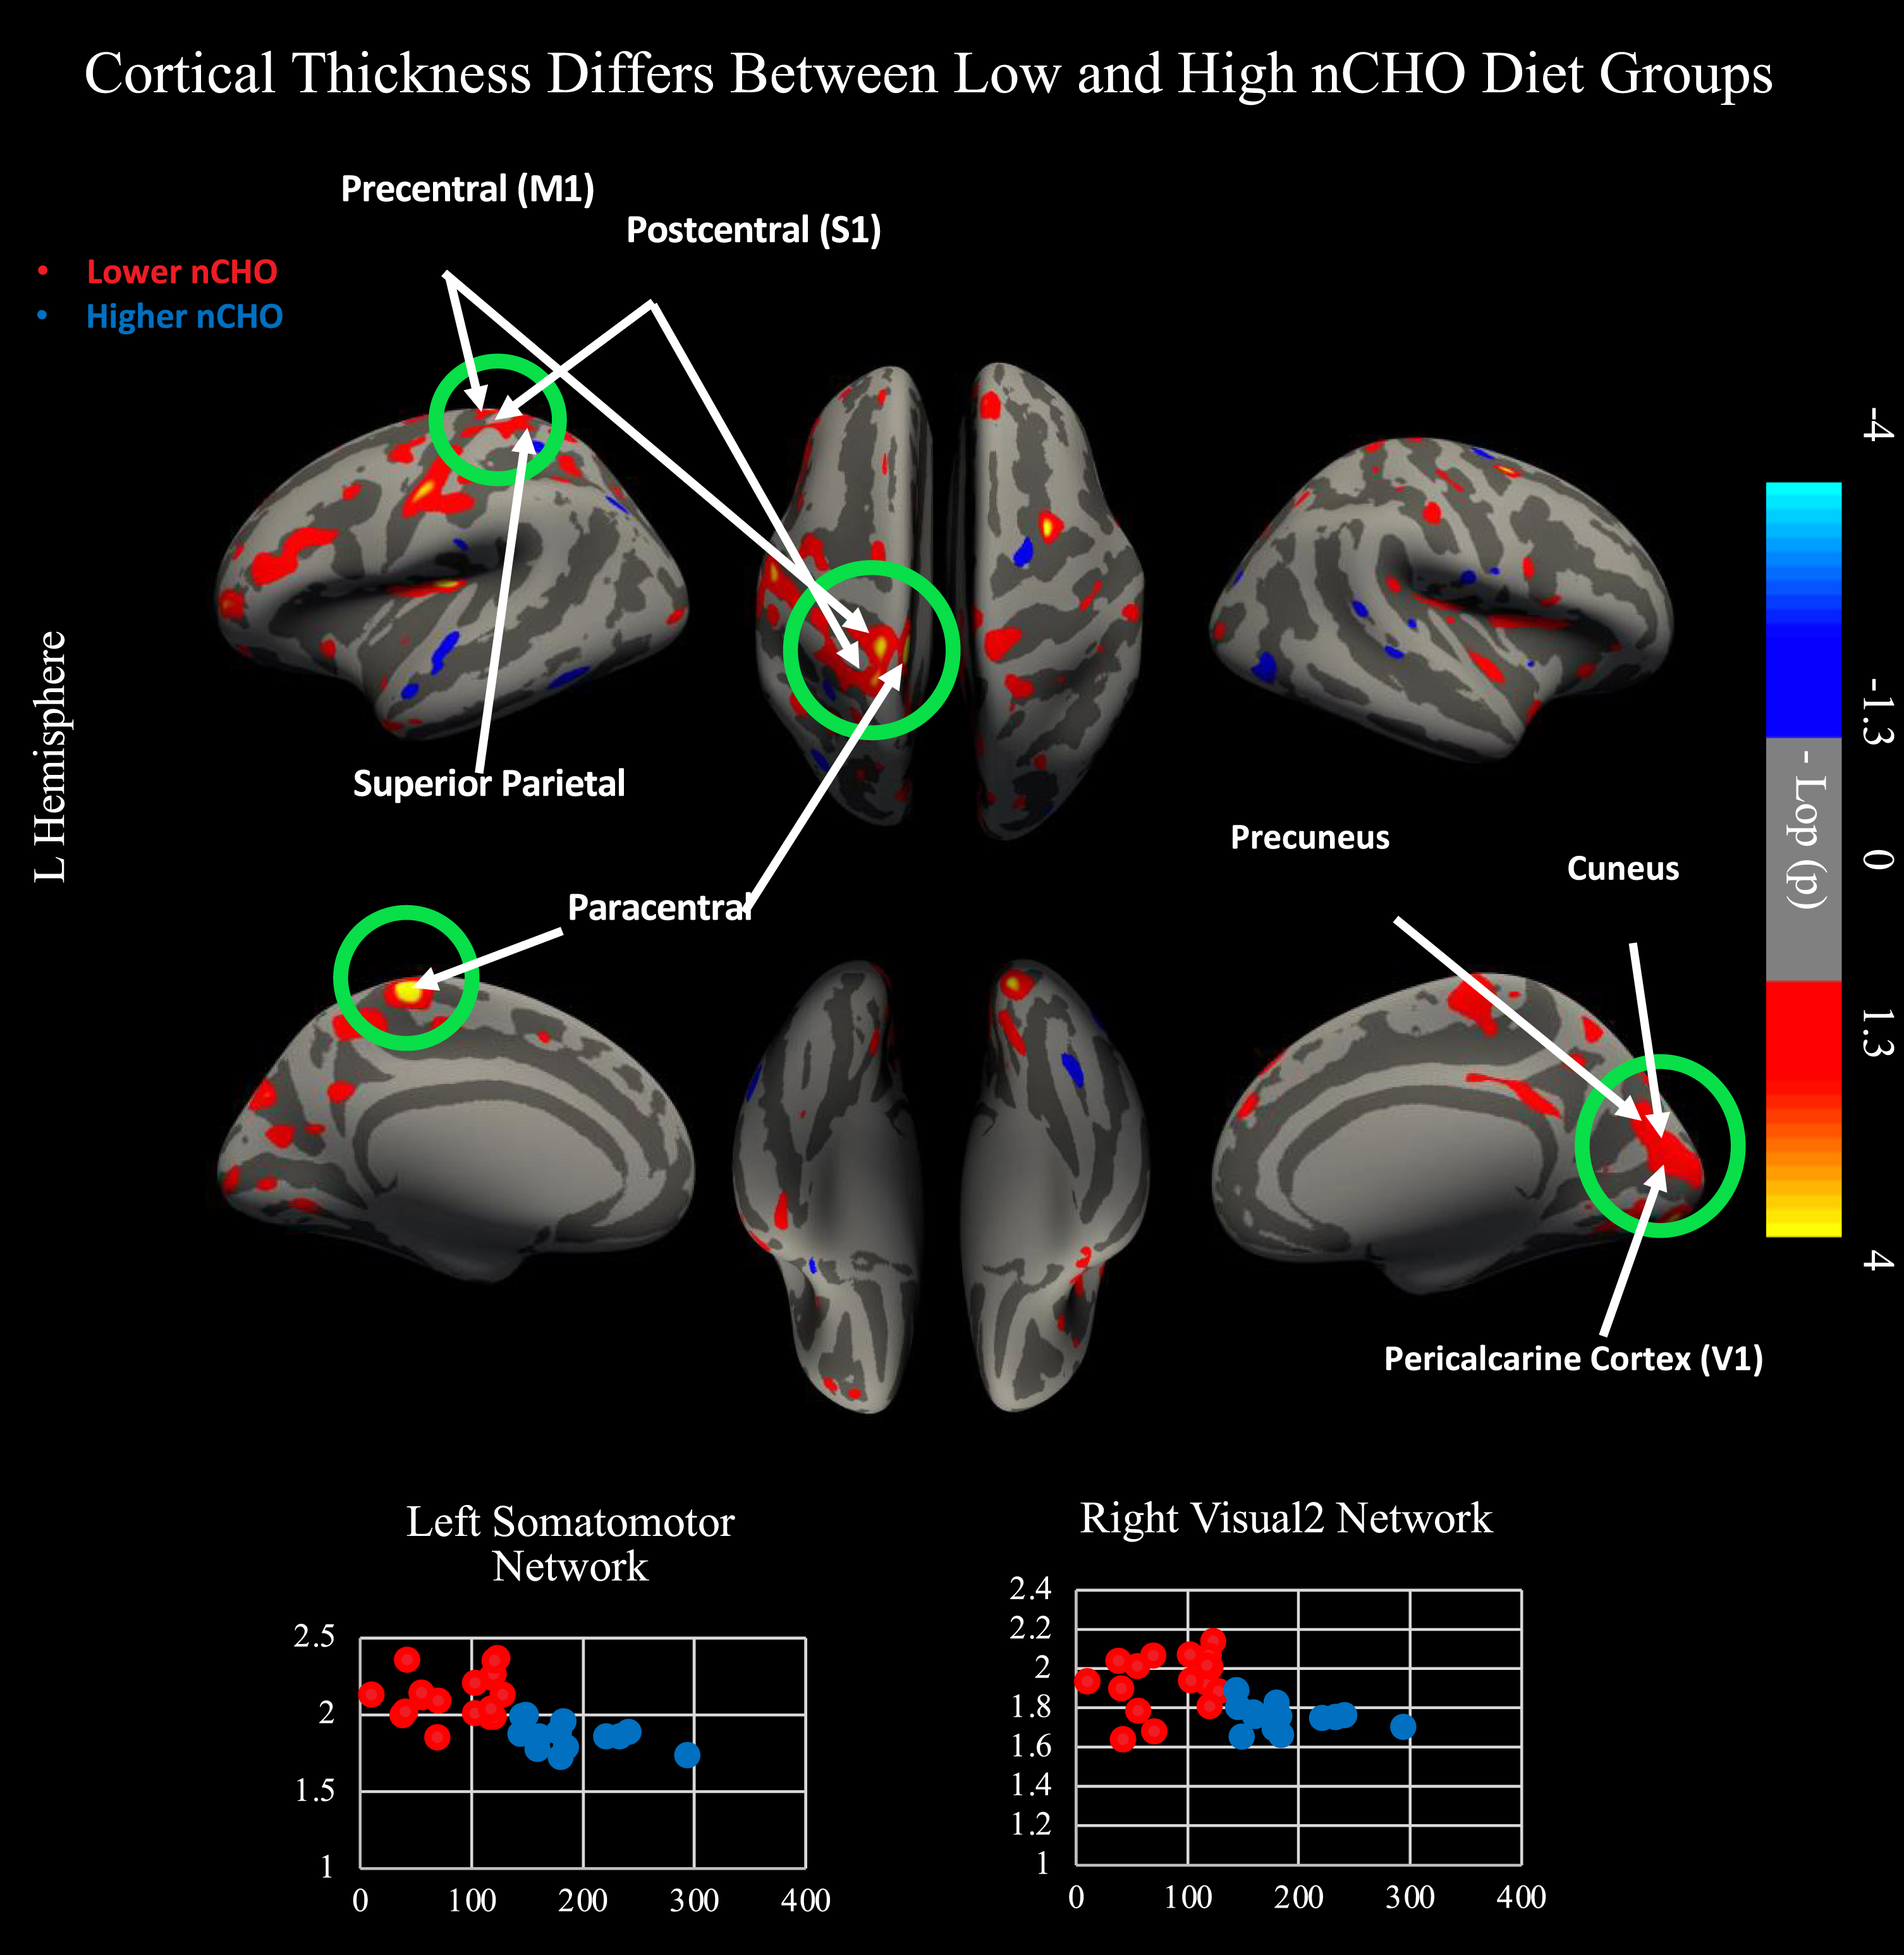
Results from two independent sample, two-tailed t-test comparing lower - higher net carbohydrate (nCHO) diet groups. Top of figure shows results from cortical surface analysis. Green circles indicate regions that survived correction for multiple comparisons using CWP <0.05. White arrows point to highlighted anatomical regions. Warmer colors represent voxels with significantly thicker cortex in the lower than higher nCHO diet group. Bottom of figure contains scatterplots displaying results extracted from the peak voxel in the network indicated. Lower nCHO individuals are plotted in red. Higher nCHO individuals are plotted in blue. Regions plotted include the left primary motor cortex (4) within the somatomotor network and V2 within the right secondary visual network. Regions significant after CWP correction include primary sensory cortex (1, 2, 3a, 3b), primary motor cortex, area 5 m, primary visual cortex (V1), second, third, and sixth visual areas (V2, V3, V6), and the dorsal transitional visual area (DVT). Network and regional definitions were taken from the Human Connectome Project Multi-Modal Parcellation (HCP-MMP) Atlas.
Uncorrected findings showed that individuals in the lower nCHO group had a pattern of generally thicker cortex than those eating a higher nCHO diet (Figs. 1 2). These results included expected differences between groups in regions commonly associated with AD [27–30,32,33, 27–30,32,33] including parietal, frontal, visual, and lateral temporal cortices including the default mode and dorsal attention networks.
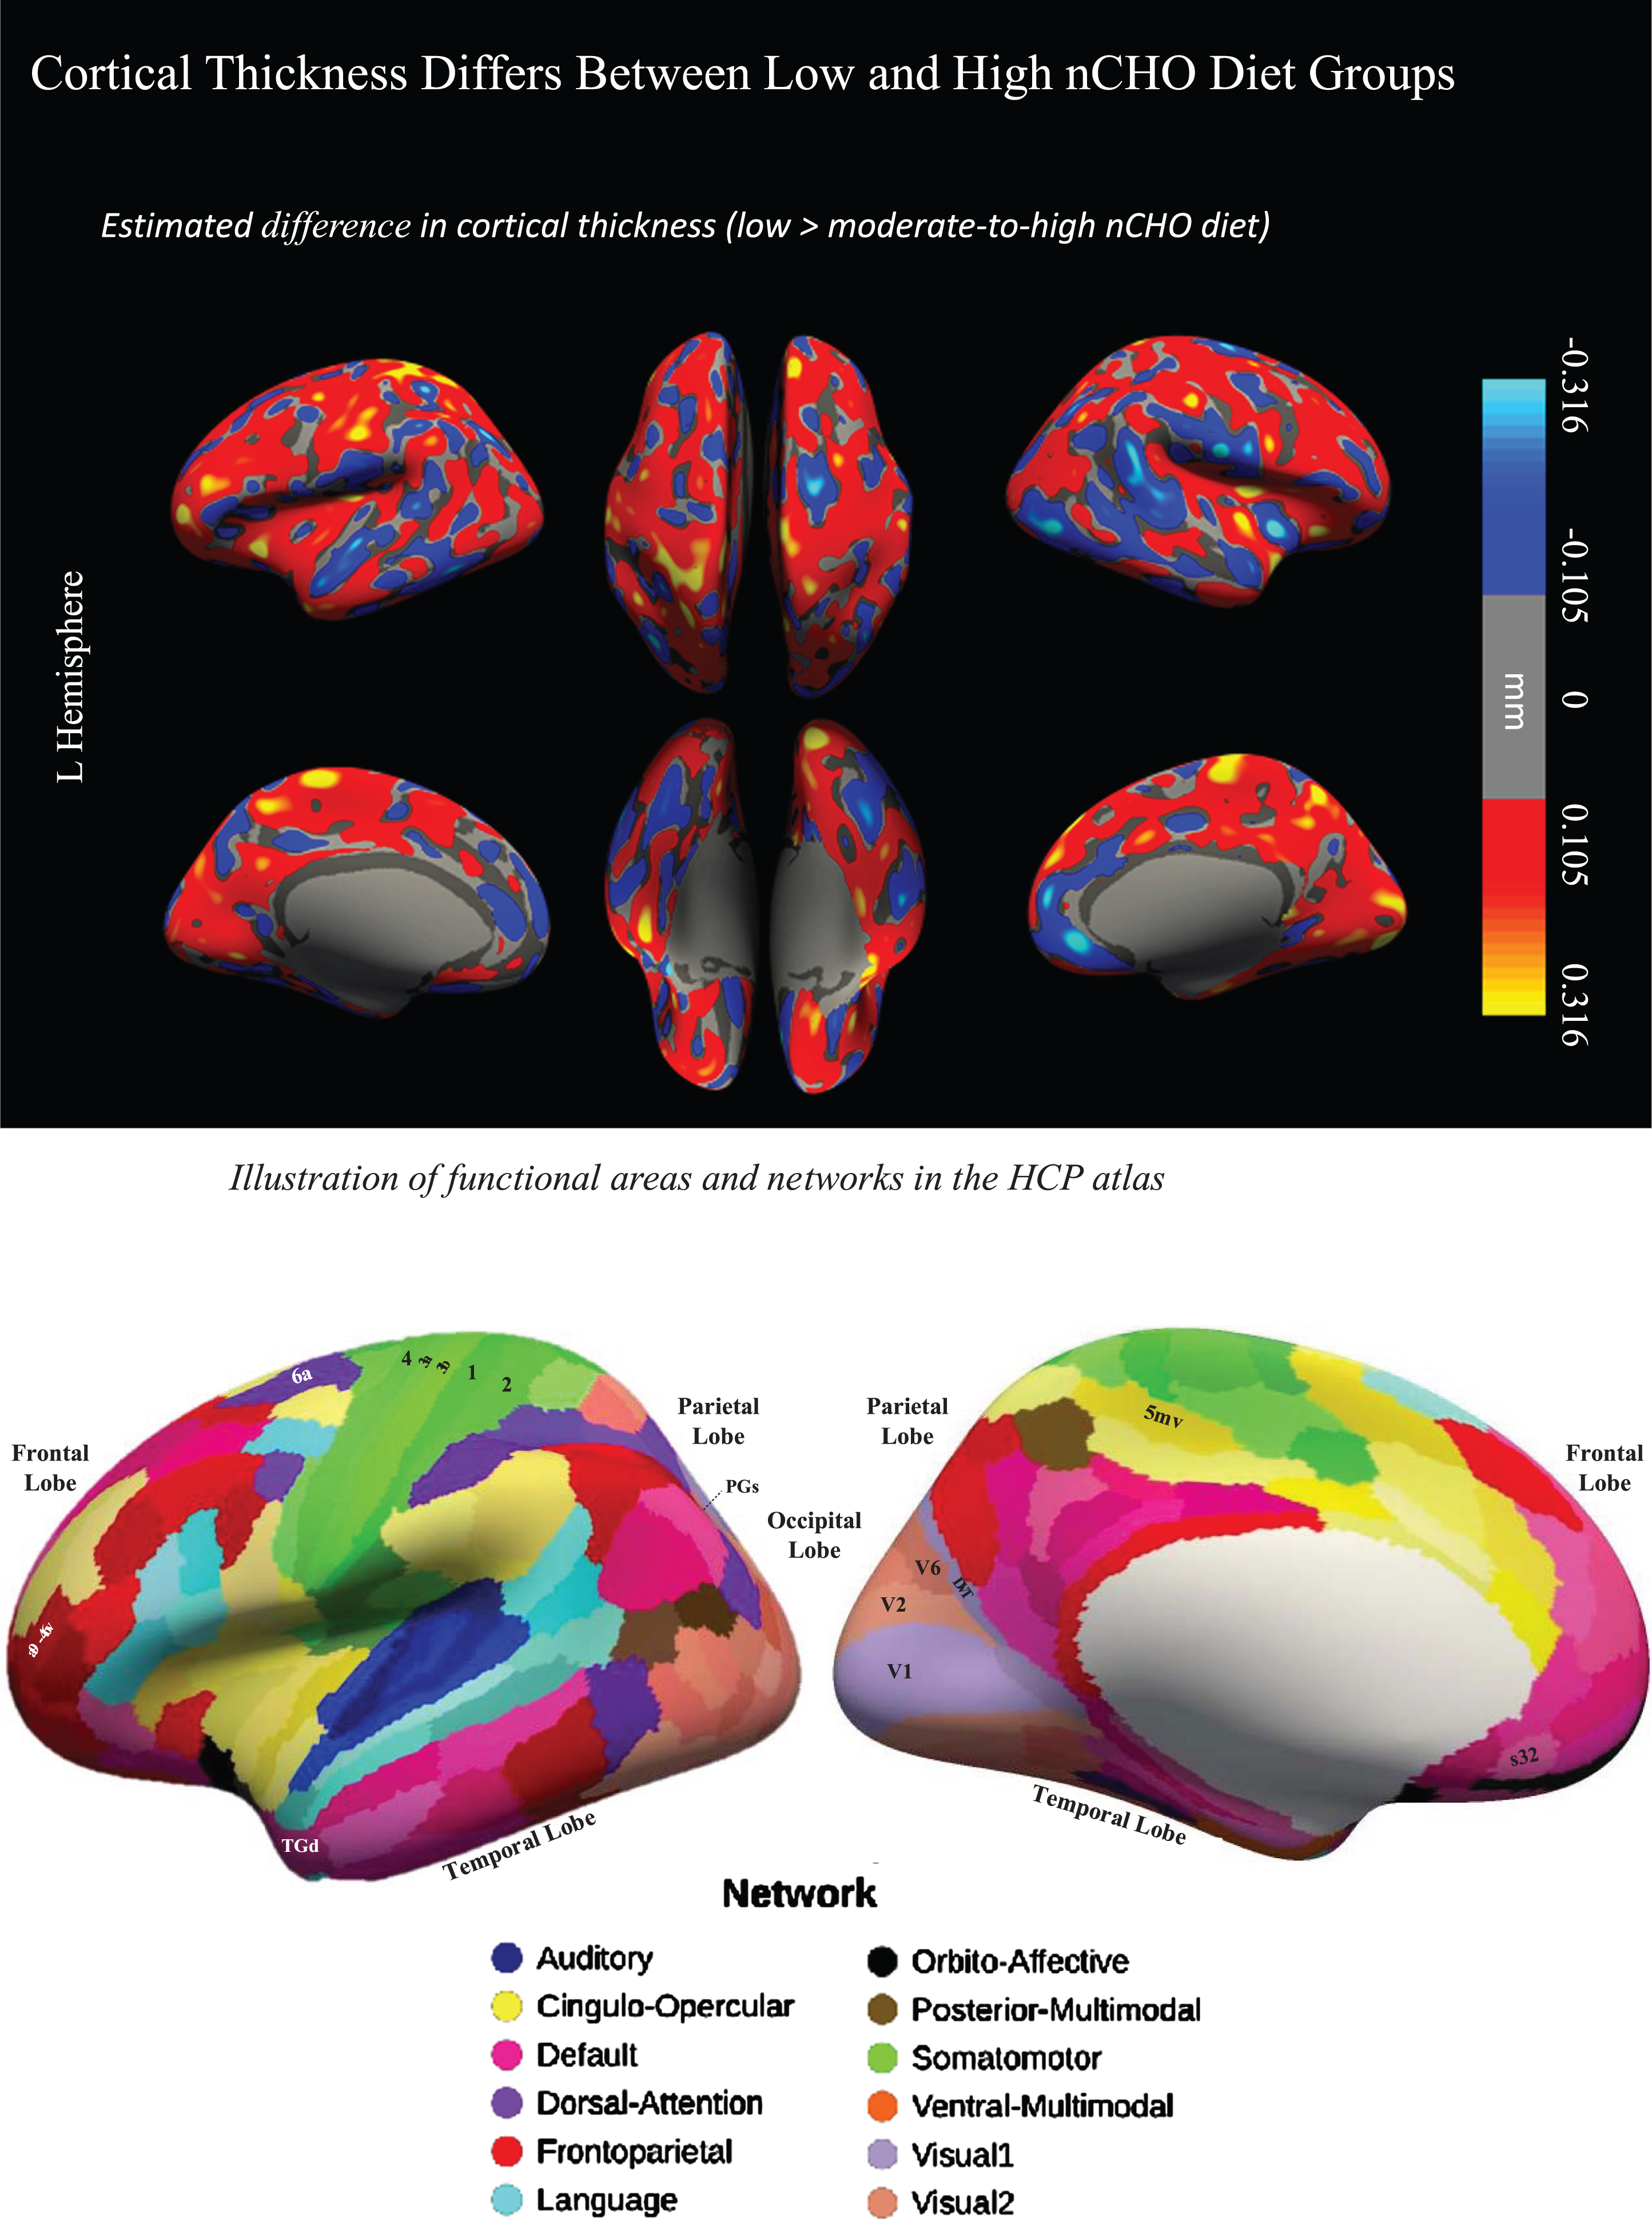
Difference in cortical thickness between lower –higher nCHO diet groups and anatomical reference. Top of figure shows the cortical surface-wide map of the difference in cortical thickness between lower and higher nCHO diet groups. Warmer colors represent voxels with larger thickness in the lower than higher nCHO diet group. Cooler colors represent voxels with larger thickness in the higher than lower nCHO diet group. Bottom of figure shows the Human Connectome Project Multi-Modal Parcellation (HCP-MMP) Atlas.
We conducted a secondary cortical surface analysis testing for a linear association between nCHO and cortical thickness, controlling for age (see Fig. 3). Brain regions that were significant after CWP correction included those from the frontoparietal, cingulo-opercular, and visual 1 and 2 networks. Specifically, we found significant clusters that included voxels from areas anterior and posterior 9-46v (a9-46v and p9-46v), anterior and posterior 47r (a47r and p47r), anterior and posterior IFS (IFSa and IFSp), IFJa, 46, and rostral area 6 (6r) in the left hemisphere and from the primary visual cortex (V1), second and third visual areas (V2 and V3), and ventromedial visual areas 1 and 2 (VMV1 and VMV2) in the right hemisphere. Cluster peaks were located in the left a9-46v (r = –0.617; CWP = 0.0014; cluster size = 1357.74 mm2) and right V3: (r = –0.491; CWP = 0.02899; cluster size = 923.04 mm2). Results within these clusters remained significant after controlling for age, sex, education, and BMI (p < 0.001).
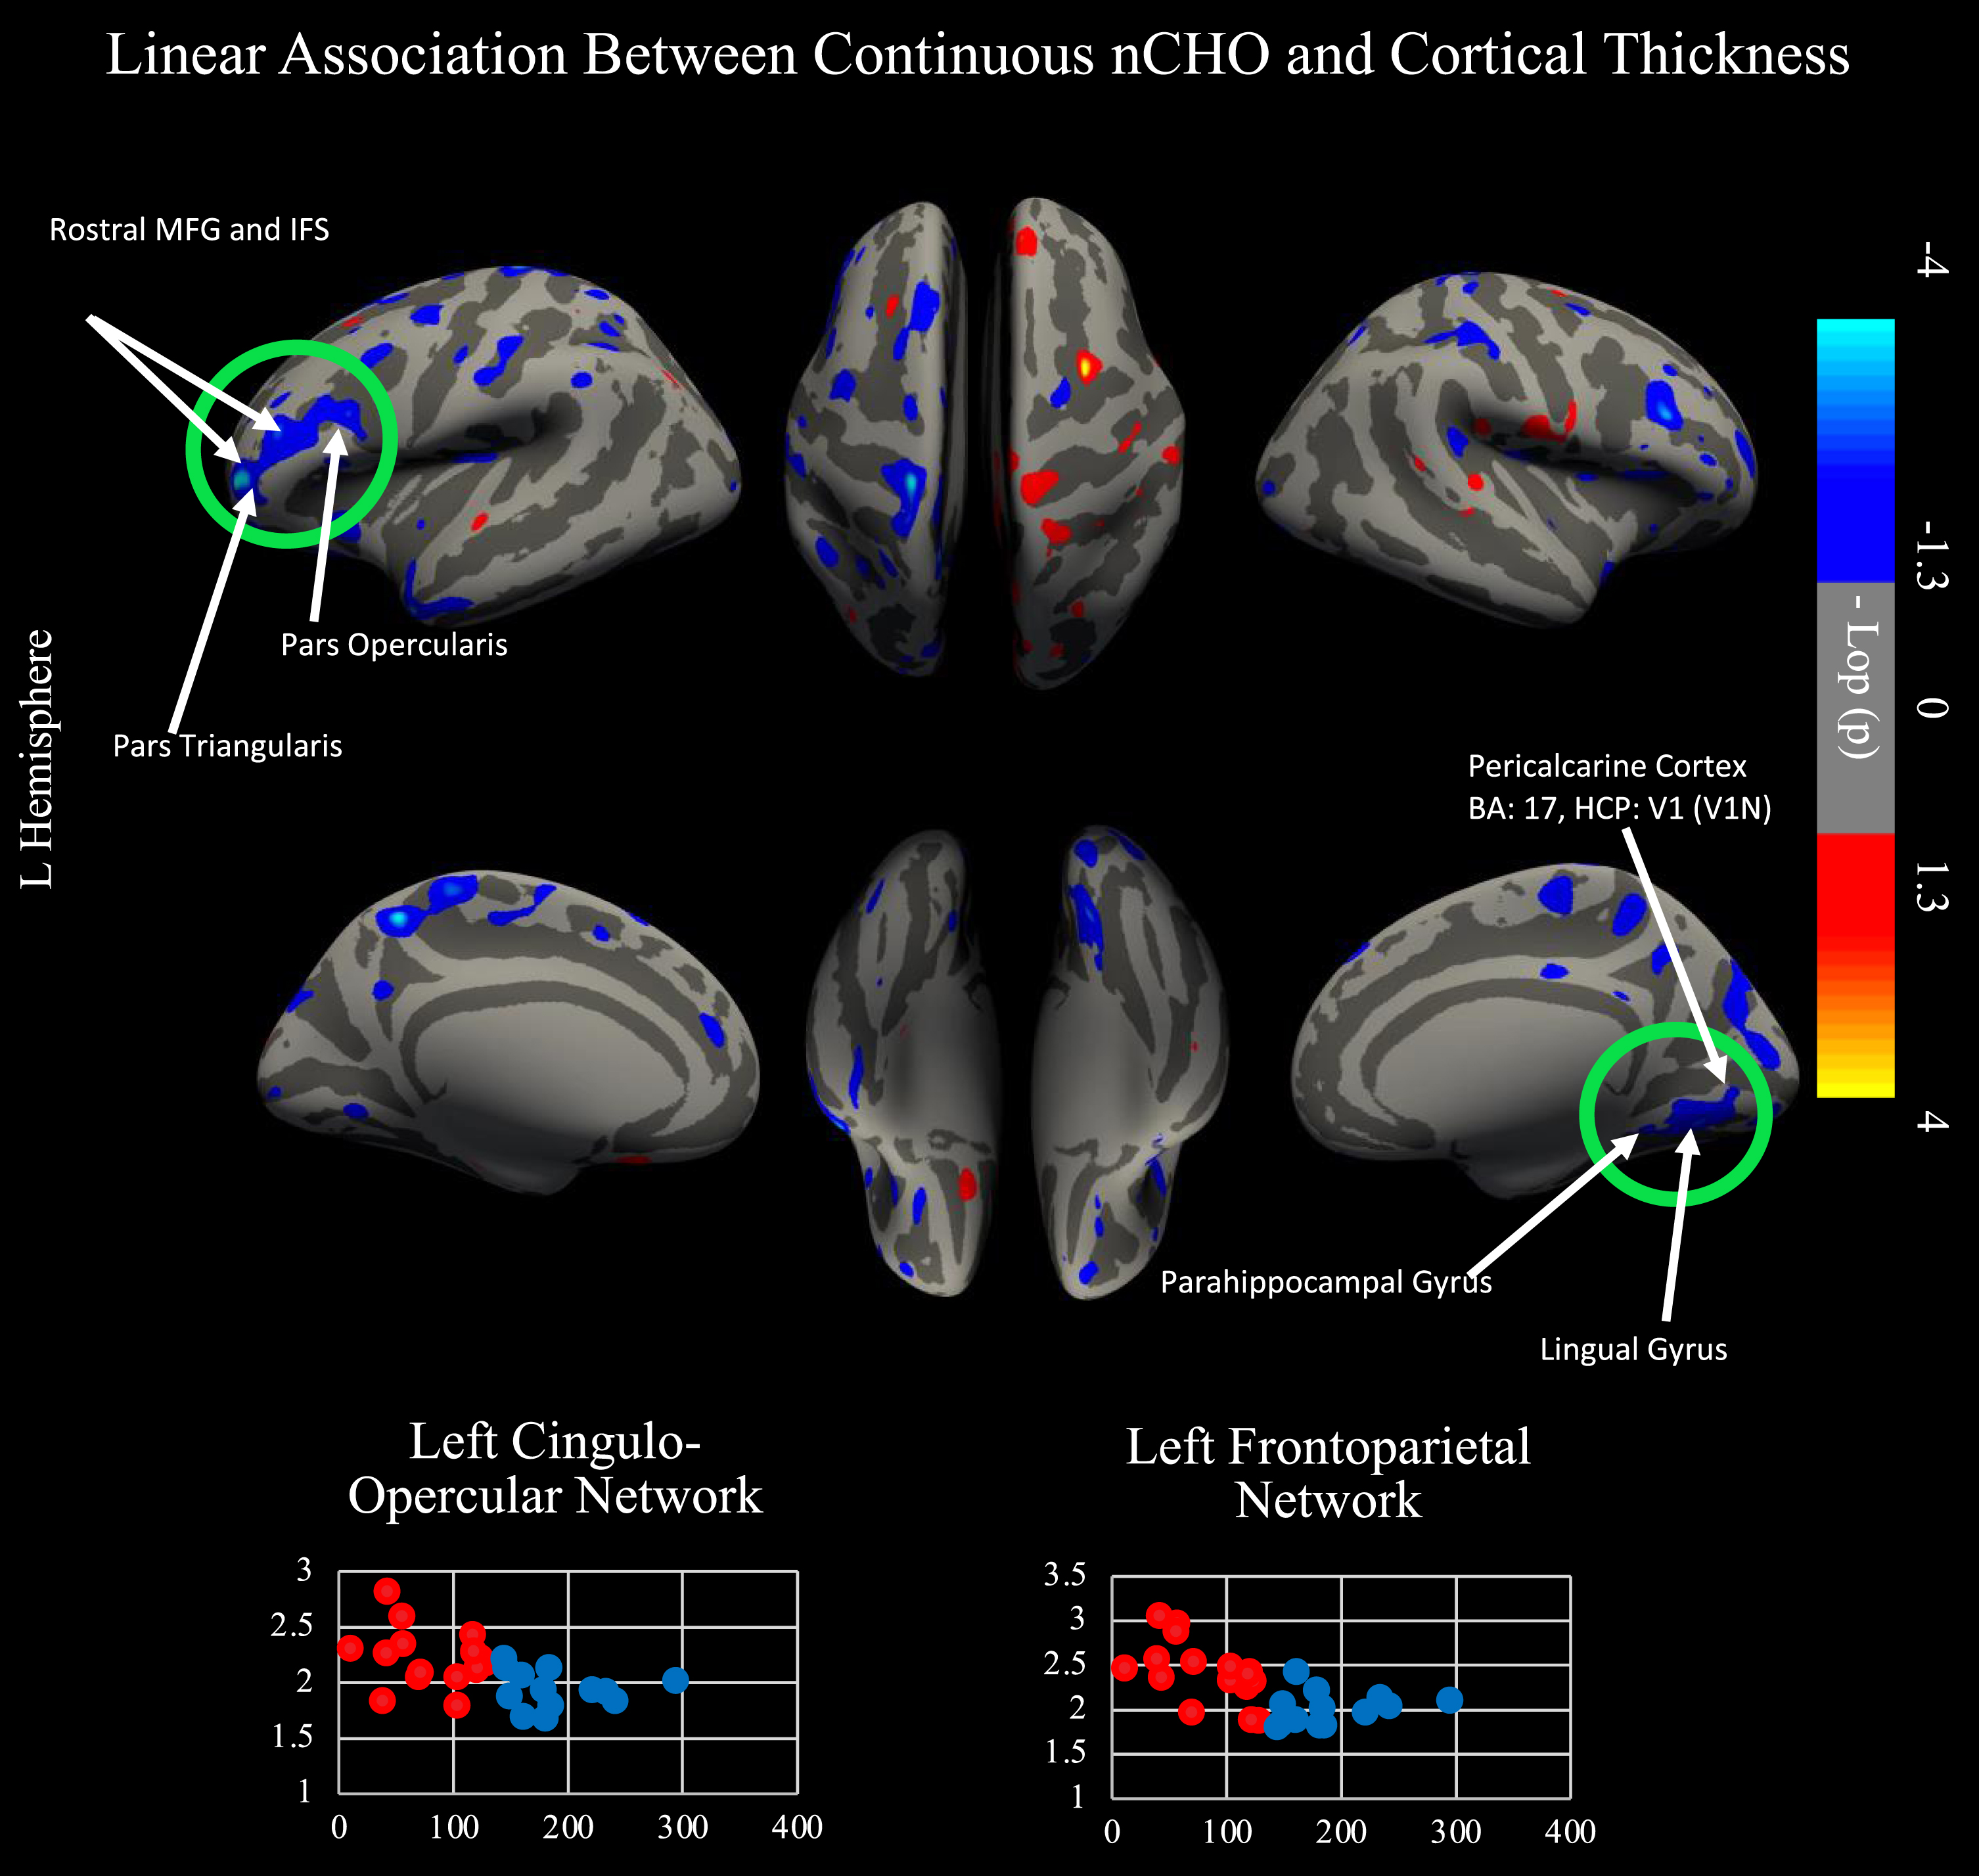
Linear relationship between nCHO and cortical thickness. Top of figure shows results from cortical surface analysis. Linear model includes age as a covariate. Green circles indicate regions that survived correction for multiple comparisons using CWP. White arrows point to highlighted anatomical regions. Cooler colors represent voxels with significantly thinner cortex in individuals eating a higher nCHO diet. Regions significant after CWP correction include anterior and posterior 9-46v (a9-46v and p9-46v), anterior 47r (a47r), posterior 47r (p47r), IFSa, IFSp, IFJa, 46, and rostral area 6 (6r) in the left hemisphere and the second (V2) and third visual areas (V3), ventromedial visual area 1 (VMV1) and 2 (VMV2), primary visual cortex (V1), and the parahippocampal gyrus (PHA1) in the right hemisphere. Bottom of figure displays voxels significant in our primary and secondary analyses: two-tailed t-test comparing lower –higher net carbohydrate (nCHO) diet groups (Fig. 1) and linear regression model of the association between nCHO and cortical thickness independent of age (top of figure).
The two analyses (one examining nCHO intake as a categorical variable and the other as a continuous measure) had converging, significant results after CWP correction in V1 and V2 in the right hemisphere, which are part of the primary and secondary visual networks, respectively. Uncorrected, convergent findings included nodes within 12 bilateral, 31 left, and 10 right hemisphere regions defined by the HCP-MMP atlas that were part of the somatomotor, frontoparietal, language, cingulo-opercular, dorsal attention, auditory, default mode, posterior-multimodal, orbito-affective, and visual 1 and 2 networks (see Fig. 4).
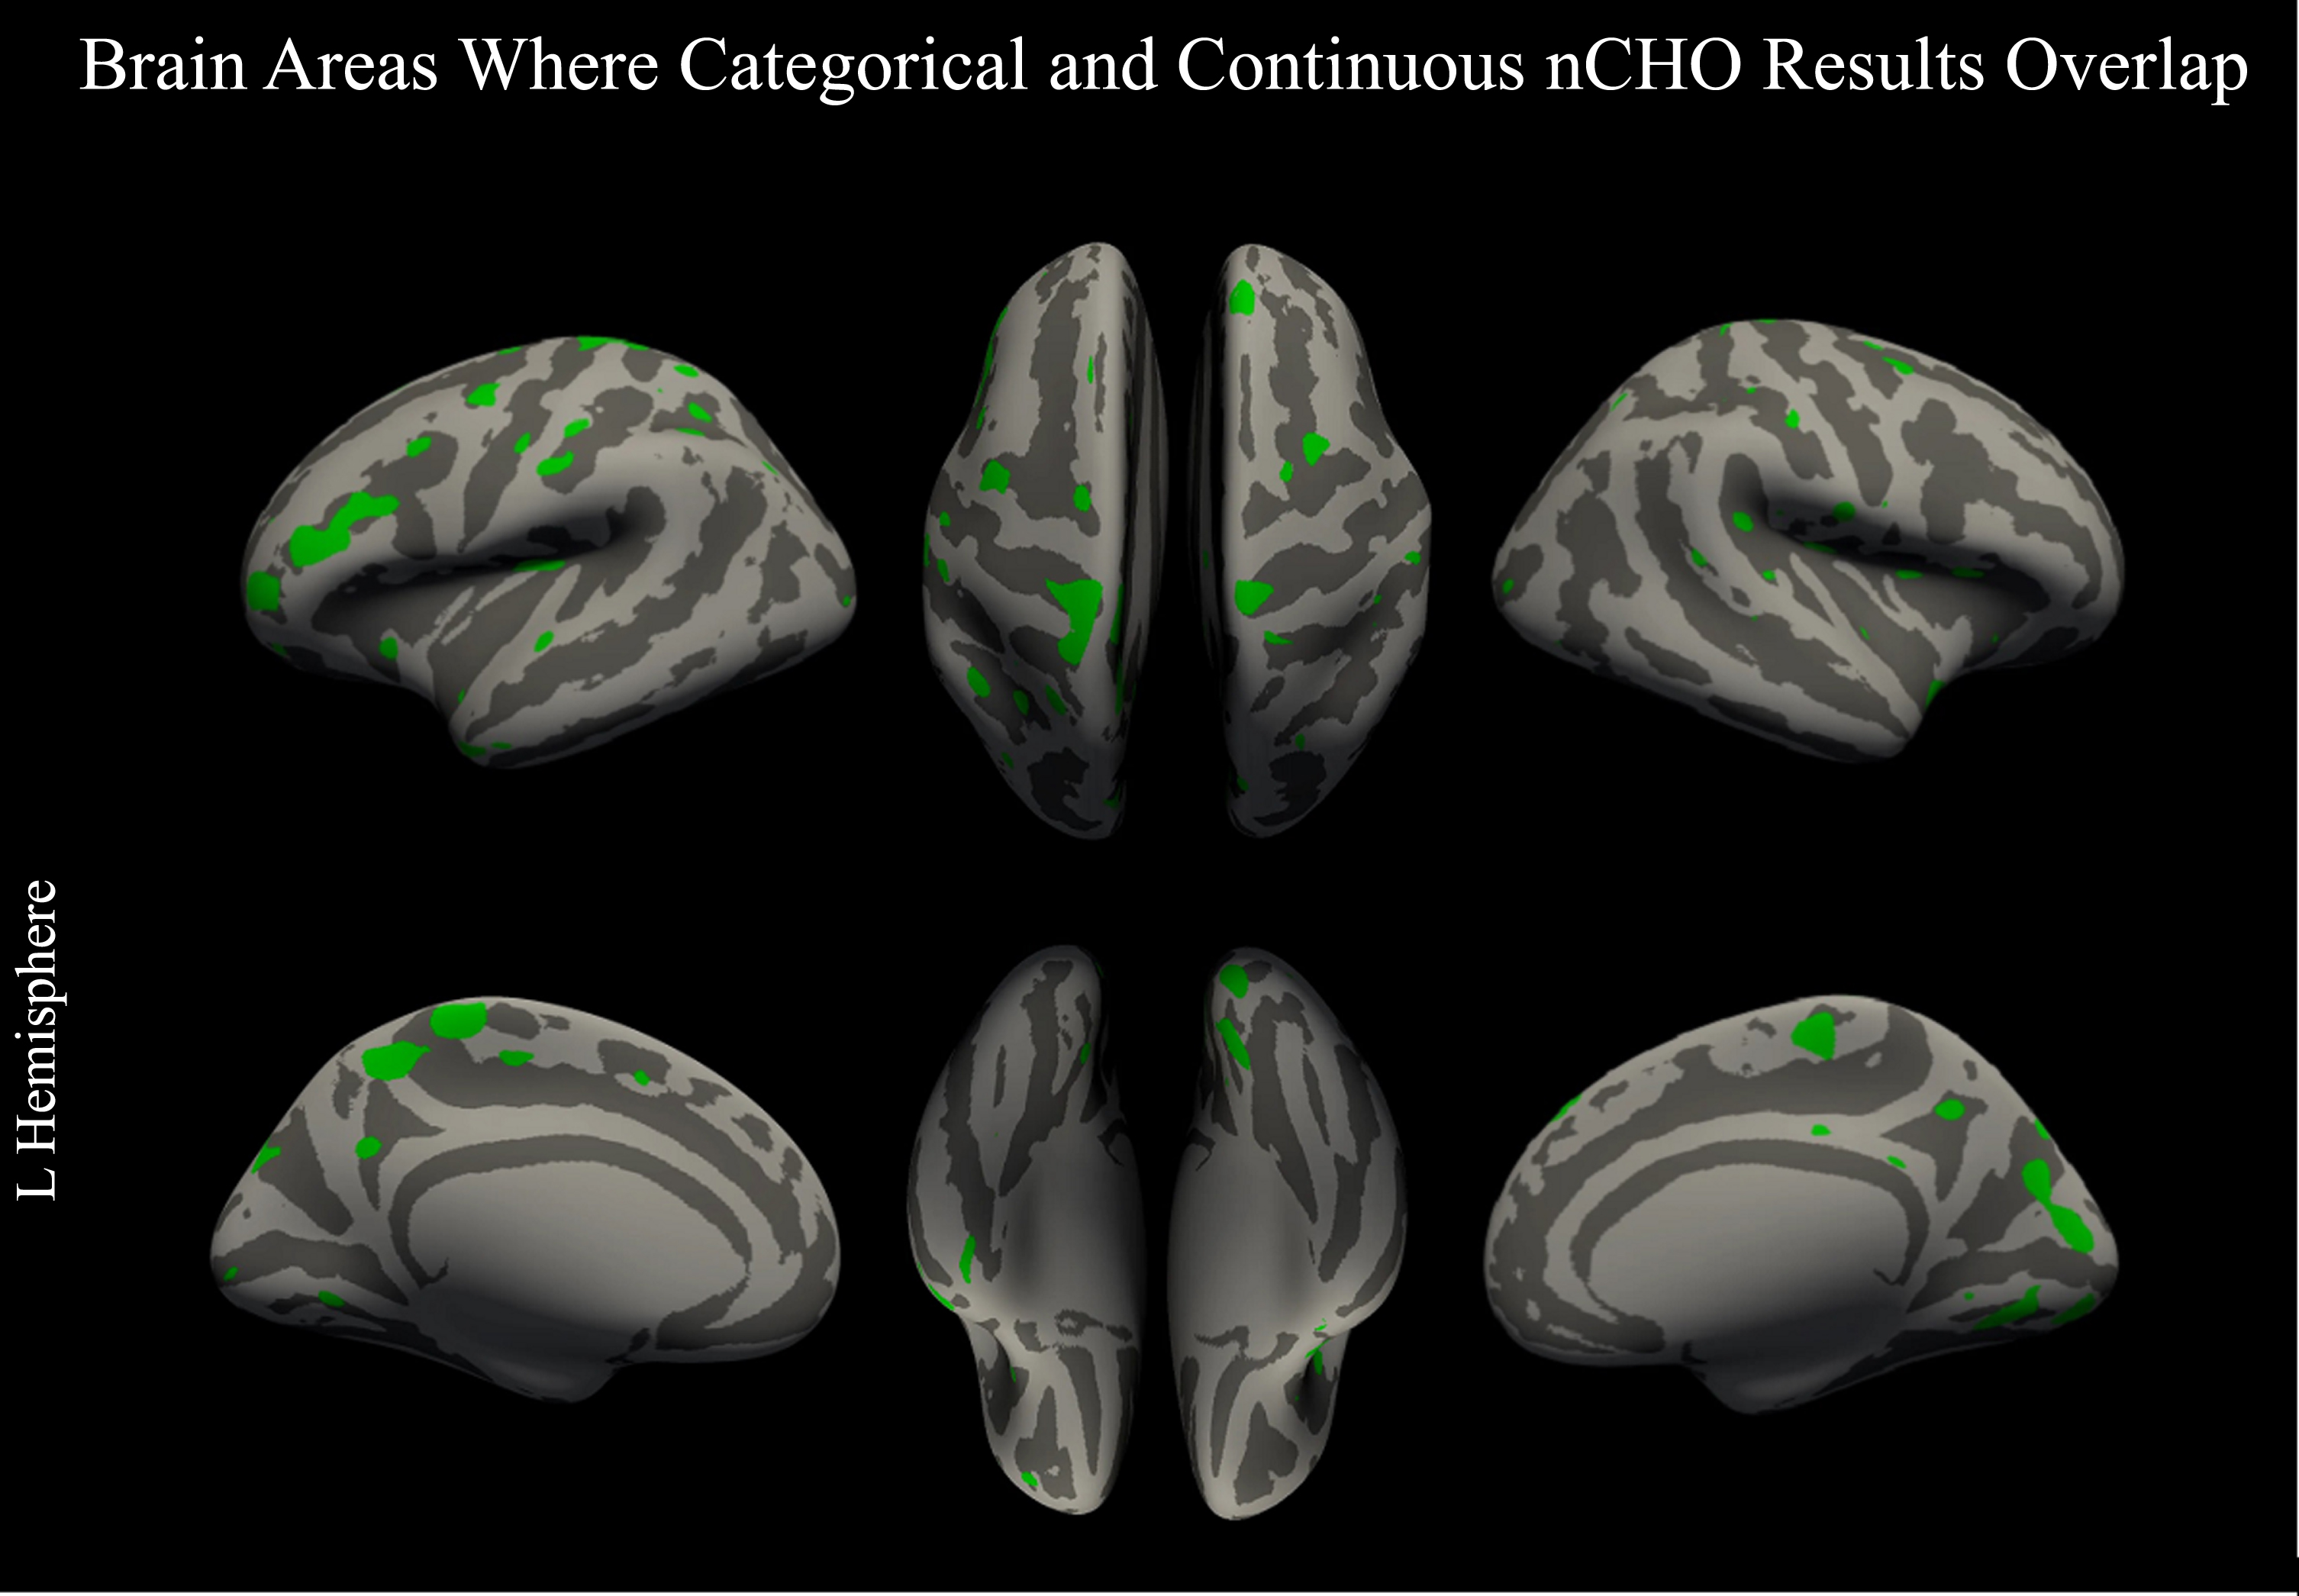
Overlap between categorical and continuous analysis approaches. Figure displays voxels thresholded at a voxel-wise p < 0.05 (uncorrected) in our primary and secondary analyses: two-tailed t-test comparing lower –higher net carbohydrate (nCHO) diet groups (Fig. 1) and linear regression model of the association between nCHO and cortical thickness independent of age (Fig. 3). Overlapping voxels are colored green.
DISCUSSION
In line with our hypothesis, our findings suggest a significant effect of carbohydrate intake on cortical gray matter thickness, with individuals consuming a carbohydrate-restricted diet having thicker cortex than those eating a moderate-to-high carbohydrate diet. Notably, the lower nCHO group exhibited preservation of cortical gray matter in areas within the somatomotor, visual 1 and 2 networks, with peak voxels within the left paracentral lobule (primary motor) and right cuneus (secondary visual cortex). Motor and visual deficits are known risk factors for dementia and often manifest early in the clinical syndrome [70]. However, our finding of preserved cortical gray matter within the somatosensory cortex was unexpected, as this area is generally thought to be spared in AD. Although previous evidence from animal models [71] and imaging experiments have suggested some dysfunction may be present, it has been difficult to detect due to variability in neurocognitive functioning [72]. Our results also revealed significant clusters that extended into the precuneus, which has an important role in many higher-level cognitive functions, such as episodic memory retrieval [73] and is closely adjacent to the HCP-MMP atlas’ anatomically defined default mode network [31, 74]. Notably, effect sizes were reasonably large in the primary motor and secondary visual areas. Widespread cortical thinning is a hallmark of AD, with prior research linking this to disease severity in individuals with MCI and AD [75] and these results suggest that eating a higher carbohydrate diet may contribute in part to these observations. Results without correction for multiple comparisons yielded a consistent pattern of gray matter preservation in the lower nCHO group [75]. To the best of our knowledge, no study has demonstrated a link between restricted-carbohydrate intake, presently defined using a 100–130 g/day nCHO cutoff, and atrophy in patients with AD confirmed by neuropathology.
Our secondary analyses, examining nCHO intake as a continuous variable, also revealed a significant, negative correlation between level of nCHO intake and cortical thickness in regions from the frontoparietal, cingulo-opercular, default mode, and visual 1 and 2 networks, with peak voxels within the right lingual, parahippocampal, and rostral middle frontal gyri. Notably, the most significant finding in this analysis was the middle frontal gyrus, which plays a crucial role in attention, executive functioning, and reasoning [76–78], functions important in compensatory skills in patients with memory impairment. Prior research in older adults who followed a MeDi diet did not detect this association [21]. Our sample was unique in that they consumed fewer carbohydrates and had AD with confirmed amyloid burden. Findings using carbohydrate intake as a continuous measure or categorized with a cutoff of 130 g/day converged in primary and secondary visual networks.
Although we hypothesized that a carbohydrate-restricted diet would impact lateral temporal lobe or dorsal attention network cortical structures, our results did not reveal significant findings in these areas. However, our sample is early in their disease progression and prior research findings suggest that the dorsal attention network and lateral temporal lobe are impacted later [79–81]. It is also possible that larger sample sizes or analyses using a more limited search volume may be needed to identify significant effects in these brain regions.
The primary limitation of this work is the small sample size. For this reason, all findings should be interpreted with caution. Furthermore, it is important to acknowledge that our sample was primarily composed of highly educated individuals with a high prevalence of the APOE ɛ4 allele, which may restrict the generalizability of our findings to other patient populations. Additionally, we used a retrospective, self-reported measure of diet (FFQ), which has inherent limitations in terms of recall accuracy and lacks information regarding the duration of adherence required to achieve the reported results. Moreover, this study is cross-sectional in design, and group assignment was based on participant self-selection into higher and lower nCHO groups. For these reasons, a clinical trial with a prescribed diet in a broader population would provide stronger evidence for the usefulness of restricting carbohydrates to under 130 g/day as a dietary intervention in patients with cognitive impairment. Future directions of this work will be to explore longitudinal trajectories of cortical thinning and assess how they are affected by changes in nCHO intake in the participants of this cohort. We will also assess the effects of APOE genotype on the relationship between nCHO intake and cortical thinning.
In summary, our small sample study provides initial evidence that a carbohydrate- restricted diet with an average daily intake under 130 g nCHO may mitigate the adverse effects of high blood sugar in adults with AD and biomarker evidence of AD neuropathology. While this dietary approach has been shown to benefit patients with insulin resistance and obesity [18], its potential benefits in the context of cognitively impaired patients have not been explored. Our findings could inform future research into dietary interventions for AD, particularly in targeting insulin resistance through a carbohydrate-restricted version of a nutrient-dense diet, such as the brain-healthy MIND diet [22]. However, further research with larger sample sizes and longer follow-up periods is needed to confirm these results and to better understand the mechanisms underlying the observed associations.
Footnotes
ACKNOWLEDGMENTS
We would like to thank the patients and families that participated in this research, without which this research would not be possible. We thank the Pacific Neuroscience Institute and Foundation staff and leadership, including the CEO and Founder, Dan Kelly, MD, Vice President, Melissa Coleman, Director of Research Administration and Operations, Melanie Lampa, Clinical Research Manager, Jessica Serna, Director of Marketing, Zara Jethani, Executive Assistants, Danielle Wozniak and Alyssa Simpers, and Accounting Manager, Bersabel Belay for their support. We would also like to thank Daniel Hirsch for his help implementing the FETA and Freesurfer programs. This study has benefited from the clinical infrastructure of the Pacific Brain Health Center (PBHC), specifically Kyrsten Cardenas, Brenda Smith, and all the PBHC clinical staff members. We are also grateful to the clinical research infrastructure and leadership provided by the Providence Saint John’s Cancer Institute, specifically, Dr. Neil Martin, Dr. Santosh Kesari, Lisa Van Kreunigen, Brian Anderson, and Elena Berezhnikh. We are grateful to all the participants who have been part of the project and to the many members of the study teams at the University of Cambridge who have enabled research on the FETA software for analysis of the EPIC-Norwalk food frequency questionnaire. Thanks to Avi Snyder (Washington University School of Medicine) for porting his Talairach alignment implementation to FreeSurfer. Thanks to Ron Kikinis and Steve Pieper for providing engineering advice and support for testing and open-sourcing of FreeSurfer.
FUNDING
This work is supported by the Pacific Neuroscience Institute Foundation, including the generous support of the Barbara and John McLoughlin Family as well as the Cary and Will Singleton Family; Providence St. Joseph Health, Seattle, WA [Alzheimer’s Translational Pillar (ATP)]; Saint John’s Health Center Foundation; and the National Institutes of Health [U01AG046139, RF1AG057443, U01AG061359, R01AG062514, R21AG061494].The EPIC-Norfolk study (DOI 10.22025/2019.10.105.00004) has received funding from the Medical Research Council (MR/N003284/1 and MC-UU_12015/1) and Cancer Research UK (C864/A14136).
Support for the research behind FreeSurfer was provided in part by the National Center for Research Resources (P41-RR14075, R01 RR16594-01A1 and the NCRR BIRN Morphometric Project BIRN002, U24 RR021382), the National Institute for Neurological Disorders and Stroke (R01 NS052585-01)), the National Institute of Biomedical Imaging and Bioengineering, as well as the Mental Illness and Neuroscience Discovery (MIND) Institute, and is part of the National Alliance for Medical Image Computing (NAMIC), funded by the National Institutes of Health through the NIH Roadmap for Medical Research, Grant U54 EB005149. Support for providing engineering advice and support for testing and open-sourcing of FreeSurfer was provided in part by the NA-MIC (NIH Roadmap for Medical Research Grant U54 EB005149).
CONFLICT OF INTEREST
Cyrus Raji, MD, PhD is an Editorial Board Member of this journal but was not involved in the peer-review process nor had access to any information regarding its peer-review.
DATA AVAILABILITY
The data supporting the findings of this study are available on request from the corresponding author.