
Abstract
Background:
Neuropathological changes of Alzheimer’s disease (AD) and Parkinson’s disease (PD) can coexist in the same sample, suggesting possible common degenerative mechanisms.
Objective:
The objective of this study was to use RNA-sequencing to compare gene expression in AD and PD vulnerable brain regions and search for co-expressed genes.
Methods:
Total RNA was isolated from AD/CTL frontal cortex and PD/CTL ventral midbrain. Sequencing libraries were prepared, multiplex paired-end RNA sequencing was carried out, and bioinformatics analyses of gene expression used both publicly available (tophat2/bowtie2/Cufflinks) and commercial (Qlucore Omics Explorer) algorithms.
Results:
Both AD (frontal cortex, n = 10) and PD (ventral midbrain, n = 14) samples showed extensive heterogeneity of gene expression. Hierarchical clustering of heatmaps revealed two gene populations (AD, 376 genes; PD, 351 genes) that separated AD or PD from control samples at false-discovery rates (q) of <5% and fold changes of at least 1.3 (AD) or 1.5 (PD). 10,124 genes were co-expressed in our AD and PD samples. A very small group of these genes (n = 23) showed both low variances (<150; variance = standard deviation squared) and reduced expressions (>1.5-fold under-expression) in both AD and PD. Ingenuity Pathways Analyses (IPA, Qiagen) revealed loss of NAD biosynthesis and salvage as the major canonical pathway significantly altered in both AD and PD.
Conclusions:
AD and PD in vulnerable brain regions appear to arise from and result in independent molecular genetic abnormalities, but we identified several under-expressed genes with potential to treat both diseases. NAD supplementation shows particular promise.
INTRODUCTION
Alzheimer’s disease (AD) and Parkinson’s disease (PD) pathologies may co-exist in the same brain [1, 2]. This situation begs the questions (among many) of whether the two disease processes are in any way related pathogenically, which process (if either) “came first”, and whether both pathological processes and clinical symptoms could share a common disease-altering treatment.
Answers to the above questions are of necessity speculative at the current level of knowledge. Insight might be gained by examination of “pure” cases of AD and PD to search for common molecular abnormalities, since clinical symptoms alone may not predict underlying pathologies accurately.
We applied RNA sequencing (RNA-seq) of total (i.e., non mRNA-enriched) RNA that was rRNA-depleted to this question. RNA sequencing of total RNA allows the estimation of gene expression, which is the net sum of transcription minus degradation of pre- and messenger RNAs for each gene. In this study we tested the hypothesis that gene expression, assessed by the increasingly popular RNA-seq technology, could be used to suggest new treatments for disease, as opposed to “insights” about disease pathogenesis.
When this approach is applied to brain tissue, one has an overall picture of how the cells in that tissue responded to stresses present at the time of death of the subject. In the case of neurodegenerative diseases, one will not observe pathogenic or adaptive gene expression changes that were present in neurons that have died and been removed and may instead observe changes in “survivors”. Pathogenic gene expression changes may or may not be present in surviving vulnerable neurons and supporting cells (such as astroglia that comprise ∼90% of tissue mass) that likely contribute to the majority of expression changes observed, excepting those specifically expressed by neurons.
Bioinformatic approaches to analysis of gene sequencing data are likewise best viewed as estimates that reflect underlying assumptions based on allowable fidelities of alignment, sequencing accuracies and assembly of fragments into whole transcriptomes, most of which are subject in vivo to alternative splicing. Further sorting of individual genes into networks, a procedure still in development, offers the possibility of identifying “hub” genes that control expression of other genes.
Humans are not genetically/epigenetically identical, further confounding the interpretation of findings [3, 4]. This fundamental heterogeneity likely contributes to variable responses to treatments, and approaches to embrace this heterogeneity may improve selection of specific therapies for individuals, so-called “personalized (precision) medicine”[5].
In spite of these limitations, RNA-seq studies of postmortem brain tissue may offer insights into similarities and differences among conditions that have similar pathological or clinical presentations. For that reason, we undertook a study of gene expression in “pure” AD and PD samples available to us that we have collected.
METHODS
RNA-seq followed procedures described in our prior publications [6, 7]. Briefly, extraction of total RNA from frozen sections of frontal cortex or ventral midbrain was performed using Qiagen miRNeasy kits according to manufacturer’s instructions. Data regarding the ages and RNA quality of our samples are provided in Table 1. Many of our samples were obtained prior to staging systems developed by the Braak group and instead used CERAD criteria (
Demographic and analytic details of AD and PD brain tissue samples
N/A, not available.
On-column DNAase treatments and extra buffer washes were routinely carried out. Multiplex Illumina® sequencing libraries, quantitation and sequencing were performed by CoFactor Genomics, using paired-end approach and ∼60 million reads/sample.
Compressed (gz) sequencing files in fastq format were downloaded, examined with FastQC and Illumina® sequencing adapters removed with Trimmomatic®. Reads were aligned against the current (hg38) version of the human genome using Tophat2/Bowtie2. The resulting binary sequencing files (*.bam) were processed by either Cufflinks (using FPKM normalization) or Qlucore Omics Explorer® (QOE, www.qlucore.com) containing the NGS plug-in (FPKM or TMM normalization).
RESULTS
We chose to use gene expression variance (= standard deviation squared) as a quantitative measure of gene heterogeneity within each disease population. Figure 1 shows plots of variances for averaged (from Cufflinks) gene expression of the AD or PD samples on the y-axes against variances of the respective CTL samples on the x-axes. There is extensive scatter within both data sets and no clear relationships among variances of AD or PD samples and their respective CTLs’ variances.
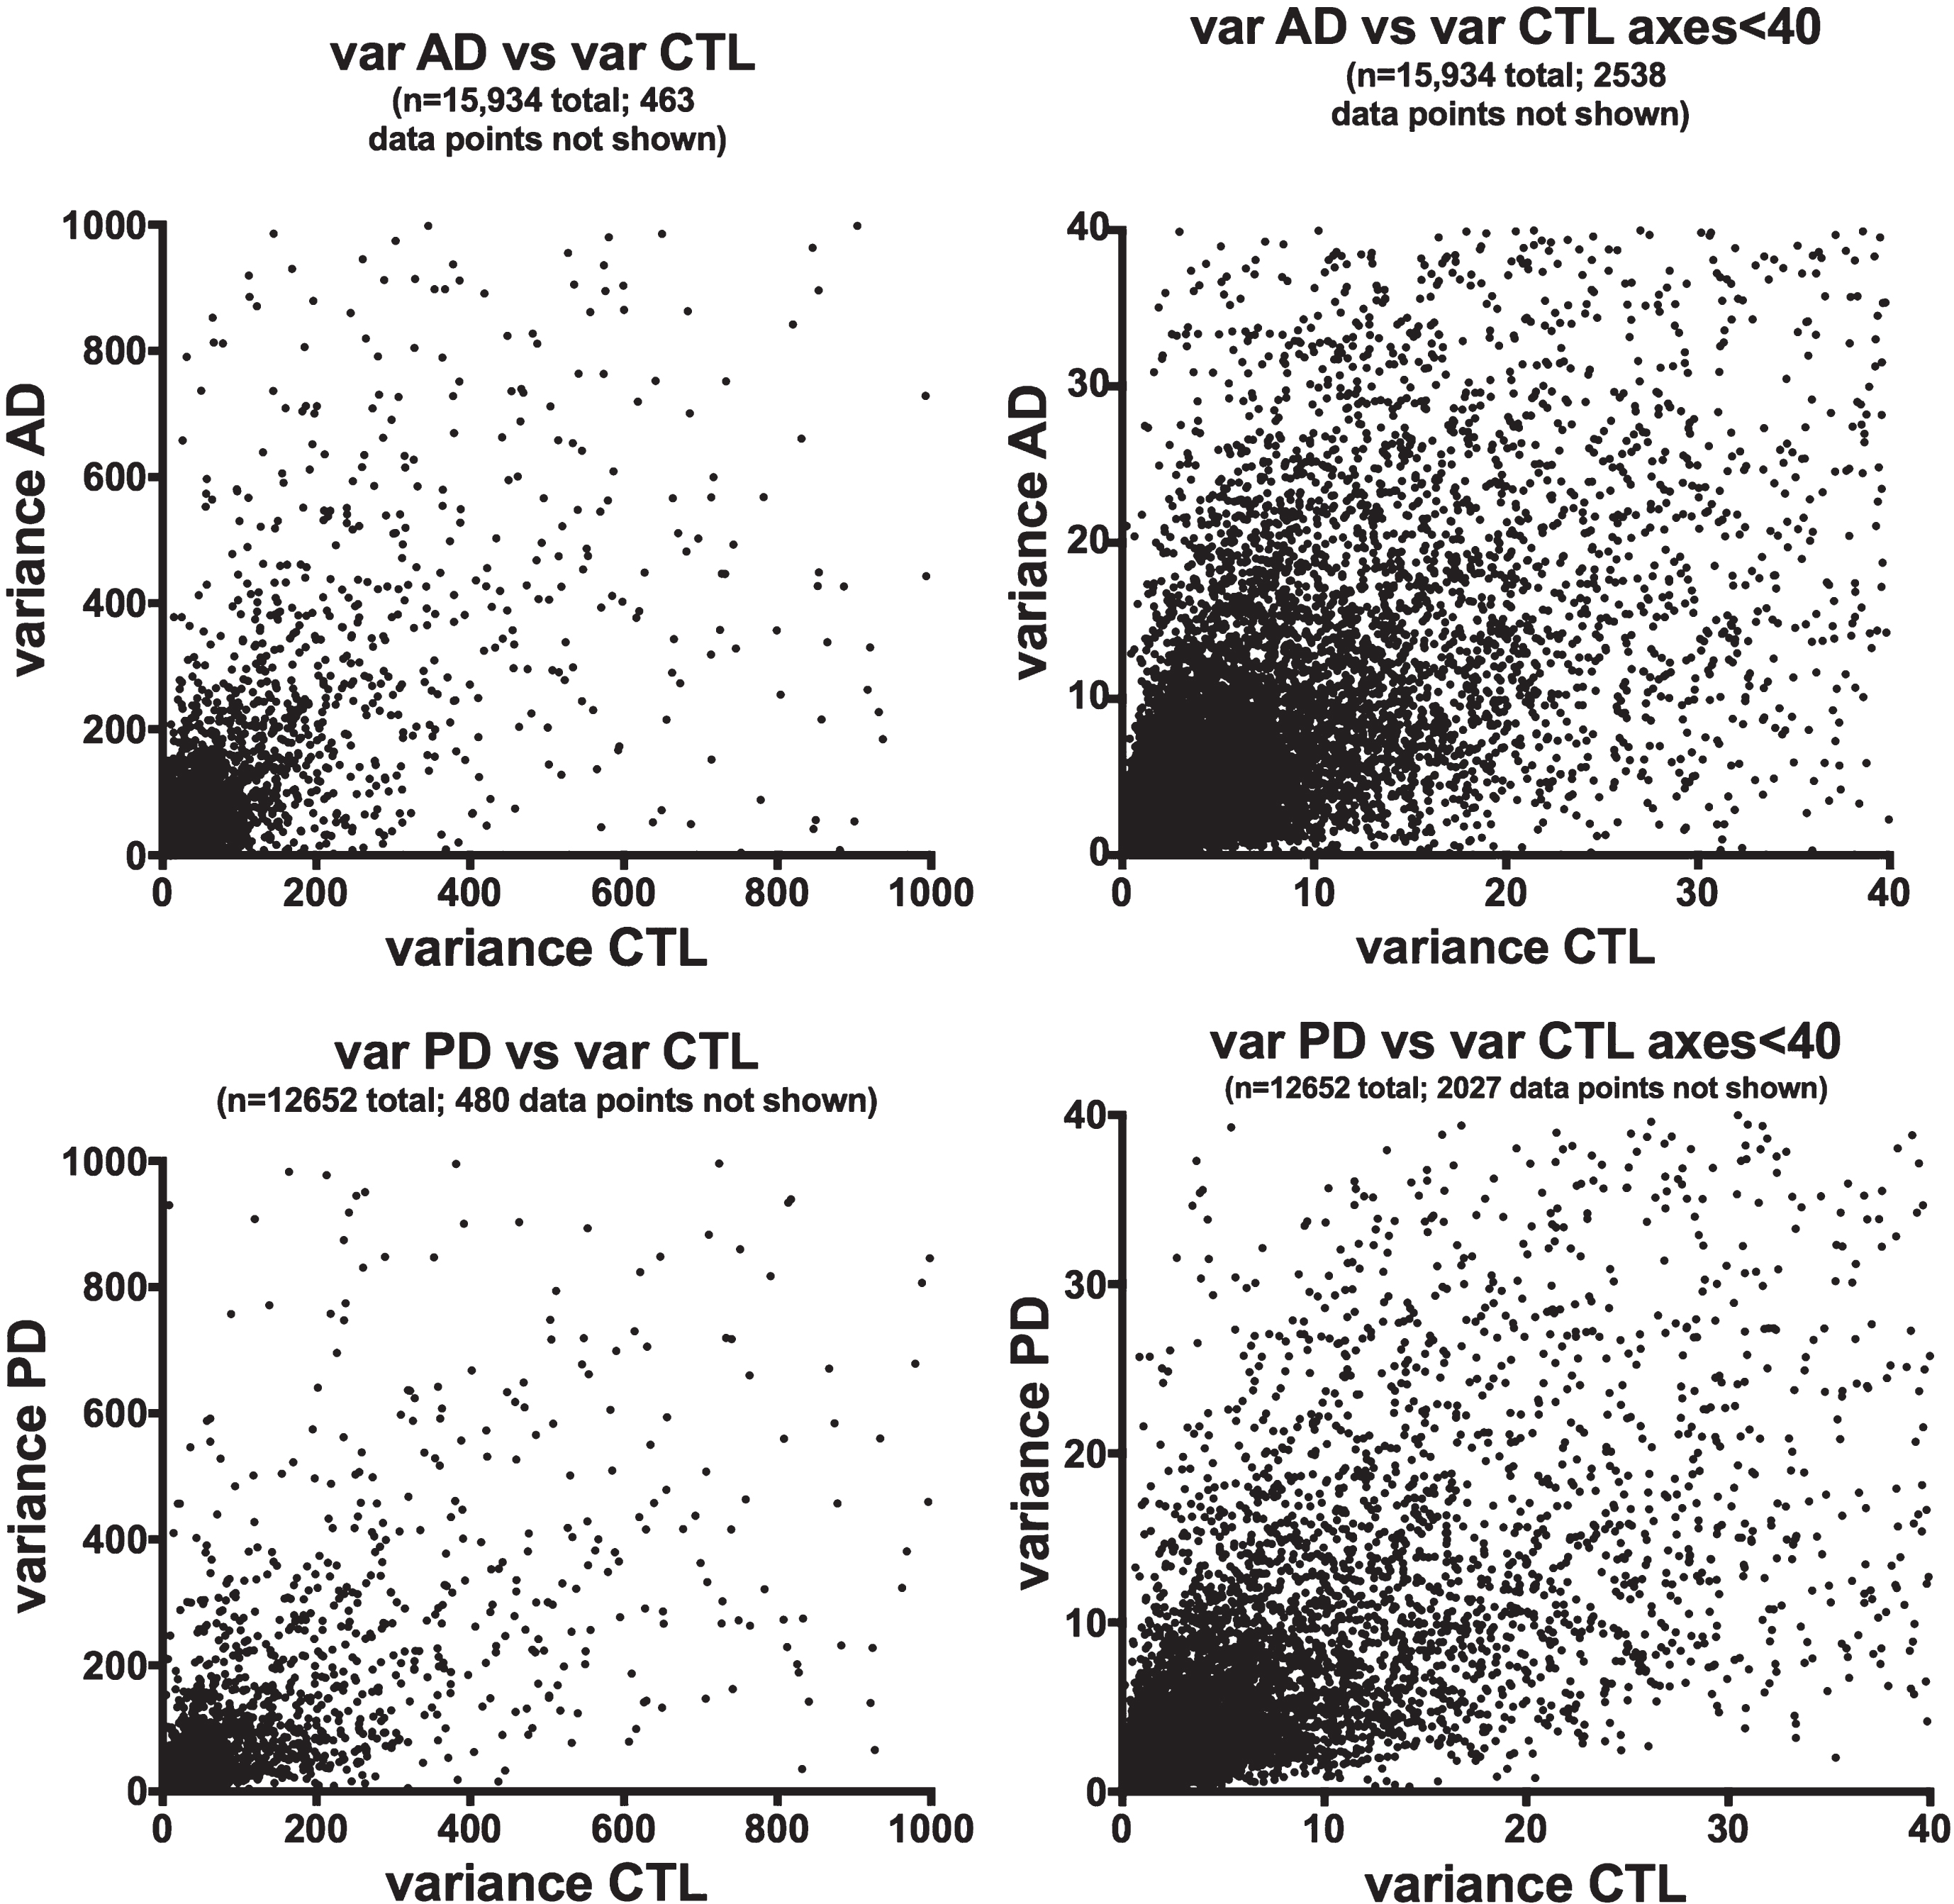
Variances of gene expression, on a gene-by-gene basis, for AD samples (frontal cortex, top row) and PD samples (ventral midbrain, bottom row) are plotted against variances for CTL samples for AD (frontal cortex, top row) and PD (ventral midbrain, bottom row). Variances for gene expression were calculated from FPKM estimates of expressions derived from Cufflinks analyses, using Excel.
Figure 2 shows the relationships among variances in expression of the AD or PD samples on the y-axes compared to AD/CTL or PD/CTL expression ratios on the x-axes. The datasets suggest a Gaussian-type distribution, implying both that the data are normally distributed and that the genes with mean expression ratios closest to unity also can have the highest variances.
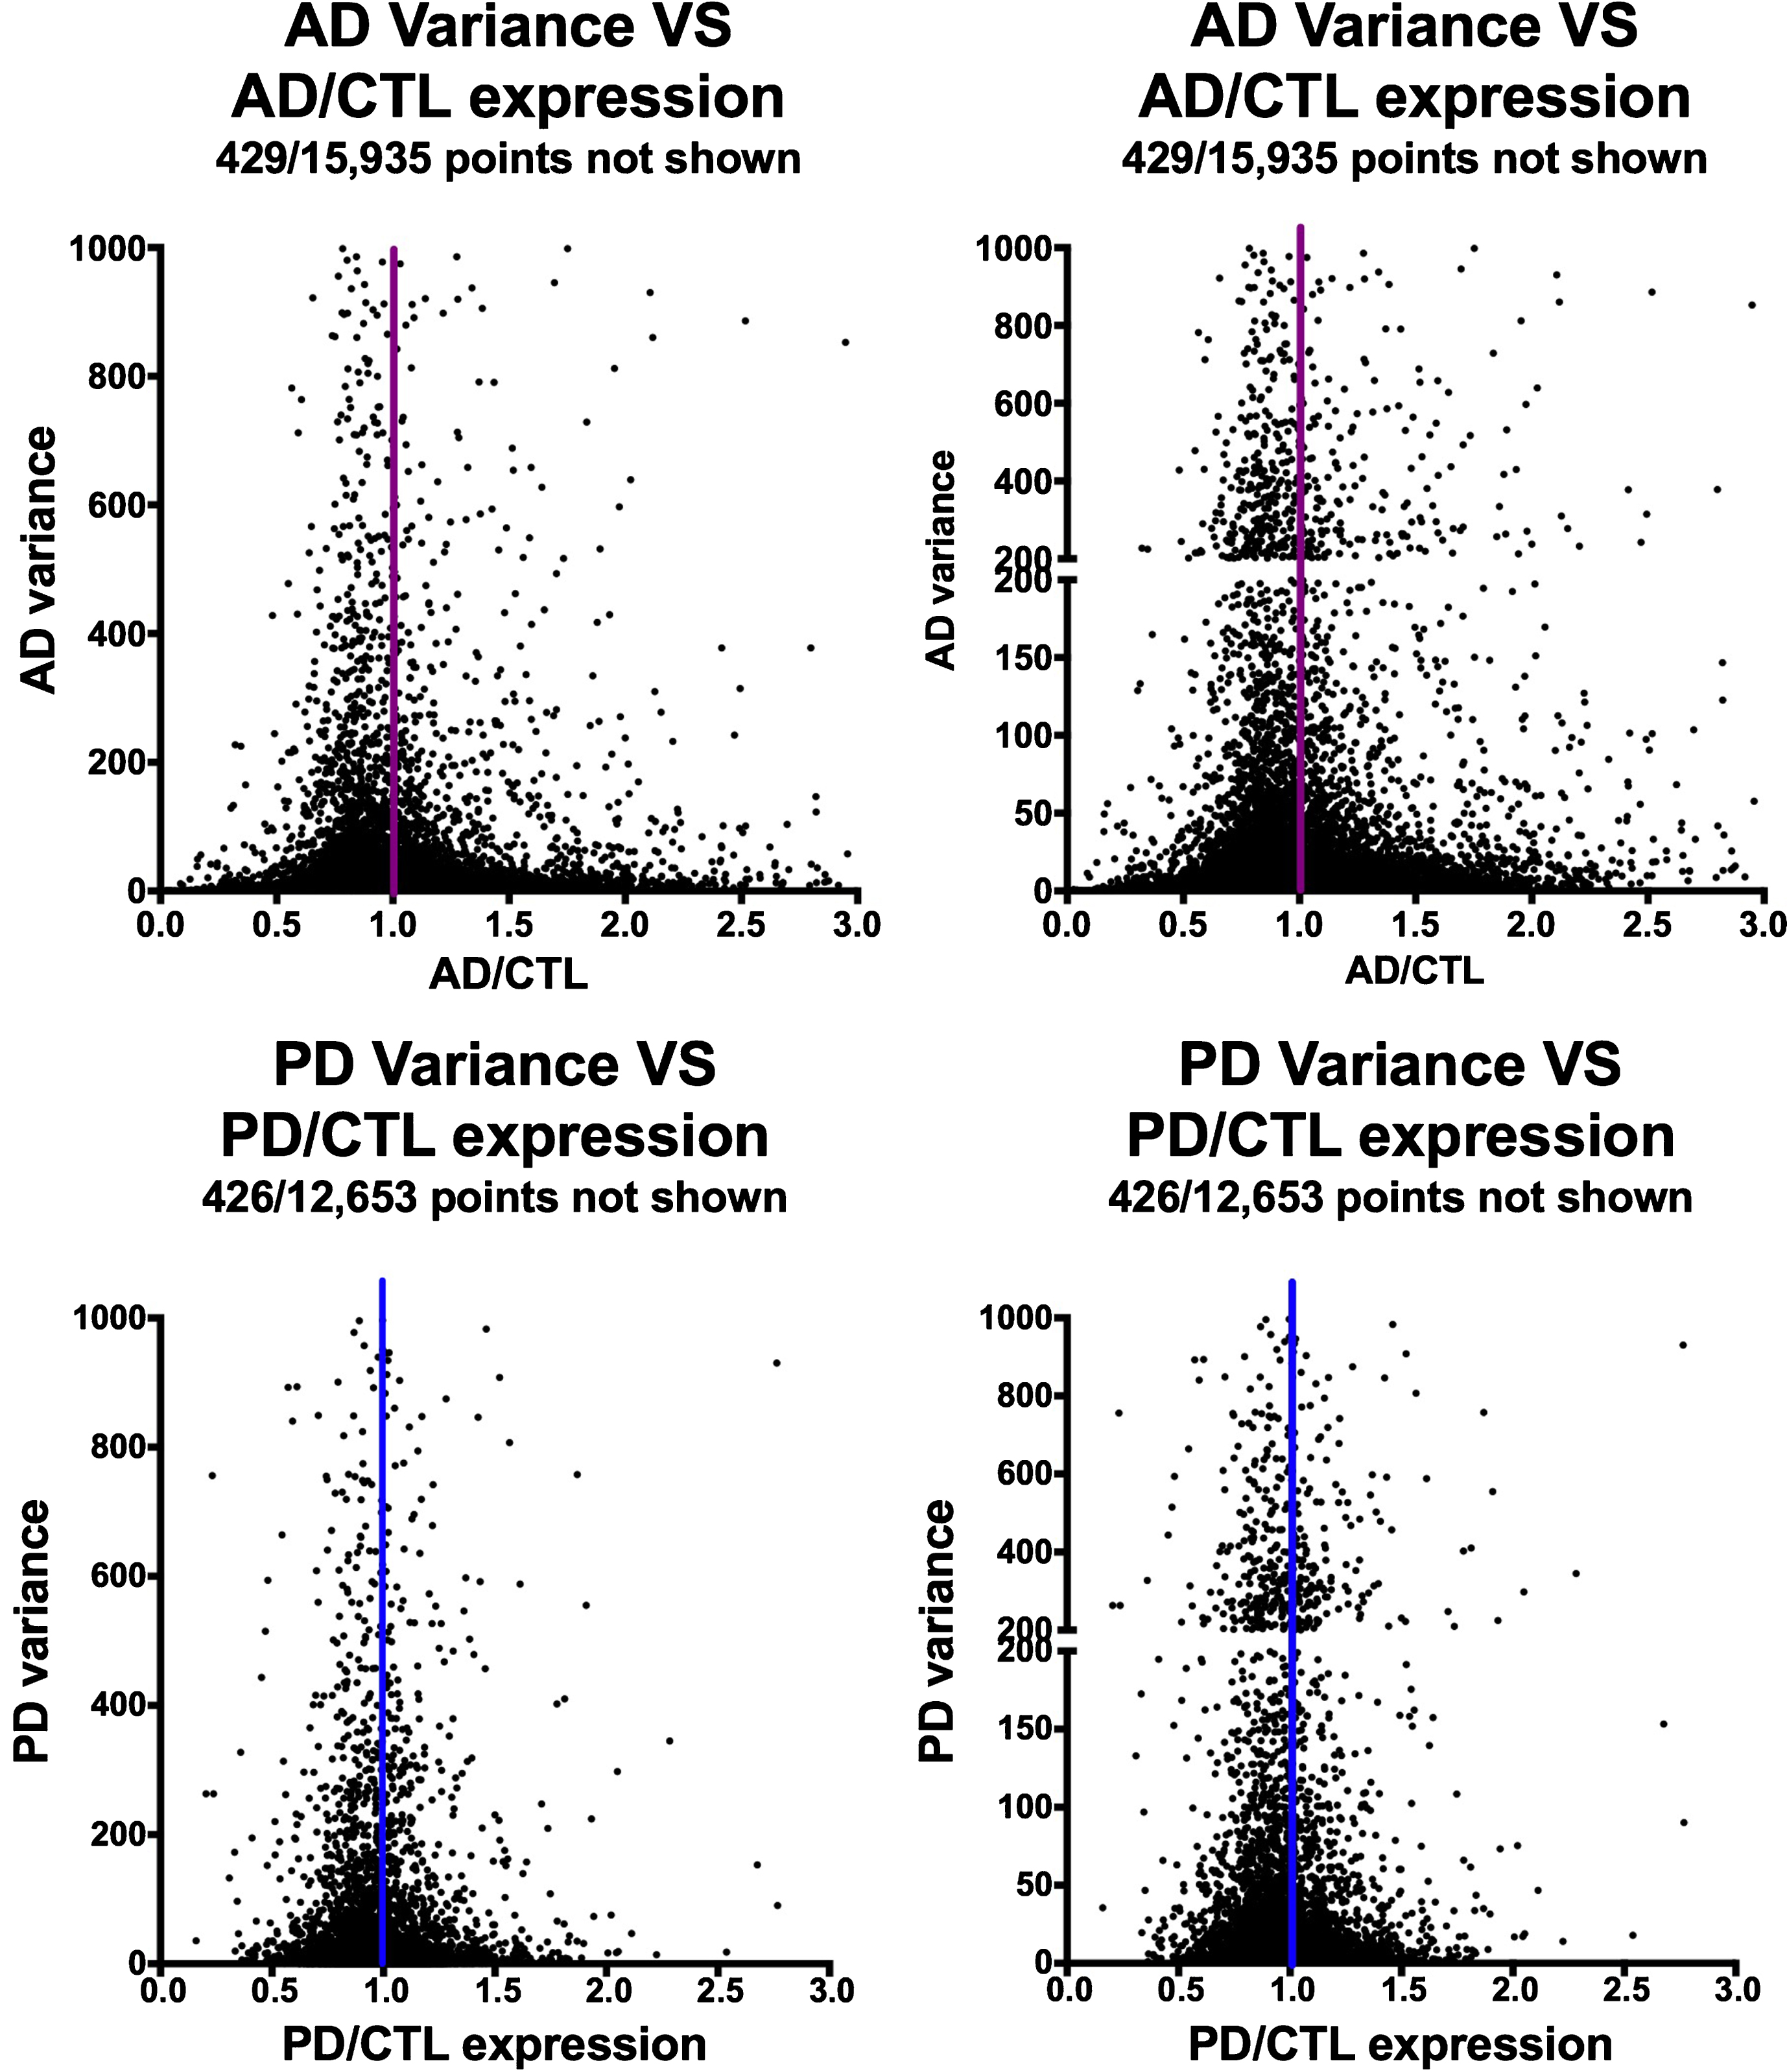
Variances of gene expression, on a gene-by-gene basis, for AD samples (frontal cortex, top row) and PD samples (ventral midbrain, bottom row) plotted against AD/CTL expression ratios (top row) or PD/CTL expression ratios (bottom row). Gene expressions were calculated from FPKM estimates of expressions derived from Cufflinks analyses.
Figure 3 shows a plot of averaged gene expression of PD/CTL samples on the y-axis compared to averaged gene expression of the AD/CTL samples on the x-axis on a gene-by-gene basis, for genes (n = 10,124) that are co-expressed in both PD and AD samples. There is no obvious single relationship among these 10,124 genes expressed in both PD and AD samples, but the majority of these co-expressed genes appear to have similar expressions in CTLs and AD or PD samples.
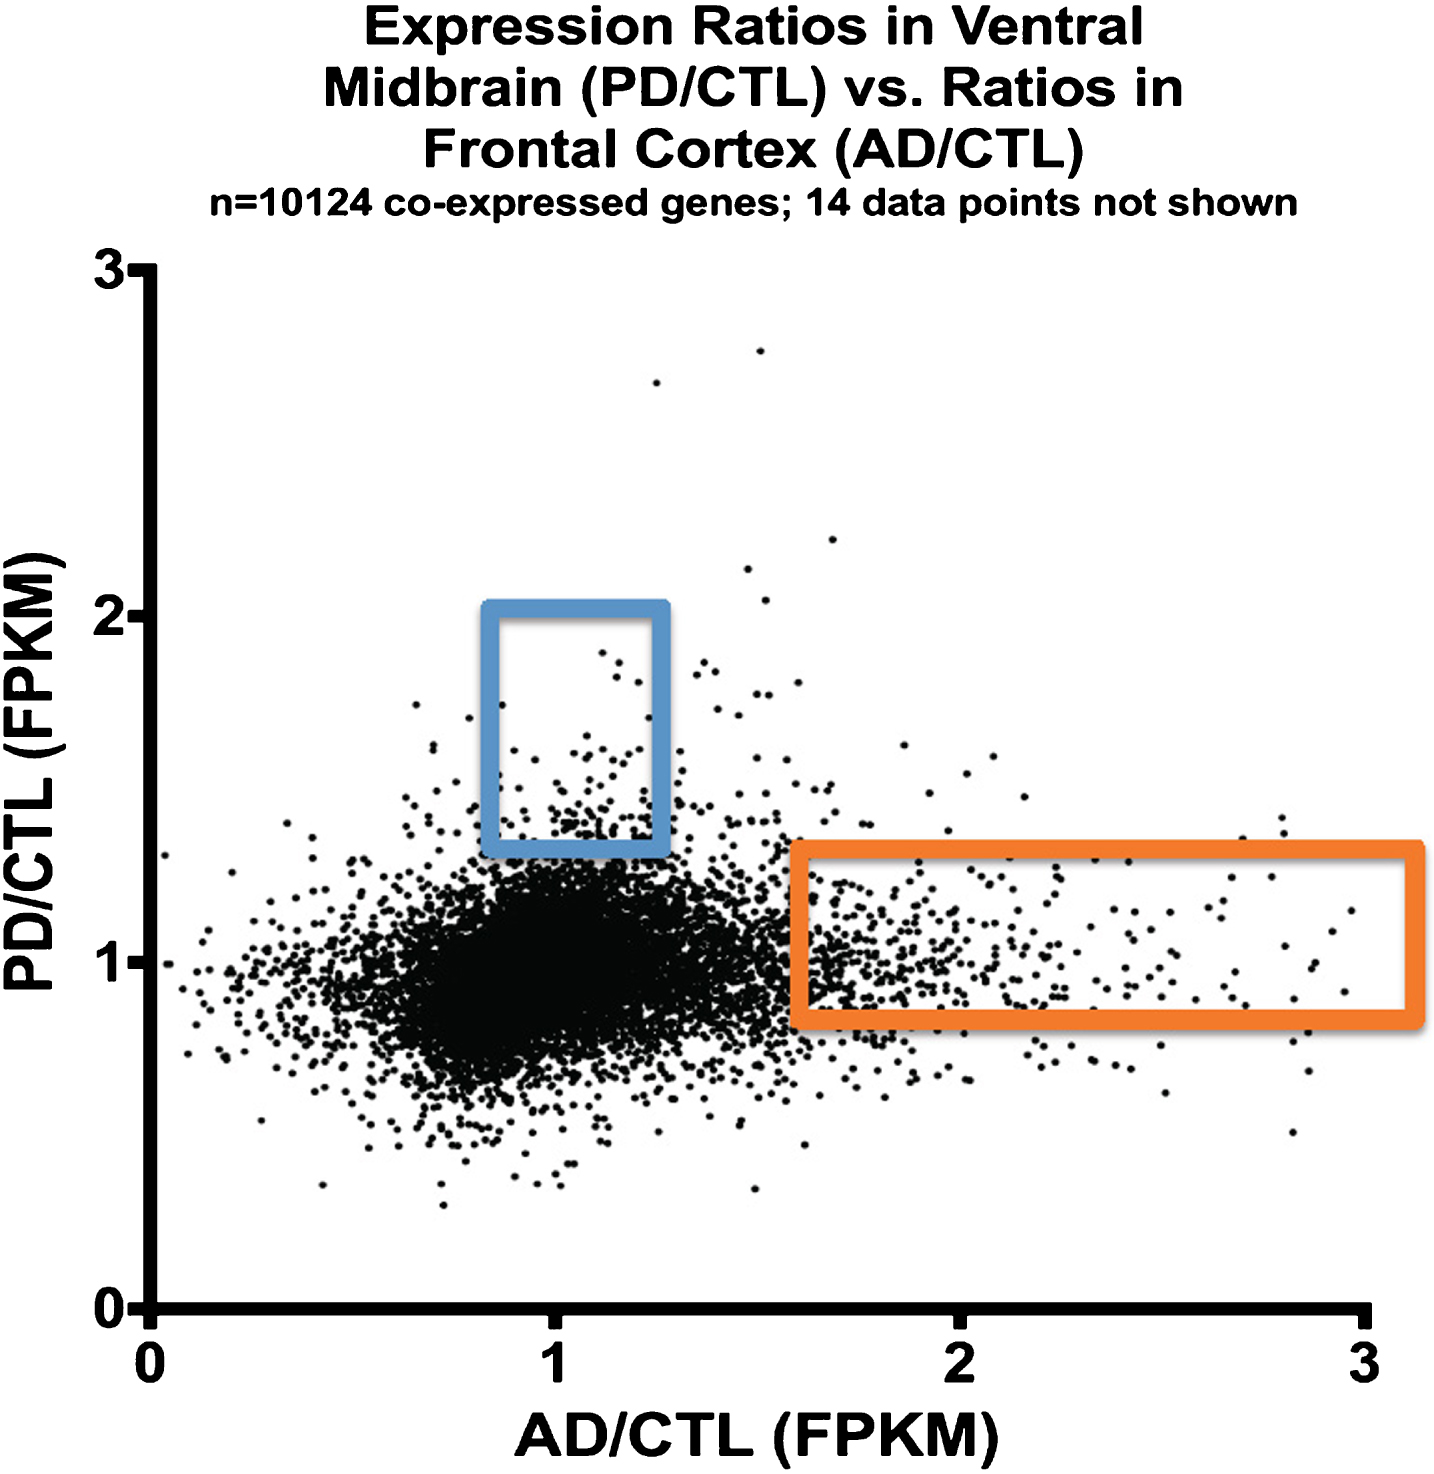
Plot of expression ratios (PD/CTL versus AD/CTL) in postmortem samples of 10,124 co-expressed genes. Note that most genes are near ratio values of 1.0. The blue rectangle denotes genes that are relatively over-expressed in PD, and the orange rectangle denotes genes relatively over-expressed in AD.
Table 2 shows that among these 10,124 co-expressed genes in both PD and AD samples, there is a small number that have both small variances (<150) in PD and AD populations and are under-expressed in both PD and AD populations (Fold Change (FC) <0.67). For these genes, a metric is calculated, the “gene expression index” (GEI), that is the product of variance X expression ratio (AD/CTL, or PD/CTL). Genes with the smallest GEI would be predicted to influence the largest number of subjects with either condition (or both conditions). This would occur under at least two conditions: 1) The expression of the gene could be increased; and 2) The reduced expression is causal to the disease process and not solely secondary to the disease process.
Genes expressed in AD samples (left group) or PD samples (right group) from among those co-expressed (n = 10,124) that had both low variances (<150) in their respective sample populations and under-expression (disease/CTL < 0.67). These genes are potential target for therapy development (see text for details)
Figure 4 shows a more traditional heatmap of gene expression, hierarchically clustered, where false discovery rates (FDR, q) are <5% and fold-changes in expression are 1.3 for the AD and 1.5 for the PD samples. In both cases it is possible to define gene groups that allow separation of the samples into disease compared to CTL. There is no overlap among these gene groups (data not shown).
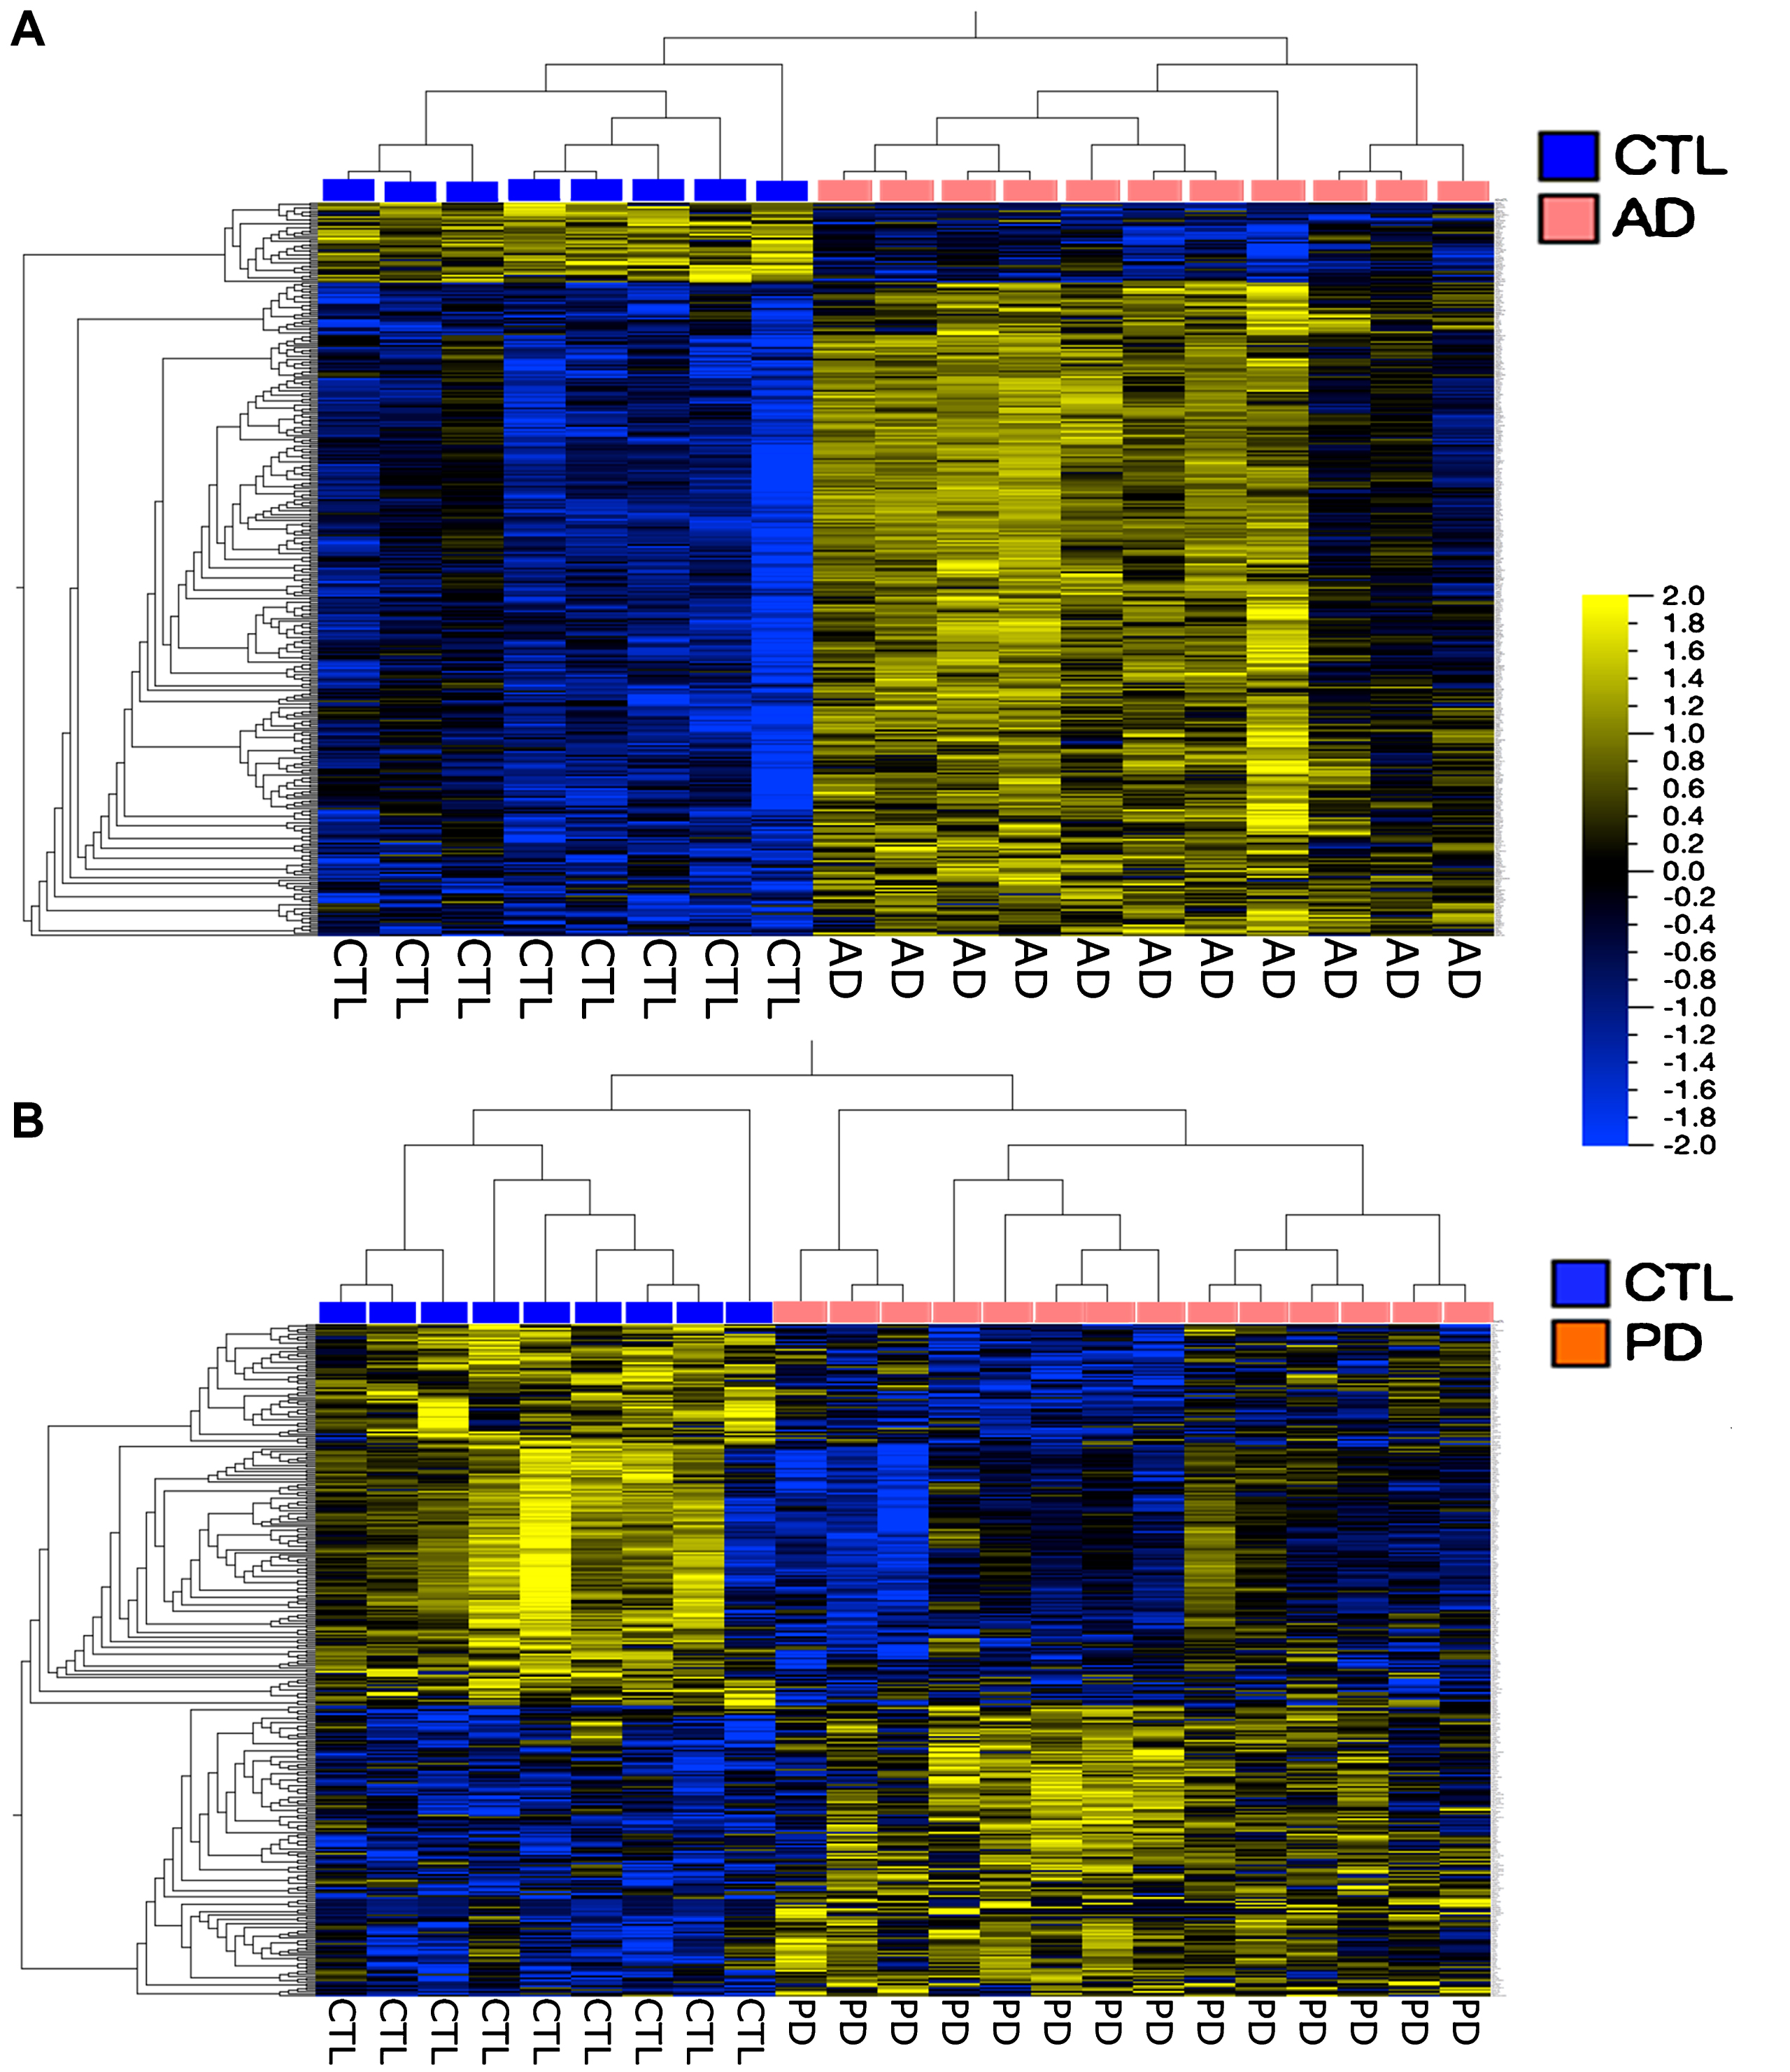
Heatmaps of genes hierarchically clustered from the AD population (A) (q < 5%, Fold Change > 1.3); and the PD population (B) (q < 5%, Fold Change > 1.5). Note that these analyses separated the AD and PD populations from their respective CTL samples. Both heatmaps were created in Qlucore using FPKM normalization.
DISCUSSION
In this paper we have presented both a comparison of RNA-seq datasets between PD and AD samples and a novel approach to using this data to predict treatment paradigms to be tested in these populations. We found extensive heterogeneity within both PD and AD groups and a small group of co-expressed genes that demonstrated both low variation among subjects (manifested as low variance) and reduced expression in both conditions (manifested as averaged disease/CTL ratios of 0.67 or less).
We propose that traditional analytic approaches to RNA-seq data reduction are of limited help in providing directions for therapeutic trials, likely as a result of the extensive heterogeneity in the samples. We found that developing gene lists based on false discovery rate estimation and hierarchical clustering, while separating the two populations (PD or AD versus CTL), did not provide insights into therapeutic development likely to help most subjects.
We propose a new approach, based on the GEI, that is a mathematical product of gene expression variance (square of standard deviation) and gene expression ratio. Genes with the lowest GEI would be worthy of increased expression, either directly (e.g., by vector-mediated expression) or indirectly (e.g., by small molecule inducers or alteration of microRNA expression modifiers). Low GEI value genes would, by virtue of their low variance, be predicted to have effects on the greatest numbers of afflicted persons.
This argument assumes that genes with low GEI values are causally related to the disease process and not simply adaptive changes to the disease process. This may require empirical testing of many different genes. Low GEI value genes could potentially also serve as biomarkers to be followed both as response metrics to therapies that alter these genes and as selection criteria to be used for genes to be altered in a given individual. Such a “personalized therapy” approach does not follow the usual single agent model of drug development that has been so successful for agents of certain classes, but which has failed so far to provide disease alteration in more complex conditions such as neurodegeneration.
Based on our results and the apparent involvement of these genes in PD and/or AD, we propose increased expression in CNS of the following genes in PD and AD subjects, who might share both disease processes. Other genes from Table 1 could also be proposed:
We are particularly intrigued by the last gene discussed (
Footnotes
ACKNOWLEDGMENTS
This research was supported by Neurodegeneration Therapeutics, Inc, (NTI) an IRS-registered 501(c)3 non-profit medical research company. Brain samples were collected and stored at – 80 degrees under an IRB-approved protocol (UVa) or were certified as autopsy material and IRB permission was waived (VCU). JPB designed the study, performed all bioinformatics analyses and wrote the manuscript draft. PMK supervised acquisition and storage of all brain samples and autopsy records, sectioned all brain samples, extracted, purified and analyzed all RNA samples and supervised transfer of RNA samples to Cofactor Genomics (CFG). Both authors reviewed and approved the final manuscript and declare no conflicts-of-interest for this study. CFG carried out all sequencing library preparation and quantification, performed Illumina® paired-end sequencing and provided all compressed sequencing files.
All data generated are the property of NTI and will be made available upon request from the Corresponding Author following execution of a Material Transfer Agreement and provision of either an FTP site URL or memory storage device(s) of at least 200 GB capacity.
We thank Dr. S. Churn at Virginia Commonwealth University (VCU) for assistance in obtaining demographic and clinical data on some of the PD samples, Dr. B. Wilson at CFG for assistance in obtaining RNA sequencing data and Dr. S. Strandberg for assistance in using QOE.