
Abstract
Background
Multiple sclerosis-associated genetic variants indicate that the adaptive immune system plays an important role in the risk of developing multiple sclerosis. It is currently not well understood how these multiple sclerosis-associated genetic variants contribute to multiple sclerosis risk. CD4+ T cells are suggested to be involved in multiple sclerosis disease processes.
Objective
We aim to identify CD4+ T cell differential gene expression between multiple sclerosis patients and healthy controls in order to understand better the role of these cells in multiple sclerosis.
Methods
We applied RNA sequencing on CD4+ T cells from multiple sclerosis patients and healthy controls.
Results
We did not identify significantly differentially expressed genes in CD4+ T cells from multiple sclerosis patients. Furthermore, pathway analyses did not identify enrichment for specific pathways in multiple sclerosis. When we investigated genes near multiple sclerosis-associated genetic variants, we did not observe significant enrichment of differentially expressed genes.
Conclusion
We conclude that CD4+ T cells from multiple sclerosis patients do not show significant differential gene expression. Therefore, gene expression studies of all circulating CD4+ T cells may not result in viable biomarkers. Gene expression studies of more specific subsets of CD4+ T cells remain justified to understand better which CD4+ T cell subsets contribute to multiple sclerosis pathology.
Introduction
Multiple sclerosis (MS) is characterised by inflammation causing demyelination in the central nervous system (CNS). The disease typically presents in young adults and causes gradual loss of neurological functions. Women are two times more likely to develop MS compared to men. Known risk factors are genetic variants, epigenetic configuration, environmental factors and interaction between the genetic factors and the environment. 1 A significant enrichment of immune-related loci is observed among the genetic risk variants, in particular for T-helper cell-specific pathways. 2 Furthermore, histopathological examinations of MS lesions have shown that CD4+ T cells accumulate in MS lesions, further pointing out the participation of these cells in MS pathology.3–6
Gene expression profiling of samples from MS patients compared to healthy controls has been performed in whole blood and peripheral blood mononuclear cells (PBMCs). These studies estimated gene expression using predominantly microarrays. While some studies did not find any significant genes, other studies reported significant differential expression for MS without any of these genes being reported in independent additional studies.7–9 A major drawback of an approach testing whole blood or PBMCs is that gene expression profiles differ between different cell types. Such differences in cellular composition may lead to failure to detect differentially expressed genes in subsets of cells due to the noise from other cell types. Given earlier studies that show that CD4+ T cells play a role in the aetiology of MS,3,5 an approach with a focus on these immune cells may be more likely to detect MS-associated gene expression differences. Indeed, based on pathway or gene-set enrichment analyses, the studies on whole blood or PBMCs agree on a likely role for genes active in T cells. In addition, studies focusing on activated CD4+ T cells or CD4+ T cells from MS patients and healthy controls reported gene panels that may serve as a biomarker for MS activity and treatment response.10,11
The majority of young MS patients are treated with immunomodulatory drugs, which is likely to affect the gene expression of immune cells. In our study, we aimed to identify differential gene expression of CD4+ T cells between MS patients and healthy controls. We applied RNA sequencing to purified CD4+ T cells from 20 untreated MS patients and 20 healthy controls. By sampling patients before treatment, we ensured that medication-induced gene expression changes did not interfere with an MS-related gene expression profile.
Materials and methods
Patients and healthy controls
Untreated, female MS patients with relapsing–remitting MS and no other autoimmune disorders (N = 20) were recruited from the MS clinic at the Oslo University Hospital. The patients were diagnosed according to the 2010 McDonald diagnostic criteria 12 and were in remission during blood sampling. Healthy, age-matched female controls (N = 20) were recruited either through asking patients to identify an unrelated control from their social network or from hospital employees. All patients and healthy controls provided informed consent for this study, which was approved by the local medical ethical committee (REK2011/1846).
Purification of CD4+ T cells
Whole blood was drawn into ethylenediamine tetraacetic acid (EDTA)-coated vacuum tubes (Med-Kjemi AS, Norway). Within 2 hours, PBMCs were purified using lymphoprep (Axis Shield, Scotland). The PBMCs were washed using phosphate-buffered saline (PBS) and cell density was estimated using an automated cell counter. Cells were resuspended at a density of 1 × 10⁸ cells per ml in purification buffer (1 mM EDTA and 2% FCS in PBS).
CD8+ T cells were removed by positive selection using an Automacs cell separation column (Milteny, Israel) and the CD8+ positive selection kit (Milteny, kit #130-045-201). CD4+ T cells were purified by negative selection on an Automacs cell separation column and the CD4+ negative selection kit (Milteny, kit #130-091-155). The cell density was estimated using an automated cell counter and aliquots of CD4+ T cells were pelleted and resuspended in 350 μl RNAprotect cell reagent (Qiagen, The Netherlands).
RNA library preparation and sequencing
RNA was isolated according to the manufacturer’s protocol using RNAeasy micro columns (Qiagen) and QIAshredder (Qiagen) to homogenise the cell lysate. RNA concentration was estimated by use of the Nanodrop ND-1000 Spectrophotometer (Thermo Fisher Scientific Inc., Norway). A selection of RNA samples was checked for integrity using an Agilent 2100 Bioanalyser (Agilent, UK) yielding RIN values above 7.0. 250 ng of RNA was processed using the TruSeq stranded mRNA library preparation kit # RS-122-2001 (Illumina, USA) according to the manufacturer’s protocol. Indexed libraries were sequenced by multiplexing four bar-coded libraries per lane on an Illumina HiSeq 2500 using a 100 bp paired-end sequencing run. In total, 10 sequencing lanes on two flow cells were used.
Data processing
FastQ-files were processed by using the program ‘kallisto’ 13 and ‘HomoSapiens.GRCh38.cDNA’ transcriptome as the reference sequence. Quality controls and differential expression analysis were performed in R3.4.2. Per-sample per-transcript read counts for genes were loaded into the DESeq2 package 14 using the ‘tximport’ function of the ‘tximport’ package. 15 To identify outliers, multidimensional scaling (MDS) with two coordinates was performed on transcript counts with at least 50 observations in every sample. Surrogate variable analysis was performed using the ‘R’ package ‘svaseq’ 16 to account for hidden confounders in the data.
Differential expression analysis
The ‘DeSeq2’ package in R was used for differential expression analysis. 14 The design matrix included surrogate variables in addition to the case–control status. In order to account for multiple testing, we applied a false discovery rate correction using the option ‘Benjamini and Hochberg’ in the DeSeq2 package. Adjusted P values below 0.05 were considered significant. A power analysis was performed based on the observed effect sizes in this study. The power analysis is provided in the Supplementary data.
Testing for enrichment of genome-wide association study-implicated genes
From the annotation provided for the 200 genetic variants associated with MS not in the human leukocyte antigen (HLA) region2, 295 gene IDs were extracted. From the expressed genes in the current CD4+ T cell dataset, the MS-associated proportion of those that were not significantly (nominal P value above 0.05) differentially expressed was compared against those that were significantly (nominal P value below 0.05) differentially expressed using chi-square statistics.
Pathway analysis
Genes with adjusted P values in the differential expression analysis below three thresholds (0.1, 0.2 and 0.4) were imported into QIAGEN’s Ingenuity pathway Analysis software (IPA, QIAGEN, Redwood City, CA, USA, version 45868156, build version 484108M). The input for the pathway analysis was the differential expression ratios and associated P values for the respective genes. Default analysis settings were used with the following confidence for species and tissues and cells, ‘mouse OR rat OR human’ (species) and ‘only T cells (primary and cell lines)’ (tissues/cell lines). Multiple testing correction was done accordingly using the ‘Benjamini and Hochberg’ option.
Results
Details of the patients and healthy controls in this study are provided in Table 1. Supplementary Table 1 lists the per-sample clinical characteristics and total number of mapped reads against the reference transcriptome. By performing MDS of the mapped reads per gene and plotting the coordinates (MDS plot, Supplementary Figure 1), we identified one outlier sample, which was subsequently removed from further analysis. Data from 20 MS patients and 19 healthy controls remained for differential gene expression analysis.
Characteristics of MS patients and healthy controls.

MS: multiple sclerosis; EDSS: Expanded Disability Status Scale; OCB+: positive for oligoclonal bands.
As mapping against the transcriptome is unreliable for hypermorphic genes, 17 we excluded genes from the HLA region in this analysis. The surrogate variable analysis identified seven surrogate variables for this dataset, which were included in the final model. Supplementary Figures 2–6 show plots of the values of these surrogate variables against a selection of measured variables such as sequencing run, Expanded Disability Status Scale (EDSS) and smoking status. After correcting for multiple testing according to the Benjamini and Hochberg false discovery rate, we observed no differential expression for any single gene. A summary of the analysis for all genes in our dataset is presented in Supplementary Table 2. The five genes that almost reached significant differential expression displayed very modest fold changes (absolute fold change 1.10 to 1.22, Table 2, Figure 1).

Boxplots of the five most consistently differentially expressed genes in CD4+ T cells from multiple sclerosis (MS) patients compared to healthy controls (HC). (a) RPL21P16; (b) RBM27; (c) CAMK4; (d) LIMK2; (e) CLUAP1. Individual expression levels are presented for healthy controls (square dots) and MS patients (triangular dots). The boxes delimit 25% and 75% of the values; the horizontal bars represent the median value. The whiskers represent values that do not exceed a distance of 1.5 times the interquartile range from the middle 50% of the data.
Genes with lowest corrected P values.
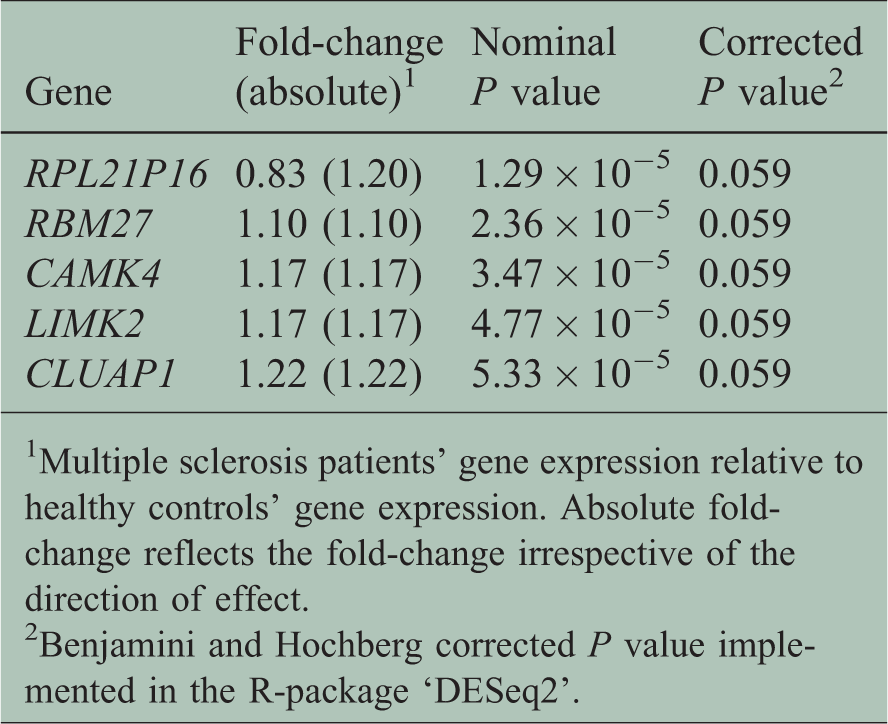
1Multiple sclerosis patients’ gene expression relative to healthy controls’ gene expression. Absolute fold-change reflects the fold-change irrespective of the direction of effect.
2Benjamini and Hochberg corrected P value implemented in the R-package ‘DESeq2’.
Biological processes are in general not the result of the activity of a single gene but rather the result of interactions between several genes in one or multiple pathways. In addition, MS is a complex disease in which also the interplay between genes is involved in its aetiology. We therefore investigated whether the genes reaching adjusted P value thresholds of 0.1 (16 genes), 0.2 (45 genes) and 0.4 (141 genes) showed enrichment for specific genetic pathways. The genes included in these three pathway analyses are indicated in Supplementary Table 2. On correction for multiple testing, we did not observe any pathway that was significantly overrepresented (Supplementary Tables 3–5).
Large-scale genetic association studies identified close to 200 non-HLA gene regions associated with MS. 2 We investigated whether nominally significant genes in our differential expression analysis had an overrepresentation of genes which are close to these MS-associated loci. Of the 295 genes annotated near MS-associated genetic variants, 189 genes were present in our expression data. We observed a nominally significant differential expression of 17 genes in this list of 189 genome-wide association study (GWAS)-implicated genes, whereas 928 genes were nominally significantly differentially expressed of the total of 12,623 genes present in our data. The chi-square statistic for the comparison of the proportions of differentially expressed genes against the expected number from our data is not significant (P value 0.46) indicating there is no overrepresentation of MS-associated genes in the list of nominally differentially expressed genes.
We have previously identified four gene regions that display differential DNA methylation in CD4+ T cells from MS patients compared to healthy controls. 18 We have shown significant DNA methylation differences in the HLA, MOG, NINJ2 and SLFN12 gene regions. We did not investigate gene expression in the HLA region, whereas MOG was not expressed in CD4+ T cells. In our previous study, NINJ2 and SLFN12 showed higher levels of DNA methylation in MS patients. These genes showed a trend towards lower expression in the MS patients (Supplementary Figure 7(a) and (b)). Furthermore, others identified significantly lower expression of EOMES and TBX21(9) in whole blood. When we specifically investigate these two genes, we also observed a trend towards lower expression for both EOMES and TBX21 (Supplementary Figure 7(c) and (d)). None of the genes previously implicated in earlier MS genomics studies reached significance in our current gene expression study.
Discussion and conclusion
In this study, we compared the gene expression profiles of CD4+ T cells obtained from untreated MS patients and healthy controls and did not observe differential gene expression. This leads us to conclude that there are no large-scale changes of gene expression in CD4+ T cells from MS patients. Pathological processes in MS are likely to be involving several genes in biological pathways in a complex interaction. We therefore performed a pathway analysis for genes that reached three thresholds of P values for differential expression. This did not give indications for any significant differences in biological pathways for CD4+ T cells from MS patients compared to healthy controls.
Earlier, we performed DNA methylation studies of immune cells from MS patients included in the current study. We showed significant DNA methylation differences in the HLA, MOG, NINJ2 and SLFN12 gene regions. 18 The HLA region was not considered in the current study, whereas the MOG gene was not expressed by the CD4+ T cells. Both the NINJ2 and SLFN12 genes showed a non-significant trend towards lower gene expression. Furthermore, a study by Parnell et al. showed a significantly lower expression of EOMES and TBX21 genes in the whole blood of MS patients. 9 We observed similar directions of effect for the expression of EOMES and TBX21 in CD4+ T cells of MS patients; however, these were not significant. We note that while our study was focused on CD4+ T cells, Parnell et al. investigated whole blood gene expression. In order to estimate the required sample size for the observed differences to reach significance on multiple testing we performed a power analysis (provided in the Supplementary data). The number of patients and controls required to reach 90% power to detect significant differential gene expression for the strongest gene in our dataset (RPL21P16) is 95. The number of patients and controls to reach 90% power for the strongest candidate gene EOMES is 314, while for the weakest candidate gene SLFN12 a number of 177,315 patients and controls is needed. Gene expression studies of over 100 patients and controls are feasible; however, gene expression studies of an order of magnitude larger become increasingly difficult at the current cost for sequencing and the logistics involved. Furthermore, the value of these small differences observed would be limited in a diagnostic setting.
Gurevich et al. reported a gene expression panel for CD4+ T cells consisting of 42 genes as a good indicator of disease status. 11 When we perform a principal component analysis using the genes in that panel (we detected 25 out of 42 reported genes in our data) we did not observe the strong clustering of MS patients observed by Gurevich et al. We note that not all genes assessed by Gurevich et al. were represented in our dataset, possibly the addition of those genes in the panel will improve the clustering. Furthermore, the MS patients in our study are relatively benign in their disease course; including patients with a more aggressive disease course might improve the clustering power of this gene panel. In rheumatoid arthritis (RA), an approach with a focus on gene expression of CD4+ T cells from untreated RA patients and disease controls has shown promising results in identifying marker genes that had good specificity and sensitivity in predicting RA. 19 Although the study in RA was performed using larger samples of patients and controls compared to our study, the magnitude of changes observed in the RA patients was not observed in our study. Larger gene expression studies of all CD4+ T cells from MS patients are therefore not likely to result in a useful panel of genes that may serve as a biomarker for MS. An approach in which the CD4+ T cells are activated prior to a gene expression analysis may result in more pronounced gene expression differences, illustrated in an MS study by Hellberg et al. 10 and a study in coeliac disease by Quinn et al. 20 The patients in our current study are in the relapsing–remitting phase of MS and the blood samples in our current study were drawn during remission. Therefore, we cannot exclude that CD4+ T cells display differential gene expression during relapses, during which there are considerable changes observed in the patients’ immune profile. 21
The use of a sequencing approach is a strength of this study as the resolution is much higher as compared to a microarray-based gene expression experiment, allowing us to detect more subtle differences in gene expression. In spite of this high resolution, we did not detect any significant differentially expressed genes. A further strength of our study is the use of purified CD4+ T cells, which have been shown to be important in MS pathology. T cells circulate in whole blood, where gene expression originating from other cell types present in whole blood may introduce large amounts of noise in gene expression analysis. By specifically investigating CD4+ T cells, we obtained a clear insight into whether CD4+ T cells show differential gene expression in MS. Based on our current study, we conclude that the overall gene expression of CD4+ T cells has no potential use as a biomarker for distinguishing MS patients from healthy controls. We note that we did not investigate the HLA region, which is the most strongly associated gene region for MS. We excluded analysis of the genes in the HLA region due to the hypermorphic nature of the HLA region and the subsequent inaccuracy when mapping these genes against the transcriptome. This leaves the possibility open that genes in this region display significant differential expression between MS patients and healthy controls. Furthermore, it should be noted that the CD4+ T cells are composed of several subtypes of CD4+ T cells, such as T-helper types 1 and 2, T regulatory and T-helper type 17 cells. The possibility remains that specific CD4+ T cell subsets indeed display differential gene expression in MS. Future gene expression studies should aim specifically to characterise CD4+ T cell subsets. Furthermore, CD4+ T cells that are present in the lesions in the CNS may be different from the circulating T cells obtained from whole blood. Gene expression of the T cells circulating in whole blood may not reflect gene expression of T cells that are homing in on the CNS or MS-related lesions, 6 thereby leaving the possibility that large gene expression differences can be observed when focusing on CNS-derived T cells. It remains to be investigated whether the gene expression of specific subsets of T cells, or T cells that are obtained from MS lesions show differential gene expression.
In conclusion, we showed no differential gene expression in thw CD4+ T cells of MS patients. Based on this study, transcriptomic profiles of CD4+ T cells are therefore not suitable as biomarkers in MS diagnosis. Studies that focus on specific subsets of CD4+ T cells, T cells derived from MS lesions or T cells collected during relapses are warranted to provide better insights into how T cells contribute to MS pathology.
Supplemental Material
Supplemental Material1 - Supplemental material for No differential gene expression for CD4+ T cells of MS patients and healthy controls
Supplemental material, Supplemental Material1 for No differential gene expression for CD4+ T cells of MS patients and healthy controls by Ina S Brorson, Anna Eriksson, Ingvild S Leikfoss, Elisabeth G Celius, Pål Berg-Hansen, Lisa F Barcellos, Tone Berge, Hanne F Harbo and Steffan D Bos in Multiple Sclerosis Journal – Experimental, Translational and Clinical
Supplemental Material
Supplemental Material2 - Supplemental material for No differential gene expression for CD4+ T cells of MS patients and healthy controls
Supplemental material, Supplemental Material2 for No differential gene expression for CD4+ T cells of MS patients and healthy controls by Ina S Brorson, Anna Eriksson, Ingvild S Leikfoss, Elisabeth G Celius, Pål Berg-Hansen, Lisa F Barcellos, Tone Berge, Hanne F Harbo and Steffan D Bos in Multiple Sclerosis Journal – Experimental, Translational and Clinical
Supplemental Material
Supplemental Material3 - Supplemental material for No differential gene expression for CD4+ T cells of MS patients and healthy controls
Supplemental material, Supplemental Material3 for No differential gene expression for CD4+ T cells of MS patients and healthy controls by Ina S Brorson, Anna Eriksson, Ingvild S Leikfoss, Elisabeth G Celius, Pål Berg-Hansen, Lisa F Barcellos, Tone Berge, Hanne F Harbo and Steffan D Bos in Multiple Sclerosis Journal – Experimental, Translational and Clinical
Supplemental Material
Supplemental Material4 - Supplemental material for No differential gene expression for CD4+ T cells of MS patients and healthy controls
Supplemental material, Supplemental Material4 for No differential gene expression for CD4+ T cells of MS patients and healthy controls by Ina S Brorson, Anna Eriksson, Ingvild S Leikfoss, Elisabeth G Celius, Pål Berg-Hansen, Lisa F Barcellos, Tone Berge, Hanne F Harbo and Steffan D Bos in Multiple Sclerosis Journal – Experimental, Translational and Clinical
Supplemental Material
Supplemental Material5 - Supplemental material for No differential gene expression for CD4+ T cells of MS patients and healthy controls
Supplemental material, Supplemental Material5 for No differential gene expression for CD4+ T cells of MS patients and healthy controls by Ina S Brorson, Anna Eriksson, Ingvild S Leikfoss, Elisabeth G Celius, Pål Berg-Hansen, Lisa F Barcellos, Tone Berge, Hanne F Harbo and Steffan D Bos in Multiple Sclerosis Journal – Experimental, Translational and Clinical
Supplemental Material
Supplemental Material6 - Supplemental material for No differential gene expression for CD4+ T cells of MS patients and healthy controls
Supplemental material, Supplemental Material6 for No differential gene expression for CD4+ T cells of MS patients and healthy controls by Ina S Brorson, Anna Eriksson, Ingvild S Leikfoss, Elisabeth G Celius, Pål Berg-Hansen, Lisa F Barcellos, Tone Berge, Hanne F Harbo and Steffan D Bos in Multiple Sclerosis Journal – Experimental, Translational and Clinical
Footnotes
Acknowledgements
The authors acknowledge the contributions from the patients and healthy controls in their studies and the health personnel involved in drawing blood samples. This project received unrestricted research grants from the Odd Fellow Society Norway and Sanofi Genzyme. The sequencing service was provided by the Norwegian Sequencing Centre (![]() ), a national technology platform hosted by the University of Oslo and supported by the ‘Functional Genomics’ and ‘Infrastructure’ programmes of the Research Council of Norway and the South-Eastern Regional Health Authorities. The authors also thank Valeria Vitelli at the Department of Biostatistics of the University of Oslo for her assistance with the power analysis.
), a national technology platform hosted by the University of Oslo and supported by the ‘Functional Genomics’ and ‘Infrastructure’ programmes of the Research Council of Norway and the South-Eastern Regional Health Authorities. The authors also thank Valeria Vitelli at the Department of Biostatistics of the University of Oslo for her assistance with the power analysis.
Data access
For the purpose of MS-related research, requests to access raw data in this study can be addressed to grants@ous-hf.no.
Conflicts of interest
The author(s) declared no potential conflicts of interest with respect to the research, authorship, and/or publication of this article.
Funding
The author(s) disclosed receipt of the following financial support for the research, authorship, and/ or publication of this article: This work was funded through the Norwegian Research Council and the South-Eastern Norway Regional Health Authority.
References
Supplementary Material
Please find the following supplemental material available below.
For Open Access articles published under a Creative Commons License, all supplemental material carries the same license as the article it is associated with.
For non-Open Access articles published, all supplemental material carries a non-exclusive license, and permission requests for re-use of supplemental material or any part of supplemental material shall be sent directly to the copyright owner as specified in the copyright notice associated with the article.