
Abstract
Background:
The human sulfatase 1 (SULF1) and sulfatase 2 (SULF2) genes modulate cell signaling and homeostasis in many tissues. Gene expression analyses have implicated SULF2 in disease pathogenesis, including Alzheimer’s disease (AD), but changes in brain SULF2 expression have not been directly established.
Objective:
To investigate the expression of SULF1 and SULF2 in brain tissues from AD cases and cognitively normal controls.
Methods:
Autopsy tissue from AD cases (n = 20) and age-and gender-matched cognitively normal controls (n = 20) were identified from the Mayo Clinic Alzheimer’s Disease Patient Registry neuropathology database. Tissue slides were stained for SULF1 and SULF2 protein expression in the hippocampus and frontal lobe and an expression score computed from the proportion of cells stained and the intensity of staining (range 0 [no expression] to 9 [marked expression]).
Results:
SULF2 expression was reduced in AD cases. Compared to cognitively normal controls, SULF2 expression in AD cases was significantly decreased in the hippocampal Cornu Ammonis (CA) (mean score of 6.5 in cases versus 8.3 in controls; p = 0.003), in the gray matter of the parahippocampal gyrus (5.6 in cases versus 7.6 in controls; p = 0.003), and in the frontal lobe gray matter (5.4 in cases versus 7.4 in controls; p = 0.002). There was no difference in SULF1 expression in the hippocampus or frontal lobe of AD cases and controls. As expected there were no differences in SULF1 or SULF2 expression in white matter in AD cases compared to cognitively normal controls.
Conclusion:
Decreased SULF2 in specific regions of the brain occurs in AD.
INTRODUCTION
Dementias, of which Alzheimer’s disease (AD) is the most common, carry a substantial public health impact. Of the 5.4 million people with AD dementia in US, 5.2 million are aged 65 and older and 200,000 are less than 65 years old [1]. AD dementia is highly prevalent among older people: the prevalence increases from <1% in people aged less than 65 years old, to 3% in 65–74 year olds, 17% in 75–84 year olds, to 32% in people 85 years and older [2]. With 10,000 baby boomers reaching age 65 years every day, the number of people with AD dementia is projected to reach 13.8 million by 2050, with an estimated 1 million new cases per year [1]. Furthermore, AD dementia is the sixth leading cause of death in the US (5th among people aged 65 years and older) [3]. Efforts to reduce the burden of dementia rest in part on understanding the pathophysiology of AD. Magnetic resonance imaging indicates that atrophy in the hippocampal formation is common in AD [4, 5]. Studies in animals and humans show decreased neurogenesis in the hippocampus with age [6–9]. Synaptic plasticity also is dependent on the regulation of neurite outgrowth (neuritogenesis) [10, 11].
Neurogenesis and neuritogenesis are regulated by extracellular growth factors that control cell signaling [12]. The extracellular matrix contains proteoglycans comprised of core proteins with attached glycosaminoglycan (GAG) moieties, including heparan sulfate (HS) and chondroitin sulfate (CS) GAG chains. HS chains regulate the concentration and activity of several heparin-binding proteins (cytokines and growth factors). These include fibroblast growth factor 2 (FGF-2), a key mediator of neurogenesis [13], and brain-derived neurotrophic factor (BDNF), which regulates synaptic transmission and synaptic plasticity [14]. In addition, HS is associated with amyloid-β plaques [15].
The effects of heparin-binding proteins on cell signaling are dependent on the sulfation of HS chains and on the effects of HS sulfatases in the extracellular matrix. HS sulfation occurs at the 2-O, 3-O, and 6-O positions of the core HS disaccharide. Changes in sulfation of HS chains can alter the binding of HS to heparin-binding proteins, with varying effects on cell signaling. Particular HS sulfation patterns have been associated with brain development, angiogenesis, cancer, and AD [16–20]. Sulfatase 1 (SULF1) and sulfatase 2 (SULF2) are extracellular sulfatases that desulfate 6-O-sulfate groups on HS and thereby modulate growth factor and cell signaling, cell growth, development and differentiation, and homeostasis [16, 22]. Somewhat paradoxically, SULF1 and SULF2 do not always have the same effect on cell signaling pathways. They have been shown to have opposing actions on some angiogenesis and growth factor signaling pathways, such as the FGF2 signaling pathway. Thus, whereas SULF1 mitigates FGF2 signaling, SULF2 enhances FGF2 signaling [23]. However, in contrast to their opposing effects on FGF signaling, both SULF1 and SULF2 activate Wnt and TGFβ signaling which are important signaling pathways in development, differentiation, and carcinogenesis [24, 25].
Rat Sulf2 is expressed in different regions of the nervous system during development, but is confined to the cerebral cortex, hippocampal CA3 region, and medial habenular nucleus in the adult brain [26]. Changes in Sulf1 and Sulf2 expression modulate sulfation of glial cell HS and regulate FGF1 and FGF9 signaling in glial cells and control nervous system repair in rats [27] and mice [28]. While Sulf1 and Sulf2 are expressed in many different types of neurons in the nervous system, there are differences in their regional distribution, subcellular localization, and glycosylation in different parts of the nervous system [29].
It is hypothesized that changes in HS during aging may impact heparin-binding protein function. Higher levels of HSGAGs but not CSGAGs have been found in aged versus adult human hippocampal cells, particularly in regions with amyloid plaques [30]. Our previous work has also shown that certain genes differentially expressed in correlation with SULF2 are associated with AD and Lewy body dementia [24]. This body of knowledge suggests that changes in sulfatase expression could impair neurogenesis, neuritogenesis, and cell repair in the hippocampal formation and contribute to the pathogenesis of AD, and that this effect may, in turn, be regulated by the sulfatase genes. To determine whether sulfatase expression is related to AD pathology, we compared expression of SULF1 and SULF2 in autopsy specimens of subjects with and without AD.
MATERIALS AND METHODS
Subjects and autopsy specimens
All subjects had been enrolled in the community-based Mayo Alzheimer’s Disease Patient Registry (ADPR) [31–33]. Prior to death, all study subjects underwent annual cognitive testing and evaluation by a team of behavioral neurologists and neuropsychologists at the Mayo Alzheimer’s Disease Research Center to establish a diagnosis of AD based on published criteria or cognitively normal according to normative data from the Olmsted County population [34–39]. We identified subjects who died between 1999 and 2008 (n = 20) through the Mayo Clinic Alzheimer’s Disease Research Center neuropathology database and had a clinical diagnosis and neuropathological confirmation of AD. They were age and gender-matched with ADPR (n = 20) subjects who died within the same period as the case and were cognitively and pathologically normal.
Neuropathology
Postmortem brains of subjects were processed using standardized neuropathologic methods [40]. An experienced neuropathologist assessed a diagnosis of AD or normal pathology according to the CERAD rating scheme for plaques, NIA-Reagan criteria, and Braak and Braak staging [40–45]; Thal staging was not a part of the staging protocol at the time of this study.
Detection of SULF1 and SULF2
The antibodies used for immunohistochemical staining for SULF1 and SULF2 were rabbit polyclonal antibodies raised against peptides from human SULF1 (amino acids 677–699: CSKQSYYNKEKGVKKQEKLKSHL, Genbank accession number NM_015170) and SULF2 (amino acids 421–444: HKRDNDKVDAQEENFLPKYQRVKD, Genbank accession number NM_018837) which recognize human, mouse and rat SULF1 or SULF2, respectively [25, 46–49]. Detection of SULF1 and SULF2 expression was performed on formalin-fixed, paraffin-embedded (FFPE) samples which were deparaffinized with 3 changes of xylene, rehydrated in a series of alcohols (100%, 95%, then 70% EtOH), and rinsed well in running distilled water. Slides were placed in preheated 1 mM EDTA, pH 8.0 retrieval buffer for 30 min then cooled in the buffer for 5 min followed by a 5-min rinse in running distilled water. After the heat inactivated epitope retrieval (HIER) step, slides were placed on the DAKO Autostainer at room temperature. Sections were incubated with 3% H2O2 in ethanol for 5 min to inactivate endogenous peroxides. Sections were incubated in anti-SULF1 polyclonal antibody (1 : 150) or anti-SULF2 polyclonal antibody (1 : 100) for 30 min followed by rinsing with Tris Buffered Saline with Tween 20 (Polysorbate 20) (TBST) wash buffer and then incubated for 15 min in secondary antibody ADVANCE HRP polymer (DAKO Cytomation, Carpenteria, CA). Sections were then rinsed with TBST wash buffer, incubated in 3,3’-diaminobenzidine (DAB+)(DAKO Cytomation, Carpenteria, CA) for 5 min, and counterstained with Modified Schmidt’s Hematoxylin for 5 min. The sections were then rinsed in tap water for 3 min, dehydrated through graded alcohols, cleared in 3 changes of xylene, and mounted with permanent mounting media. Positive and negative controls confirming specificity of the immunostaining using small intestine are shown in Supplementary Figure 1. Negative controls were set up by replacement of the primary antibody with 1% BSA-TBS. All negative control specimens showed no non-specific staining.
Assessment of SULF expression
Each stained slide was reviewed by a pathologist (Y.N.K.) to assess expression of SULF1 and SULF2 in the hippocampus (including the entire CA region) and frontal lobe. The proportion of cells stained was scored as: no staining = 1, <25% = 2, 26–50% = 3, >50% = 4. The intensity of staining was scored as: none = 0, weak = 1, moderate = 2, and strong = 3. SULF expression was computed as the product of the proportion of cells stained and the intensity of staining; the scores ranged from 0 to 9 (none = 0, weak = 1, moderate = 2, marked = 4, 6, or 9). In the regions with a predominance of neurons, the neuronal staining was the major contributor to the scoring, whereas in the regions with a predominance of glial cells in the white matter, staining of the glial cells was scored. The neuropathologist who reviewed the autopsy specimen, the technologist who stained the slides and the pathologist who scored SULF1 and SULF2 expression were blinded to the diagnosis of the subjects.
Statistics
We compared AD cases and cognitively normal controls in regard to expression of SULF1 and SULF2 in the gray and white matter of the hippocampus and frontal lobe using the non-parametric Wilcoxon rank sum test (SAS version 9, SAS Institute Inc., Cary, NC).
RESULTS
The mean age (standard deviation) of subjects at autopsy was 86.6 (SD = 6.24). Consistent with the matching design there was no difference in the mean age between cases (86.9 [6.3]) and cognitively normal controls (86.4 [6.4]) (Table 1). There were also equal proportions of women (n = 13 [65%]) in the AD cases and cognitively normal controls (Table 1). The distribution of Braak staging was stage V (n = 4, 20%) or VI (16, 80%) in AD cases, and stage I (n = 8, 40%), II (n = 7, 35%) or III (n = 5, 25%) in cognitively normal controls. The NIA Reagan criteria score was high in all AD cases, and negative or low in cognitively normal controls.
Demographics, SULF1, and SULF2 measurements by cognitive status
*Composite immunohistochemistry score: proportion of cells stained by intensity of staining.
SULF2 expression
There was decreased staining of SULF2 in AD cases compared to cognitively normal controls in the hippocampus and in the frontal lobe (Fig. 1). Compared to cognitively normal controls, the expression of SULF2 in AD cases was significantly lower in the hippocampal CA region (mean score in cases: 6.5 versus 8.3 in controls; p = 0.003), in the parahippocampal gray matter (mean score in cases: 5.6 versus 7.6 in controls; p = 0.003), and in the frontal lobe gray matter (5.4 versus 7.4 in controls; p = 0.002) (Fig. 2). However, as expected, there was no difference in SULF2 expression in the white matter of the hippocampus or the frontal lobe (Fig. 2). This is expected as there is minimal AD pathology in the white matter.
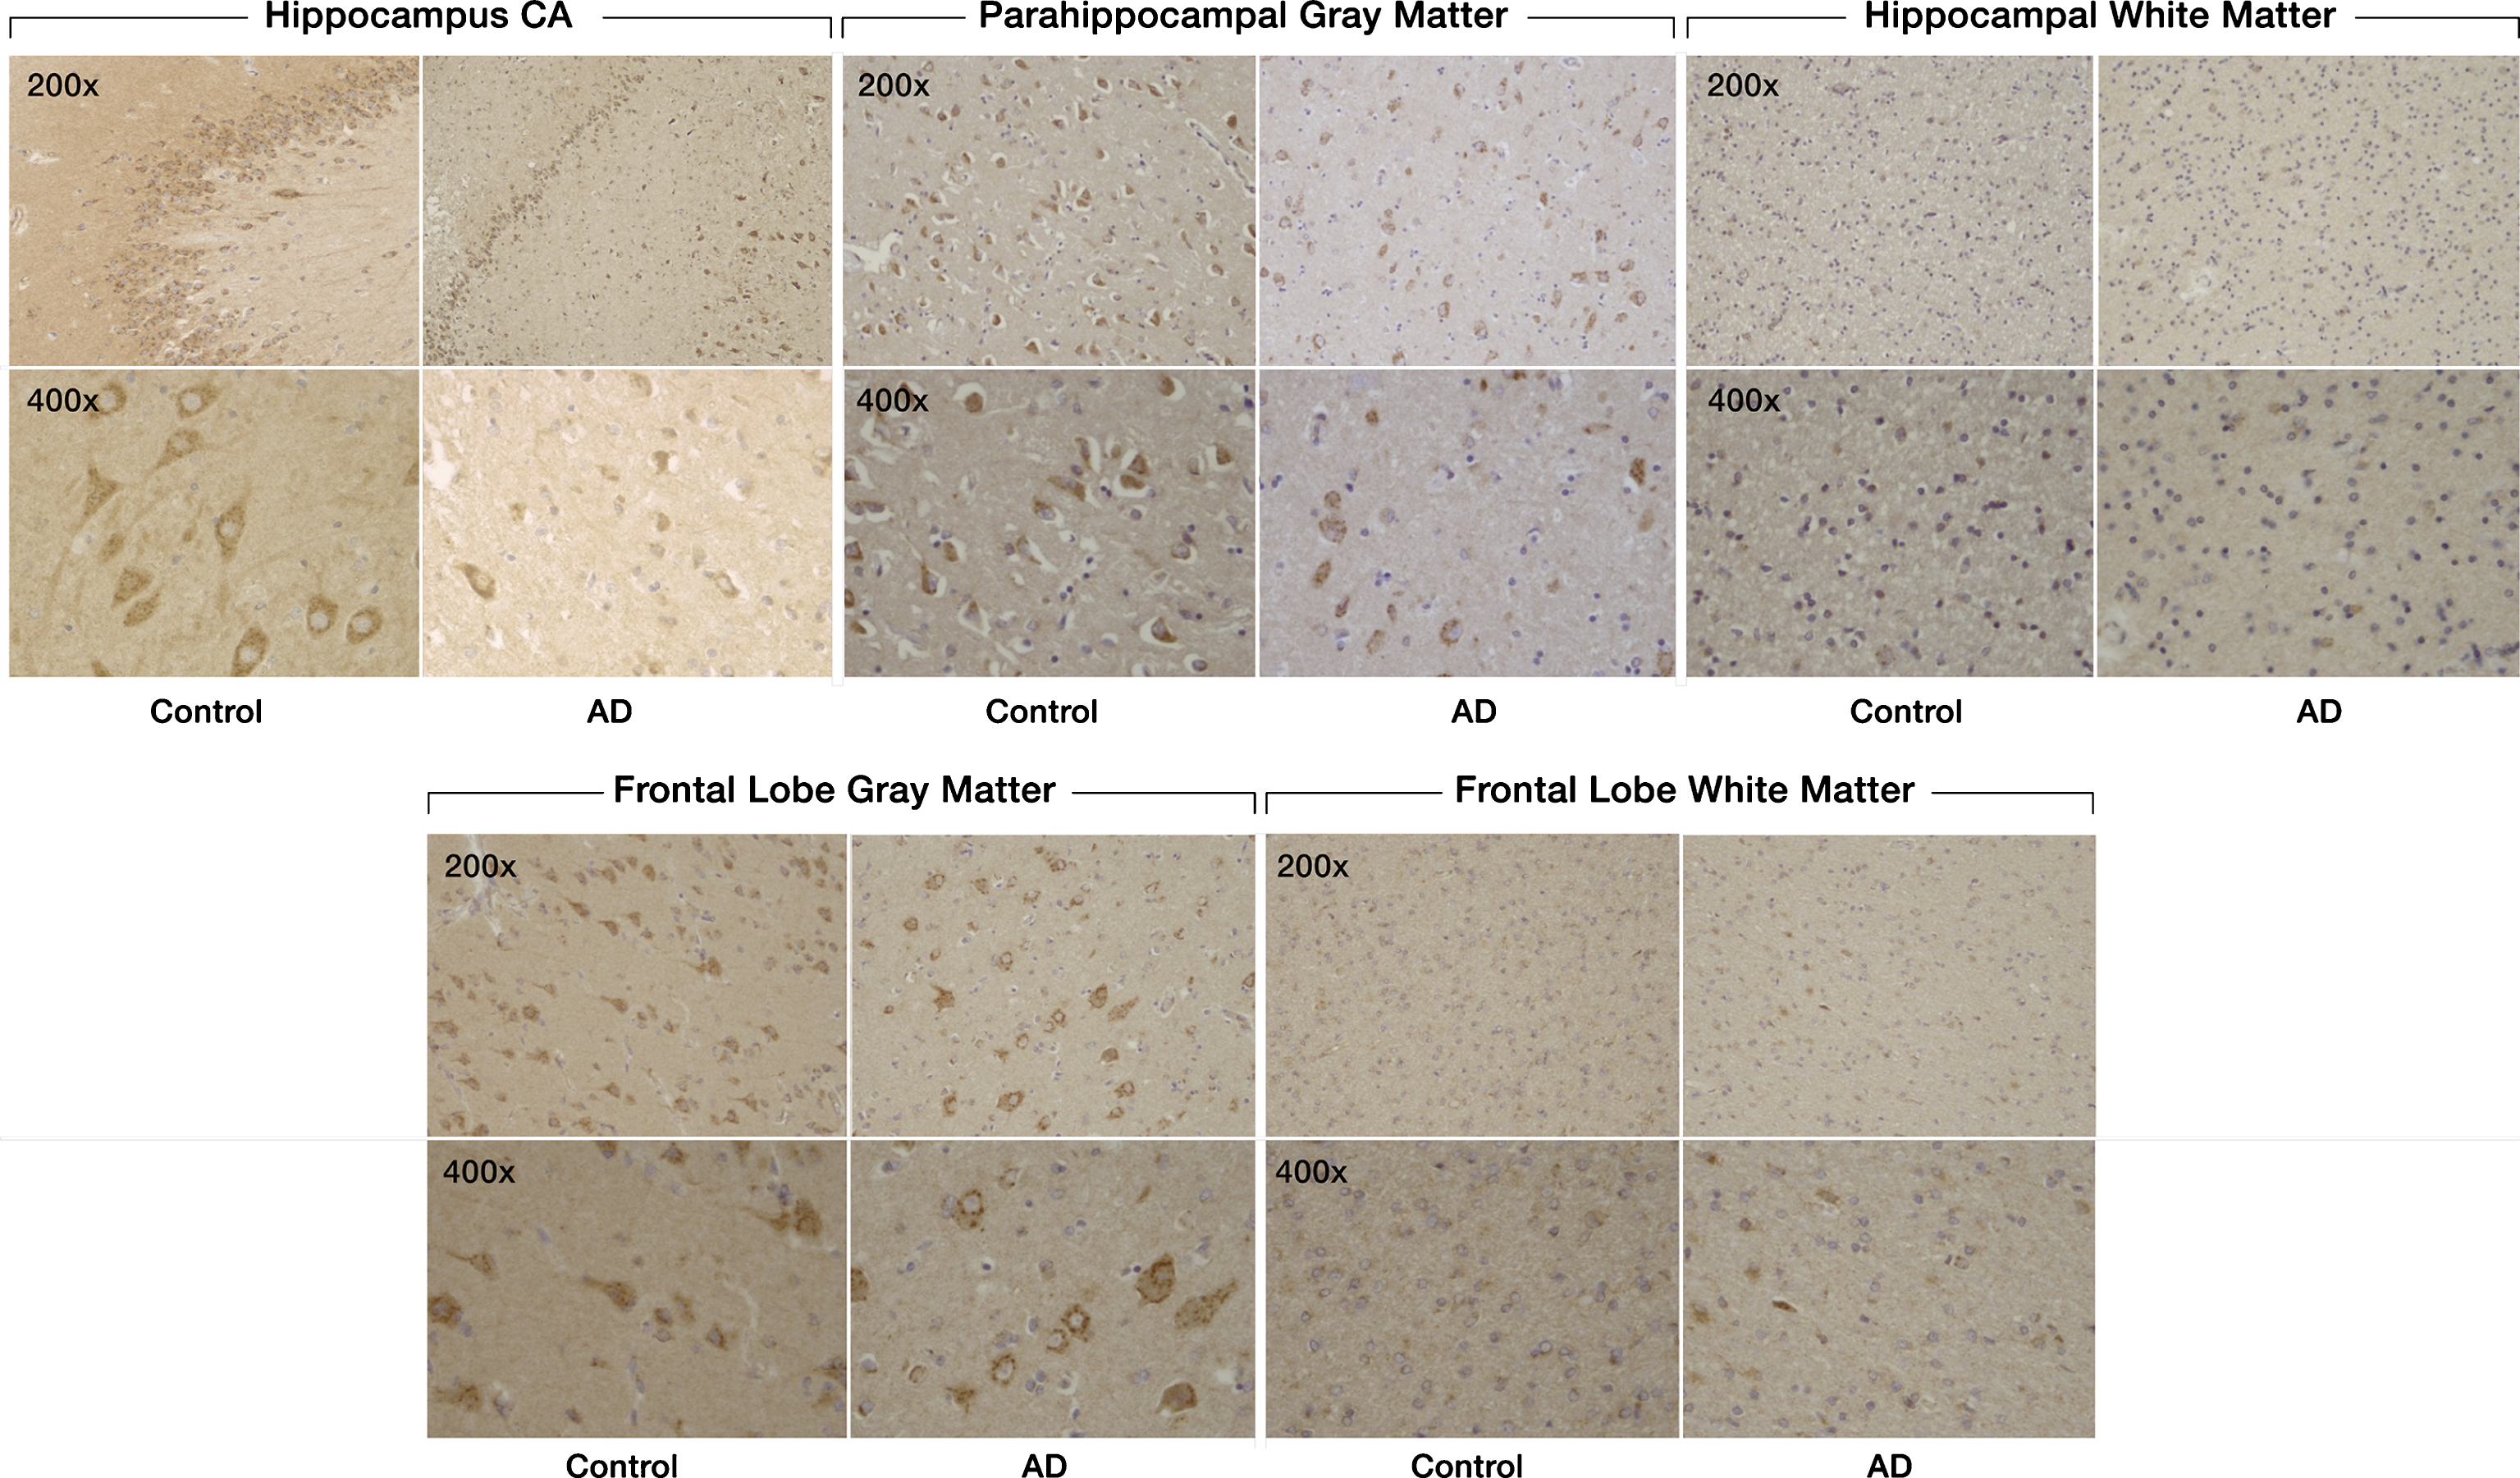
Expression of SULF2 in AD and cognitively normal control brain tissue. Immunohistochemical staining of SULF2 in the hippocampus and frontal lobe. There is less density of staining and a smaller proportion of cells are stained in the hippocampus CA and parahippocampal gray matter, as well as in the frontal lobe gray matter, in AD cases compared to cognitively normal controls. The quantification of SULF2 staining in the CA region encompassed the entire CA region, including CA1.
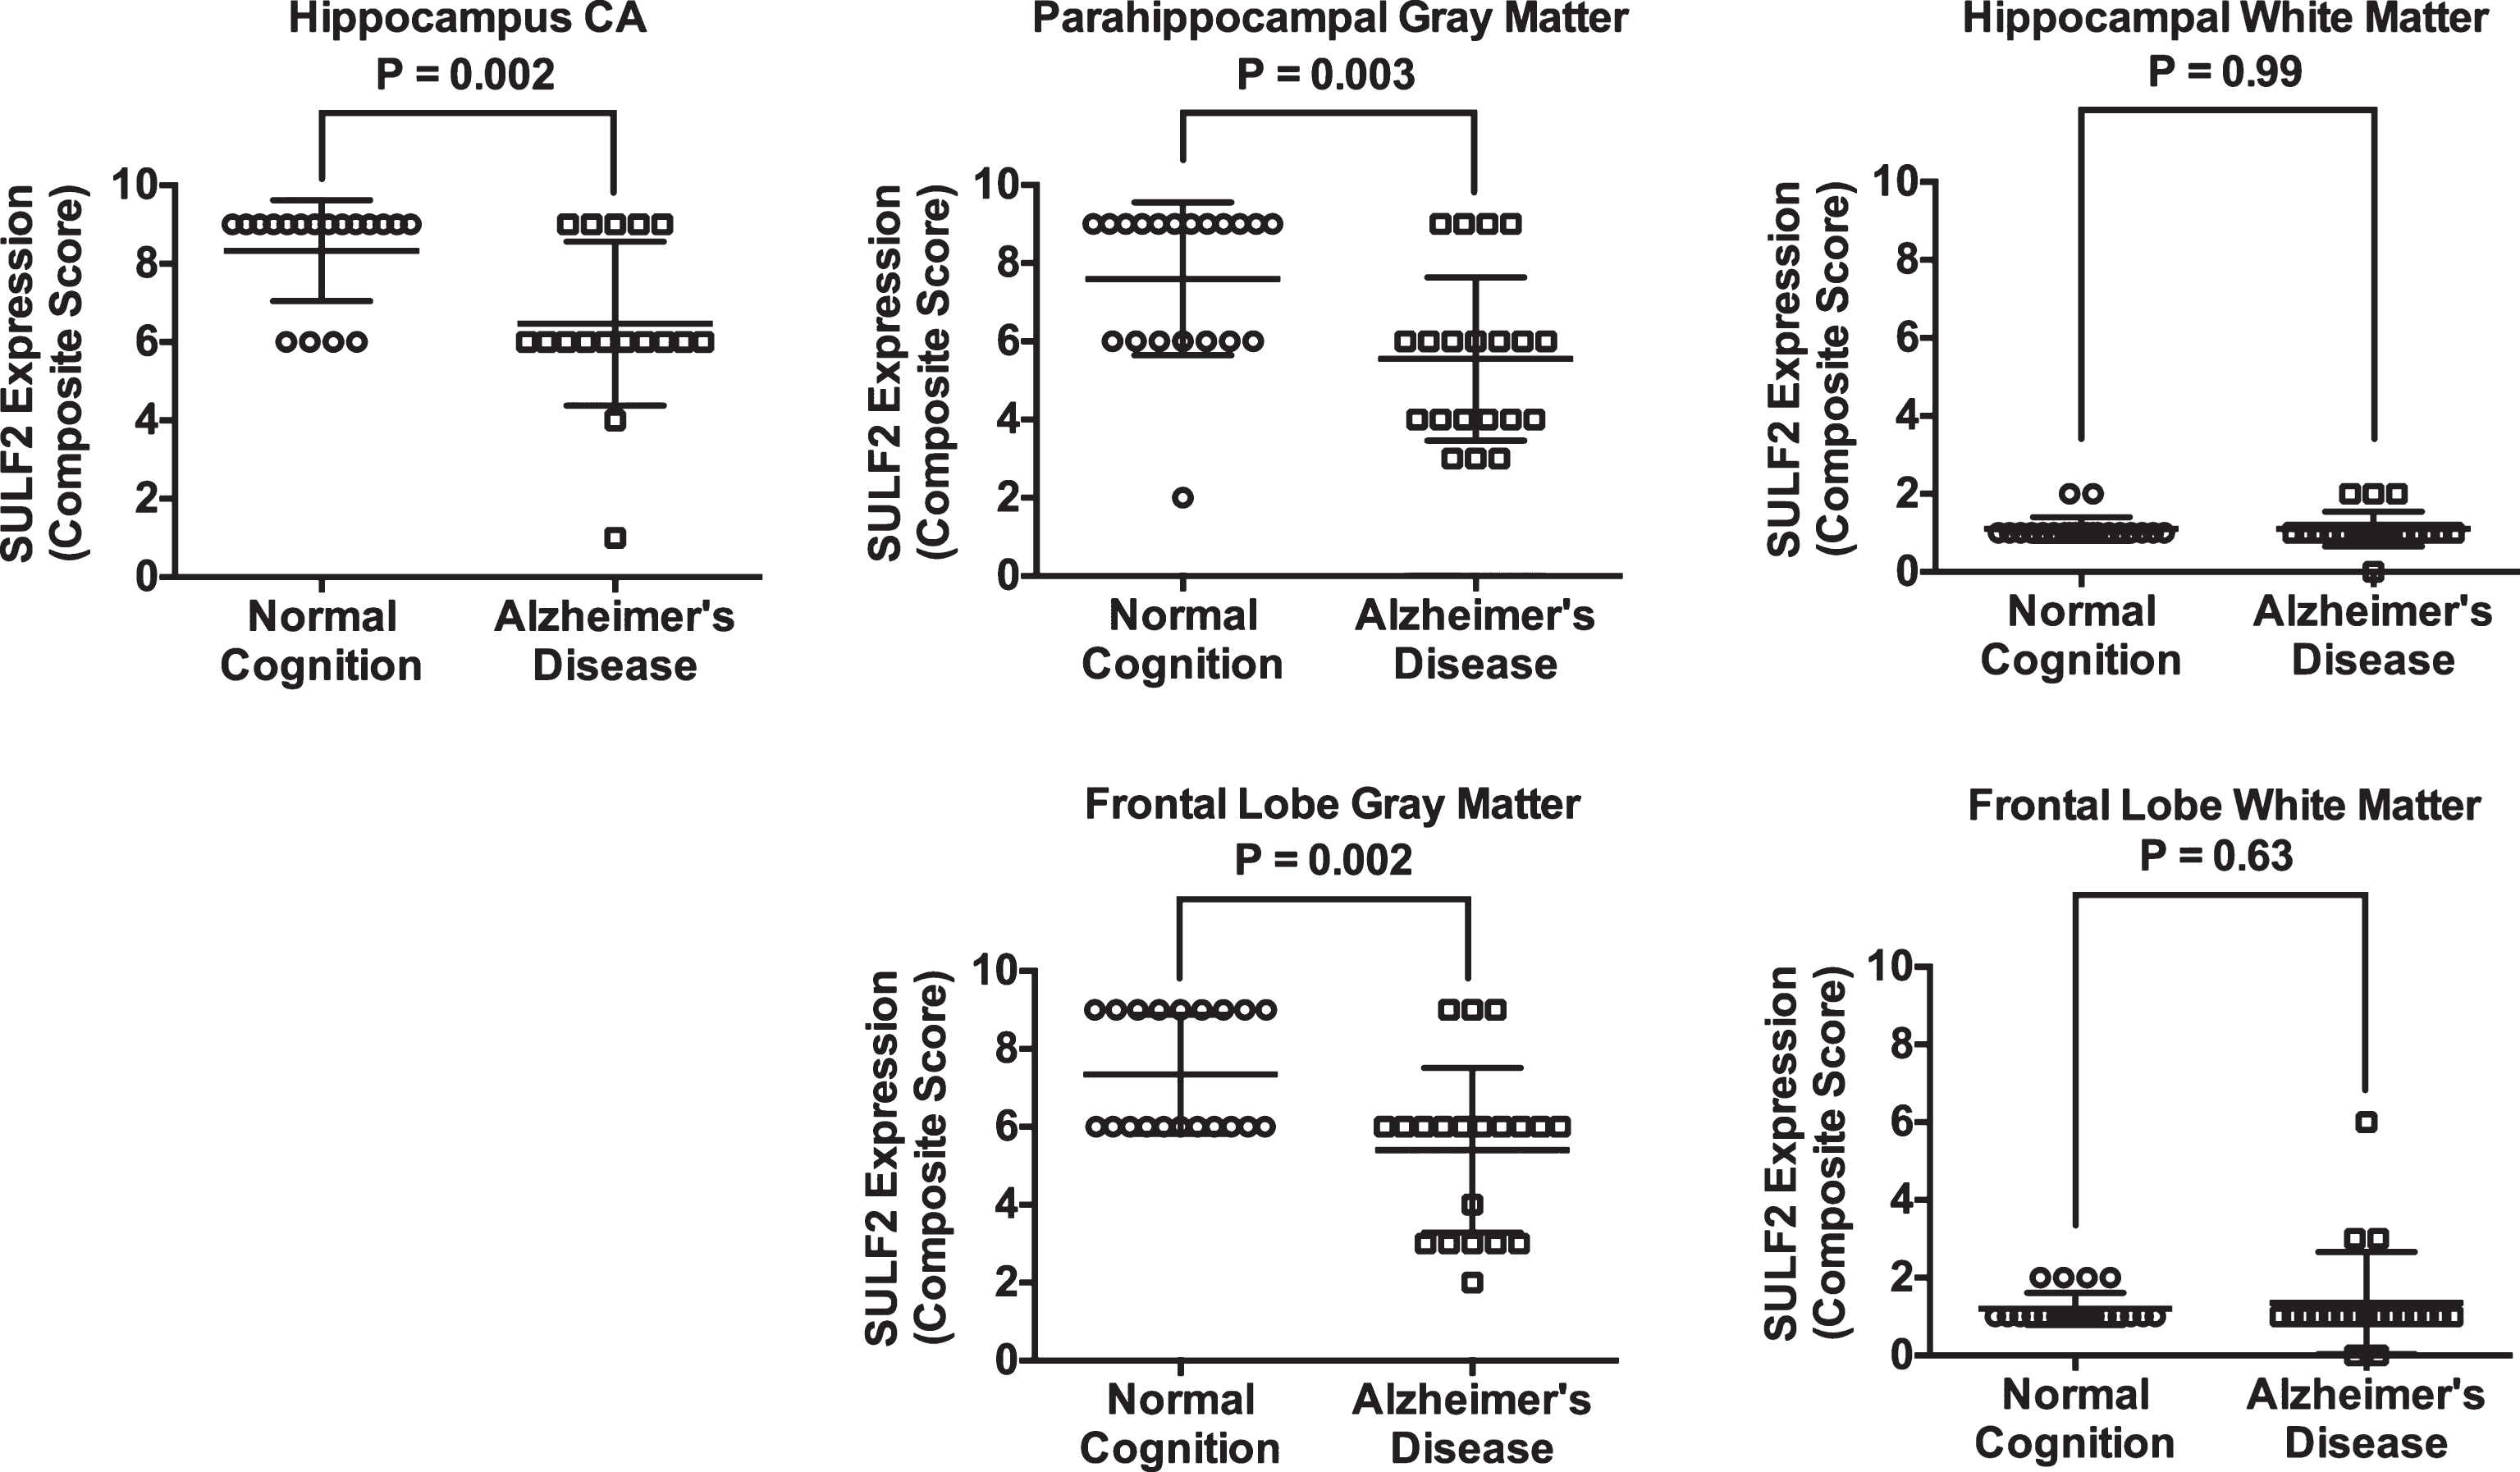
Plots of mean (standard deviation) scores for SULF2 expression in cases and cognitively normal controls. In the hippocampus, the mean score was lower in the CA for AD cases (6.5 [2.0]) compared to cognitively normal controls (8.3 [1.3]; p = 0.003). Similarly, the expression of SULF2 in the parahippocampal gray matter was lower in AD cases (5.6 [2.1]) than in cognitively normal controls (7.6 [2.0]; p = 0.003) and the expression of SULF2 in the frontal gray matter was lower in AD cases (5.4 [2.1]) than in cognitively normal controls (7.4 [1.5]; p = 0.002). There was no difference in SULF2 expression in the white matter of the hippocampus or the frontal lobe.
SULF1 expression
There was no significant difference in SULF1 staining (Fig. 3) or expression between AD cases and cognitively normal controls in either the hippocampal or frontal lobe gray or white matter (Fig. 4).
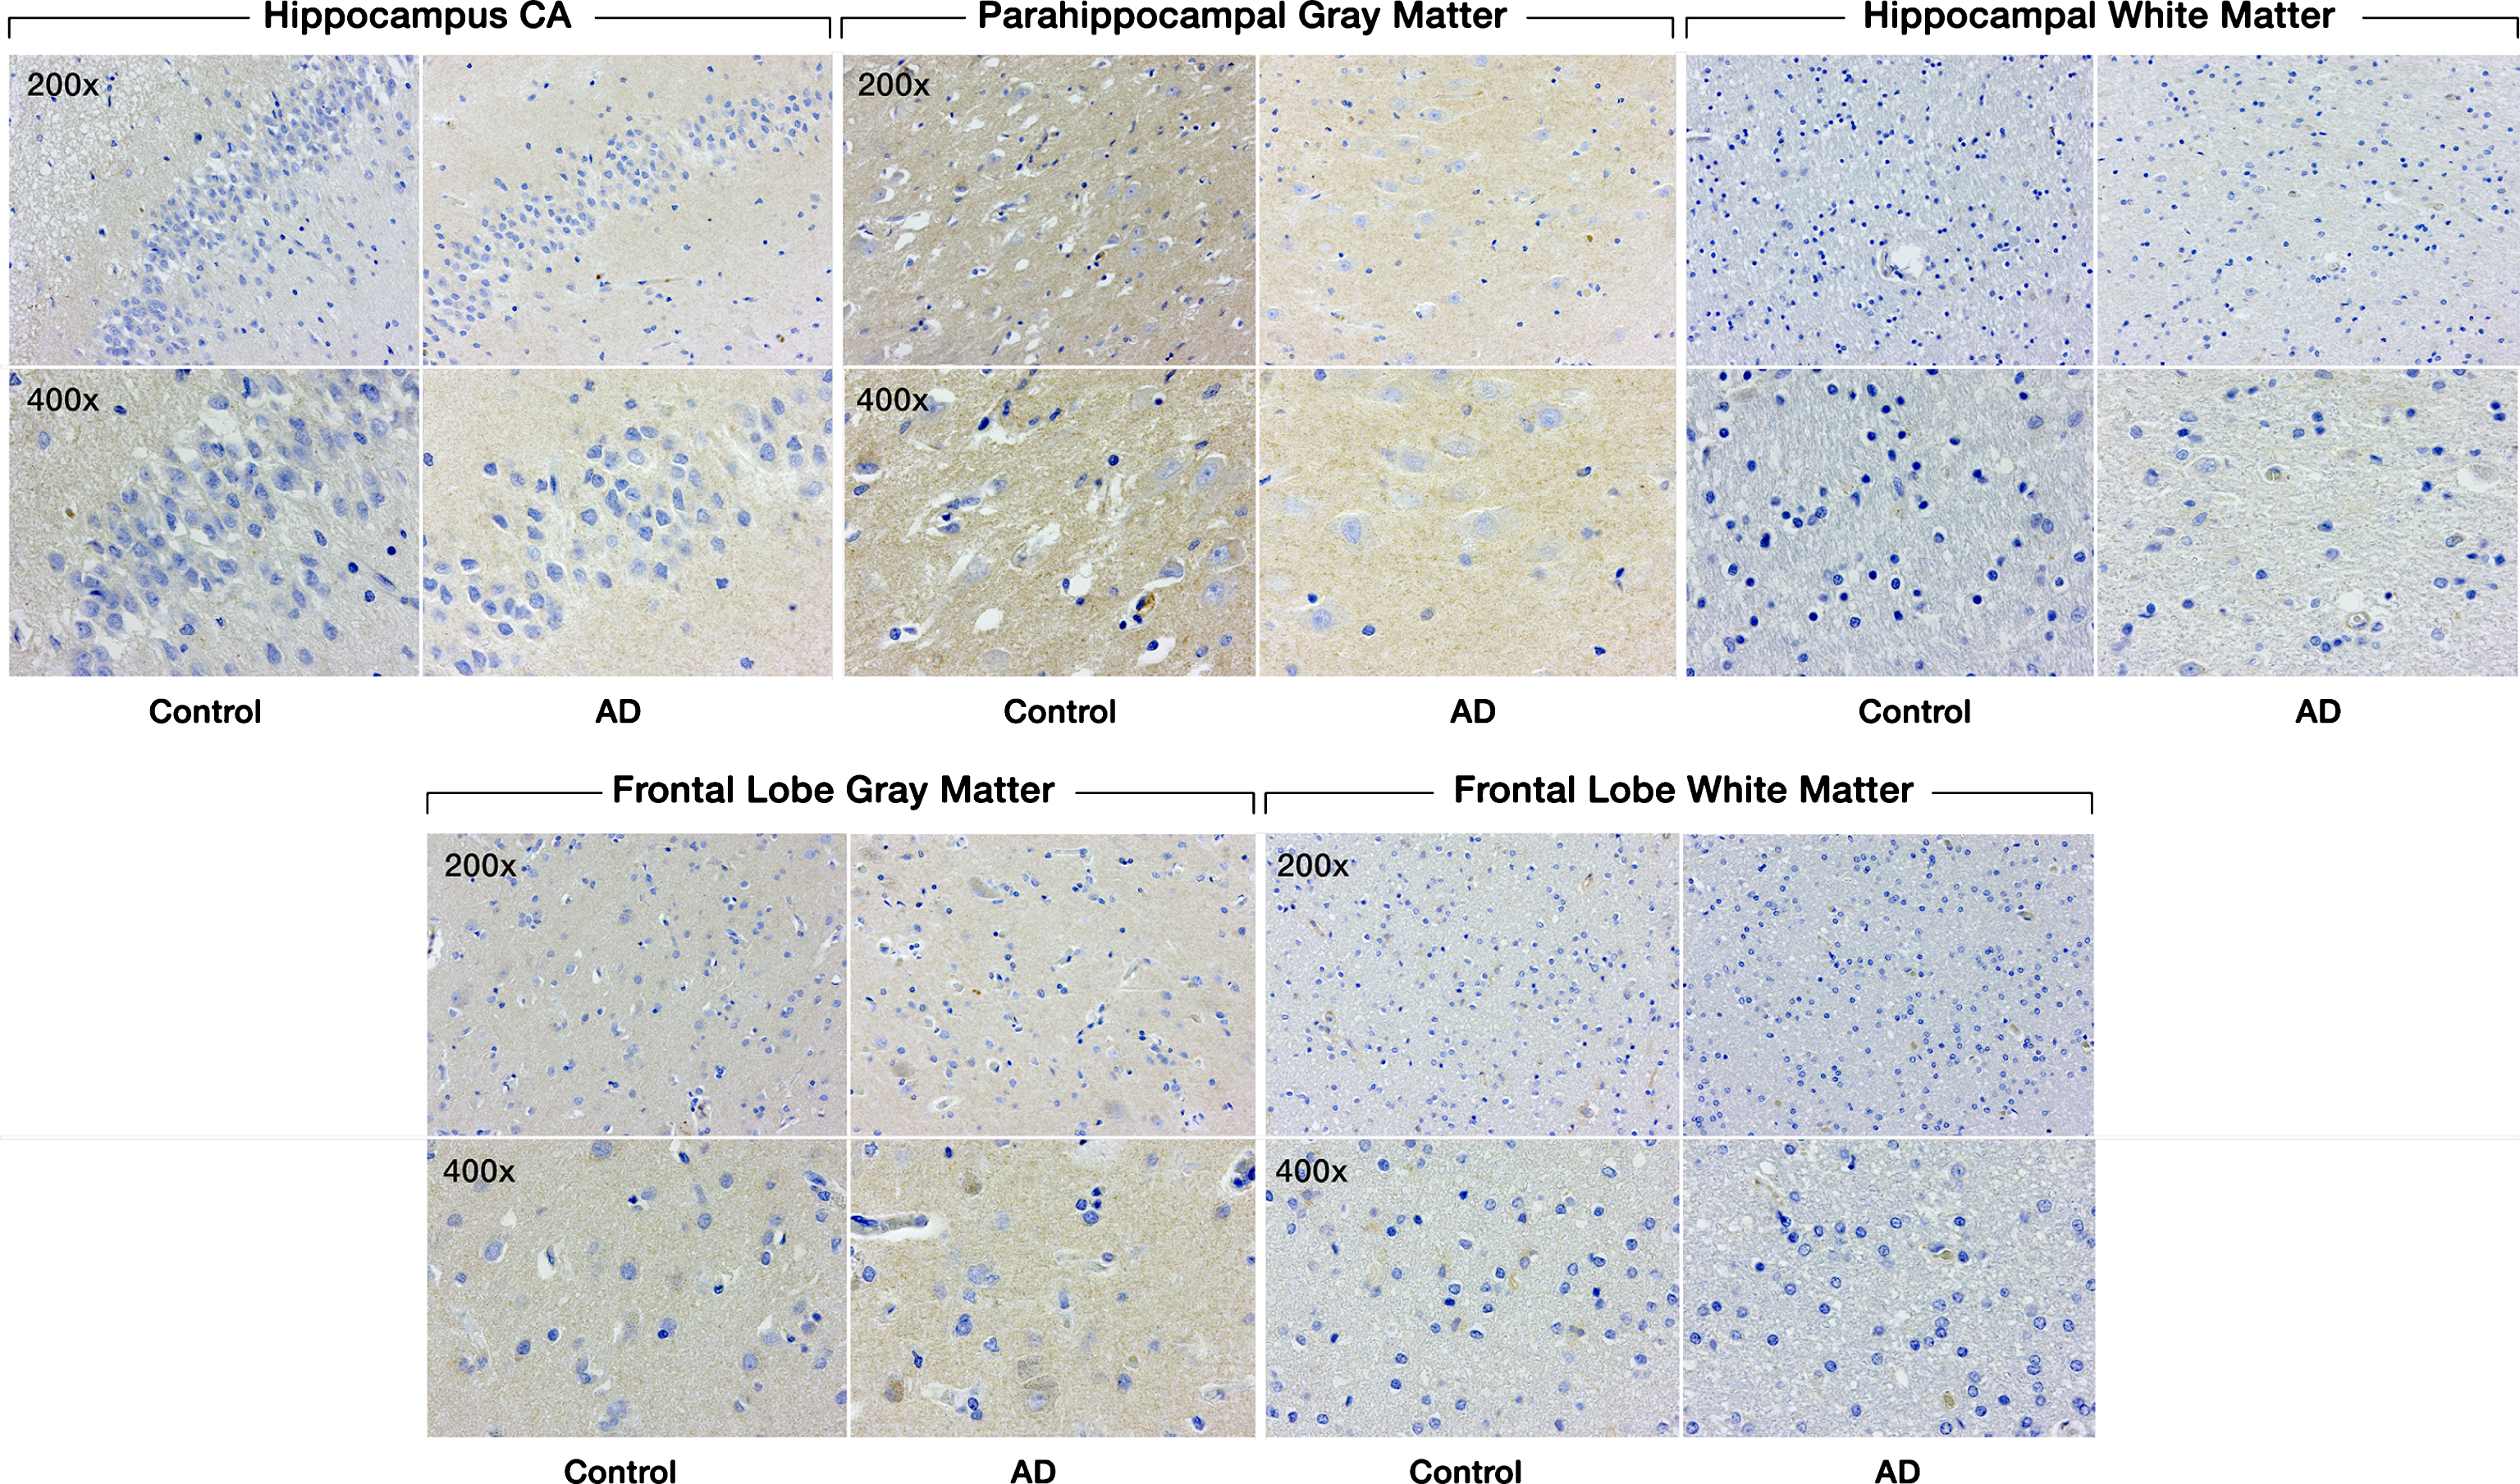
Expression of SULF1 in AD and cognitively normal control brain tissue. Immunohistochemical staining of SULF1 in the hippocampus and frontal lobe. There is no staining by SULF1 in the hippocampus CA, parahippocampal gray matter, frontal lobe gray matter in AD or cognitively normal control brain tissue. The quantification of SULF1 staining in the CA region encompassed the entire CA region, including CA1.
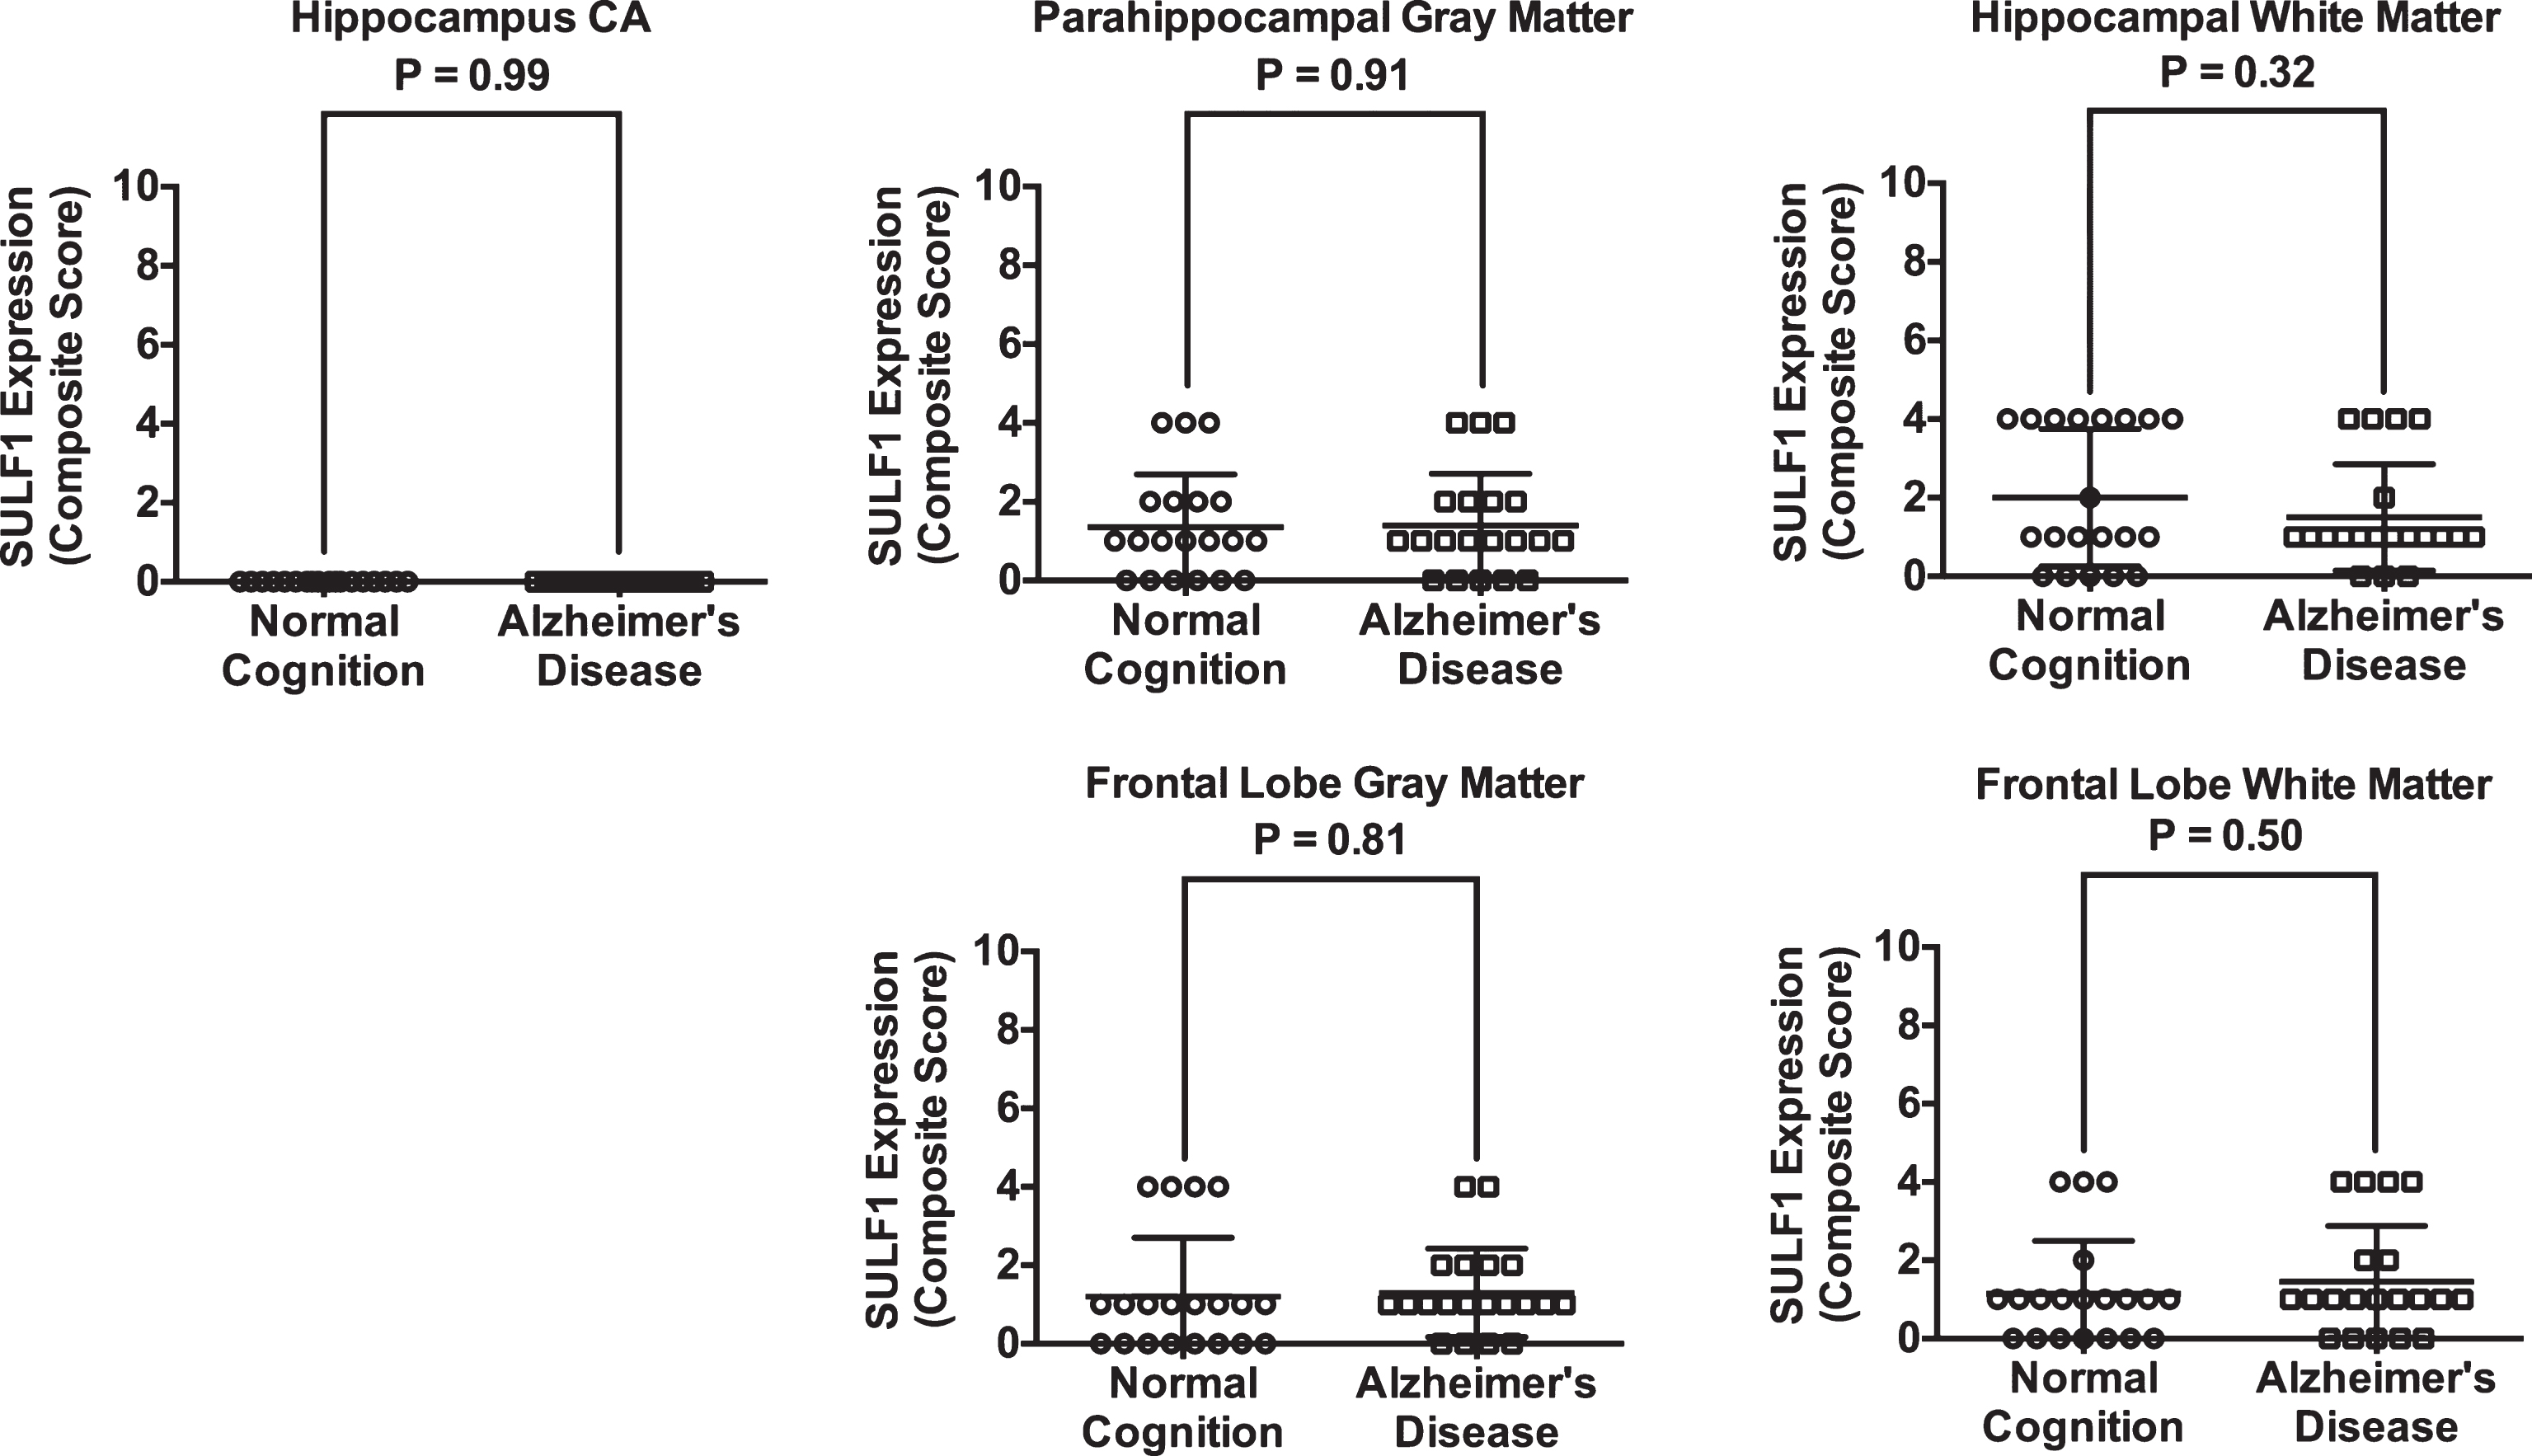
Plots of mean (standard deviation) scores for SULF1 expression in cases and cognitively normal controls. There was no difference in SULF1 expression in any of the brain regions examined.
DISCUSSION
Decreased expression of SULF2 in the hippocampal CA and parahippocampal gray matter and the frontal lobe gray matter was observed in AD cases. These findings are consistent with the recent report of an increase in highly sulfated HS domains that are susceptible to digestion by SULF1 and SULF2 in the brains of transgenic AD mouse models as well as in human AD brains [50]. These observations are also consistent with a model in which decreased expression of SULF2 may be involved in the pathology of AD, and may contribute to changes in memory and executive function.
Our findings are consistent with the suggestion that decreased expression of SULF2 may promote the development of AD by enhancing sulfation of heparan sulfate proteoglycans (HSPGs). Increase in extracellular highly sulfated HS may result in increased sequestration of the available extracellular growth factors away from their cognate receptors, leading to decreased signaling. HSPGs are also hypothesized to impact the pathogenesis of AD through effects on amyloid-β protein precursor (AβPP). HSPGs have been demonstrated in amyloid plaques, the hallmark of AD pathology [51–56]. Binding of AβPP to HSPGs stimulates neurite outgrowth [57–59]. Thus, abnormal interactions of AβPP with HSPGs may alter AβPP function, and enhance the production and deposition of amyloid-β [59].
Other studies have demonstrated that HSPGs but not CSPGs reduce amyloid-β aggregation and toxicity [15, 61]. Thus, structural and functional changes in HSPGs in elderly subjects may decrease binding and activity of growth factors, reduce neurogenesis, neuritogenesis, and angiogenesis, and may result in increased amyloid-β toxicity and development of AD.
In terms of the specific locations of changes in HSPGs, one study found an increase in HSPGs in the hippocampus of subjects with AD, suggesting a role for HSPGs in AD pathogenesis [62]. Another study of HS expression in the hippocampus of aged (mean age 66 years) versus adult (mean age 28 years) subjects demonstrated structural changes in HS in the hippocampus of aged subjects. These changes included decreased 2-O-sulfation, and increased N- and 3-O sulfation, but no difference in 6-O-sulfation [30]. Compared to GAGs from adult brains, GAGs from aged brains had decreased binding to growth factors, and decreased ability to enhance growth factor proliferative activity. With suppression of endogenous BDNF, aged hippocampus GAGs promoted neuritogenesis in neuroblastoma cells. However, there was no difference in the ability of aged versus adult HSPGs to protect cells against amyloid-β toxicity [30].
HSPG gene polymorphisms may be effect modifiers of risk for AD. In a genetic association study, there was no association of the HSPG2 (perlecan) gene with AD overall [63]. However, in APOE ɛ4 carriers the HSPG2 A allele was associated with an increased risk of AD. Another study, however, did not observe associations of HSPG2 gene polymorphisms with AD [64]. Nonetheless, since the interactions of growth factors with HSPG vary by the HSPG type, the associations with AD may also vary across HSPGs.
The association of decreased SULF2, but not SULF1, expression in the brain regions implicated in AD is consistent with our previous findings. Genes correlated with SULF2 gene expression in liver cancers had strong associations with familial amyloid neuropathies, early onset AD, and Lewy body dementia [24]. Similar associations were not found in genes correlating with SULF1 expression [24].
Gene knockout studies showed that although Sulf2 and Sulf1 are both involved in the development of mouse brain, mouse Sulf2 deficiency was associated with more severe phenotypes than Sulf1 deficiency. Sulf2 knockout mice had greater embryonic mortality, but no developmental abnormalities were observed in Sulf1 knockout mice [65]. Both Sulf1 and Sulf2 single-knockout mice showed deficits in neurite length in hippocampal and cerebellar neurons, and there were deficits in synaptic plasticity in the CA1 region of the hippocampus in Sulf1 knockout mice suggesting that Sulf1 may also be involved in neural development [65]. Another study found higher levels of Sulf2 than Sulf1 in the brains of wild-type mice [66]. Knockout of Sulf1 or Sulf2 resulted in similar increases of approximately 20% in the brain concentration of trisulfated HS disaccharides, the major substrate for both sulfatases, however, the expression of Sulf1 and Sulf2 and the concentrations of trisulfated HS disaccharides in specific regions of the brain were not assessed [66]. More recent studies in the cerebellum of newborn mice including HS analyses suggest that the sulfatases may impact postnatal developmental processes through their specific and differential effects on HS chains, resulting in differences in signaling by FGF-2, glial cell line-derived neurotrophic factor (GDNF), and nerve growth factor (NGF) that are quite complex [67]. FGF2 and GDNF appear to mediate Sulf2-dependent neurite outgrowth. By contrast, neither FGF2, GDNF, nor NGF appears capable of mediating Sulf1-dependent neurite outgrowth. Instead, GDNF appears to act in concert with SULF1 to inhibit cell survival and proliferation of granule precursor cells in the external granular cell layer. Functionally, the studies show that the behavioral effects of Sulf2 and Sulf1 differ; whereas Sulf2 deficiency adversely impacts spatial learning performance, Sulf1 deficiency impacts nocturnal perambulation [65, 67].
Our study has certain limitations that need to be taken into account. The sample size was small, and quantification of Sulf1 and Sulf2 staining was not robust. Specifically, scoring was performed by eye, by a single reviewer, and the scoring was not based on a proven methodology. Neuronal density in the CA1 region was not assessed and adjusted to definitively distinguish between decreased SULF2 expression and non-specific AD-related loss of neuronal cells. However, these exploratory findings should generate hypotheses to be validated in definitive studies with larger sample sizes. Thal staging for AD was not assessed since this was not part of the study protocol at the time.
Our findings suggest that decreased SULF2 expression in specific regions of the hippocampus and the frontal lobe is seen in patients with AD, and may be involved in the pathogenesis of AD. These findings should be confirmed in larger studies. If they are confirmed, future studies should investigate the mechanisms for loss of SULF2 expression in AD, the stage of cognitive decline during which SULF2 is lost, and whether modulation of expression or activity of SULF2 can mitigate cognitive decline.
CONFLICT OF INTEREST
The authors have no conflict of interest to report.
Footnotes
ACKNOWLEDGMENTS
This work was supported by National Institutes of Health Grants P50 AG016574, U01 AG006786, K01 AG028573, and CA165076; the Mayo Clinic Center for Cell Signaling in Gastroenterology (NIDDK P30 DK084567); the Mayo Clinic Cancer Center (CA15083), and the Mayo Clinic Center for Translational Science Activities (NCATS CTSA UL1 TR000135). Its contents are solely the responsibility of the authors and do not necessarily represent the official views of the NIH. The authors thank Dr. Joseph E. Parisi (neuropathologist) for critical review of the manuscript and Ms. Jennifer Rud for secretarial assistance.