
Abstract
Mitigation of fall-related injuries for populations of transfemoral amputees fitted with a socket or an osseointegrated fixation is challenging. Wearing a protective device fitted within the prosthesis might be a possible solution, provided that issues with automated fall detection and time of deployment of the protective mechanism are solved. The first objective of this study was to give some examples of the times and durations of descent during a real forward fall of a transfemoral amputee that occurred inadvertently while attending a gait measurement session to assess the load applied on the residuum. The second objective was to present five semi-automated methods of detection of the time of descent using the load data. The load was measured directly at 200 Hz using a six-channel transducer. The average time and duration of descent were 242 ± 42 ms (145–310 ms) and 619 ± 42 ms (550–715 ms), respectively. This study demonstrated that the transition between walking and falling was characterized by times of descent that occurred sequentially. The sensitivity and specificity of an automated algorithm might be improved by combining several methods of detection based on the deviation of the loads measured from their own trends and from a template previously established.
Keywords
Introduction
Falling is a significant health issue for the vast majority of lower limb amputees. Several studies described the occurrence, the prevalence and risk factors of falling for amputees fitted with a socket. 1–5 This information is only partially relevant to transfemoral amputees fitted with an osseointegrated fixation. 6 In this case, the socket is replaced by a fixation directly inserted into the femur comprising an implant, an abutment and a retaining bolt. 7–9 Fall-related information for this population is sparse. However, several studies reported that falls were responsible for damages on the fixation including the bending, and subsequent fractures, of the abutment. 2,7–10 These damages have personal, financial and clinical consequences that are currently perceived as a shortcoming, despite significant prosthetic benefits of this type of attachment. 7–9,11,12
Ways to alleviate damages
Mitigation of damages for both populations of transfemoral amputees fitted with a socket or a fixation is challenging. 13 However, it could be achieved by implementing safer rehabilitation and exercise programs (e.g., how to fall, walking abilities) 7,11,14 and conservative fitting of the prosthesis (e.g., choice of components, alignment of prosthesis). 15,16 These clinical initiatives could be combined with the refinement of the design of existing components (e.g., knees, shock absorbers, quick release mechanisms, abutment, motion-alarm device) along with the development of specific protective devices to be fitted within the prosthesis (e.g., air bag). 13
Development of protective devices
As described in Figure 1, a typical protective device should include some generic features such as sensors gathering key variables (i.e., dynamics, kinematics, kinetic), protective mechanism that can be passive (e.g., pad 17 ) or active (e.g., air bag 13 ), and control circuit interfacing the sensor (e.g., monitoring) and the mechanism (e.g., triggering). Regardless of the design, the capacity of such a device to reduce fall-related damages to the residuum depends on:
The efficacy of the algorithm that is implemented by the control circuit to detect automatically the time of descent using some sensors (e.g., accelerometers, 18–23 gyroscope, 21,24–25 load 26 ). 18,20,24,27–29 Here, the term “time of descent” is defined as the moment when the amputees cease to have control over their movements leading their body to hit the ground.
The speed of deployment of the active mechanism based upon prior knowledge of the duration of descent corresponding to the time between the beginning of the fall and the impact on the residuum. 30,31
Determination of the time of descent
The recognition of the time of descent relies on a good understanding of the variations of the relevant dynamics, kinematic and kinetic parameters during a fall. By definition, a study providing representative and realistic kinetic data sets of falls is difficult to design (e.g., no random double-blind trials). Consequently, most studies looking at these parameters simulated a fall using various experiments (e.g., pelvis release experiment 32 ). For instance, one of the most recent and comprehensive studies analysed the prosthetic knee motion patterns during tripping that was achieved by an investigator tugging on a cord at the shin at different angles of knee flexion. The ingenious mechanism would be a good representation of the buckling of the knee. Nonetheless, the participant's loading pattern might be altered due to pre-emption of the pulling combined with the perception of the traction.
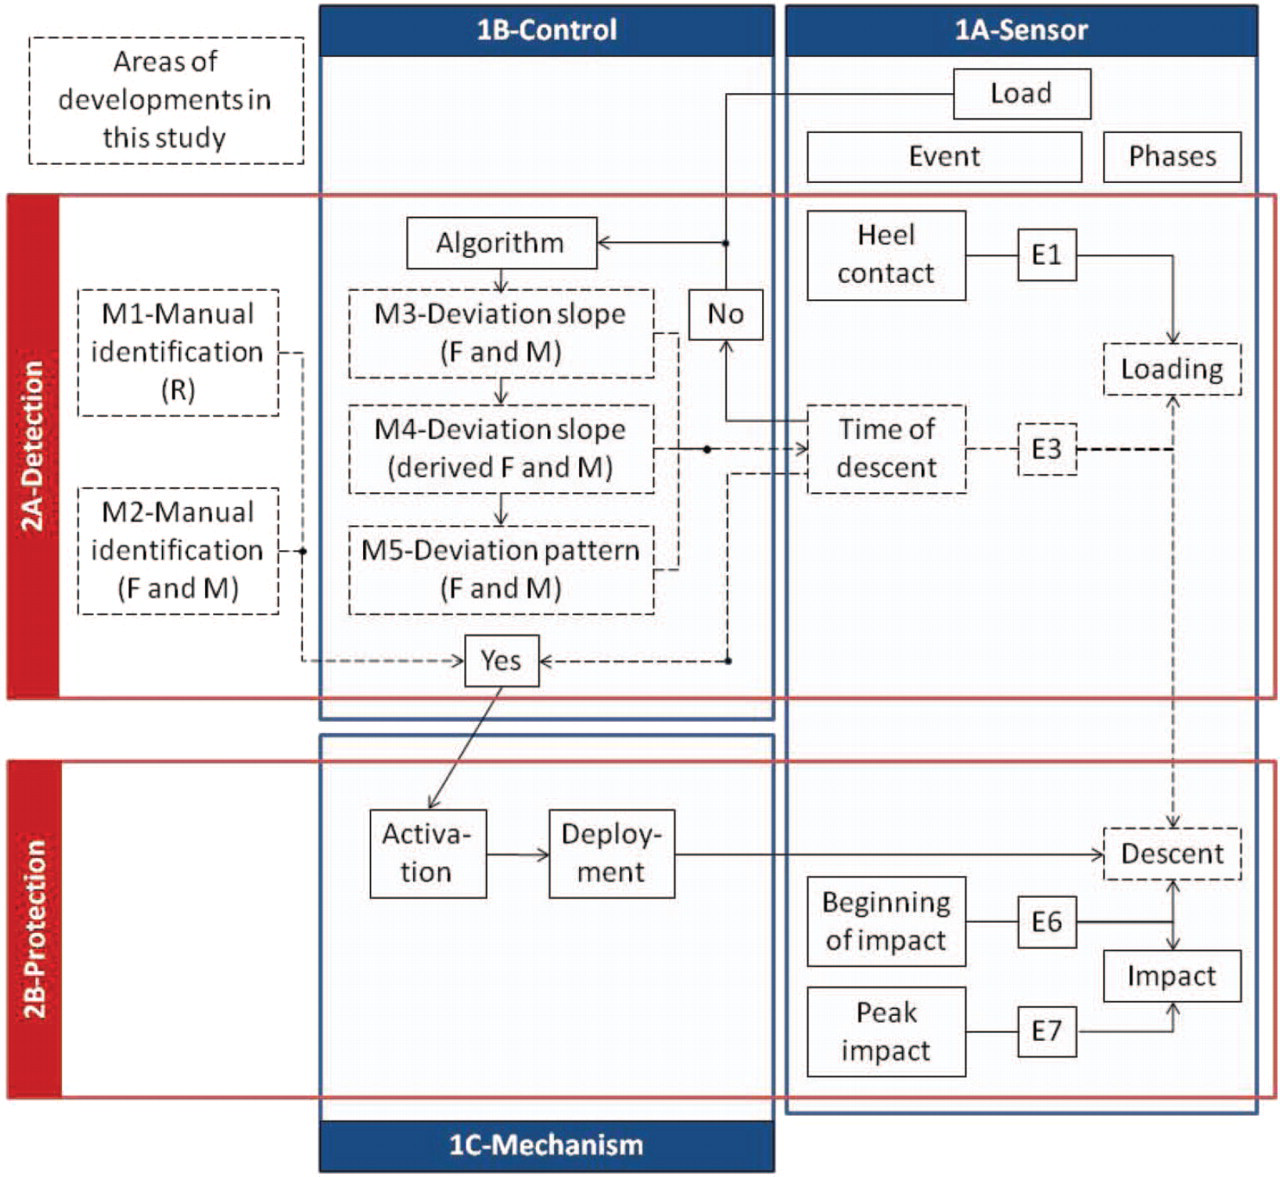
Overview of the generic features of a protective device, including the sensor (1A), control (1B) and mechanism (1C) participating in the detection of fall (2A) and protection of the residuum (2B), with an emphasis on the areas developed in this study. F, forces; M, moments; R, resultant of the forces.
Need for real kinetic data
Frossard et al. (2010) 31 have presented some snapshots of a transfemoral amputee as well as forces and moments applied on the three axes of the fixation during the loading, descent, impact and recovery phases of an actual forward fall. 31 In particular, their study presented the sequence of events associated with the loading and descent phases, including heel contact (E1), flat prosthetic foot (E2), time of descent (E3), toe-off and sliding of sound toe (E4), beginning of descent of the prosthesis visible on video (E5) and beginning of impact (E6). Another study provided the highest load applied on the residuum during the impact phase (E7) occurring at 875 ms on FML (269 N), 925 ms on FAP (-554 N), 870 ms on FLG (1,144 N), 915 ms on MML (153 Nm), 910 ms on MAP (10 Nm) and 910 ms on MLG (30 Nm) after the heel contact. 30 This demonstrated that the impact was sequential and the main impact force and moment corresponded to 133% BW and 17% BWm, respectively.
Unfortunately, the time of descent was detected manually based on the decline in the curve of the resultant of forces. Consequently, this method of detection was too crude to provide accurate duration of the descent, let alone relevant information to design an automated fall detection algorithm. Thus, there is a need to further deepen the analysis of the load collected during this fall leading to a more systematic detection and accurate estimation of the time and duration of descent, respectively.
Purpose and objectives
The ultimate purpose of this study was to contribute to the design of an algorithm detecting the time of descent and the deployment of the protective mechanism that are required to develop future wearable devices. The specific objectives were:
To give some examples of the times and durations of descent for a transfemoral amputee during a real forward fall; and
To present, compare and contrast five semi-automated methods of detection of the time of descent.
Scrutinizing unique data of a real fall
The unforeseen forward fall occurred inadvertently while recording the load applied on the fixation during activities of daily living. 33 Initially the participant was asked to walk with her prosthesis inside a 10 m wide semi-circle drawn on a concrete walkway. She was asked to walk five times at a self-selected speed with sufficient rest between trials to avoid fatigue. The five first trials were eventless. As detailed in Frossard et al. (2010), 31 the fall occurred unexpectedly at the farther end of the walkway after the prosthetic knee buckled during the last stride of the last trial. The participant suffered no injuries or bruises. The fall was attributed to a faulty knee on review of the prosthesis. It has been reported that 12% of falls are due to prosthetic components. 2
Methods
A comprehensive description of the participant and the apparatus has already been detailed in Frossard et al. (2010). 31 Consequently, only the most relevant information will be presented here.
Participant
One fully rehabilitated and active female (aged 34 years, 1.70 m, 92.95 kg or 911.84 N) fitted with an osseointegrated fixation was asked to participate in this study. The amputation due to a trauma, the fitting of the fixation and the first walk with her prosthesis occurred 10, 4 and 2 years prior to the recording, respectively. She was able to walk 200 m independently without walking aids, and reported no incidents six months prior to the recording. 33 The research institution's human ethics committee approved this study. The participant provided informed written consent.
Apparatus
The prosthesis attached to the fixation included an adapter, a transducer, the participant's usual knee (Mauch GaitMaster; Ossur, Aliso Viejo, CA, USA) and foot (Sure-Flex; Ossur, Aliso Viejo, CA, USA) fitted with a sock and a sandal.
The three components of force and moment, referred to as the load, were measured with an accuracy better than 1 N and 1 Nm, respectively, using a six-channel transducer (Model 45E15A; JR3 Inc, Woodland, CA, USA) similar to one used in previous studies. 26,33–36 The load was recorded by a laptop at 200 Hz. The transducer was aligned in a way that its coordinate system was co-axial with the long (LG) axis of the fixation and the two other axes were mutually orthogonal. One of these axes corresponded to the antero-posterior axis (AP), where anterior was positive. The other corresponded to the medio-lateral axis (ML), where lateral was positive.
Data computing
Firstly, the time scale was reset to zero at the instant of heel contact. 30,31 Thus the time of descent was equal to the duration of loading making both terms interchangeable.
Secondly, E3 expressed in milliseconds after heel contact, was determined using the five following methods:
Method 1 corresponded to the method used by Frossard et al. (2010), 31 where E3 was determined manually, based on the decline in loading pattern of the resultant of the forces between loading and descent phases. In this case, E3 was considered the same for the forces and moments along the three axes.
Method 2 was similar to Method 1, except that E3 was manually determined based on the change in individual loading pattern of force and moment on the medio-lateral (FML, MML), antero-posterior (FAP, MAP) and long (FLG, MLG) axes. Identification of E3 for each axis might be needed since Frossard et al. (2010) 31 demonstrated that the descent and impact were sequential.
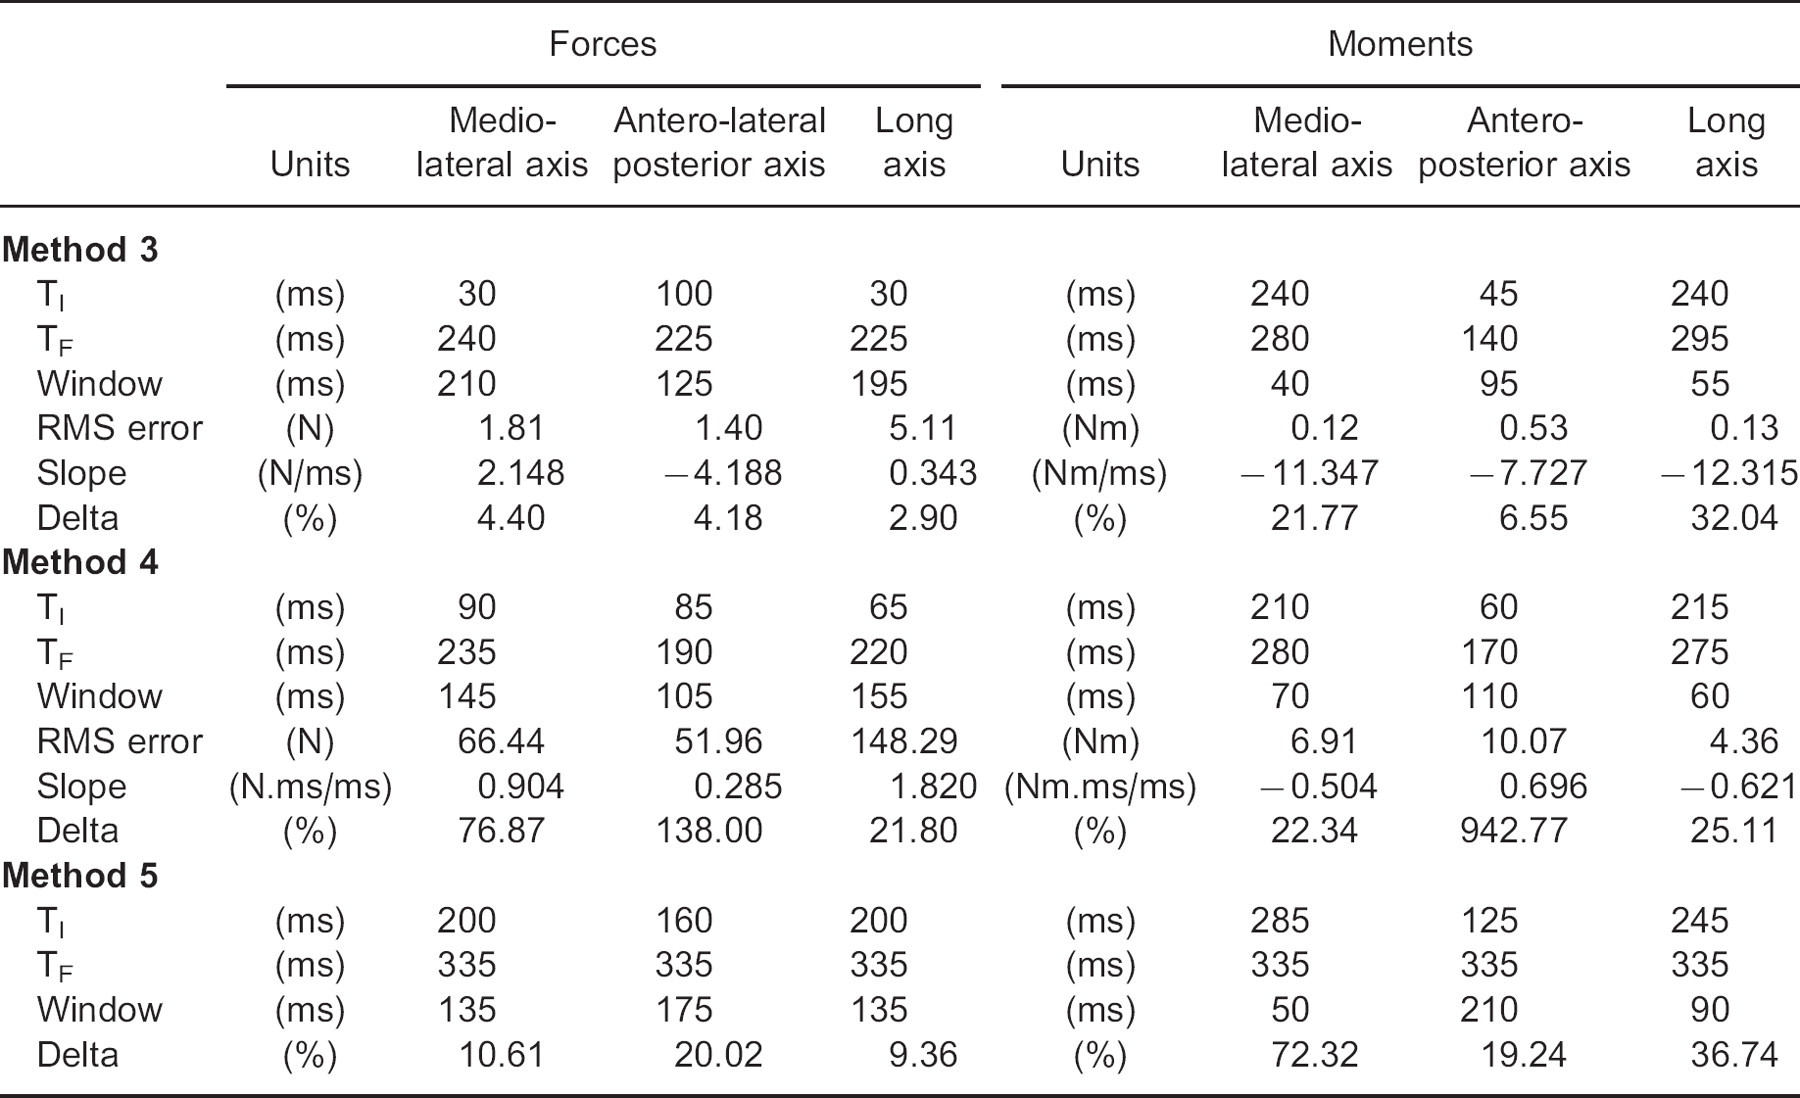
Method 3 was based on the principle that E3 occurred when the loading curves became deviant from their own linear progression (Figure 2). It is well established that the pattern of forces is an apparent straight line at the beginning a gait cycle, particularly on the long axis. 37–39 First, a window of data was delimited manually by an initial (TI) and final (TF) times corresponding to the beginning and the end of the linear section of the loading curve, respectively. Then, a regression line of this section was calculated. The associated upper and lower lines corresponded to the regression plus and minus the absolute value of the maximum differences between the regression line and the measured load for the window of data, respectively. Finally, E3 was determined as the first point outside the upper or lower limit. This was repeated for force and moment along each axis. This method was characterized by TI and TF, the duration of the window, the root mean square (RMS) error between the regression line and the measured load, the slope of the regression line and delta. The slopes, corresponding to the difference in load divided by the difference in time between any two points on the line, were expressed in N/ms and Nm/ms, respectively. Negative and positive slopes indicated a downward and upward progression, respectively. Slopes with a magnitude close to zero indicated a steep loading rate. Delta was the difference between the regression line and the measured load at E3, expressed in percentage.
Method 4 was similar to Method 3, except that the derived load was considered instead of the raw measured load. This method relied on the principle that E3 can be better detected since the derivation accentuates the changes of pattern. In this case, the slope of forces and moments were expressed in N.ms/ms and Nm.ms/ms, respectively.
Method 5 was based on the principle that E3 occurred when the load profile during the loading phase became deviant from the typical gait pattern produced by the participant (Figure 2). In this case, the loading pattern is compared to a template. This method is supported by previous findings demonstrating low participant-to-participant variability. 38,39 First, the five gait cycles performed before the fall were synchronized with respect to the heel contact and averaged to create a so-called typical pattern. Then, the typical and measured loads were plotted. A window of data delimited manually by the initial (TI) and final (TF) times corresponding to the points where both data sets were clearly together and separated, respectively. Finally, E3 was determined as the first point of the measured load outside plus or minus one standard deviation of the typical load. This was repeated for force and moment along each axis. This method was characterized by TI and TF, the duration of the window and delta. This latter corresponded to the difference between the typical and the measured load at E3, expressed in percentage. Thirdly, the duration of the descent phase, expressed in milliseconds, was determined for each method. It corresponded to the difference between E3 and the beginning of the impact phase (E6) estimated at 860 ms, as presented in Frossard et al. (2010). 31 E6 was preferred to the time when impact on the residuum was the highest (E7) since a protective device should be effective before the beginning of the impact phase.
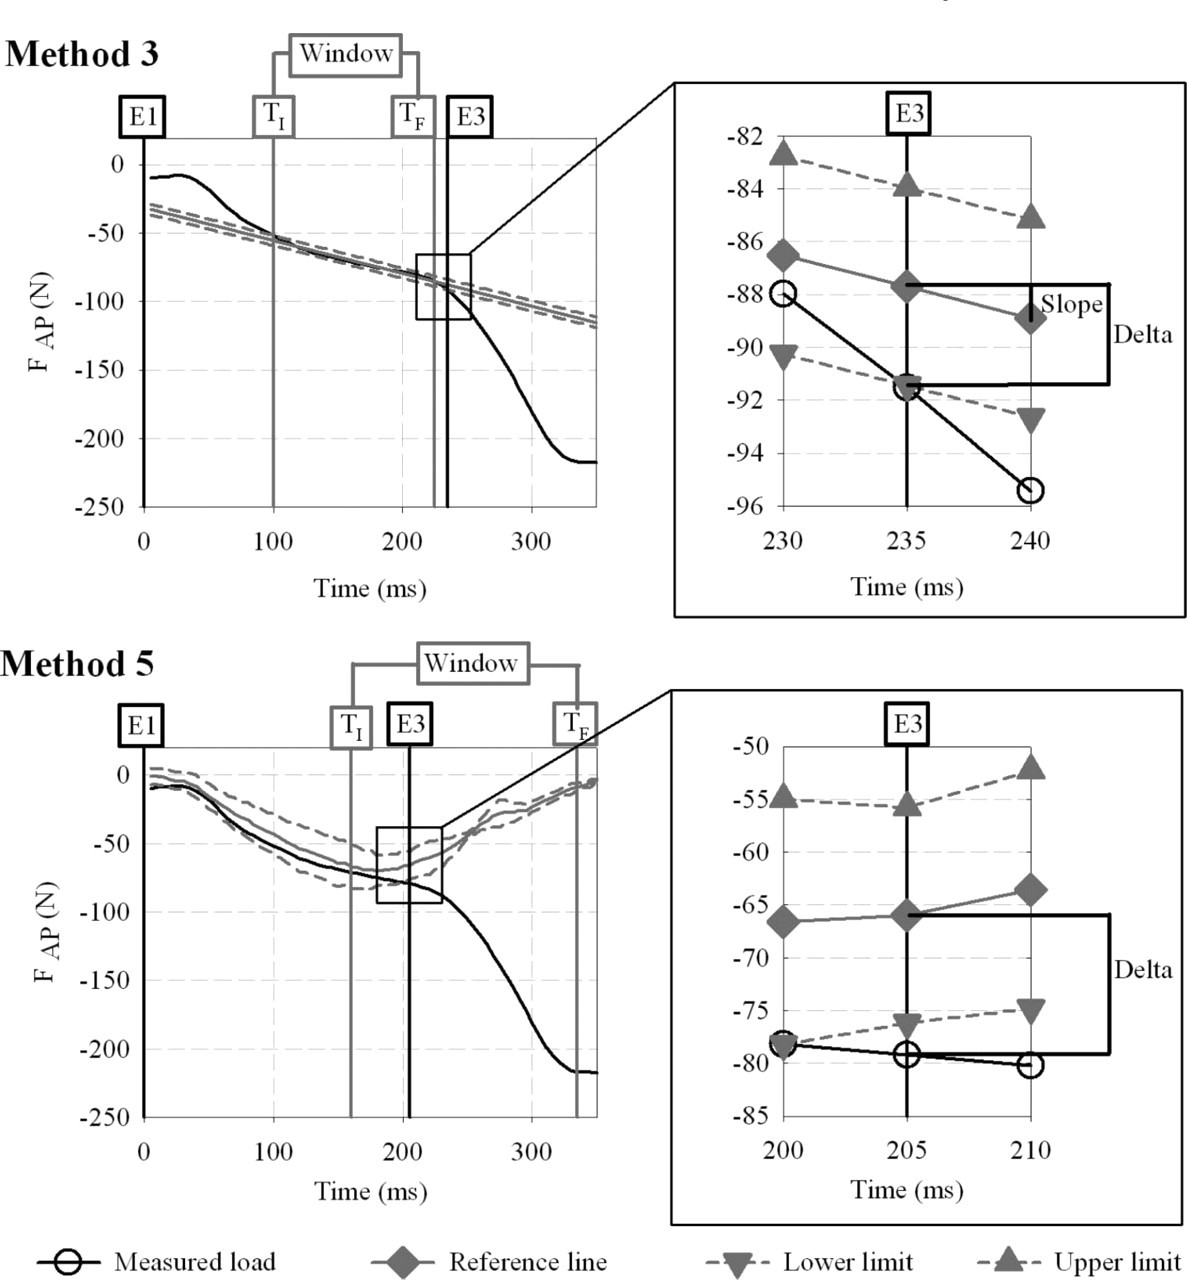
Example of determination of the time of descent (E3) for the force applied on the antero-posterior axis (FAP). The left view presents the initial (TI) and final (TF) times defining the window data for Method 3 (i.e., slope) and 5 (i.e., typical pattern). The right view presents the parameters (i.e., slope, delta) characterising each method.
Data analysis
Times and durations of descent were analyzed in the following ways:
Overall estimation. All E3 for the three forces and moments were pooled to allow calculation of the overall median, average and standard deviation.
Variable-to-variable comparison. Here, the six variables referred to the three forces and moments. All the variables were ranked by chronological order for each method. Method 1 was excluded from this sequencing, since E3 was a constant for all the variables. E3 for each variable was characterized by the median and interquartile range.
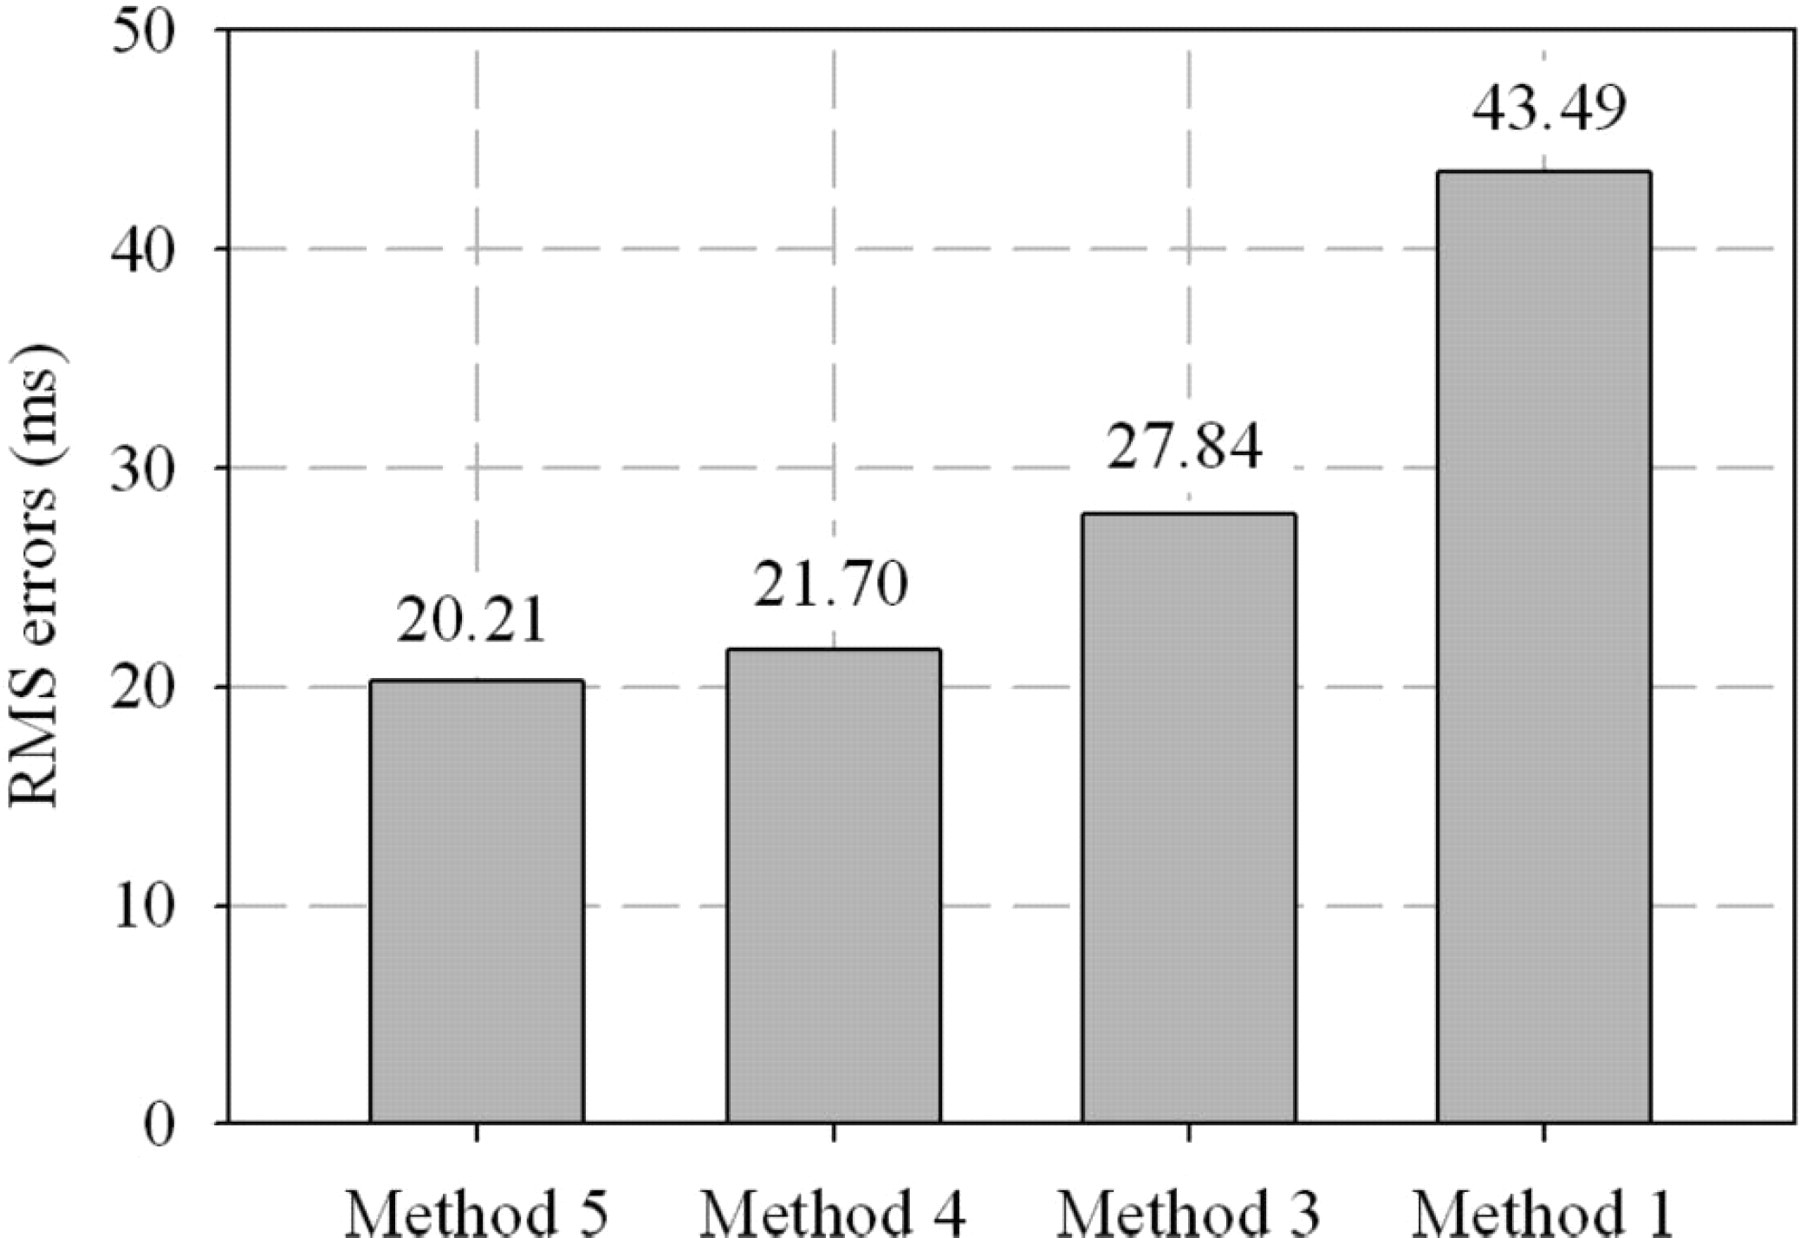
Method-to-method comparison. E3 obtained with each method were compared to those determined by Method 2, which were considered as the values of reference. A negative and positive difference indicated that E3 occurred before and after Method 2, respectively. The differences for all the variables were pooled for each method to allow the calculation of the RMS error of the difference with Method 2. The RMS errors were ranked by increasing order, so that the method with the smallest error was overall the most accurate one.
Results
Overview of loading and descent phases
An overview of the forces and moments on the three axes of the fixation and the events from E1-E6 31 occurring during the loading and descent phases are presented in Figure 3.
Characterization of each method
By definition, Methods 1 and 2 were solely characterized by manually determining E3. The parameters characterizing the determination of E3 for Methods 3, 4 and 5 are presented in Table 1. The parameters of the windows of data for Method 5 were only provided for the sake of completion, giving that the criterion to determine TI and TF were loose. These parameters could vary largely while the method will still provide the same outcomes.
Overall estimation
All methods and variables combined, E3 ranged from 145–310 ms with an average of 242 ± 42 ms. The median E3 of all data sets including and excluding Method 1 was 240 ms and 250 ms, respectively. The duration of descent ranged from 550–715 ms with an average of 619 ± 42 ms. Its median including and excluding Method 1 was 610 ms and 620 ms, respectively.
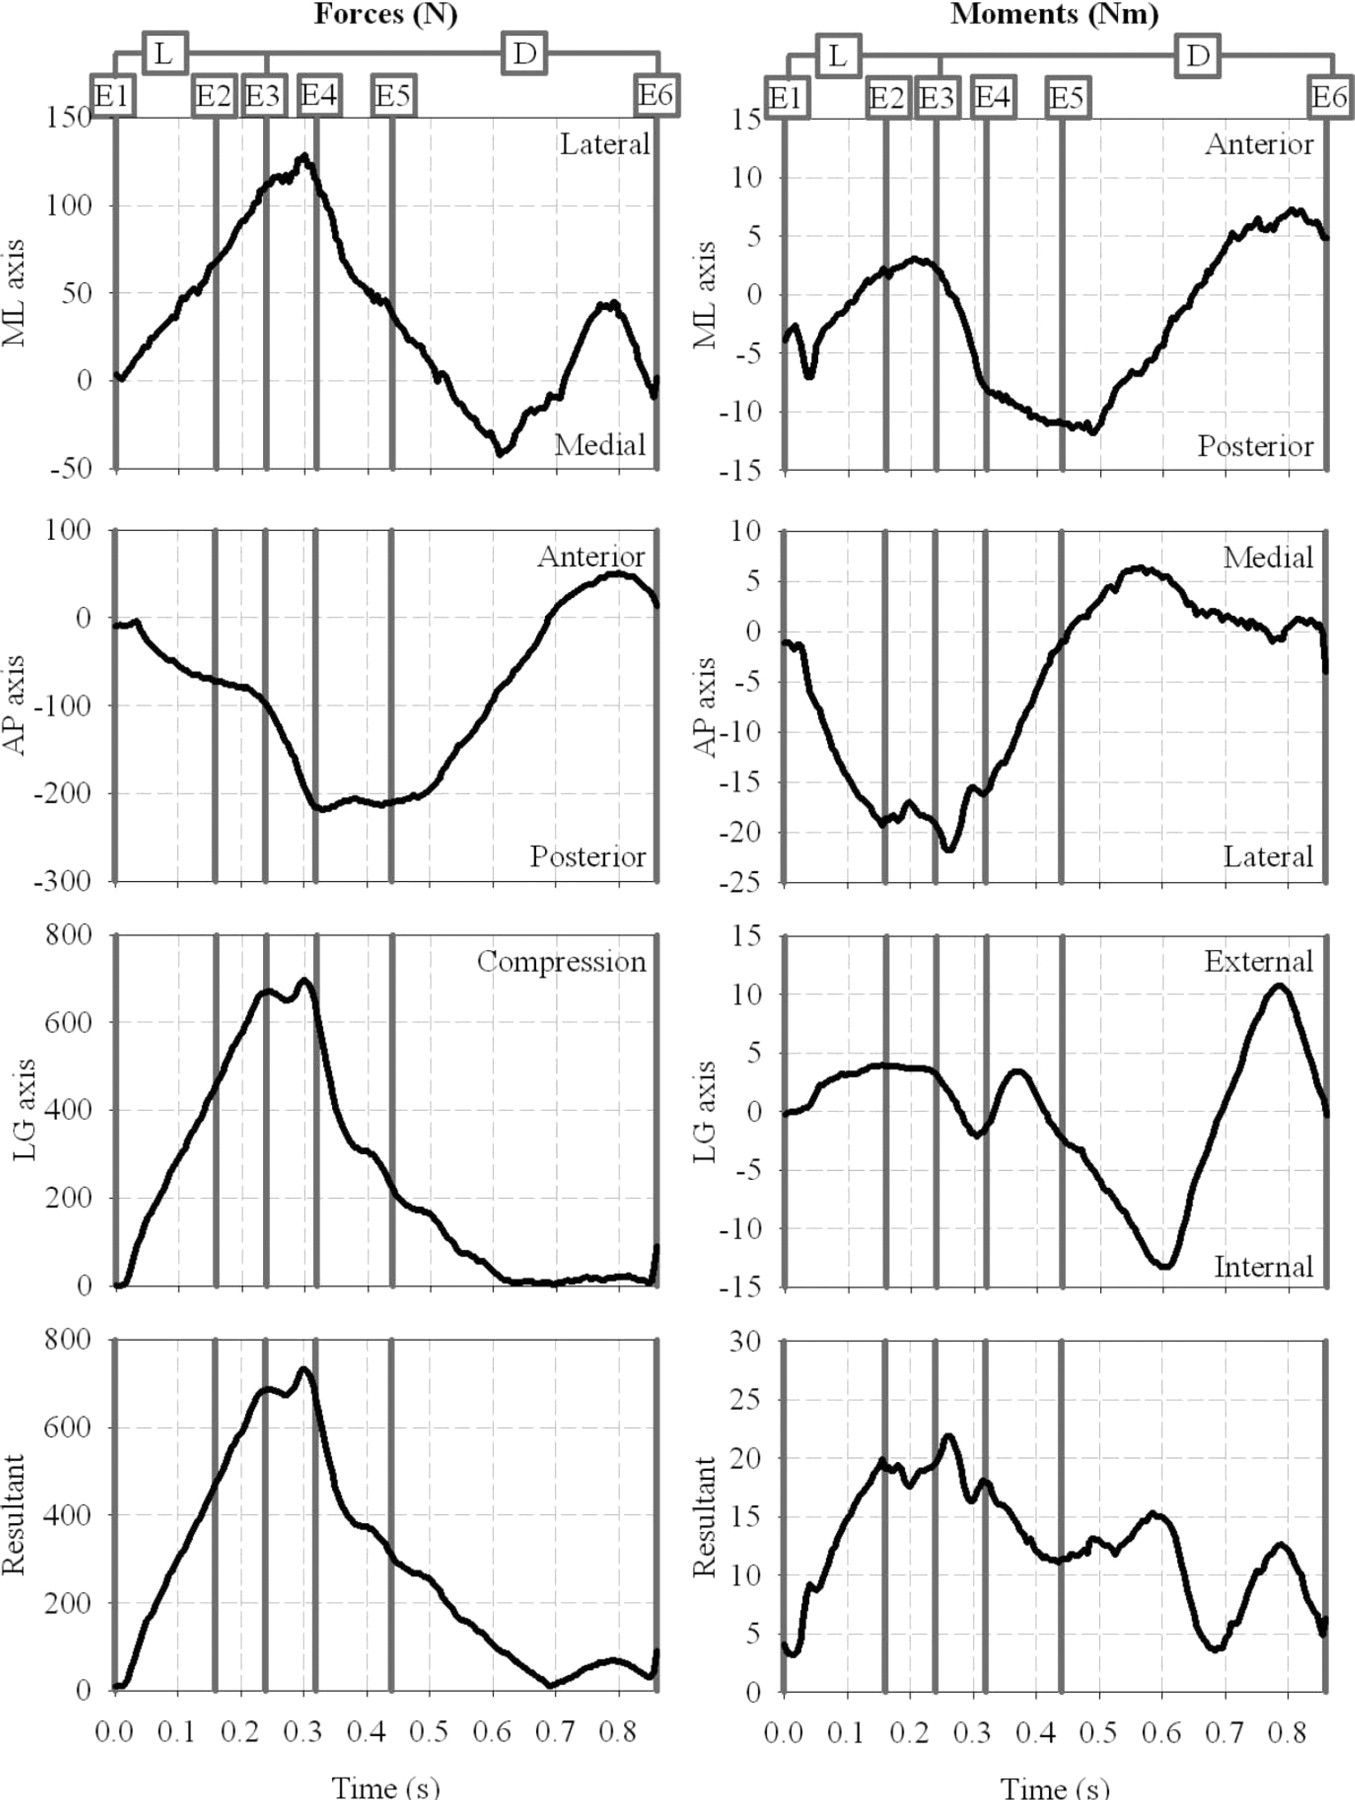
Overview of resultant and three components of the forces and moments on the medio-lateral (ML), antero-posterior (AP) and long (LG) axes of the fixation during the loading (L) and descent (D) phases of the forward fall as determined by the sequence of events (E1-E6). E3 corresponded to the time of descent as determined by Method 1 in Frossard et al. (2010). 31
Variable-to-variable comparison
The durations of loading and descent phases for the force and moment on the three axes for each method are presented by chronological order of detection of E3 in Figure 4. The median (interquartile range) of E3 for the six variables were in the following order: MAP at 163 (30) ms, FAP at 208 (13) ms, FLG at 240 (6) ms, FML at 260 (14) ms, MLG at 275 (30) ms and MML at 295 (21) ms. This order was rather consistent for each method, excluding Method 1 since E3 was a constant for all variables.
Parameters associated with the determination of time of descent (E3) of the load on the three axes for Methods 3, 4 and 5. TI and TF corresponded to the initial and final time defining the window of data values, respectively.
Method-to-method comparison
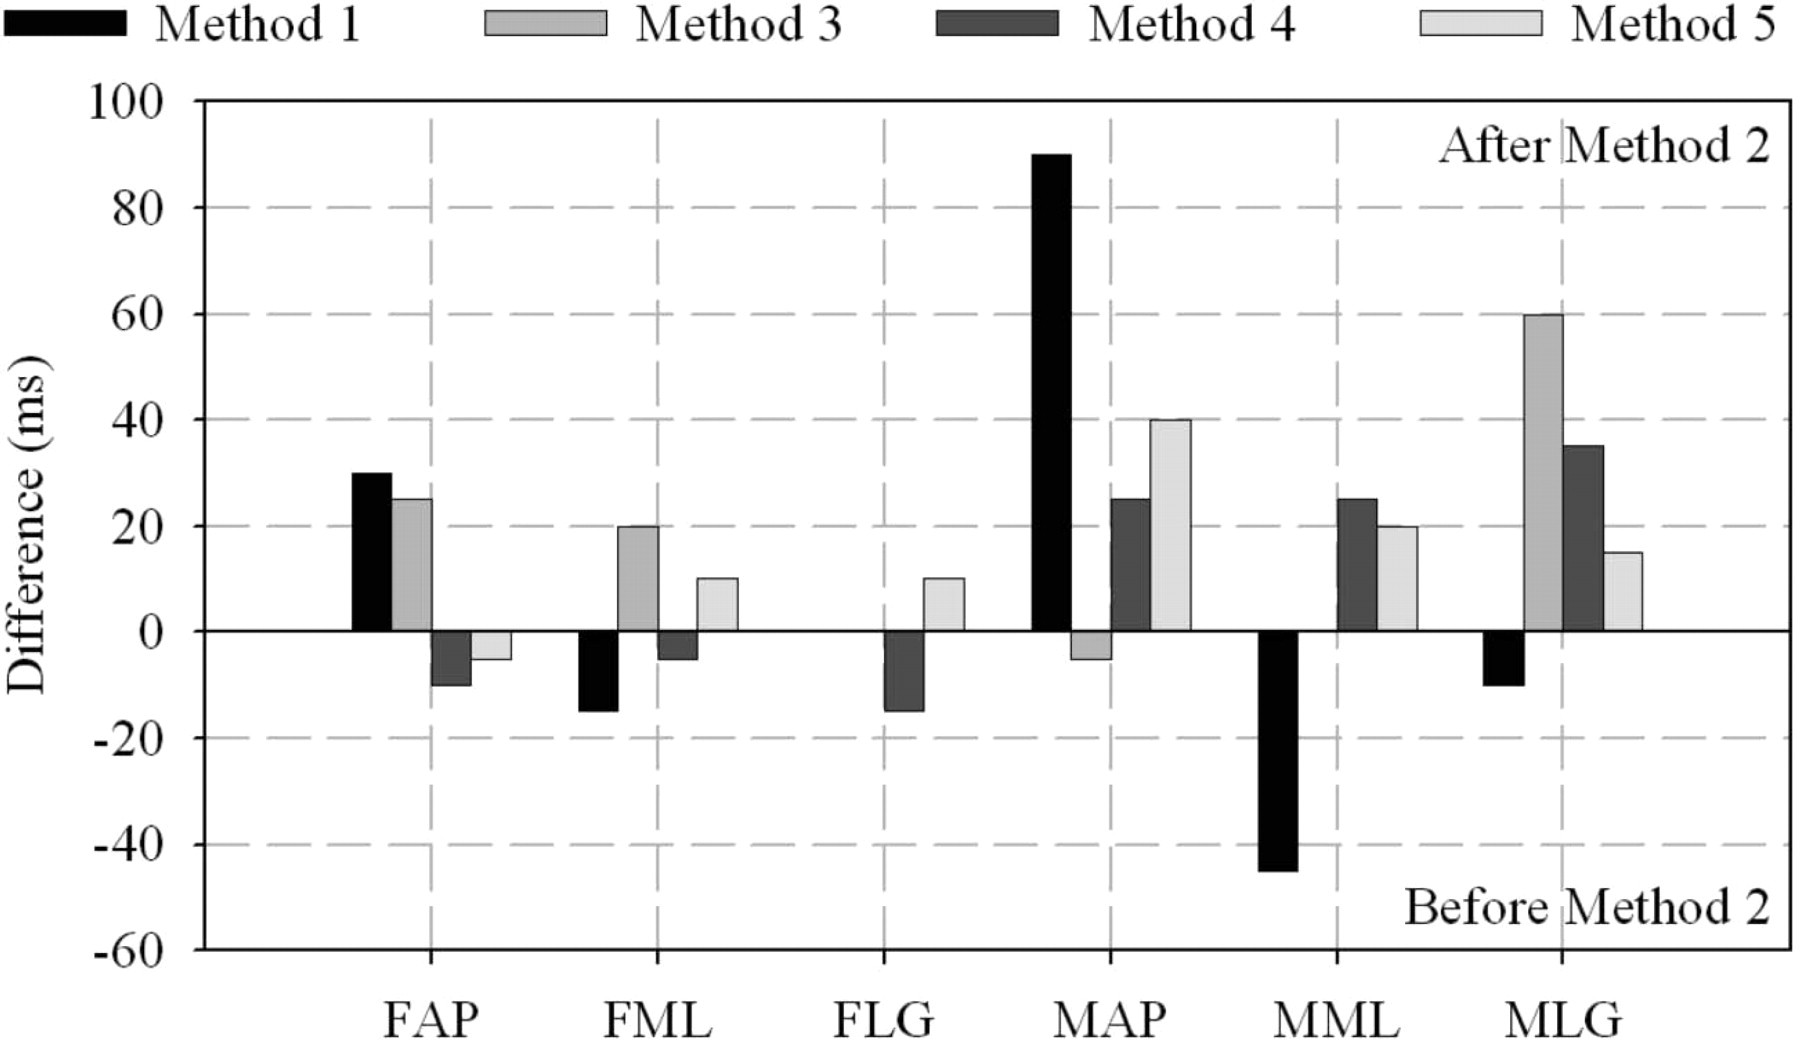
The differences in E3 for the load on the three axes between each method and Method 2 are plotted in Figure 5. The RMS errors of the difference in E3 across three forces and moments between each method and Method 2 ranked by increasing order are presented in Figure 6.
Discussion
Limitations
This study highlighted the difficulty of achieving appropriate detection and assessment of time and duration of descent, respectively. Indeed, the interpretation and transfer of the results to other participants must be conducted with care mainly because of the intrinsic limitations associated with a retrospective single-case study, alike those presented in Frossard et al. (2010). 31
Thankfully, no injuries to the participant and damage to the fixation occurred indicating that the severity of the forward fall was low. Indeed, the maximum force on impact was approximately four times smaller than the force required for a femoral neck and intertrochantric fractures during sideways fall. 40–44 Furthermore, the transition between loading and descent phases might present different patterns on each axis depending on the severity and type of fall (e.g., backward, sideways). The sampling frequency of 200 Hz was sufficient to assess the lower limb kinetics during walking. Indeed, it was sufficient to measure differences between different methods of detection of E3. However, a sample frequency going up to 10,000 Hz might enable a more timely triggering and deployment of a protective mechanism such as an airbag when milliseconds are critical.
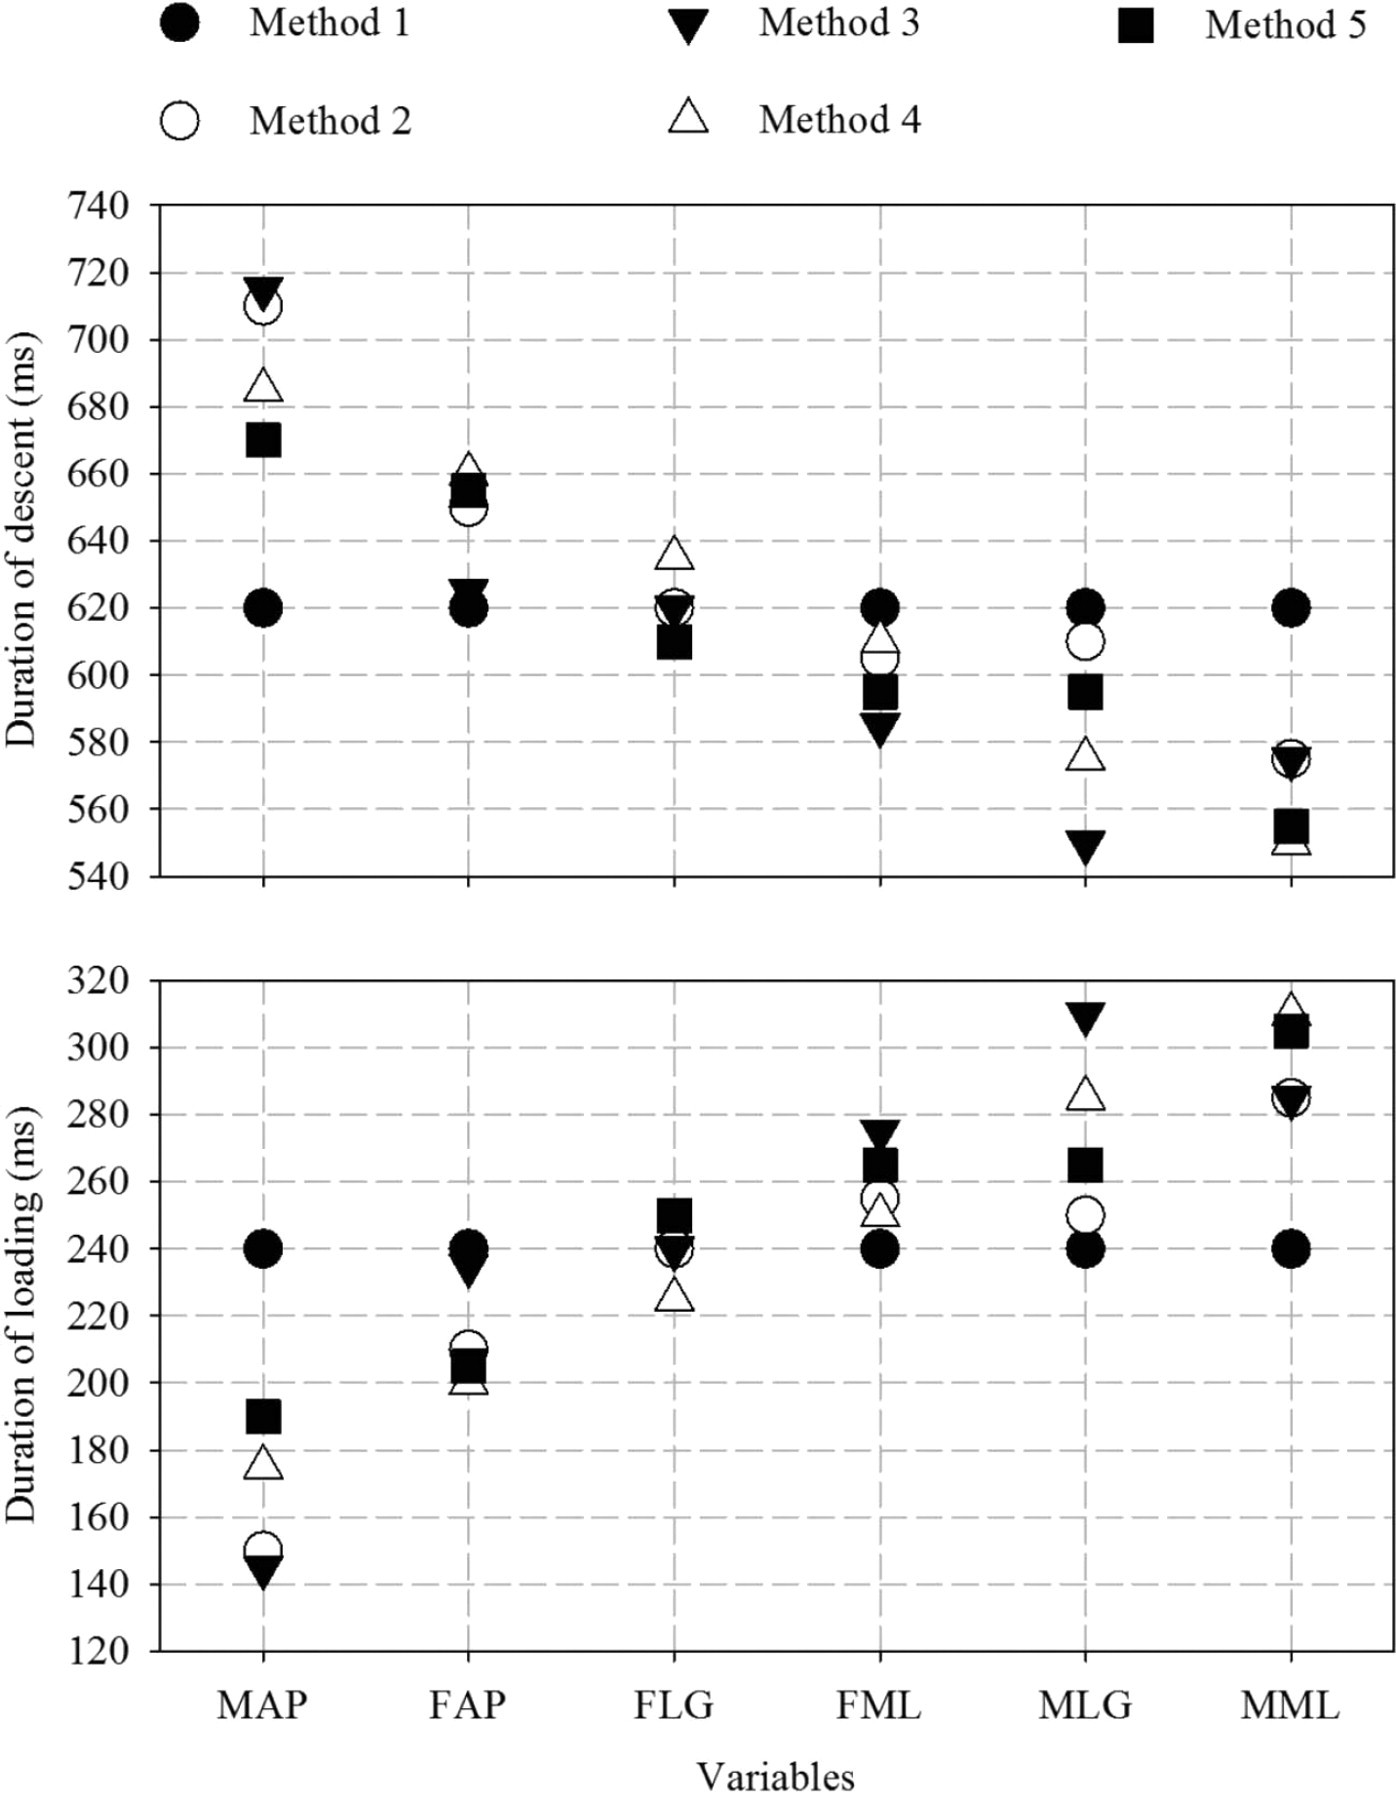
Duration of loading (between E1 and E3) and descent (between E3 and E6) phases for the force (F) and moment (M) along the medio-lateral (ML), antero-posterior (AP) and long (LG) axis for each method presented by chronological order of detection of E3. E1, E3 and E6 corresponded to heel contact, time of descent and beginning of impact, respectively.
Time of descent
Frossard et al. (2010) 31 demonstrated that the descent phase was characterized by sequential events. 31 Each force and moment presented multiple linear sections with different slopes that were not synchronized. This study demonstrated that E3 was also a sequential event. Indeed, in the case of Method 2, the differences between the first (MAP) and the last (MML) E3 was 135 ms with intermediate differences between variables of 60 ms (FAP), 30 ms (FLG), 10 ms (MLG), 5 ms (FML) and 30 ms (MML). The lack of synchronization of E3 and descent phase amongst all the variables makes the detection of the fall, and subsequent triggering a protective device, challenging.
Differences in determination of time of descent for the forces and moments on the antero-posterior (FAP, MAP), mediol-lateral (FML, MML) and long (FLG, MLG) axes between each method and Method 2.
Root mean square (RMS) error of the difference in time of descent across the three forces and moments between each method and Method 2 ranked by increasing order.
Duration of descent
As expected, times and durations of descent were inversely proportional since the beginning of impact was the same for all the variables. Results associated with all the methods, except method 1, indicated that the duration of descent from the last variable detected until the beginning of impact was approximately 575 ms. This provided an estimation of the time required for a protective device to be triggered and deployed. It should be noted that this duration is about 200 ms longer than the ones presented in previous studies focusing on the falls detection of healthy adults using kinematic 19 and gyroscope 24 data.
Slope
The slopes were instrumental in the detection of E3. By definition, the values of the slopes and the windows of data alone were highly dependent on the loading pattern of this given participant. Previous studies focusing on temporal variables, local extrema of load, impulse of forces during both walking 34,45 and activities of daily living 33 demonstrated a low intra-variability and high inter-variability. Consequently, the values would be particularly helpful to further studies of this participant. However, the slope values might be difficult to extend to other amputees due to the effects of confounders (e.g., length of residuum, alignment, speed of walking, height).
Delta
As expected, these results demonstrated that the deltas decreased with the steepness of the slope, particularly for Method 4 and the antero-posterior axis. In principle, some of comments made earlier about the slope apply to deltas. However, the values were expressed in percentage of the load, making them applicable to other participants and, therefore, more transferrable to a generic algorithm. The deltas obtained for Method 4 were difficult to grasp because the derivation tend to blow out of proportion some differences. However, it should be noted that the deltas of the forces obtained with Method 3, ranging from 3–5%, were approximately half of the ones obtained with Method 5, ranging from 9–20%.
Comparison of methods
The aim of numerous mathematical models relying on portable sensors (e.g., acceler-ometers, gyroscope) was to differentiate a fall from various activities of daily living for elderly with higher risks. 18–25,46–48 Another contribution of this study was to reveal aspects of each method that can, in principle, either facilitate or challenge the development of similar algorithms capable of detecting instantaneously a fall while monitoring in real-time the load applied on the residuum of transfemoral amputees during activities of daily living. 36
Method 1 would be easy to implement as only one variable (resultant of forces) involving three channels (components of force) was required, provided that manual input could be systematized. However, it presented the worst results compare to the gold standard with an error nearly twofold greater compared to other methods. This demonstrated that a ‘one-fit-all’ approach is not the most fruitful and each axis must be monitored and analysed individually.
Method 2 was more likely to be the most accurate, considering it was selected as the method of reference. The manual selection of E3 was eased by the benefit of insight. By definition, it cannot be implemented in an algorithm as such because no quantitative criteria were considered. This justified developing other semi or fully automated methods.
Method 3 ranked third in terms of errors. It could be easily implemented, as the boundaries of the regression line can be systematized for each variable. TI can be associated with a recognisable event (e.g., heel contact, toe-off) while TF progresses with the signal. Then, the accuracy of the detection will depend on the signal itself, both in terms of duration and magnitude. This study showed that the RMS error, between the regression line and the measured load, increased as the window of data widened despite the manual detection of the curve that appeared the most linear. More importantly, the detection will depend on the ability of the algorithm to differentiate changes in loading associated with a fall from those deliberated and controlled involved in regular activities of daily living. 36
Method 4 ranked second but with an error comparable to the most accurate method. This study demonstrated that, indeed, the derivation of the load made E3 more discernible due to the accentuation of the change of pattern. Most of the comments associated with Method 3 are applicable to this method. Furthermore, this method will increase computing time due to the signal processing associated with the filtering of the raw load to avoid amplification of the noise and the derivation itself.
Method 5 was the most accurate with the smallest error. This method appeared the easiest to implement systematically relying on instant-by-instant comparison between a template and the signal. In this case, the capacity of the detection will rely on making a template that is generic but yet sufficiently representative of a gait cycle. Only five gait cycles were considered in this study. A more robust template might require more cycles. Nonetheless, here again, the issue will be to recognize variations from the template that are due to a fall rather than regular activities. 36,49
The times of descent were detected using an artificial construct. The benefit of insight allowed Methods 1 and 2 to rely only on manual inputs. The other methods were semi-automated as windows of data were determined manually. Clearly, not a single method seems to hold the solution for an efficient detection of E3. Instead, it appears that a combination of Methods 3, 4 and 5 might be more efficient to increase the specificity of the detection and, therefore, reduce the detection of false positive falls. 27
Future studies
The development of a fully automated fall detection algorithm for transfemoral amputees was outside the scope of this study. However, the possibilities for longitudinal studies are endless, particularly for the ones testing Methods 3, 4 and 5 independently or combined during continuous recording of activities of daily living. 36,49 The sensitivity (capacity to detect a fall) and the specificity (capacity to detect only a fall) analysis based on true and false positive detections 27 will be essential to characterize the behaviour of the methods presented here not only within and in-between inactivity, stationary loading and locomotion 36,49 but also when input fall detection thresholds varies (e.g., delta, determining of upper and lower lines of regression).
The detection methods presented here will also facilitate cross-sectional studies of simulated falls associating the methods presented here with the biomechanical tests presented by Blumentritt et al. (2009) 50 for a larger cohort of transfemoral amputees. This will provide a better understanding of the participant-to-participant and fall-to-fall (e.g., stoping abruptly, sidestepping abruptly, stepping onto an obstacle, tripping) variability, while completing the kinematic information of the lower limb currently known. Both longitudinal and cross-sectional studies will be essential to further develop a systematic algorithm and prototype of protective device for lower limb amputees.
Conclusions
An insight into the determination of the time and duration of descent of a prosthetic lower limb during a real forward fall was provided for the first time. This included the presentation of five different methods of assessment of these variables as well as examples of values for an amputee fitted with an osseointegrated fixation.
The fall might appear sudden with a naked eye. However, this study demonstrated that a short transition between walking and falling was characterized by times of descent of the residuum that occurred sequentially on the three forces and moments. Also, the time of deployment of a protective device should have been within approximately 575 ms to be effective in the fall analysed in this study.
The sensitivity and specificity of an automated algorithm might be improved by combining several methods of detection based on the deviation of the loads measured from their own trends and from a template previously established. This work also highlighted that one of the challenges of this algorithm might be to differentiate deviations due to a real fall from those associated with normal changes of pattern between or within activities of daily living, including inactivity, stationary loading and locomotion.
Finally, this work confirmed that the portable kinetic system presented here could play a role in fall detection as the core instrument of an apparatus involving other complementary sensors (e.g., foot switch, accelerometer), signal processing (e.g., recognition of falling patterns) and protective device (e.g., air bag).
All together, this study provided key information to engineers and clinicians facing the challenge to design automated wearable fall protective equipment and, rehabilitation and exercise programs to restore safely the locomotion of lower limb amputees.