
Abstract
The Kessler Psychological Distress Scale (K10) is a dimensional scale to measure and monitor non-specific psychological distress experienced over a 30 day recall period. The scale was originally developed to efficiently measure non-specific psychological distress in the upper 90th–99th percentile range of the population distribution. Item response theory analysis was applied to select 10 items from a pool of 612 items from existing scales of psychological distress. These 10 items exhibited high precision at the upper end of the dimensional construct in contrast to the lower parts of the distribution. A short form version was then selected that consisted of 6 items embedded within the full form to assess the same construct in a more efficient manner. This resulted in the K6 and the K10 scales, respectively [2]. Since development, the K6 and K10 have shown desirable psychometric properties in a variety of populations (Western and non-Western), including a unidimensional structure [1,3], good utility in identifying DSM-IV and ICD-10 cases [4–6], sensitivity to change after cognitive behavioural therapy [7], and good internal consistency and predictive validity [3,8–9]. For these reasons, and the brevity of the instruments, the K6 or K10 have been widely used in large general health surveys. This in turn has supported clinical studies where the extensive population data provides a comparative reference for the severity of psychological distress found in a variety of physical health conditions. Since this is a large and ever-growing literature, we do not attempt to review it here.
Non-specific psychological distress (NSPD) as measured by the K10 or K6 is a useful construct in its own right, irrespective of any relationship it may have with diagnoses of anxiety and depressive disorders, not least because it can be determined in studies where a diagnostic interview or clinical diagnosis is infeasible. Specifically, the national personal interview general health surveys in Canada, the USA, and Australia have used the K6 or K10 routinely for between 10 and 17 years, and New Zealand has recently adopted the K10 for this purpose. The K10 has also been used for the last 10 years in large routine telephone surveys in NSW, Victoria, South Australia, and Western Australia and as a routine outcome measure in specialist public mental health services in NSW, the Northern Territory, South Australia and Western Australia. Most recently a variant (K5) has been used in the National Aboriginal and Torres Strait Islander Health Survey (2004–2005) and the National Aboriginal and Torres Strait Islander Health Survey (2008). Many of these surveys contain other brief measures of mental health, such as self-reported doctor-diagnosed anxiety or depression, or self-reported long-term conditions chosen from lists that include mental disorders, or (in Canada and the USA) individual anxiety and depression modules from structured diagnostic interviews.
The general result in all these studies is that high and very high levels of NSPD are associated with many health conditions, risk factors and health-related behaviours. Thus a review of the US National Health Interview Survey data on NSPD concluded that the K6 equivalent of very high NSPD identified people with characteristics ‘the same as … persons with serious mental illnesses as described in psychiatric epidemiologic studies.’ [10]. Self-reported long-term mental illnesses are also associated with these variables in much the same way, and with NSPD. Thus the Australian National Health Survey of 2001 showed that ‘people with mental and behavioural problems, regardless of the type, had a significantly higher prevalence of high and a very high level of psychological distress than those people without mental and behavioural problems’ (emphasis added)[11]. This last result underscores the fact that the K6 and K10 are more than ‘screening instruments’ for anxiety and depression. They are good measures of NSPD, first and foremost [11] and their sensitivity to diagnostic constructs varies accordingly [12]. Nevertheless, for a variety of reasons it may be useful to have scoring rules that convert a dimensional scale into a probability of categorical diagnosis, and that is the topic of this paper.
Establishing scoring rules using cut offs for a dimensional construct is a difficult and somewhat arbitrary task and therefore rules may vary depending on the specific use of the instrument. Categorical scoring rules have previously been suggested based on concordance rates with psychiatric diagnoses and applied in epidemiological and clinical settings [6,8,13]. For example, using the K10 in the 2007 Australian National Survey of Mental Health and Wellbeing (NSMHWB), a score of 0–5 is indicative of none or low psychological distress, a score of 6–11 indicates moderate distress, a score of 12–19 indicates high psychological distress, and a score of 20 or more indicates very high distress [14]. Thus, the population can be grouped according to these rules and prevalence and clinical correlates of psychological distress can be easily interpreted. Other studies have identified more refined ways to generate scoring rules by collapsing the K6 and K10 scores into strata based on the probability of having a psychiatric disorder, known as stratum-specific likelihood ratios (SSLR) [4–5]. Briefly, the SSLRs indicate how much an individual's score on the K6 or K10 will increase or decrease their odds of having a given psychiatric disorder in comparison to the general population. The advantage of SSLRs over arbitrary cut-points is that they offer a more useable interpretation of the K6 or K10 scores for researchers since they can estimate the predicted probability of disorder for each individual based on the overall population's pre-test probability (i.e. known prevalence).
More recently, Kessler et al. [1] presented scoring rules for the K6 to generate predicted probabilities of serious mental illness (SMI), defined by the US Substance Abuse and Mental Health Service Administration as having a DSM-IV disorder plus one or more additional severity indicators, using logistic regression models generated from population data in countries that are part of the World Mental Health Survey Initiative [15]. The rationale for distinguishing between individuals with mental illness and serious mental illness was to distinguish a subgroup of severely disabled and distressed individuals in an effort to target those who are most in need of assistance. This approach enables research funding and policy planners to target and prioritize members of the community with SMI. Kessler et al. [1] demonstrated that using the best fitting regression model from each country to weight the K6 scores to generate a predicted probability of SMI for each individual was able to achieve a reasonably good level of concordance in relation to DSM-IV/Composite International Diagnostic Interview (CIDI) defined SMI. As a result, the authors argued that the K6 could be used as a valuable tool to score and generate prevalence rates of possible SMI in epidemiological studies when it is not feasible to conduct a comprehensive diagnostic instrument like the CIDI.
Since Australia is not part of the World Mental Health Survey Initiative, there are no scoring rules based on logistic regression modelling for the Australian general population. The purpose of the current study is to replicate the methodology of Kessler et al. [1] to provide researchers with a method of utilizing scoring rules for the K6 and K10 when predicting mood, anxiety, or substance use disorders with serious impairment (MASSI) in Australia. In addition the current study will provide scoring rules for the Kessler scales when predicting DSM-IV 12 month mood, anxiety, or substance use without the additional seriousness indicators (MAS) and DSM-IV 12 month mood and/or anxiety without the additional seriousness indicators (MA). To faciliate the use of these scoring rules their performance will be examined in sub-populations of interest in the total Australian population.
Methods
Sample
The data for the current study were from the 2007 Australian National Survey of Mental Health and Wellbeing, a cross-sectional household survey of the Australian general population (excluding very remote areas) administered by the Australian Bureau of Statistics (ABS) and funded by the Australian Government Department of Health and Aging (DoHA). The survey employed a randomly selected, stratified, multistage area design that originally sampled 14 805 households. Due to non-response rates the final survey resulted in 8841 households (a response rate of 60%) representing an estimated 16 015 000 Australian adults. Over-sampling (a greater probability of being selected for the interview) of the young (16–24) and old (65–85) age groups was applied at this stage to ensure that a sufficient sample size was selected to improve the reliability of estimates for these groups [16]. Socio-demographic characteristics of the 2007 Australian survey are presented in Table 1.
Socio-demographic characteristics of respondents surveyed in the 2007 National Survey of Mental Health and Wellbeing
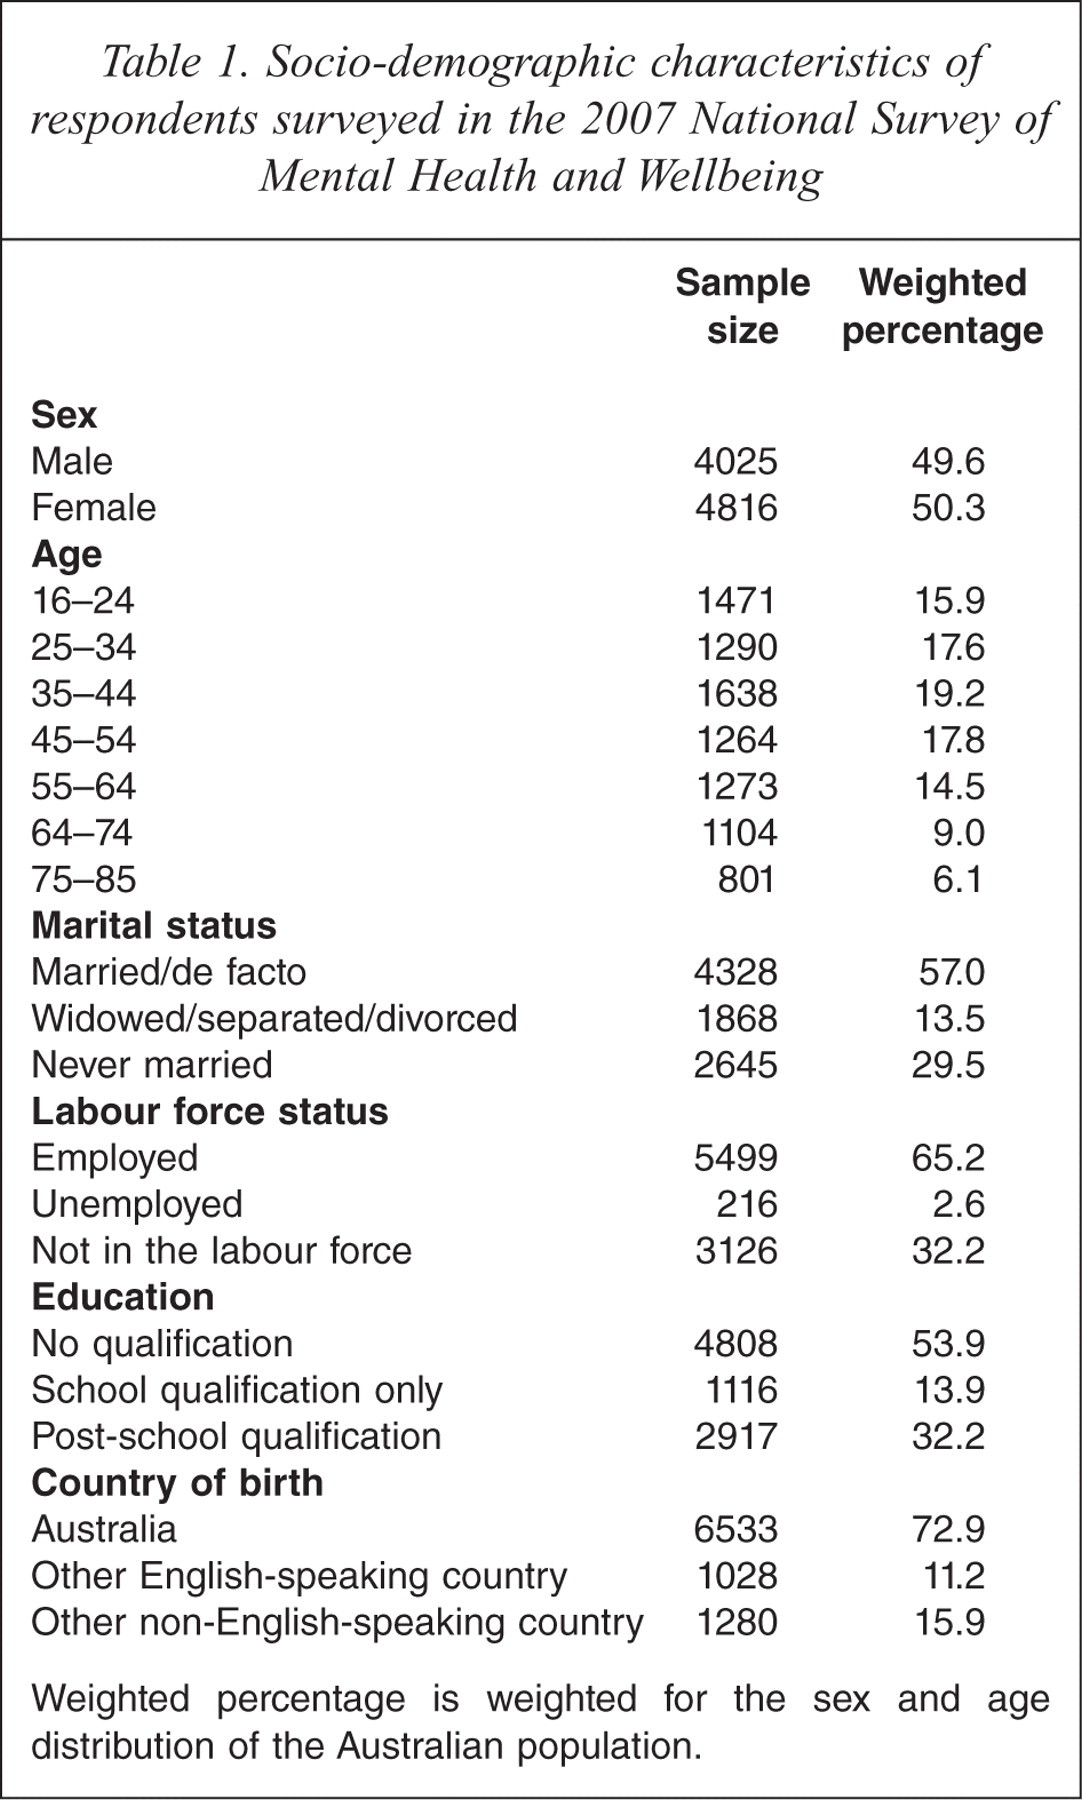
Weighted percentage is weighted for the sex and age distribution of the Australian population.
Measures
Diagnostic assessment
Lifetime and 12 month diagnostic information for the DSM-IV mood, anxiety, and substance use disorders were collected in the Australian survey using the World Mental Health version of the Composite International Diagnostic Interview (WMH-CIDI) [17]. This instrument is a fully structured lay administered psychiatric interview with sound psychometric properties. Blinded clinical calibration studies of the WMH-CIDI using the Structured Clinical Interview for DSM-IV (SCID) have been conducted on smaller subsamples of epidemiological surveys conducted in the USA and in countries that are part of the World Mental Health Survey consortium, with good concordance for the majority of DSM-IV disorders [18].
The DSM-IV disorders that were assessed in the Australian NSMHWB included depression, dysthymia, bipolar disorder (manic episode), panic disorder, social phobia, agoraphobia, generalized anxiety disorder, substance use disorders (abuse and dependence), obsessive–compulsive disorder, and post-traumatic stress disorder. A five item screener for psychosis was used to identify the probable lifetime and 12 month presence of psychotic disorder. Lifetime diagnoses were assessed by ascertaining the presence of DSM-IV diagnostic criteria across the respondent's lifespan. A 12 month diagnosis was then generated by ascertaining whether symptoms had been present in the past 12 months. In the current study, respondents with one or more DSM-IV mood, anxiety, or substance use disorder present in the past 12 months were classified as positive for DSM-IV MAS and those with one or more DSM-IV depressive (major depressive disorder or dysthymia) or anxiety disorder present in the past 12 months were classified as positive for DSM-IV MA.
DSM-IV mood, anxiety, or substance use with serious impairment (MASSI)
DSM-IV MASSI was classified in the current study using similar coding to Kessler et al. [1] and Demyttenaere et al. [19] and is closely linked to the US legal definition of SMI. Briefly, a respondent was coded as having MASSI if they met criteria for one or more 12 month DSM-IV mental disorder measured by the WMH-CIDI (mood, anxiety, or substance use) plus the presence of one or more severity indicators, which included meeting criteria for bipolar I disorder or substance dependence with physiological dependence, a previous suicide attempt, at least two areas of serious role impairment due to their mental health as indicated by the Sheehan Disability Scale, or overall functional impairment at a level consistent with a Global Assessment of Functioning (GAF) score of 50 or less in conjunction with a mental disorder. For the current survey the predicted GAF score was calculated using the maximum number of days out of role and scores from the Sheehan Disability Scale domains (see the 2007 National Survey of Mental Health and Wellbeing: users' guide [14] for detailed information on the coding scheme).
The Kessler Psychological Distress Scale
The K10 scale contains 10 items on a 5 point scale ranging between 0 and 4 that assesses how often the respondent has experienced symptoms of generic psychological distress over the past 30 days. K10 items have usually been scored on a scale ranging from 1 to 5 in previous Australian studies; however, the current paper will report K10 results using the range of 0–4 to remain consistent with international data. Therefore, total scores can range from 0–40 for the K10 or 0–24 for the K6, with higher scores indicating higher levels of distress. The K6 scale consists of six items that are embedded within the K10 scale, which include feelings of nervousness, hopelessness, restlessness or fidgeting, so depressed that nothing could cheer you up, that everything was an effort, and feeling worthless. Again, the total score for each respondent is calculated by summing the unweighted items resulting in a score between 0 and 24, with higher scores indicating higher psychological distress. It should be noted that slight wording and order changes have taken place over the years, most notably with the ‘so depressed that nothing could cheer you up’ item. The current study utilizes the latest version of the K10 ++ as contained in the 2007 Australian NSMHWB and therefore caution should be taken for researchers who wish to apply these scoring rules to previous versions of the K10 used in older surveys such as the 1997 Australian NSWMHWB. Previously, the Kessler scales have been shown to possess good psychometric properties with significant and high correlations with other measures of psychological distress and good concordance with DSM-IV mental disorders [1–9].
Statistical analysis
The method detailed in Kessler et al. [1] was closely followed to generate a series of nested logistic regression equations to predict DSM-IV 12 month MASSI using the K6 or K10 separately in the current study. Please see Kessler et al. [1] for a more detailed description of the statistical procedure. Briefly, a total of 93 regression equations were estimated to predict MASSI using either the K6 or K10 independently or controlling for age (16–39 versus 40 ++), sex (male versus female), education (completed no more than secondary education versus completed more than secondary education), the pairwise and three-way interactions between socio-demographics, and finally the interactions between the Kessler scales and socio-demographics. To account for the possibility that the associations between the Kessler scales and the log-odds of MASSI were non-linear, a series of models with linear, quadratic, and third-degree forms of the Kessler scales were also entered as predictors in the model. The nested models were then compared to one another and the best model was selected using the Akaike information criterion (AIC) and Bayesian information criterion (BIC), the model exhibiting the lowest AIC and BIC value is selected as the best fitting model [20]. AIC and BIC values can often produce discordant results, therefore when the AIC and BIC values indicated two different models, the choice of one best model was based on the model that was the more parsimonious.
Parameters from the best fitting model were then used to generate estimates of predicted probabilities for MASSI for each respondent in the survey. The predicted probabilities were then compared with the actual MASSI variable in the Australian survey using receiver operating characteristic (ROC) analysis. The choice of the area under the ROC curve (AUC) to measure concordance between the predicted probabilities and the true prevalence of MASSI was based on the study by Kessler et al. [1] who define AUC by stating that: ‘The AUC can be interpreted as the probability of correctly identifying a case of SMI in a series of paired comparison tests in which scores on the K6-transformed predicted probability scale are compared between one randomly selected respondent with SMI and one randomly selected respondent without SMI and the respondent with the higher score is estimated to be the one with SMI.’ AUC values technically can range from 0.0 to 1.0, but those of interest range from 0.5, indicating the predicted probability is unrelated to MASSI, to 1.0 indicating that the predicted probability is perfectly related to MASSI.
As detailed further in Kessler et al. [1], researchers need to take into consideration the uncertainty of inference from the predictions equations when estimating the prevalence of MASSI using the regression scoring rules presented in the current study. Researchers should use a method of multiple imputation to generate a number of different estimates of predicted probability of MASSI and their standard errors corrected for this imprecision in their sample. Thus, regression parameters for the best fitting model were estimated in 10 pseudo-samples equal to the total sample size of the 2007 Australian survey (n = 8841). These samples were randomly selected from the Australian survey using a ‘with replacement’ technique, meaning that every respondent has an equal chance to be included in each pseudo-sample either once, more than once, or not included at all, therefore producing slight variations between the regression parameters due to the differing composition of each pseudo-sample. The best fitting model was then estimated in each of the 10 pseudo-samples to produce the 10 prediction equations required for the multiple imputation procedure. With the basic replication done, the same methods were repeated for predicting DSM-IV MAS and DSM-IV MA. These last analyses are likely to be of most interest in Australia.
Results
The observed prevalence of 12 month MASSI was 4.7%, of MAS 17.7%, and of MA 14.4%. To demonstrate the relationship between MASSI as estimated by the WMH-CIDI and psychological distress as estimated by the K10, the prevalence of MASSI was calculated separately for those with low, moderate, high, and very high levels of psychological distress (using the standard Australian cut points described in the introduction). As can be seen in Figure 1, the prevalence of MASSI is strongly associated with psychological distress (χ2 = 48.7, p < 0.001), providing a simple indicator that the K10 and K6 would be a good predictor in the analysis.
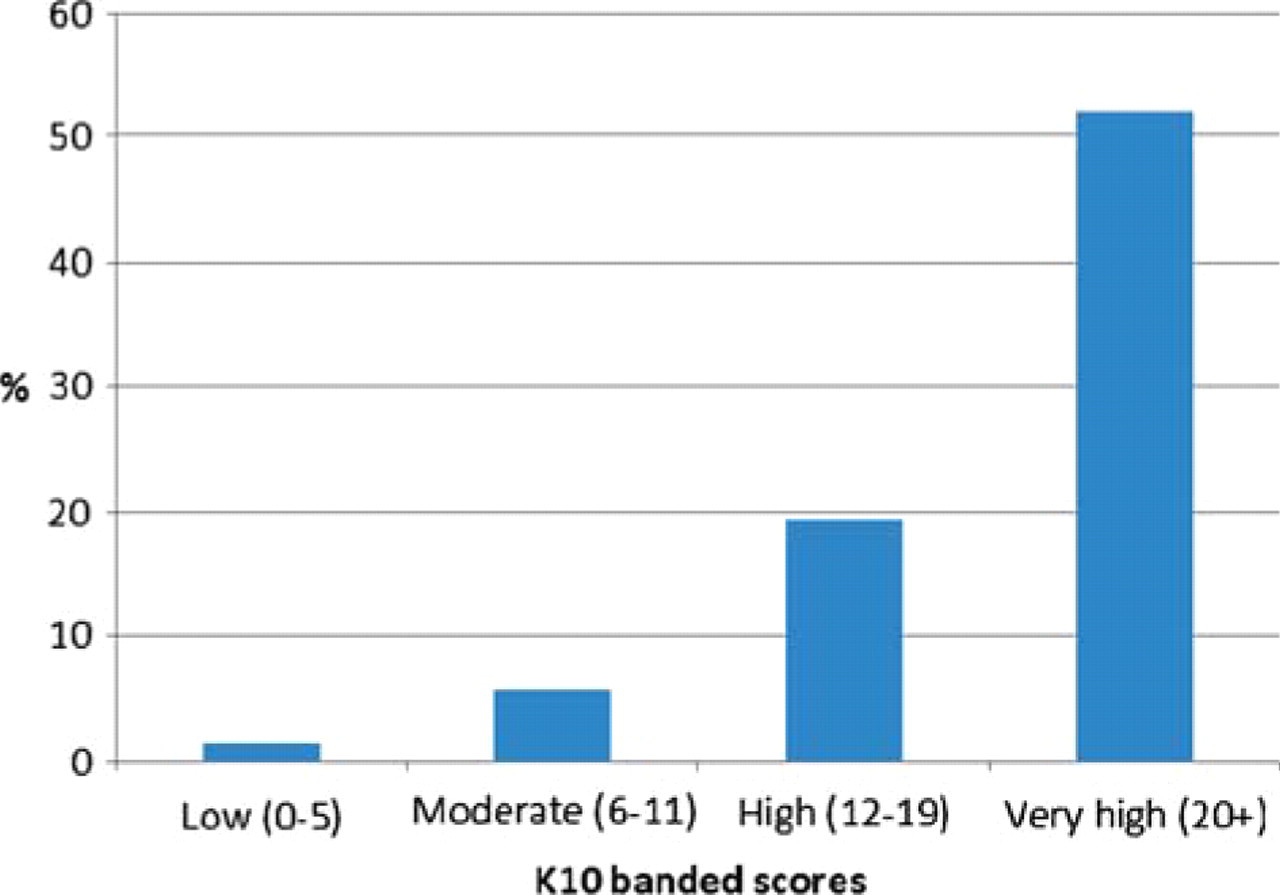
Prevalence of 12 month MAS with serious impairment among individuals with low, moderate, high and very high psychological distress as measured by the K10 in the Australian general population.
The AIC and BIC values indicated that the best fitting model for predicting DSM-IV 12 month MASSI using the K6 in the Australian general population was a model with the quadratic form of the K6 controlling for the dichotomized age variable. There were no significant interactions between the socio-demographics or between the K6 and socio-demographics. The best fitting model, as indicated by AIC and BIC, for predicting DSM-IV 12 month MASSI using the K10 in the Australian general population was a model with the quadratic form of the K10 controlling for age and sex. Like the prediction equation for the K6, there were no significant interactions between the socio-demographics or between the K10 and socio-demographics. The significant coefficients for the quadratic form of the K6 and K10 indicate that the log-odds of MASSI increased at a decreasing rate as the value of K6 and K10 increased. The results for predicting DSM-IV MAS in the past 12 months using K6 and K10 were similar to the analysis using MASSI, albeit the best fitting models for both the K6 and K10 contained the quadratic form of K6/K10 controlling for age, and no interactions were significant. Finally, the results for predicting DSM-IV MA in the past 12 months using K6 and K10 were slightly different, with the best fitting model containing the third-degree form of K6/K10 and containing one significant interaction between age and sex.
Using these best fitting models to estimate the predicted probabilities of MASSI in the Australian total sample and comparing with DSM-IV/CIDI prevalence, there was reasonably good concordance as evidenced by an AUC value of 0.85 and 0.86 for the K6 and K10, respectively. AUC values of 0.80 and 0.81 were estimated for the K6 and K10 when predicting MAS, and AUC values of 0.81 and 0.83 for K6 and K10 when predicting MA. The reasonable prediction accuracy generated by the prediction equations supports the use of the K6 and K10 to estimate the predicted probabilities of MASSI, MAS, and MA in the Australian general population. The regression parameters for the K6 and K10 produced in each of the 10 pseudo-samples are presented in Table 2, Table 3 and Table 4.
Parameter estimates (standard errors) in ten pseudo-samples for the best fitting model to predict DSM-IV 12 month mood, anxiety, or substance use disorders with serious impairment from past-month K6 and K10 scores in the Australian general population
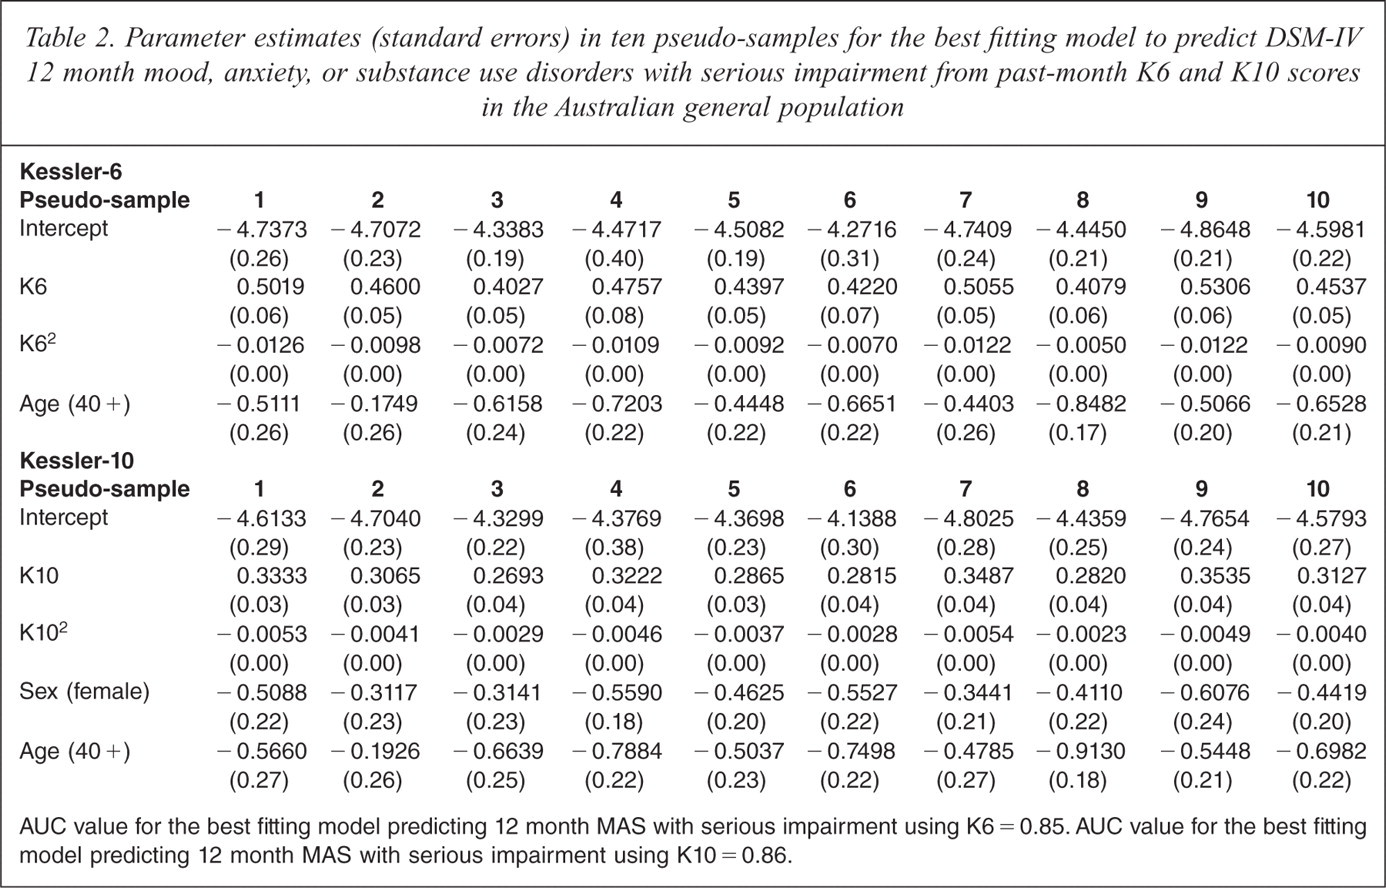
AUC value for the best fitting model predicting 12 month MAS with serious impairment using K6 = 0.85. AUC value for the best fitting model predicting 12 month MAS with serious impairment using K10 = 0.86.
Parameter estimates (standard errors) in ten pseudo-samples for the best fitting model to predict DSM-IV 12 month mood, anxiety, or substance use disorders from past-month K6 and K10 scores in the Australian general population
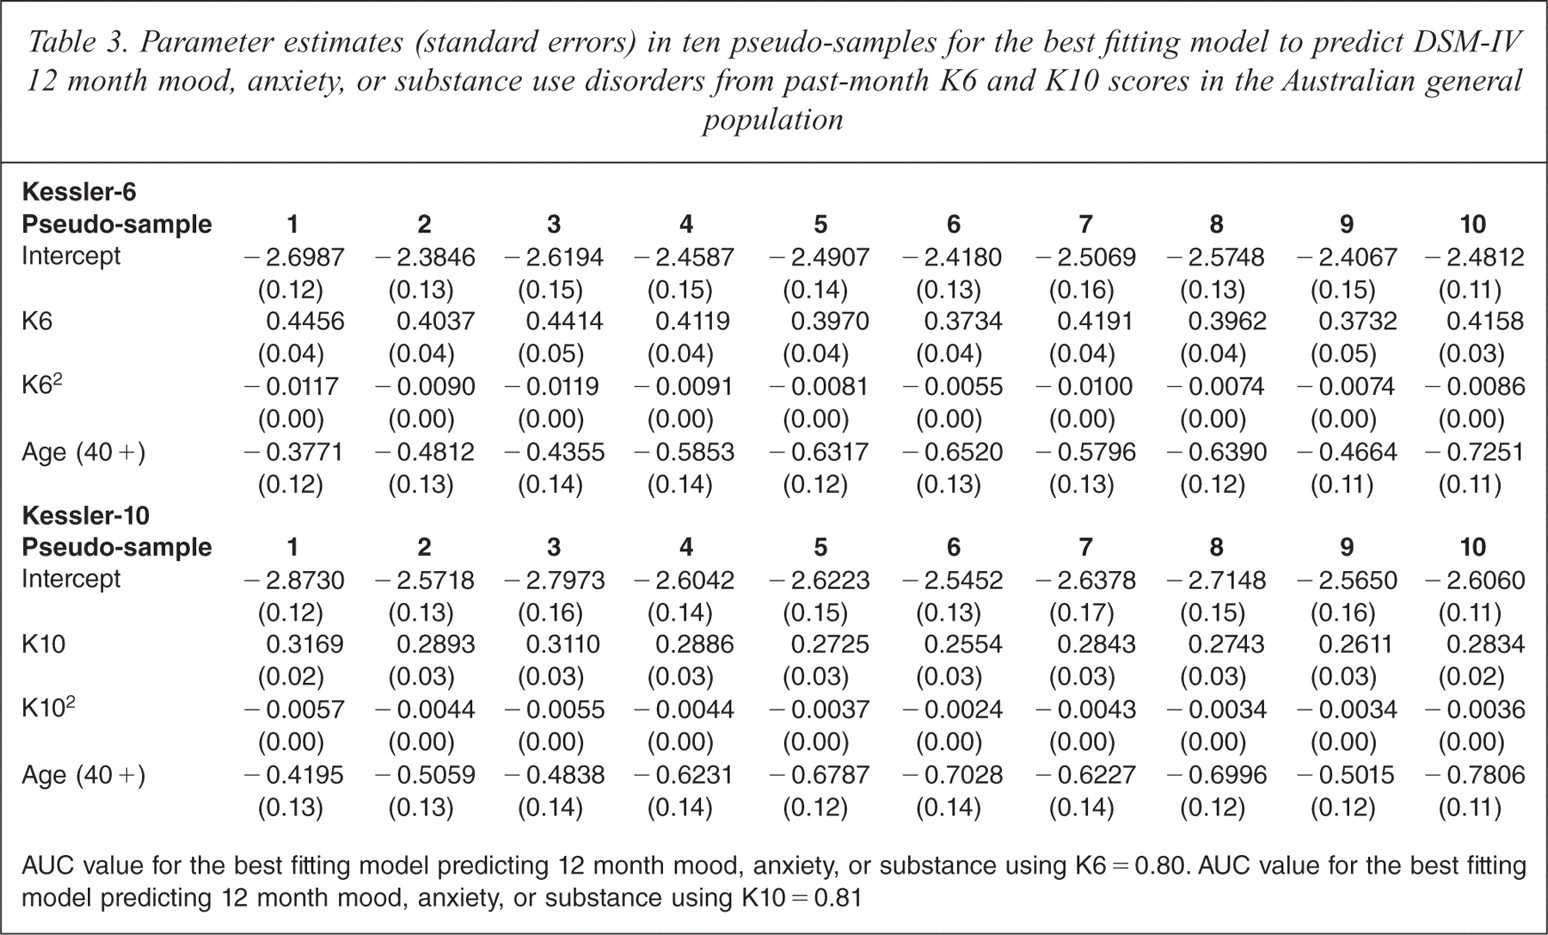
AUC value for the best fitting model predicting 12 month mood, anxiety, or substance using K6 = 0.80. AUC value for the best fitting model predicting 12 month mood, anxiety, or substance using K10 = 0.81
Parameter estimates (standard errors) in ten pseudo-samples for the best fitting model to predict DSM-IV 12 month anxiety/depression from past-month K6 and K10 scores in the Australian general population
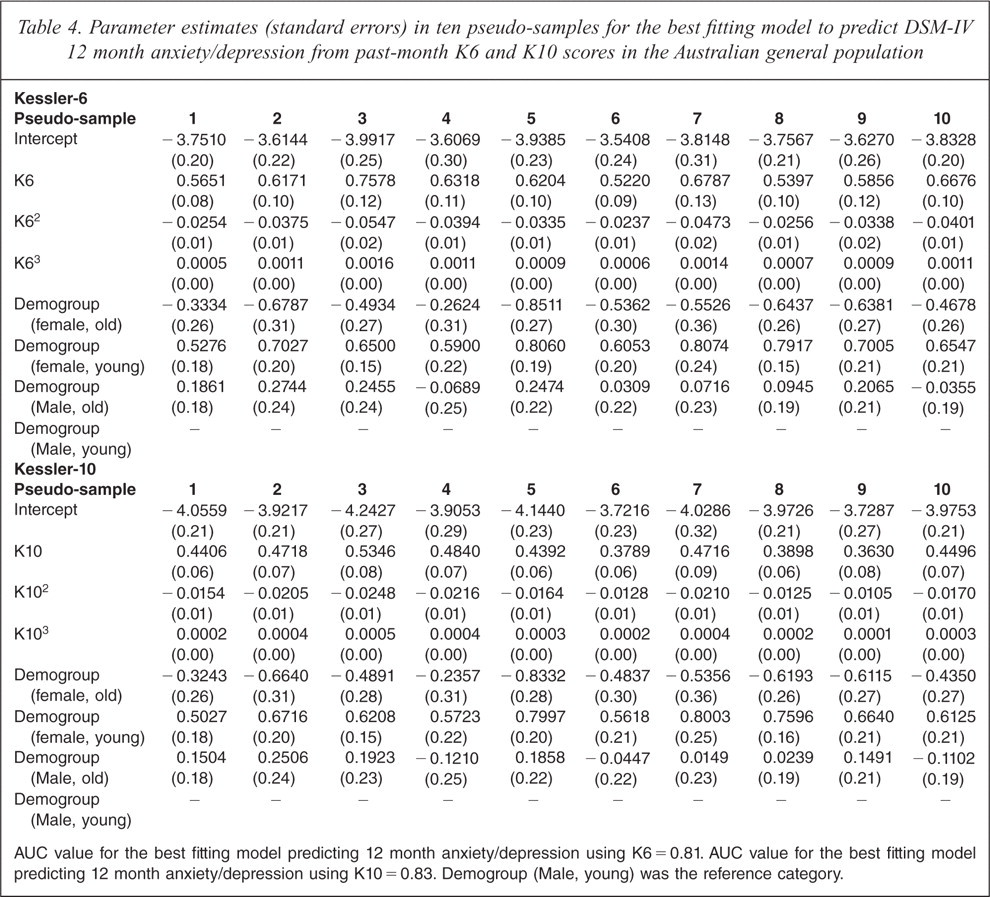
AUC value for the best fitting model predicting 12 month anxiety/depression using K6 = 0.81. AUC value for the best fitting model predicting 12 month anxiety/depression using K10 = 0.83. Demogroup (Male, young) was the reference category.
Estimating MASSI prevalence in populations of interest
To facilitate and clarify the use of the scoring rules presented above, various sub-populations of the survey data based on variables of interest were selected and the regression weights were applied to estimate the predicted probability of MASSI in each group. The predicted probability was then compared to the actual prevalence estimate generated by the CIDI for that sub-population to examine the performance of the regression equations. To estimate the predicted probabilities for a specific population of interest new variables need to be constructed containing values of K62 to generate the non-linear form in the logistic regression and a new dichotomous age variable will then need to be created where a value of 1 is assigned to each individual with an age < 40 and a value of 2 assigned to each individual with an age ≥ 40. The next step is to then run 10 parallel analyses by estimating the predicted probabilities of MASSI for each individual in the target population using the 10 slightly different parameter estimates presented in Table 2. That is, use the parameter estimates from pseudo-sample 1 to generate the first imputation of predicted probabilities of MASSI then use the parameter estimates from pseudo-sample 2 to generate the second imputation of predicted probabilities of MASSI, and so on until all 10 imputations are complete. The final step is to combine the results produced by each of the 10 datasets using Rubin's rules for multiple imputation to generate the overall mean of the predicted probabilities and standard errors corrected for imprecision [21]. This procedure can be easily conducted using SAS or any other basic statistical software package. Example syntax for implementing this procedure using SAS is available on request from the corresponding author.
The first population of interest focused on respondents who were told by a doctor or nurse that they had a chronic physical condition at some point in their life, whilst the second population of interest focused on respondents who reported ever seeing a mental health professional (psychiatrist, psychologist, mental health nurse, other specialist mental health services) for problems with their physical or mental health. The selection of these populations was based on the assumption that these respondents are likely to seek help from various health services and therefore represent a population of interest to researchers and clinicians wishing to use these scoring rules. In the first sample of respondents with chronic physical conditions (n = 4714), the estimated prevalence of DSM-IV MASSI generated from the CIDI was 4.88% with a 95% confidence interval ranging between 4.03% and 5.73%. Using the logistic regression weights to generate a predicted probability of MASSI using scores on the K6 generated a prevalence of 4.82% with a 95% confidence interval ranging between 4.11% and 5.53%. In the second sample of respondents who consulted with a mental health professional (n = 1963), the estimated prevalence of DSM-IV MASSI generated from the CIDI was 14.88% with a 95% confidence interval ranging between 12.35% and 17.41%. Using the logistic regression weights to generate a predicted probability of MASSI using scores on the K6 generated a prevalence of 8.89% with a 95% confidence interval ranging between 7.56% and 10.21%. These results indicate that using the K6 to estimate the population prevalence of DSM-IV MASSI is suitable in respondents with chronic physical conditions; however, in a proxy clinical sample (i.e. respondents that seek help from a mental health professional) the DSM-IV MASSI prevalence generated by the K6 may be underestimated.
Discussion
The current study sought to replicate the scoring rules of Kessler et al. [1] using logistic regression modelling to generate predicted probabilities of MASSI using the K6 and K10 scores in the 2007 Australian National Survey of Mental Health and Wellbeing. The results of the current study revealed that a relatively simple model for the Kessler scales can generate scoring rules of MASSI with concordance estimates generally in the moderate to good range. The results presented here are similar to those found in 14 other countries that are part of the World Mental Health Survey Initiative [1]. In particular, the median concordance rate for K6 predicting US defined SMI in all other countries, as evidenced by the AUC values, was 0.83, a figure that is consistent with the value of 0.85 found in the Australian population. Therefore, similar to the conclusion by Kessler et al. [1], the current study reveals that the K6 and K10 can be used as a tool for estimating MASSI in the Australian general population when it is not feasible or desirable to conduct a lengthy diagnostic interview.
The results from the current study also indicate that using the K6 and K10 to predict 12 month MAS and 12 month MA possesses slightly lower predictive power in comparison to predicting 12 month MASSI, as evidenced by the AUC values. This finding may reflect the fact that the K10 was originally developed to assess non-specific psychological distress at the higher severity levels of the latent trait as opposed to the lower severity ranges [2]. Since individuals with MASSI are likely to fall within the upper end of the severity range on the underlying latent trait of non-specific psychological distress, it seems justified that the current study demonstrated that the K6 and K10 can better predict the presence of MASSI as opposed to 12 month MAS or 12 month MA. It is also consistent with other findings that the K6 and K10 are more sensitive to some diagnoses than others within the MA spectrum [12]. The relatively poor performance of these whole-population calculations in a (lifetime) help-seeking population is disappointing, but perhaps not surprising. The average time symptomatic for anxiety and depression in the 1997 NSMHWB, as estimated by the ratio of 4 week to 12 month diagnoses of MA, was around 72%; that is, an average episode duration of about 8 months in a year. People with a lifetime history of help-seeking would presumably seek help for a 12 month MASSI condition, and treatment for MA disorders is reasonably effective. Thus a past month K6 or K10 might genuinely reflect the current status of those whose 12 month MASSI had been relieved. This would not alter its value in people currently seeking treatment for a current condition where treatments have yet to relieve their psychological distress.
It should be noted however, that despite possessing relatively good concordance with DSM-IV/CIDI prevalence, there is a chance that a true case may not be detected by the Kessler scales and vice versa, therefore deriving the prevalence of any mental disorder using the Kessler scales only should always be treated with some level of caution, and ideally the period prevalence should be one month for a one-month K10 or K6. Furthermore, while the prediction equations estimated in the current study are applicable to survey data from the Australian general population they may not generalize to other countries or to particular clinical populations. Further work is required to generate scoring rules using logistic regression weights for the Kessler scales in various clinical, general health, and specialist health populations. That being said, the procedure presented in the current study is computationally demanding and may not be appropriate to formulate a diagnostic decision as part of routine use in clinical settings where a diagnosis is required immediately. Instead, the procedure may be limited to estimating population-based prevalence using the Kessler scale in various research settings. Despite these limitations, a major strength of the current analysis is that the prediction equations are free from any order effects that may occur during the administration of the CIDI prior to the K10 [22]. In the Australian survey the K10 has been administered prior to the CIDI, as in the Canadian studies [12], which is what one would ordinarily do with a screening tool, and matches the general health surveys where a CIDI interview is not conducted. The advantage of this is that the prediction equations are free from any bias that may be introduced if the CIDI was administered prior to the K10.
The current study provides an additional approach for scoring the Kessler scales using logistic regression weights to best estimate the prevalence of DSM-IV mood, anxiety, and substance use disorders in the Australian general population. This manuscript offers researchers with a comprehensive and sophisticated alternative to scoring the Kessler scales in comparison to various other scoring rules offered previously by Andrews and Slade [6] and Furukawa and colleagues [4,5]. However, the current study does not provide any information regarding the particular benefits and statistical advantages of using the current scoring rules over those presented previously. The choice of which scoring rules to implement should be determined by evaluating the advantages and disadvantages of each approach in relation to the specific context and requirements of each research project. To assist in this decision, future studies should compare the ability of each scoring method to generate an accurate diagnostic decision and specifically evaluate the research conditions that are best suited for each scoring approach.
In conclusion, Australian researchers can use the parameter estimates presented in the current paper to estimate the population prevalence of DSM-IV MASSI, DSM-IV MAS, and DSM-IV MA in the past 12 months with a good level of accuracy. The scoring rules presented here are particularly useful for researchers who are investigating large population and/or community samples and wish to limit the overall assessment time and reduce respondent burden by using shorter screening scales of psychological distress to estimate DSM-IV prevalence.