
Abstract
Since the presence of personality disorder (PD) can adversely affect the quality of life of individuals as well as the management of mental illnesses [1,2], assessment of the personality status of patients should be an essential part of every psychiatric examination. Although not perfect [3], standardized clinical interviews are generally considered to be the most reliable and valid methods available for the assessment of PDs. However, performing such interviews is often rather time consuming. Self-report questionnaires can be useful tools, particularly when employed as part of a two-stage procedure for case identification. Self-report questionnaires, on the other hand, may have relatively poor specificity and may be rather tiring for patients due to the fact that they require the ability to concentrate on often rather lengthy lists of written questions. As a compromise, one could conduct a brief structured interview. Recently, several short structured interviews have been developed. Moran et al. [4], for instance, have constructed such a brief interview for the screening of PD: the Standardised Assessment of Personality – Abbreviated Scale (SAPAS). This interview consists of eight yes/no items, taken from the opening section of an informant-based semi-structured interview, the Standardised Assessment of Personality (SAP) [5,6]. Langbehn et al. [7] have developed the Iowa Personality Disorder Screen (IPDS), which can be completed within 5 min. The IPDS consists of 11 items derived from the DSM-III version of the Structured Interview for DSM-III Personality Disorders (SIPD) [8]. These items correspond to specific DSM symptoms of particular PD diagnoses.
Van Horn et al. [9] introduced a structured interview, the Rapid Personality Assessment Schedule (PAS-R). The PAS-R is an abbreviated form of the original Personality Assessment Schedule (PAS) [10], measuring eight ICD PDs and their main characteristics. The PAS is an extensively used standardized assessment instrument for PDs with adequate psychometric qualities [11,12]. Each disorder can be scored on a three-point scale ranging from 0–2, where 0 refers to the absence of any dysfunction associated with personality traits, 1 to personality difficulty, and 2 to PD. Although the PAS-R performs moderately well as a screening instrument, it requires specific training and still takes more than 15 min to complete.
Another screening instrument, developed by the same authors, is the Quick Personality Assessment Schedule (PAS-Q) [13]. This is a shortened version of the ICD-10 version of the PAS, which takes about a quarter of an hour to complete. It can be used with clients as well as informants. The PAS-Q interview starts with open questions about character and personality traits, interpersonal relationships, job performance, drug problems and law breaking behaviour, followed by eight specific sections with relevancy for PDs: Suspiciousness & sensitivity, Aloofness & eccentricity, Aggression & callousness, Impulsive & borderline, Childishness & lability, Conscientiousness & rigidity, Anxiousness & shyness, and Resourcelessness & vulnerability. To identify a certain PD in each section, there are two screening questions. Positive answers to these questions lead to probing questions and eventually to scoring the characteristics in question. The interviewer assesses the severity of the PD in every section, taking into account the answers to the introductory questions, the specific questions, and available background information.
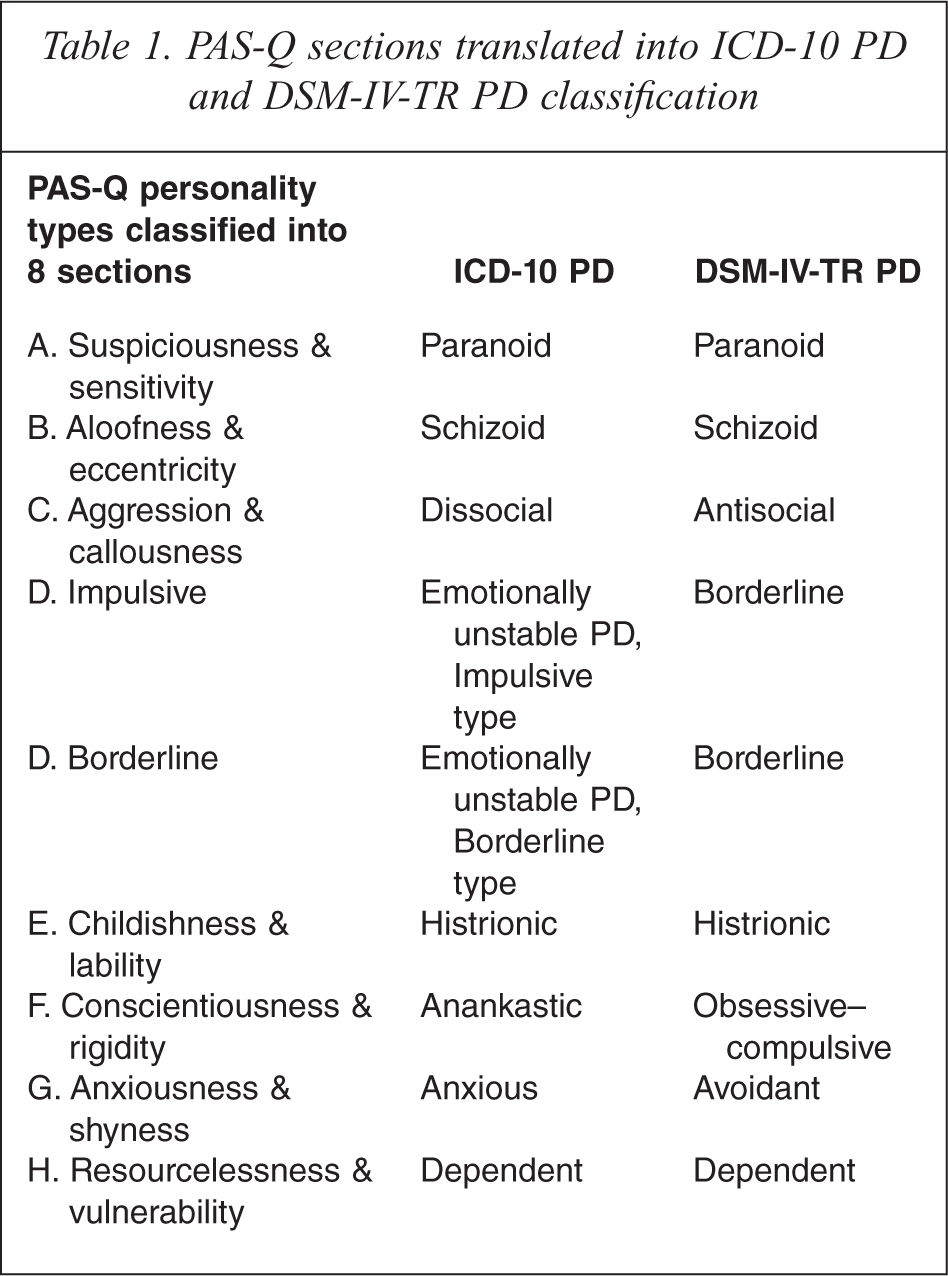
The PAS-Q, distinguishes four levels of severity: 0 (no PD), 1 (personality difficulty), 2 (simple PD), 3 (diffuse or complex PD). Table 1 presents the associations between the eight PAS-Q sections, the corresponding ICD-10 categories, as well as a ‘translation’ into the DSM-VI-TR classification system.
PAS-Q sections translated into ICD-10 PD and DSM-IV-TR PD classification
The present study focuses on the PAS-Q. Examination of this instrument is part of a larger research project aiming at the evaluation of a wide range of screening instruments for PDs [14–17]. In this context the PAS-Q was included, based on the following considerations. First, the PAS-Q is based on the universally accepted ICD-10 categories, in contrast to the majority of other available screening instruments, which are predominantly grounded in the DSM classification system. Furthermore, the PAS-Q not only focuses on the prediction of any PD, like the majority of available screening instruments do, but provides also the opportunity for more specific prognoses of distinct PDs. Finally, the response scales of the PAS-Q are not limited to scoring for absence–presence, but allow more nuances reflecting the level of severity. We chose the SCID-II as the gold standard for testing the PAS-Q for two reasons. First, the SCID-II is internationally the best known and most widely used interview for diagnosing PDs in terms of DSM-IV. Second, the SCID-II, because of its different background, provided a much more independent criterion for judging the psychometric qualities of the PAS-Q, compared with the use of the PAS, as tested in the past. Therefore, the objective of the present article was to validate the PAS-Q in a population of Dutch psychiatric outpatients with the SCID-II as the ‘gold standard’.
Materials and methods
Participants
The study was performed at GGZ-Midden Brabant, a large Community Mental Health Centre in the city of Tilburg, the Netherlands, after approval by the Regional Medical Ethical Committee. From the total group of patients (N = 2116) referred to this centre between March 2004 and March 2005, approximately 10 % (N = 207) were randomly recruited.
Measures
The PAS-Q
Since no Dutch version of this instrument was available at the time of this study, the original version of the PAS-Q was translated initially into Dutch by the authors and thereafter translated back into English by the Translation Centre of Tilburg University. The result of the latter translation was nearly identical to the original version.
SCID-II
The SCID-II [18] (Dutch version [19]) is a semi-structured interview for the assessment of PDs, which covers the ten PDs listed in the DSM-IV [20] as well as the passive-aggressive and the depressive PD, both listed in the appendix of the DSM-IV. The SCID-II interview contains two parts. The first part consists of eight open questions on the patient's general behaviour, interpersonal relationships, and self-reflective abilities. The second part has 140 items to be scored as 1 (absent), 2 (sub-threshold), or 3 (threshold). The SCID-II interview is primarily designed to make a categorical diagnosis of PD. The inter-rater reliability and internal consistency of the SCID-II interview are adequate [21]. The inter-rater reliability for the presence or absence of any PD of the Dutch version is fair to good [22]. Before undertaking fieldwork for this study, the first author (S.G.) was formally trained in the use of the SCID-II.
Procedure
The PAS-Q was completed as a short interview during the initial clinical appointment. The SCID-II interview took place 1–2 weeks after the PAS-Q. The PAS-Q was repeated 2–3 weeks after the initial PAS-Q interview. For practical reasons all participants were interviewed by the same person (S.G.) who refrained from reviewing the results of the previous interviews in the patients’ files.
Analysis
All statistical analyses were performed with SPSS version 12 (Chicago, IL). The internal consistency of the PAS-Q was examined by calculating Cronbach's alpha [23]. Cronbach's alphas will generally increase when the correlations between the items of a scale increase [24]. As a rule of thumb, usually a reliability of 0.70 or higher is required [25]. According to Bland and Altman [26], coefficients of 0.70 to 0.80 can be conceived of as satisfactory. The guidelines outlined by Cicchetti [27] are good criteria to determine clinical significance. According to these guidelines, alpha values should be interpreted as poor (<0.70), fair (0.70 to 0.79), good (0.80 to 0.89), or excellent (>0.90). However, one should keep in mind that the appropriate degree of reliability also depends upon the intended use. An assessment instrument designed for screening purposes is intentionally constructed as a short instrument, at the cost of a somewhat lower reliability, as Cronbach's alpha is not only dependent on the magnitude of the correlations among items, but also on the number of items of the scale [24,28]. In this light, we propose a somewhat more lenient approach, in which coefficients exceeding 0.60 are considered satisfactory. This more lenient evaluation, however, should not close the eyes to the fact that such measures with a short test length have rather low reliability. Consequently, it speaks for itself that estimates of relationships with other variables will be attenuated [24].
The test–retest reliability of each item and the overall score were estimated using Pearson correlation coefficients. Furthermore, the dimensionality of the PAS-Q was examined using factor analysis. The effect of changes in the cut-off score on the PAS-Q in predicting a SCID-II (DSM-IV) diagnosis of PD was examined using receiver operating characteristic (ROC) analysis. To assess the sensitivity and specificity of the various cut-off scores, a sensitivity and specificity plot was constructed.
Results
Although initially all recruited patients gave informed consent to participate (N = 207), 12 of them (5.8%; 8 men, 4 women, mean age = 33.0 years) did not return after their first assessment and were, therefore, excluded. The study group (N = 195) consisted of 112 women (57.4%) and 83 men (42.6%). Mean age was 32.7 years (SD = 8.9). Primary reasons for psychiatric referral were: anxiety problems (N = 62; 31.8%), affective problems (N = 29; 14.9%), conduct disorders (N = 33; 16.9%), partner-relational problems (N = 23; 11.8%), somatic problems (N = 12; 6.2%), labour or school problems (N = 10; 5.1%), identity problems (N = 7; 3.6%), social problems (N = 4; 2.1%), addiction problems (N = 1; 0.5%), and cognitive problems (N = 2; 1.0%). No specific psychiatric problem was mentioned by the referring physician in the case of five patients (2.5%).
A total of 97 of 195 patients received a PD diagnosis according to the SCID-II, yielding a PD prevalence of 50%. In the group of patients with at least one PD, the mean number of PDs was 1.8 (SD = 0.87). Table 2 presents the number of patients with a particular cluster of PD, according to the SCID-II and the PAS-Q. This table shows that 83.1% of the patients had a hit and 19.9 % of the patient had a no-hit with the PAS-Q.
Number of patients with one or more PDs, according to the SCID-II and the PAS-Q
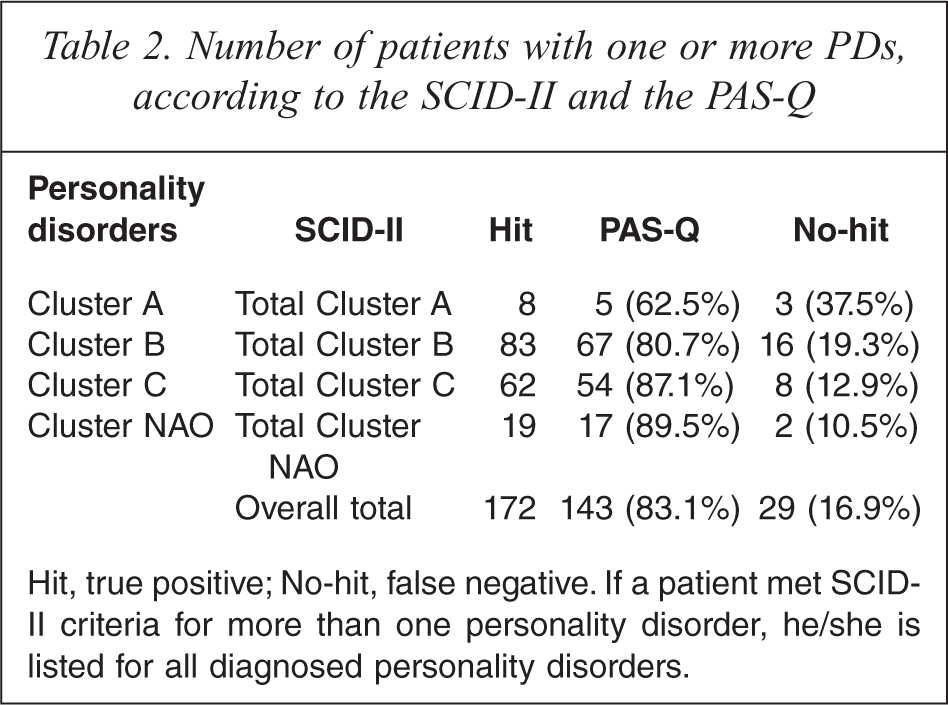
Hit, true positive; No-hit, false negative. If a patient met SCID-II criteria for more than one personality disorder, he/she is listed for all diagnosed personality disorders.
Table 3 shows the Cronbach alpha coefficients for the scale if the information for the particular section is deleted, test–retest outcomes, and the corrected item–total correlation coefficients. The latter coefficients reflect the correlation between scores on a particular PAS-Q section and the rest of the PAS-Q scale without that section considered part of the scale. If a correlation is low for a particular section, this means that the section is not really measuring the same thing, which the rest of the scale is trying to assess. The test–retest coefficient for the total score is 0.92. Test–retest reliability of items was high, with the section Aloofness & eccentricity showing the lowest, and the sections Aggression & callousness, Borderline and Childishness & liability the highest stability across time.
Internal consistency, test-retest, phi, and corrected total correlation coefficients for items of the Quick Personality Assessment schedule (PAS-Q)
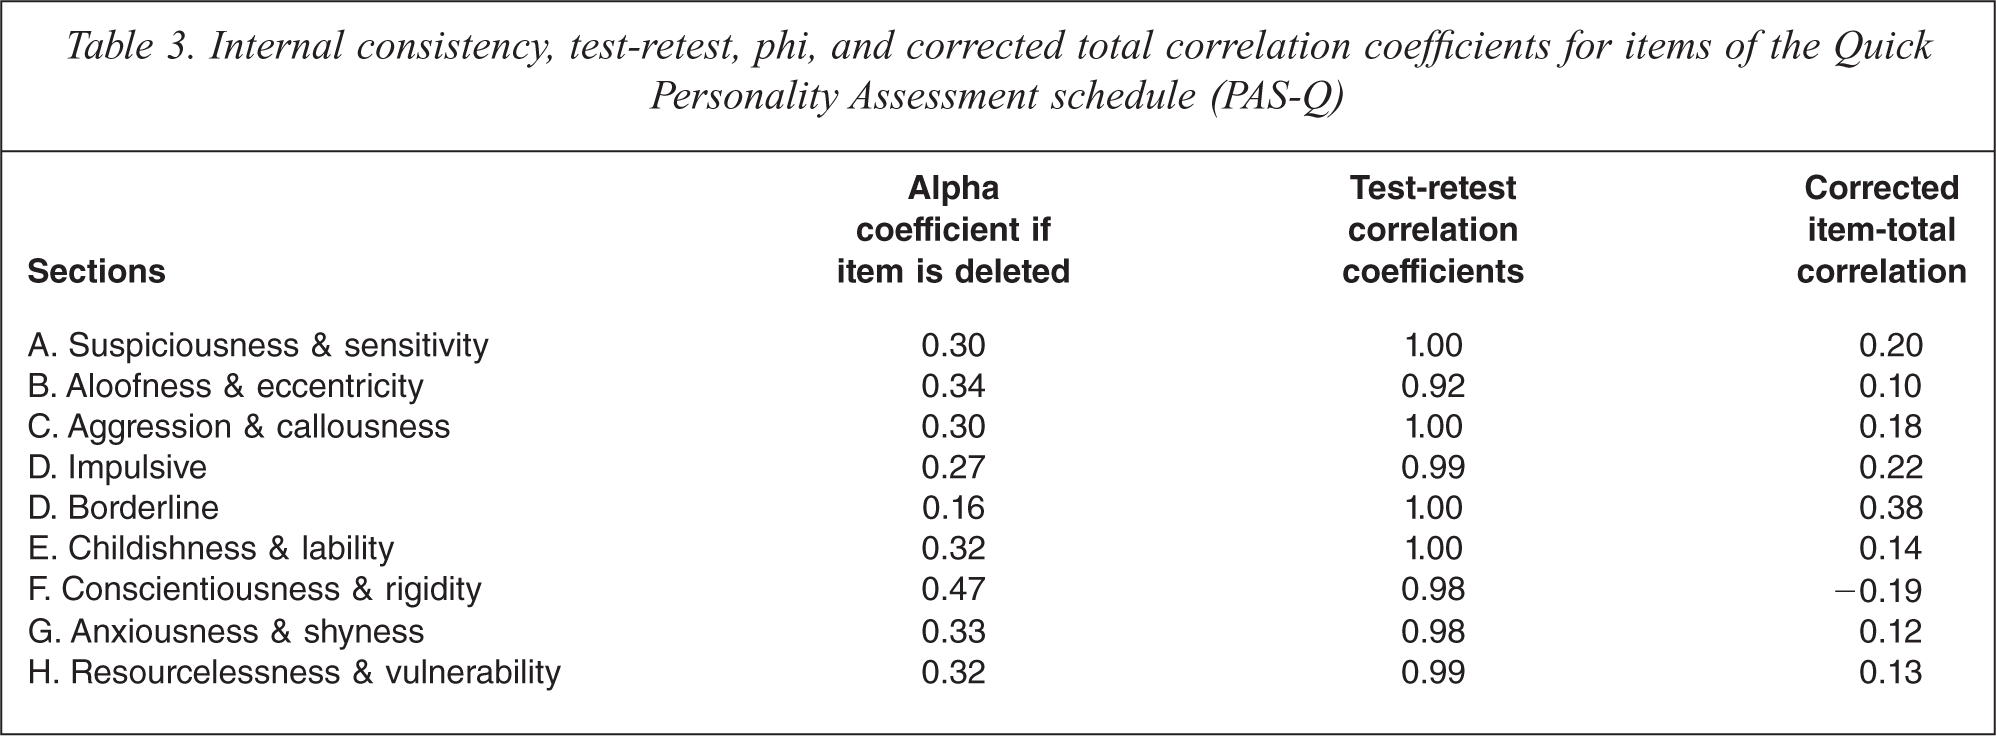
The overall internal consistency, as expressed in the Cronbach alpha coefficient for the total PAS-Q scale, was 0.35. Internal consistency coefficients were low, ranging from 0.16 for section D, Borderline, to 0.47 for the section F, Conscientiousness & rigidity. The moderate alpha coefficients suggested a rather high heterogeneity of the sections. Therefore, a factor analysis was performed. The idea behind this analysis is that the number of factors that has to be extracted reflects the degree of heterogeneity and will reveal whether PD can best be conceived of as a one-dimensional concept or a complex of related but to a certain extent rather independent dimensions. Principal components extraction with oblimin rotation was performed on the nine PAS-Q personality types. Three factors were extracted based on the criterion of eigenvalues greater than 1.0 (eigenvalues: 2.63, 1.61, 1.25, 0.84, 0.83, 0.67, 0.50, 0.40, 0.28) and inspection of the scree test [29]. Inter-correlations among the components ranged from 0.12 (F1 with F3) to 0.60 (F3 with F1). The pattern matrix of unique relationships between each factor and each observed variable, uncontaminated by overlap among factors, revealed a clustering of the nine items in three groups, reflecting the heterogeneity of items. The three factors explained 60.9% of the total variance. The loadings of the variables on the factors are shown in Table 4.
Factor loadings for principal components extraction and oblimin rotation on the PAS-Q sections
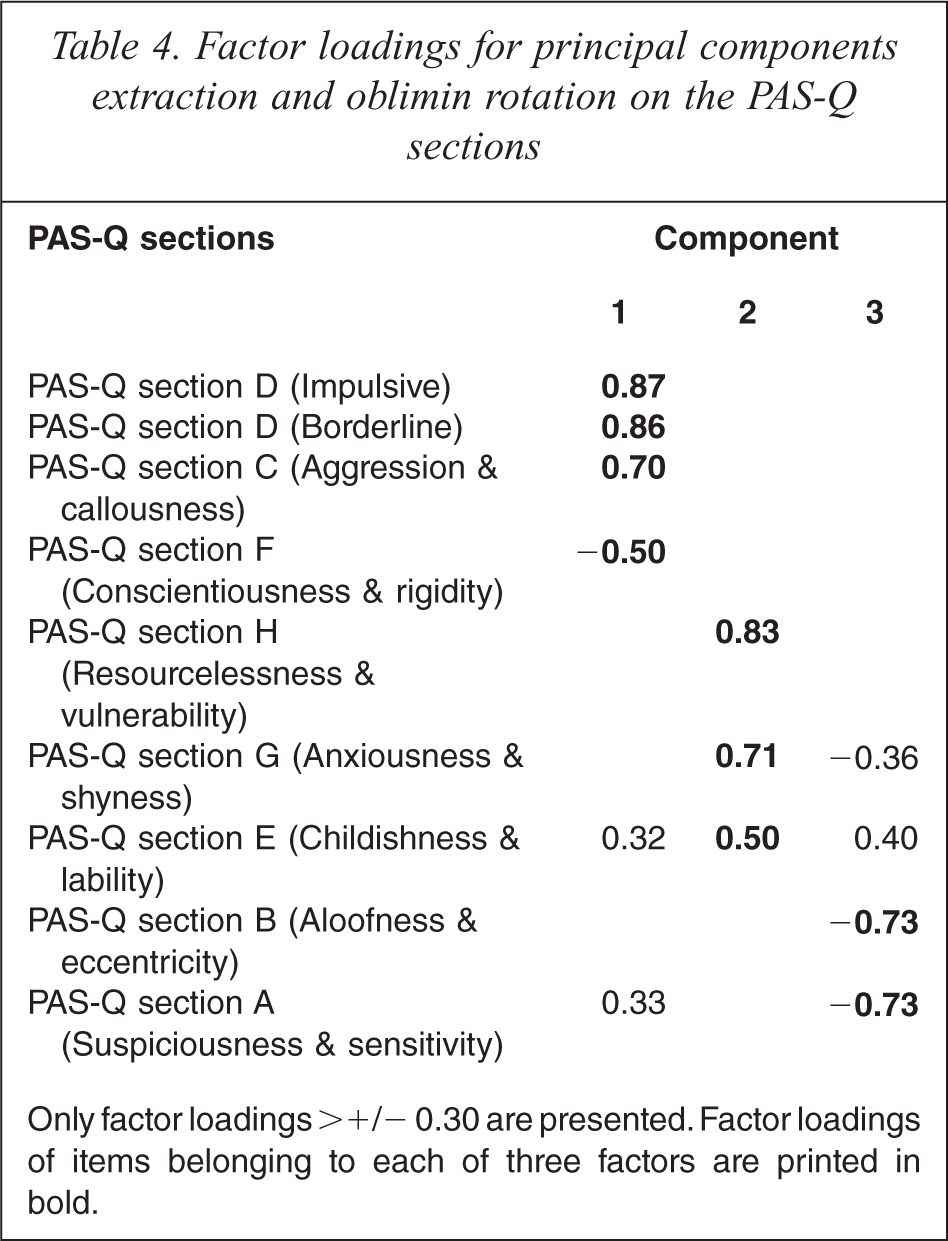
Only factor loadings >+/− 0.30 are presented. Factor loadings of items belonging to each of three factors are printed in bold.
Factor 1 (F1) shows positive connections between Aggression, Impulsiveness and Borderline and a negative connection with Conscientiousness & rigidity (Cluster B). Factor 2 (F2) features Resourcelessness & vulnerability, Anxiousness & shyness (Cluster C). Factor 3 (F3) represent Cluster A: Aloofness &eccentricity, Suspiciousness & sensitivity. The internal consistency, as expressed in the Cronbach alpha coefficients for the three subsets of PAS-Q items, were 0.43 for the four items reflecting F1 0.50 for the three items assessing F2, and 0.40 for the two items representing F3. The effect of changing cut-off score on the PAS-Q in predicting a SCID-II (DSM-IV) diagnosis of PD was examined using a ROC analysis. The ROC-curve had an area-under-the curve of 0.83 (95%CI: 0.77–0.89). The performance of the PAS-Q at different cut-off scores was assessed by reference to the sensitivity, specificity, and predictive values (Table 5).
Sensitivity, specificity, and the power to predict personality disorder at different cut-off scores of the Quick Personality Assessment schedule (PAS-Q)
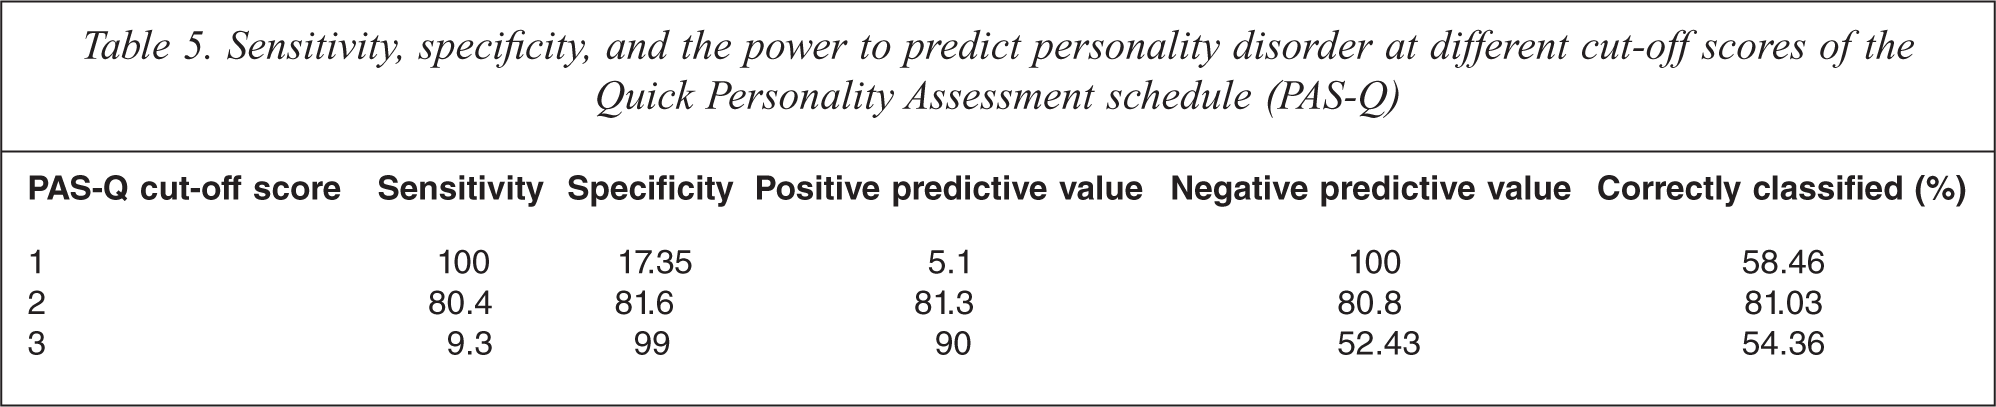
To assess the sensitivity and specificity for various cut-off scores, a sensitivity and specificity plot was constructed (Figure 1). This plot revealed that the optimal PAS-Q cut-off score for a SCID-II based diagnosis of PD was 2. This cut-off score not only correctly classified 81% of the patients; it also resulted in the best balance of sensitivity (0.80) and specificity (0.82). These outcomes are based on the first PAS-Q interview data, analyses based on the data of the second PAS-Q interview were highly similar and not significant different. In case of the original PAS-Q interview the same cut-off score was proposed: the score 1 points at the existence of personality problems and scores 2 and higher mean PD.
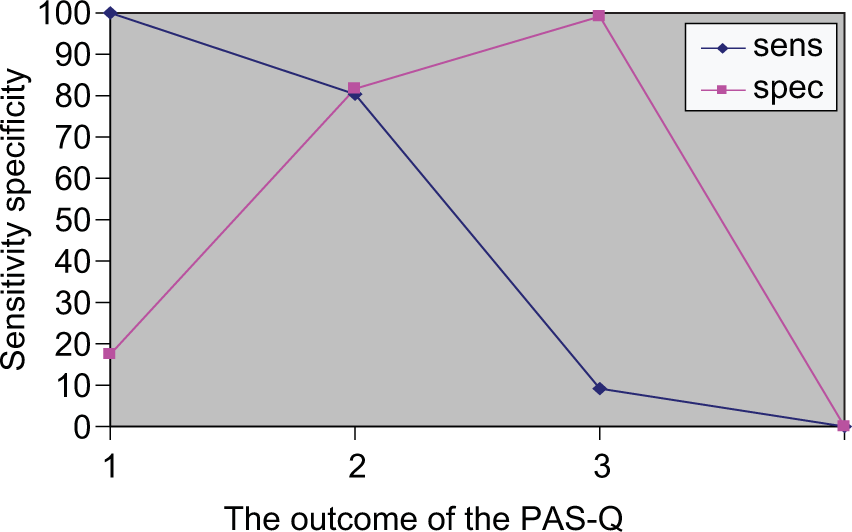
Sensitivity–specificity plot relating the Structured Clinical Interview for DSM-IV Personality disorders positive diagnosis to total score on the Quick Personality Assessment schedule (PAS-Q).
Discussion
Performance of the PAS-Q
The PAS-Q correctly identified the presence of PD in 81% of cases. Its low overall consistency should not be interpreted as an indication that the PAS-Q is a poorly performing test. The low homogeneity of the nine sections suggests that this particular set of items may have several latent attributes. The lack of interrelatedness of the items suggests that the content of the PAS-Q is multifaceted, and this in turn is likely to reflect the heterogeneous content of the concept ‘personality disorder’. The fact that the PAS-Q is not a one-dimensional instrument that measures only one concept with a strong internal structure is also supported by the outcomes of the factor analysis, which clearly identified three distinct factors. It is quite remarkable that these factors represent fairly well the three clusters of PD (A, B, and C).
The findings should be interpreted in the light of a number of limitations. First, because of the dependence on disease prevalence, screening for disease in low-prevalence populations yields few positive test results [30]. While the prevalence of PDs in the present sample of psychiatric patients was 50%, this prevalence will undoubtedly be lower in the general population, yielding a lower positive predictive value for the PAS-Q in this setting and it remains to be seen how well the PAS-Q performs in community samples.
Second, the use of the SCID-II as the criterion in this study could be questioned. However, the SCID-II is widely used across the world and its properties are well established.
Finally, the fact that the PAS-Q and the SCID-II were not done by separate, independent interviewers could be a source of bias. We are aware that this procedure, forced by practical considerations reflecting the institute's daily clinical practice, does not represent the best possible design. However, we feel that the risk of bias is presumably low due to the fact that the number of interviewees was rather high, the time intervals were not short and no inspection of patients’ records in preparation of the interviews took place. Moreover, the fact that the correspondence between both PAS-Q and the SCID-II interviews were similar also provides a convincing argument for the relative absence of bias. Nevertheless, future research should eliminate this possible source of bias completely by using independent interviewers.
Conclusion
The PAS-Q could be used to identify individuals at risk for having any type of PD in the context of general adult psychiatry. It should be admitted that there is still room for improvement with respect to the usefulness of the PAS-Q for establishing a clinical diagnosis of a PD. Nevertheless, it can be concluded that a hit of 83.1% is not bad at all. Thus, the PAS-Q can be used successfully as a first step in a two-stage procedure for case identification.
Patients with a score of 2 or higher on the PAS-Q should be interviewed with a detailed (semi)-structured interview for PDs. Clinicians and researchers might wish to adopt higher or lower thresholds, depending on the nature of the sample and the relative importance of sensitivity and specificity.
Footnotes
Acknowledgements