
Abstract
While there is some evidence that low-level alcohol consumption may reduce the risk of specific medical conditions such as cardiovascular disease in certain segments of the population [1], higher levels of drinking are associated with a broad range of negative health outcomes [2] including all-cause mortality [3]. Furthermore, alcohol consumption has been causally related to more than 60 different medical conditions including cancer, cardiovascular disorders, neurological disorders, psychiatric disorders, gastrointestinal diseases and both unintentional and intentional injury [2].
Harmful alcohol use is a recognized public health issue within Australia. Recently revised guidelines developed by the National Health and Medical Research Council (NHMRC), provide Australian public and professionals with evidenced-based recommendations regarding potential harms associated with alcohol consumption [4,5]. In contrast to the previous NHMRC guidelines, which contained separate recommendations relating to the immediate risk of injury and to the cumulative risk of alcohol use associated with chronic disease, the new guidelines released early 2009 broaden the definition of risk to any alcohol related harm at a population level and provide universal guidance to healthy adults, specifically to not exceed two standard drinks on any day in order to reduce the risk of alcohol related harm over a lifetime or to exceed four standard drinks on any occasion to minimize the risk of alcohol related injury arising from that occasion [5].
Alcohol consumption has been associated with a range of other demographic and disease risk factors, including socio-economic status [6–9], cigarette smoking [10], reduced physical activity [11], and diet [12]. Co-occurrence of higher levels of alcohol consumption with other disease risk factors may contribute to a higher degree of risk than any given factor in isolation.
The prevalence of alcohol consumption according to the new Australian guidelines has not yet been published. In this paper, we describe the pattern of alcohol consumption and associated physical and lifestyle characteristics in a large and representative sample of Australian men. We examined a number of physical and lifestyle characteristics to develop a profile of non-drinkers, drinkers and excessive alcohol consumers and to more fully understand the clustering of alcohol consumption with other risk factors.
Methods
Participants
This study examined data collected from men enrolled in the Geelong Osteoporosis Study (GOS), an epidemiological study involving an age stratified, randomly selected, population-based cohort. Between 2001 and 2006, 1540 men (median age 56.7 years, interquartile range (IQR) 40.0–73.4) were randomly selected from the Commonwealth Electoral Rolls for the Barwon Statistical Division (BSD) [13], a geographical region within south-eastern Australia (67% response rate). This region is well suited to epidemiological research due to having an age distribution and socio-economic indicators comparable to the Australian population [14,15].
Participants for whom daily alcohol consumption was unavailable (n = 120) were excluded from the current analyses, resulting in a sample of 1420 men aged 20–93 years eligible for inclusion. Barwon Health Human Research and Ethics Committee approved this study and all participants gave informed, written consent.
Measures
Alcohol consumption, expressed in mean g/day of ethanol consumed, was estimated using a validated [16] self-report food frequency questionnaire (FFQ), designed by the Cancer Council (Victoria) [17]. Participants were asked how often in the last 12 months they had consumed beer (low alcohol or full strength), red or white (including sparkling), fortified wines and spirits or liqueurs from the options of never, less than once a month, 1–3 days per month, 1–6 days per week and every day. The questionnaire then asks participants to indicate on days when alcohol is consumed the total number of glasses of any type of alcohol usually consumed per day and the maximum number of glasses of alcohol consumed within a 24-h period within the previous 12 months. Participants were provided with examples of how to convert volumes of alcohol into number of glasses according to Australian standard drink measures.
Categories of mean daily alcohol intake were classified: nil (those who reported consuming no alcohol within the previous 12 months); greater than zero but ≤ 2 standard drinks per day, and > 2 standard drinks per day [4]. A standard drink was defined as containing 10 g ethanol.
Body weight, height and waist circumference were measured to the nearest 0.1 kg, 0.1 cm and 0.5 cm, respectively. Body mass index (BMI) was calculated as weight (kg)/height (m)2, and classified as overweight and obese using World Health Organization (WHO) definitions [18]. Body fat mass was measured using dual-energy X-ray absorptiometry (Lunar DPX-L and Prodigy-Pro densitometers General Electric Company (GE) healthcare) of the whole body, with a precision of 3.8%. Daily energy consumption was derived from food and alcohol reported within the FFQ. Smoking status was defined as never, past or current at the time of measurement. Habitual physical activity was classified as active if subjects reported ‘moving, walking and working energetically and participating in vigorous exercise’, versus sedentary. Participants were asked to bring in a list of medications or containers to assist with accurate recording of details. Current medication use was defined as binary categories of taking < 3 prescription medications versus ≥ 3 prescription medications.
Immigrant status was defined as born in a country other than Australia. Level of education was self-reported. Current occupation type was categorized according to the Australian and New Zealand Standard Classification of Occupations (ANZSCO) [19]: (i) managers, professionals or paraprofessionals, (ii) tradespersons (iii) clerks, salespersons or personal service workers, (iv) plant or machine operators and drivers, (v) labourers and related workers, and (vi) other.
The residential address of each participant at baseline was matched to the corresponding Australian Bureau of Statistics (ABS) Census Collection District, an area that comprises approximately 250 households. ABS software was used to determine the socio-economic indexes for areas (SEIFA) value from the 2006 census for each participant. The Index of Relative Socio-Economic Advantage and Dizedvantage (IRSAD) is an aggregate measure that encapsulates both income and occupational variables. A low score as measured by the IRSAD represents a more dizedvantaged area, and a high score a more advantaged area [20]. After obtaining the SEIFA values our study population was divided into quintiles of SES according to cut-points of the BSD.
Statistical analyses
Statistical analyses were performed using Minitab (Version 15; Minitab, State College, PA). Differences in characteristics across the alcohol consumption categories were compared using analysis of variance (ANOVA) with Tukey's post hoc test, Kruskal-Wallis and chi-square analyses where appropriate. To adjust for the potential confounding effects of age in multivariate analyses, associations were age-adjusted using linear regression for continuous outcomes and binary logistic regression for categorical outcomes, with those consuming more than zero and ≤ 20 g ethanol per day as the reference group. Values of p < 0·05 were accepted as significant (including interaction terms). The prevalence of alcohol consumption for each of the different categories (non-drinkers; ≤ 2 standard drinks or > 2 standard drinks per day) was determined from the study population and age standardized to the Australian population (2006 census) [21].
Results
Figure 1 shows the pattern of average daily alcohol consumption within each age category. The age-standardized proportion of non-drinkers was 8.7% (95%CI 7.2–10.2), 51.5% consumed up to 20 g ethanol per day (95%CI 48.5–54.3) and 39.9% (95%CI 37.1–42.7) exceeded 20 g of ethanol per day. The prevalence of each drinking category is presented in Figure 2. The proportion of non-drinkers increased with age, while the proportion of those consuming within the 2009 NHMRC guidelines comprised approximately half of all age groups (≤20 g/day).
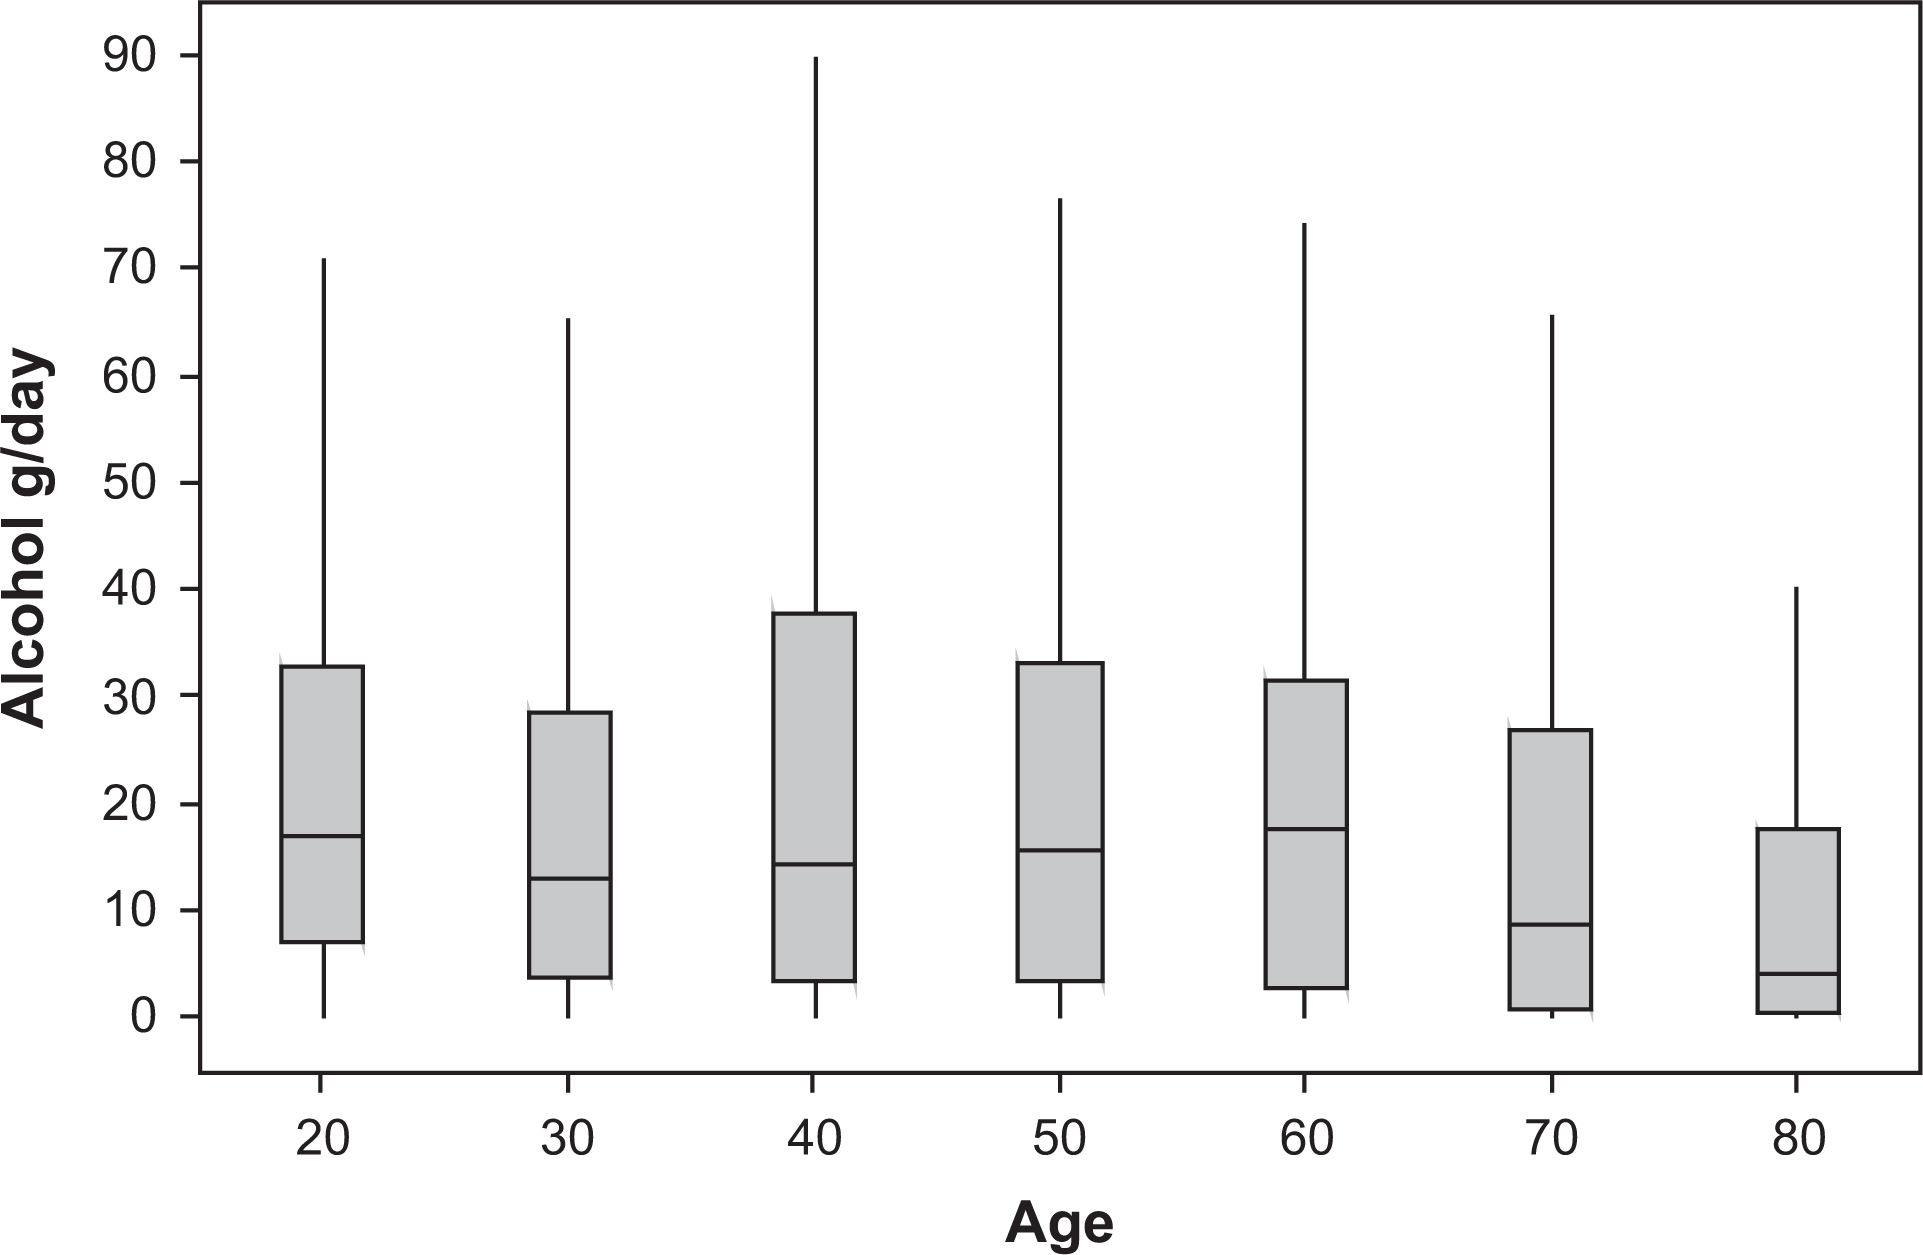
Average daily alcohol consumption (g ethanol) according to age decile.
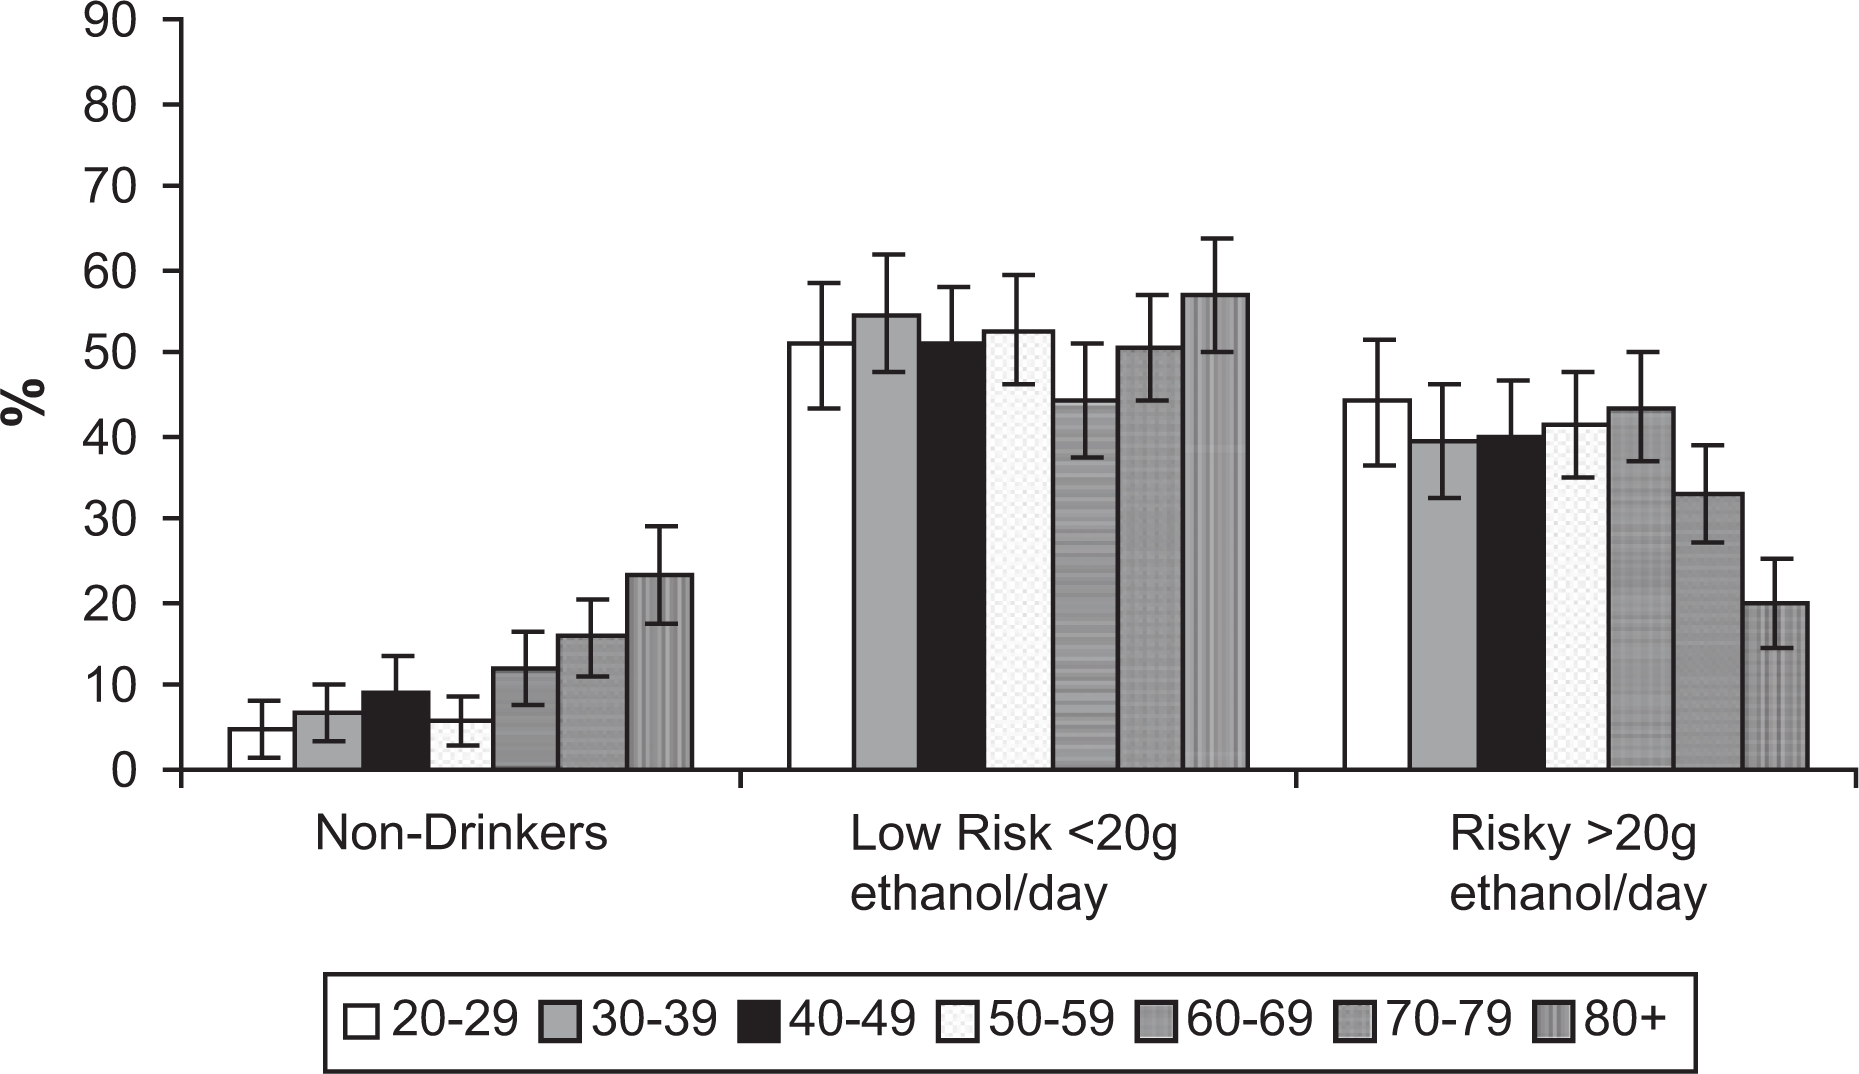
Age-standardized prevalence of drinking categories according to age with 95% confidence intervals.
The proportion of men within each age group who reported exceeding four alcoholic drinks within a 24-h period for the previous 12 months were: 20–29 years 94.4% (95%CI 90.9–97.9), 30–39 years 85.8% (95%CI 80.8–90.8), 40–49 years 84.7% (95%CI 79.6–89.9), 50–59 years 81.5% (95%CI 76.4–88.6), 60–69 years 71.5% (95%CI 65.4–77.7), 70–79 years 67.5% (95%CI 61.5–73.5) and 80+ years 38.4% (95%CI 31.7–45.1).
Among drinkers, the proportion of those consuming beer (light or full) was 79.4% (95%CI 77.0–81.7), 68.8% (95%CI 65.9–71.7) for wine (red, white or fortified) and 54.5% (95% CI 51.0–58.0) reported drinking spirits. The proportion of men who consumed alcohol within the last year from at least two of the beverage categories (beer, wine and/or spirits) was 72.8% (95%CI 70.1–75.5).
Subject characteristics are shown in Table 1 for the whole group, as well as the alcohol consumption categories (non-drinkers; ≤ 20 g/day; > 20 g/day). The median value for daily alcohol consumption was 12 g (IQR 2–29) of ethanol with a range of 0–117 g/day. Non-drinking men were shorter than both categories of alcohol drinkers. Those consuming ≤ 20 g/day of ethanol had a lower % body fat than those men consuming > 20 g/day. There were significant differences between the alcohol consumption groups for the variables of age, weight, physical activity, smoking status, medication use, socio-economic status and occupation. No differences were detected across drinking categories according to waist circumference, BMI, energy from food, country of birth or educational level (Table 1).
Subject characteristics for the whole sample and alcohol consumption sub-groups
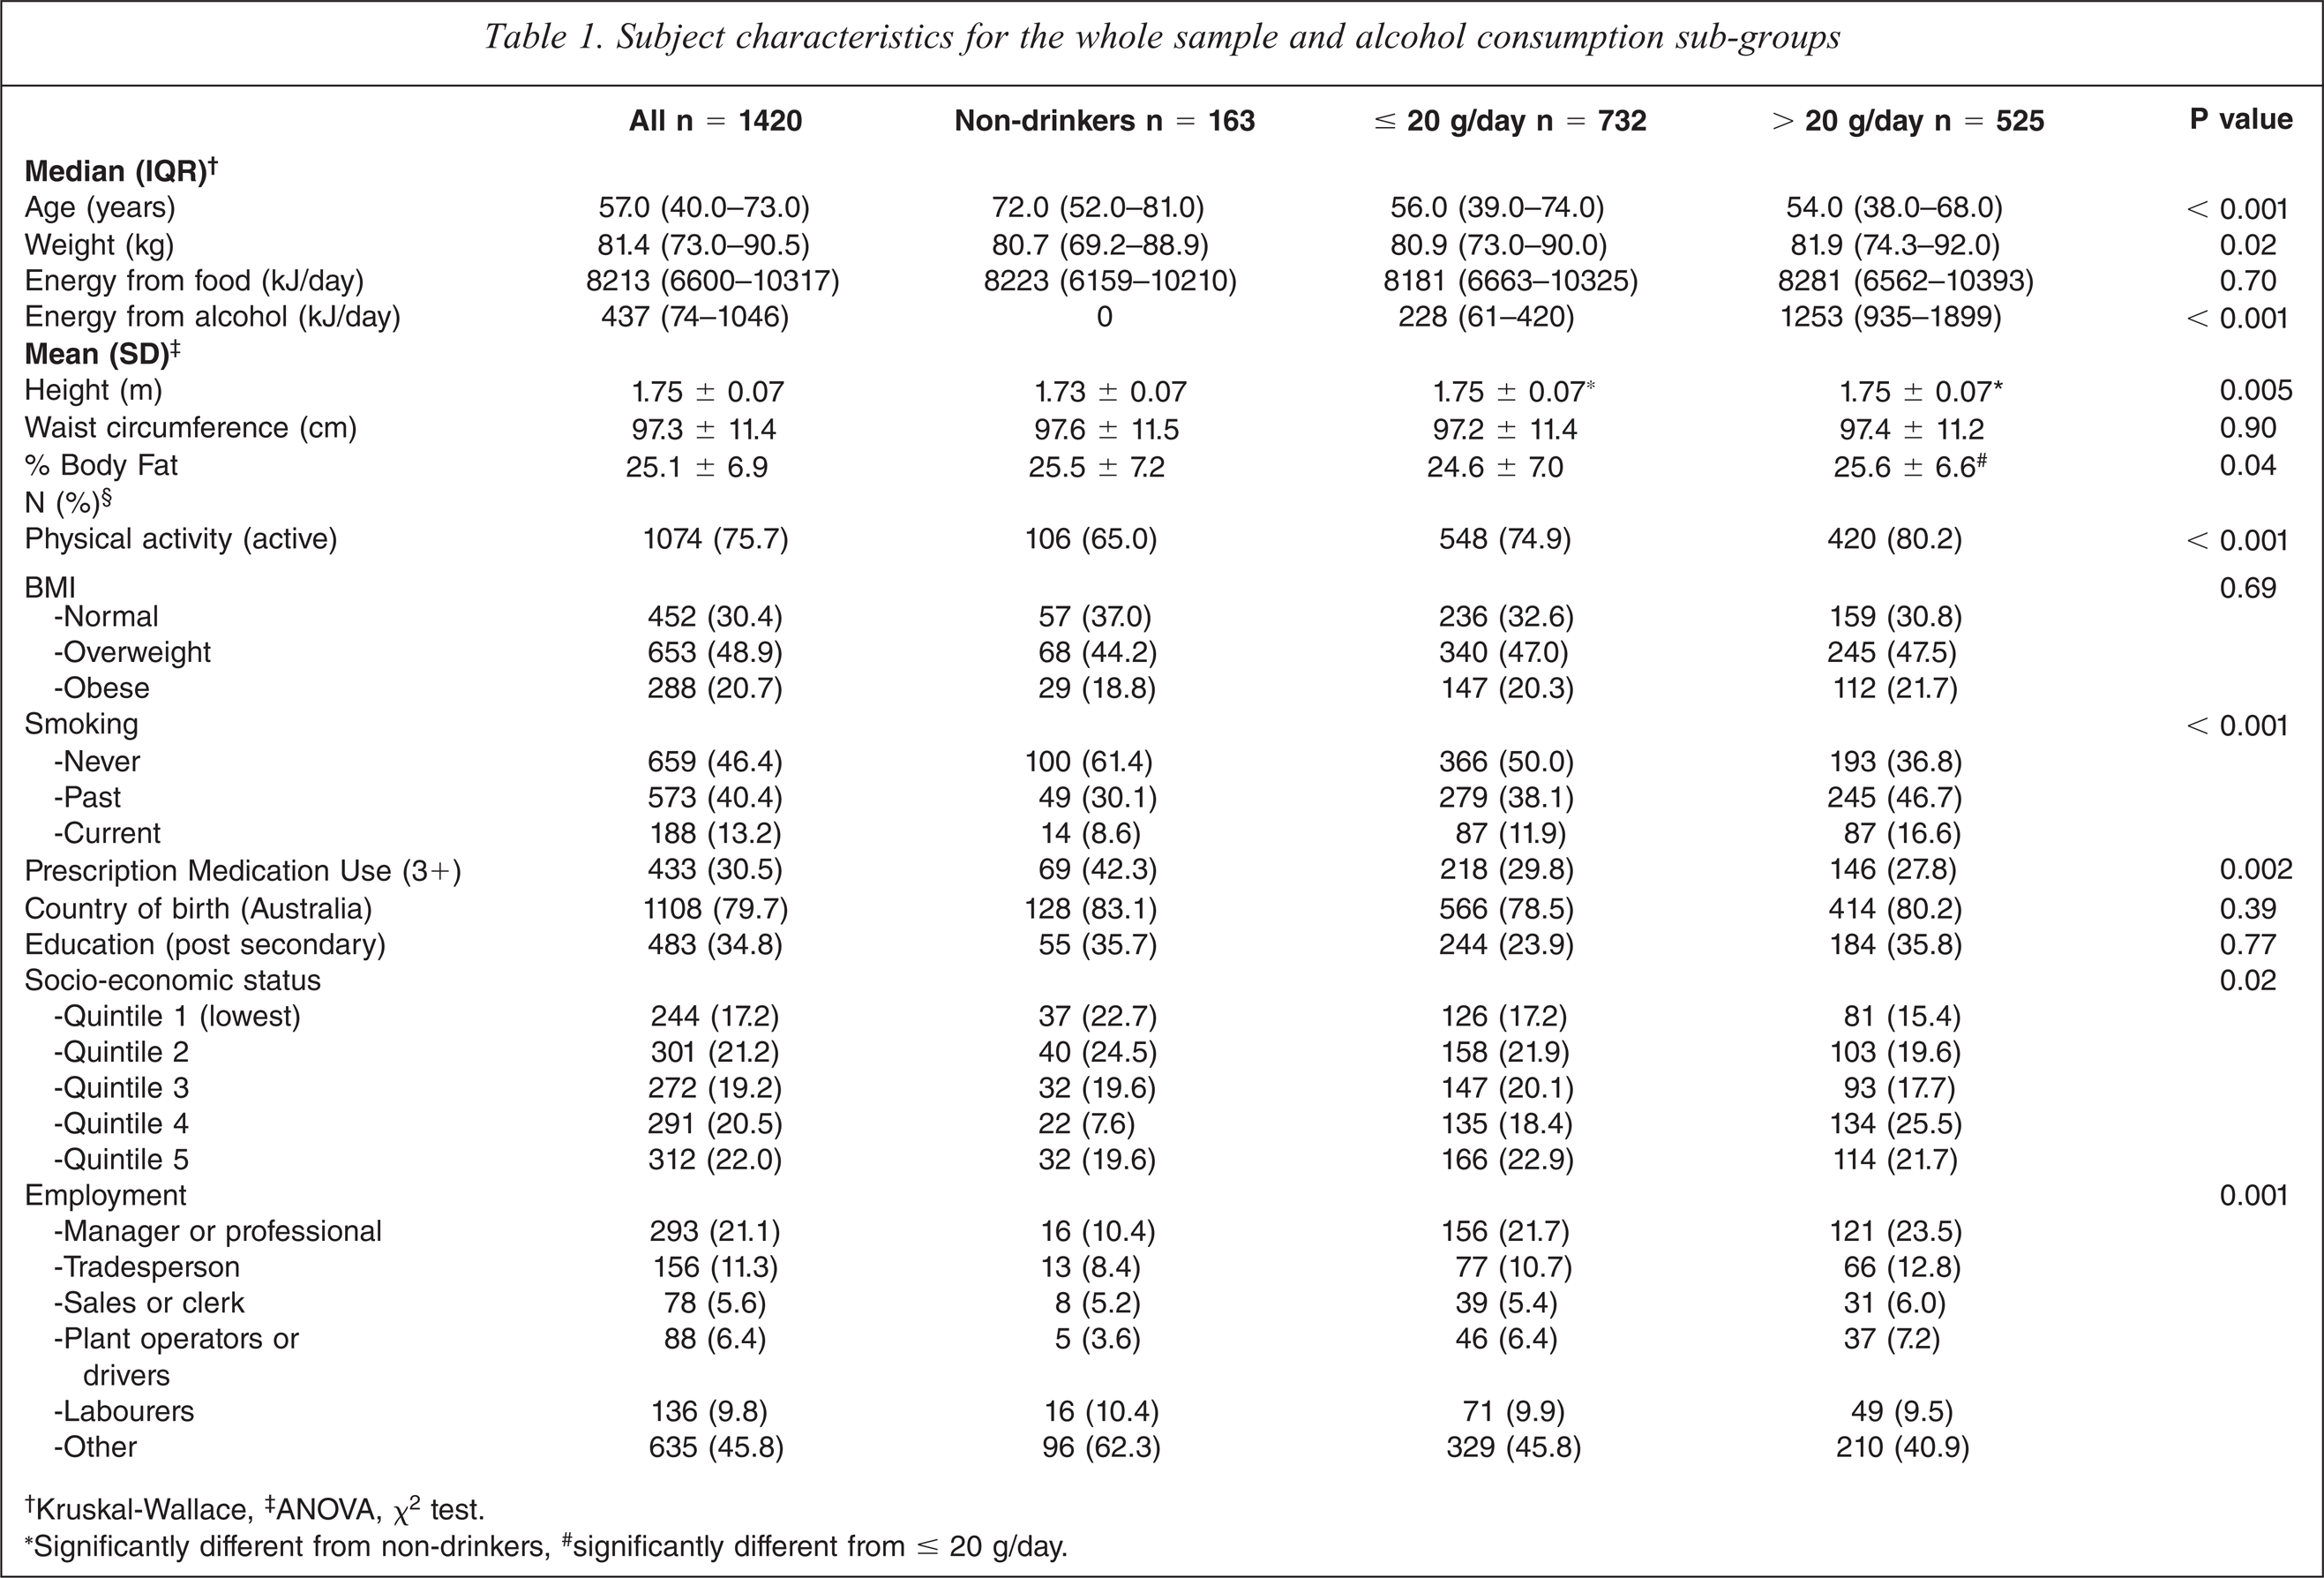
† Kruskal-Wallace, ‡ANOVA, χ2 test.
∗Significantly different from non-drinkers, # significantly different from ≤ 20 g/day.
Due to the older age of the non-drinkers compared with alcohol consumers, associations likely to be influenced by age (medication use, physical activity and weight) were age adjusted. After adjusting for age, and using those consuming more than zero ethanol but ≤ 20 g/day as the reference group:
those consuming >20g/day were less likely to be physically active (OR = 0.66, 95%CI 0.44–0.99) and tended to be more likely to use 3 or more prescription medications (OR = 0.82, 95%CI 0.53–1.27);
non-drinkers tended to be less likely to be physically active (OR 0.81, 95%CI 0.61–1.07) and to use 3 or more prescription medications (OR = 0.83, 95%CI 0.62–1.11).
Age was identified as an effect modifier in the association between alcohol consumption and weight. For younger men (< 50 years) there was no relationship between weight and drinking; for older men (≥ 50 years) those consuming > 20 g/day tended to be heavier compared with non-drinkers (p = 0.06) and those consuming ≤ 20 g/day (p = 0.03).
Discussion
In this randomly selected, community-based sample of men, 39.9% reported exceeding the 2009 NHMRC recommendations of two standard drinks per day. There was a fairly consistent pattern of alcohol consumption across the adult age deciles, with consumption declining in those aged over 70 years, and decreasing further in those aged over 80 years.
In this study the highest proportion of past and current cigarette smokers was among heavy drinkers, which has been well documented previously [22]. The proportion of men in the lower SES quintiles, representing the most dizedvantaged, were over-represented within the non-drinkers. This finding has been reported previously, where despite a higher density of alcohol outlets within deprived neighbourhoods the highest alcohol consumption occurs in the least deprived areas [23]. Those who were non-drinkers also reported being less likely to be physically active than drinkers. There was a lower body fat proportion in individuals consuming ≤ 20 g/day of ethanol than those men consuming > 20 g/day, even though weight and BMI were comparable. These data, together with data showing a proportionally higher fat mass in depression that was not fully reflected by weight and BMI [24], demonstrate the value of whole body scans in illustrating body composition changes.
Prevalence data pertaining to the distribution of alcohol consumption in the general community can provide a greater insight into which segments of the population tend to exceed guidelines and the clustering of other health risks; these are valuable in better targeting public health campaigns and other interventions. In this study we used data collected prior to the release of the new NHMRC guidelines. There is considerable lag between release of public health messages and a measurable impact upon behavioural change. This has been well documented, particularly for relatively stable behaviours such as alcohol consumption and cigarette smoking [25,26]. As such patterns of consumption are unlikely to show significant change given the recency of the new guidelines. A major challenge for the guidelines is the inherent face validity of a public health message that approximately 40% of adults drink in excess of recommended limits. In a representative sample of nearly 11 000 middle and older aged men residing in the USA, 19% of those aged 50–64 years and 13% of those aged ≥ 65 years reported at-risk drinking (two or more drinks per day on average) [27]. This is considerably lower in comparison to our findings, although can be partly due to differences in the definition of a standard drink between countries.
A major strength of this study lies in the randomly selected, population-based sample that spans the entire adult age range. In addition, the alcohol data were obtained from a comprehensive questionnaire administered to a sample recruited for the study of osteoporosis, thereby minimizing the risk of under-reporting or over reporting of consumption. This study cohort has additionally been shown to be broadly representative of the general Australian population. Results for the National Drug Strategy Household Survey (NDSHS) conducted in 2004 estimated the pattern of alcohol consumption for men over 20 years of age in relation to the 2001 NHMRC alcohol consumption guidelines [28]. We compared the NDSHS data for the same age range to our data age standardized to the 2004 population studied in the NDSHS. Proportions of men in each category of alcohol consumption were broadly comparable to our data (shown in brackets): 10.8% (9.0%) abstainers, 78.9% (74.8%) consumed alcohol at low risk of long-term harm, 6.7% (11.3%) risky consumers and 3.7% (4.8%) high risk drinkers. Direct comparisons should be made with caution, however, because of differences in sampling strategies used in the two studies. The 67% response in our study ensures moderately good internal validity. However, the findings should not be generalized to other populations, including women. As with all cross-sectional studies, a temporal relationship between alcohol consumption and the range of anthropometric, lifestyle and demographic factors could not be inferred; it is likely that many of these associations are bi-directional.
In summary, within this population-based sample of men there was a fairly consistent pattern of alcohol consumption across the adult age deciles. Using the new NHMRC cut points; it was evident that a high proportion of all age groups drink at levels identified as higher risk consumption. Alcohol use amongst those who consume in excess of the new guidelines encompasses a wide range of average consumption, ranging from those who marginally exceed recommendations through to those who consume large quantities of alcohol each day. The new NHMRC guidelines refer to increasing alcohol consumption as having a cumulative risk upon injury and negative health outcomes, indicating the necessity of considering detailed drinking patterns in determining the risk associated with alcohol consumption.
Footnotes
Acknowledgements