
Abstract
Individuals shape their identity, values and ways of living as part of their family and the cultural, socioeconomic and physical environment that surrounds them. Conversely, they impact on this environment by contributing to the communication and actions of groups and communities. The conscious sense of an individual's influence on their surroundings has been described as a sense of ‘mastery, control and self efficacy’, or psychological empowerment [1,2]. Empowerment also occurs on group and societal levels [3]. Building on work of Friere and Rappaport, Maton describes empowerment as ‘a group-based, participatory, developmental process through which marginalized or oppressed individuals and groups gain greater control over their lives and environment, acquire valued resources and basic rights, and achieve important life goals and reduced societal marginalization’ [4–5].
Empowerment approaches have potential to address concerns about broad inequalities in health, human development and capability. The United Nations Human Development Corporation is promoting ways to operationalize and measure global development, using measures that go beyond economic wealth alone [6]. Some examples include the Human Development Index, Gender Empowerment Index and Gender Development Index. These monitor annual national and global progress towards achieving equality in life expectancy, income, education and employment.
Research is increasingly linking better outcomes among disadvantaged groups to interventions that enhance community empowerment, enabling individuals and groups to participate in or drive organizational and structural change [3,5,7–12]. By their participatory nature, empowerment interventions also positively influence individuals, whose behavioural changes influence and are influenced by everyday life situations. However, efforts to demonstrate the full value of empowerment at the individual level have been hampered by its inherent complexity and subjective nature, dependence on specific contexts, lack of definitional precision, limited understanding of pathways to growth, and lack of tools to measure its process, impact and outcomes [3].
Existing measures of individuals’ empowerment are typically tailored to specific contexts (e.g. caring for a child with a disability [13,14], performing work [15,16], community organizing, self-managing chronic disease [17,18]). While there has also been considerable progress in developing tools that measure concepts similar to empowerment, [19–25] including Antonovsky's sense of coherence scale [26,27], few have explicitly measured processes, as opposed to outcomes or indicators of change toward higher states. Notable exceptions are the Stages of Recovery Instrument (STORI) assessing progression towards recovery from mental illness [28,29] and stages of motivation, readiness and action based on the health belief model of Prochaska and Diclemente [30–32].
Empowerment research in Australia often focuses on Indigenous settings, because of the severe socio-economic disadvantage and health inequality experienced by Aboriginal and Torres Strait Islander people [33–35]. Grief, loss and stress are major components of everyday life in many Aboriginal communities, and residents and services struggle with multi-generational impacts of disempowering histories and present circumstances. Australia is seeking ways to support those affected to heal from the past, gain control over their present situation, and actively participate in addressing problems and improving policy and governance structures [11].
In the early 1990s, a group of Indigenous Australians developed the Family Well Being (FWB) programme to help address these needs. Delivered in group settings, the programme aims to empower participants by helping them achieve greater understanding and skills to gain control over their lives [9–12]. Through five 30-h stages, the programme fosters personal transformation that involves harmonizing physical, emotional, mental and spiritual aspects of life and applying this to everyday living. The first stage provides an introduction to these concepts as a basis for personal understanding and change that is supported in subsequent stages. The programme's impact has been extensively researched using qualitative methods, and participatory action research shows that it enables individual participants and their social groups to achieve significant change [9–12].
The Growth and Empowerment Measure (GEM) was developed as a tool to measure the process and outcomes of empowerment and for evaluating interventions, such as the FWB programme, that aim to increase empowerment. It seeks to measure people's perspective of their psychosocial well-being and empowerment at individual, family, organizational and structural levels. This paper presents an initial analysis of the psychometric properties of GEM scales and subscales.
Materials and methods
Ethical approval for this project and the evaluation of the FWB programme was provided by the Human Ethics Committee, University of Queensland, and informed consent was provided by all participants.
The Growth and Empowerment Measure
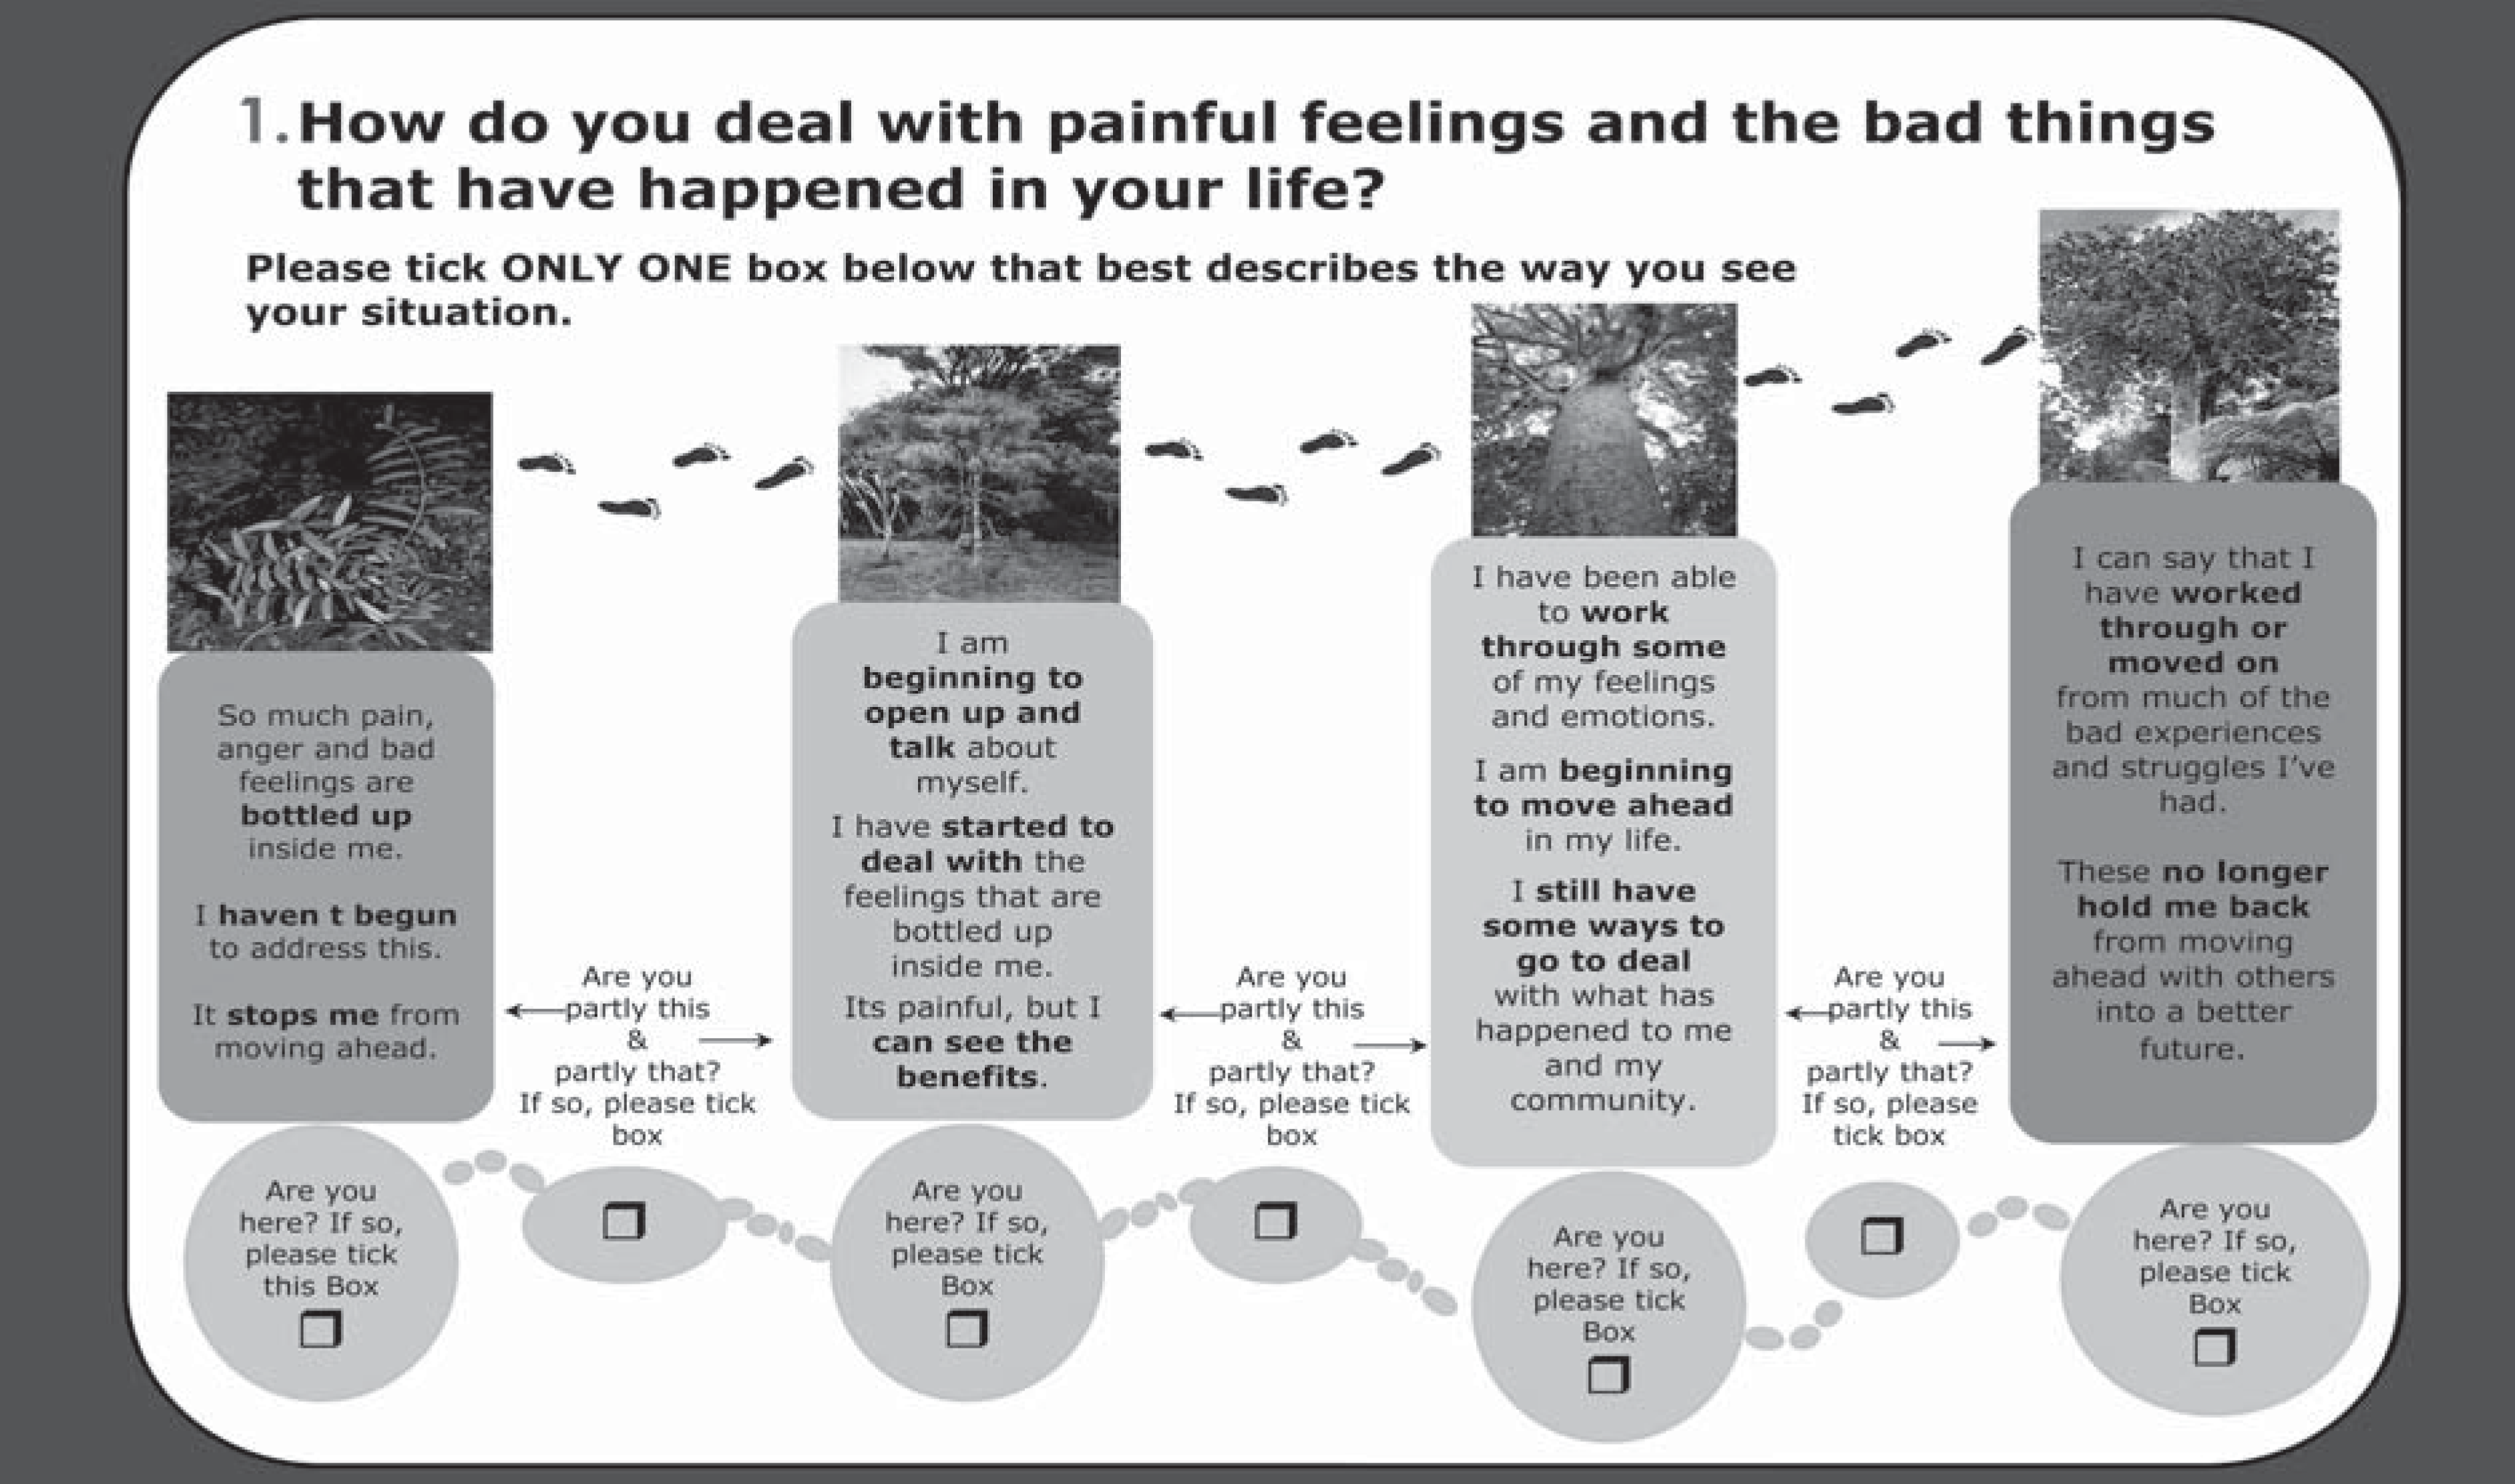
In its initial form GEM included a range of questions examining dimensions of social and emotional well-being and empowerment. Items were based on descriptions of change during qualitative interviews with Indigenous people who completed at least one stage of the FWB programme. Consultation workshops in Alice Springs, Yarrabah and Cairns with Aboriginal participants provided further input and led to adoption of a tree as a metaphor of empowerment, and its inclusion in the instrument (Figure 1). GEM was then refined through two workshops involving researchers with experience in psychometrics and well-being research. The tool was further improved and streamlined to its current form after piloting with 42 FWB participants (data not included).
Scenario 1 on the 12 Scenarios (12S).
GEM collects background information covering age, gender, community, having a partner and children, housing situation and occupation. Two instruments comprise its main body; namely the Emotional Empowerment Scale (EES14) and 12 Empowerment Scenarios (12S). It took about 30 min to complete and was administered orally where needed and with all participants in rehabilitation settings.
EES aims to capture the extent to which the person is able to feel and show specific signs of well-being in their everyday life. FWB informants identified these signs as positive outcomes involving their emotions and view of self that resulted from their own empowerment process. The EES had an overall title of ‘How I Feel About Myself’, instructions to identify ‘the way you usually feel about yourself most of the time’ and lines with five boxes from a negative (scored 1) to a positive (scored 5) (Figure 2) description. Initially the EES had 13 items (used with the first 29 participants). The 14-item version was completed by 155 participants.
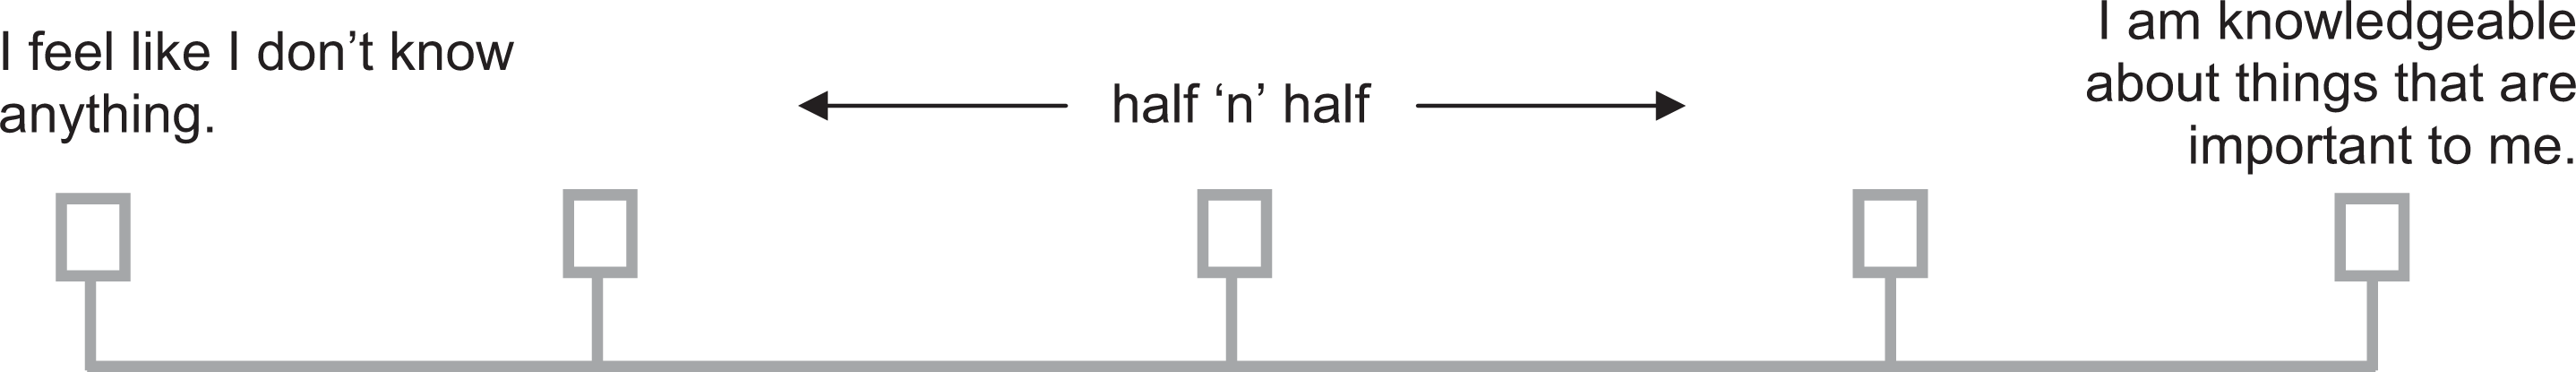
Item 1 on the Emotional Empowerment Scale (EES14).
The 12S aims to measure functional aspects of empowerment identified from the qualitative data analysis. Each scenario assesses the extent to which the person has achieved movement between proposed states, from the lowest (scored 1) to the highest (scored 7) (Figure 1). The selection and broad wording within each stage was identified through interviews, and completed and refined through the workshop consultations.
The assessment package also included the Kessler Distress Scale (K6) because questions from this scale (sometimes with modification) have been relatively widely used in Indigenous well-being surveys and screening tools, including the National Aboriginal and Torres Strait Islander Health Survey (NATSIHS) [36–38]. Strong links between high Kessler scores and increased likelihood of distress-related mental disorders have been demonstrated in mainstream populations [39,40]. Inclusion of the K6 enables a reference point with previous studies and a possible link with mental health problems.
Two questions were added to the Kessler distress scale (‘In the last one month, how often did you feel happy in yourself’ and ‘In the last one month, how often did you feel angry with yourself or others’). The need for questions to assess these emotions along with other symptoms of distress was informed by developmental work leading to the NATSIHS [38]. While the NATSIHS used four items from the RAND SF-36 survey, GEM adopted a single-question approach to each emotion, using the Kessler 10 response format. The question assessing the frequency of feeling ‘happy in yourself’ was positively orientated but reverse-scored, to enable addition (K6 plus 2).
In contrast to the negatively directed Kessler scale, higher scores on the EES14 and 12S indicate higher levels of empowerment and well-being. Total and subscale scores for all individual scales were calculated by unweighted addition.
Sampling and data analysis
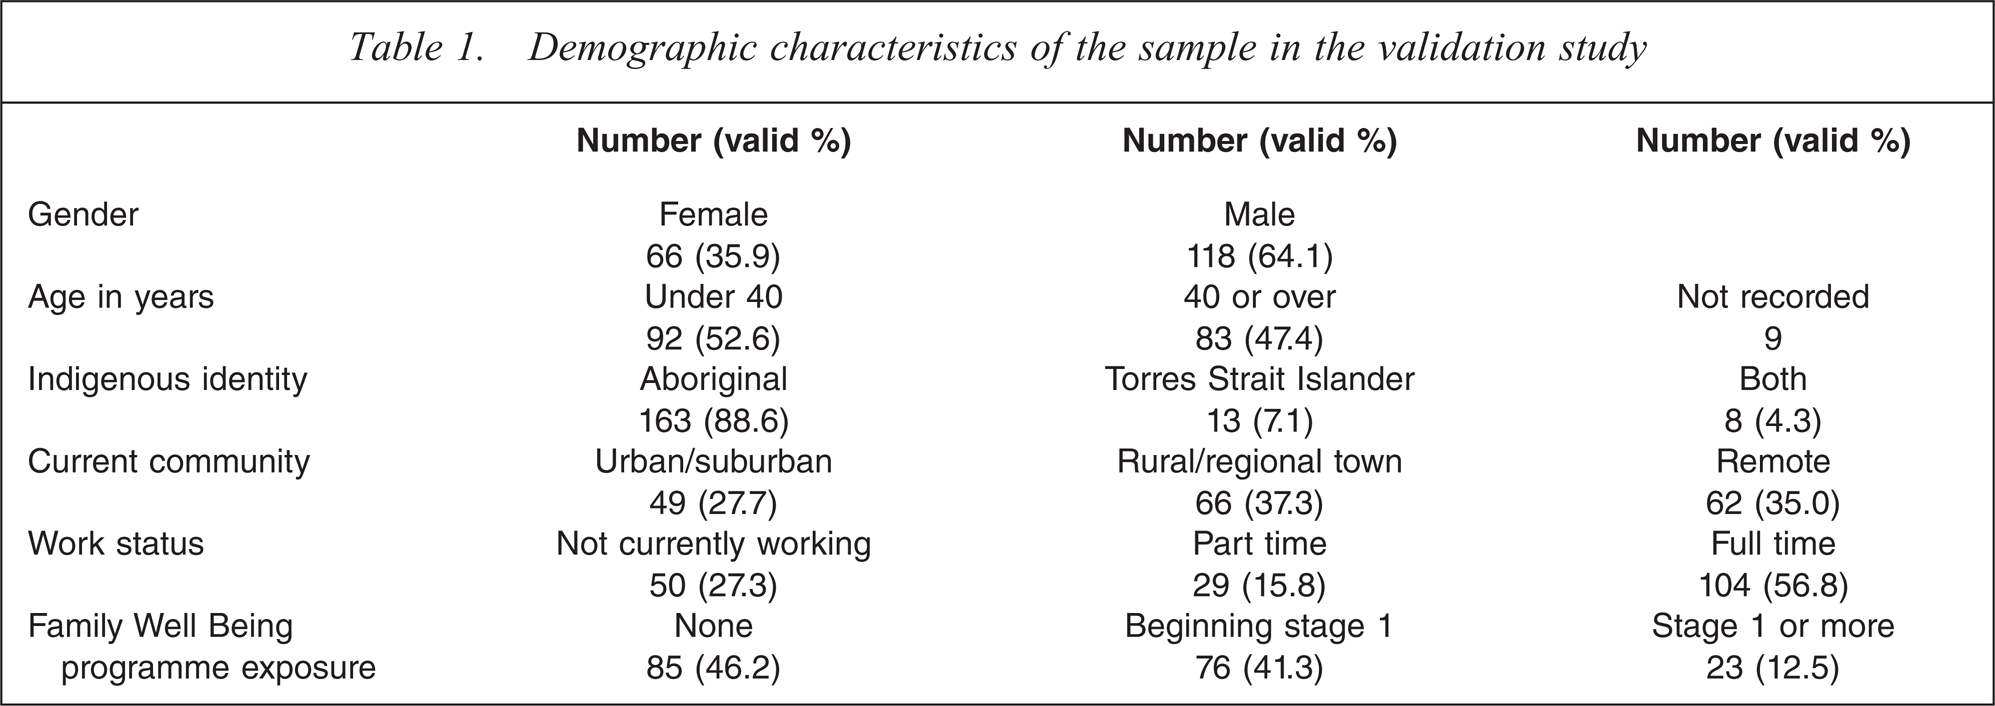
The sample for this first trial of GEM was based on convenience rather than random or systematic sampling. A total of 184 Australians who identified as Aboriginal (n = 163, 88.6%), Torres Strait Islander (n = 13, 7.1%) or both (n = 8, 4.3%) were surveyed between 2007 and 2009 (Table 1). A total of 118 (64.1%) respondents were male and 66 (35.9%) were female, and the mean age was 39.9 years (median 40). Seventy-five participants were involved in FWB training, 79 in community and service activities that the research team was participating in or engaged with, and 30 were consecutive admissions to an Aboriginal community-controlled men's alcohol and drug rehabilitation service. Delivery sites included urban, rural and remote areas in Queensland, Northern Territory, and New South Wales, drawing participants from urban contexts (27.7%), rural or regional towns (37.3%) and remote communities (35%) (Table 1).
Demographic characteristics of the sample in the validation study
Analyses aimed to examine the psychometric properties and internal structure of the 12S and EES14 and potential subscales, refine the measures further and explore relationships between the scales. Relationships were explored using Pearson's correlations. Associations with a probability < 5% using two-tailed tests were considered statistically significant. Cronbach's alpha and corrected inter-item correlations were used to explore psychometric properties of the scales and subscales.
The Kaiser-Meyer-Olkin (KMO) measure of sampling adequacy and Bartlett's test of sphericity were used to test the appropriateness of principal component analysis of EES and 12S. Principal component analyses used oblimin rotation with Kaiser normalization, because emerging components were expected to be correlated, not independent, of each other. Item loadings with absolute values above 0.4 and a difference of at least 0.2 between components were considered to load unambiguously.
Results
Of the 184 surveys distributed, 181 (98.4%), 180 (97.8%) and 172 (93.5%) had > 50% of items completed on the K6, EES and 12S respectively, enabling inclusion in analyses. Among those included, 11 had at least one missing item on K6, 4 on EES13/14 and 28 on 12S. Most missing items on 12S occurred because of difficulties in selecting responses to the workplace (scenario 9) and community (scenario 12), where respondents did not work or had recently moved.
Among 170 fully answered K6, 115 (63.5%) had sums of 6–13 (low distress), 40 (22.1%) scored 14–18 (mild/moderate distress) and 15 (8.8%) scored >18 (severe distress) [43]. Cronbach's alpha for the K6 was 0.853, all corrected item-total correlations exceeded 0.4 and principal component analysis supported a single component. Inclusion of the two additional items (feel happy, feel angry) generated a slightly higher alpha (0.871; n = 141), with all item-total correlations exceeding 0.4.
Emotional empowerment scales
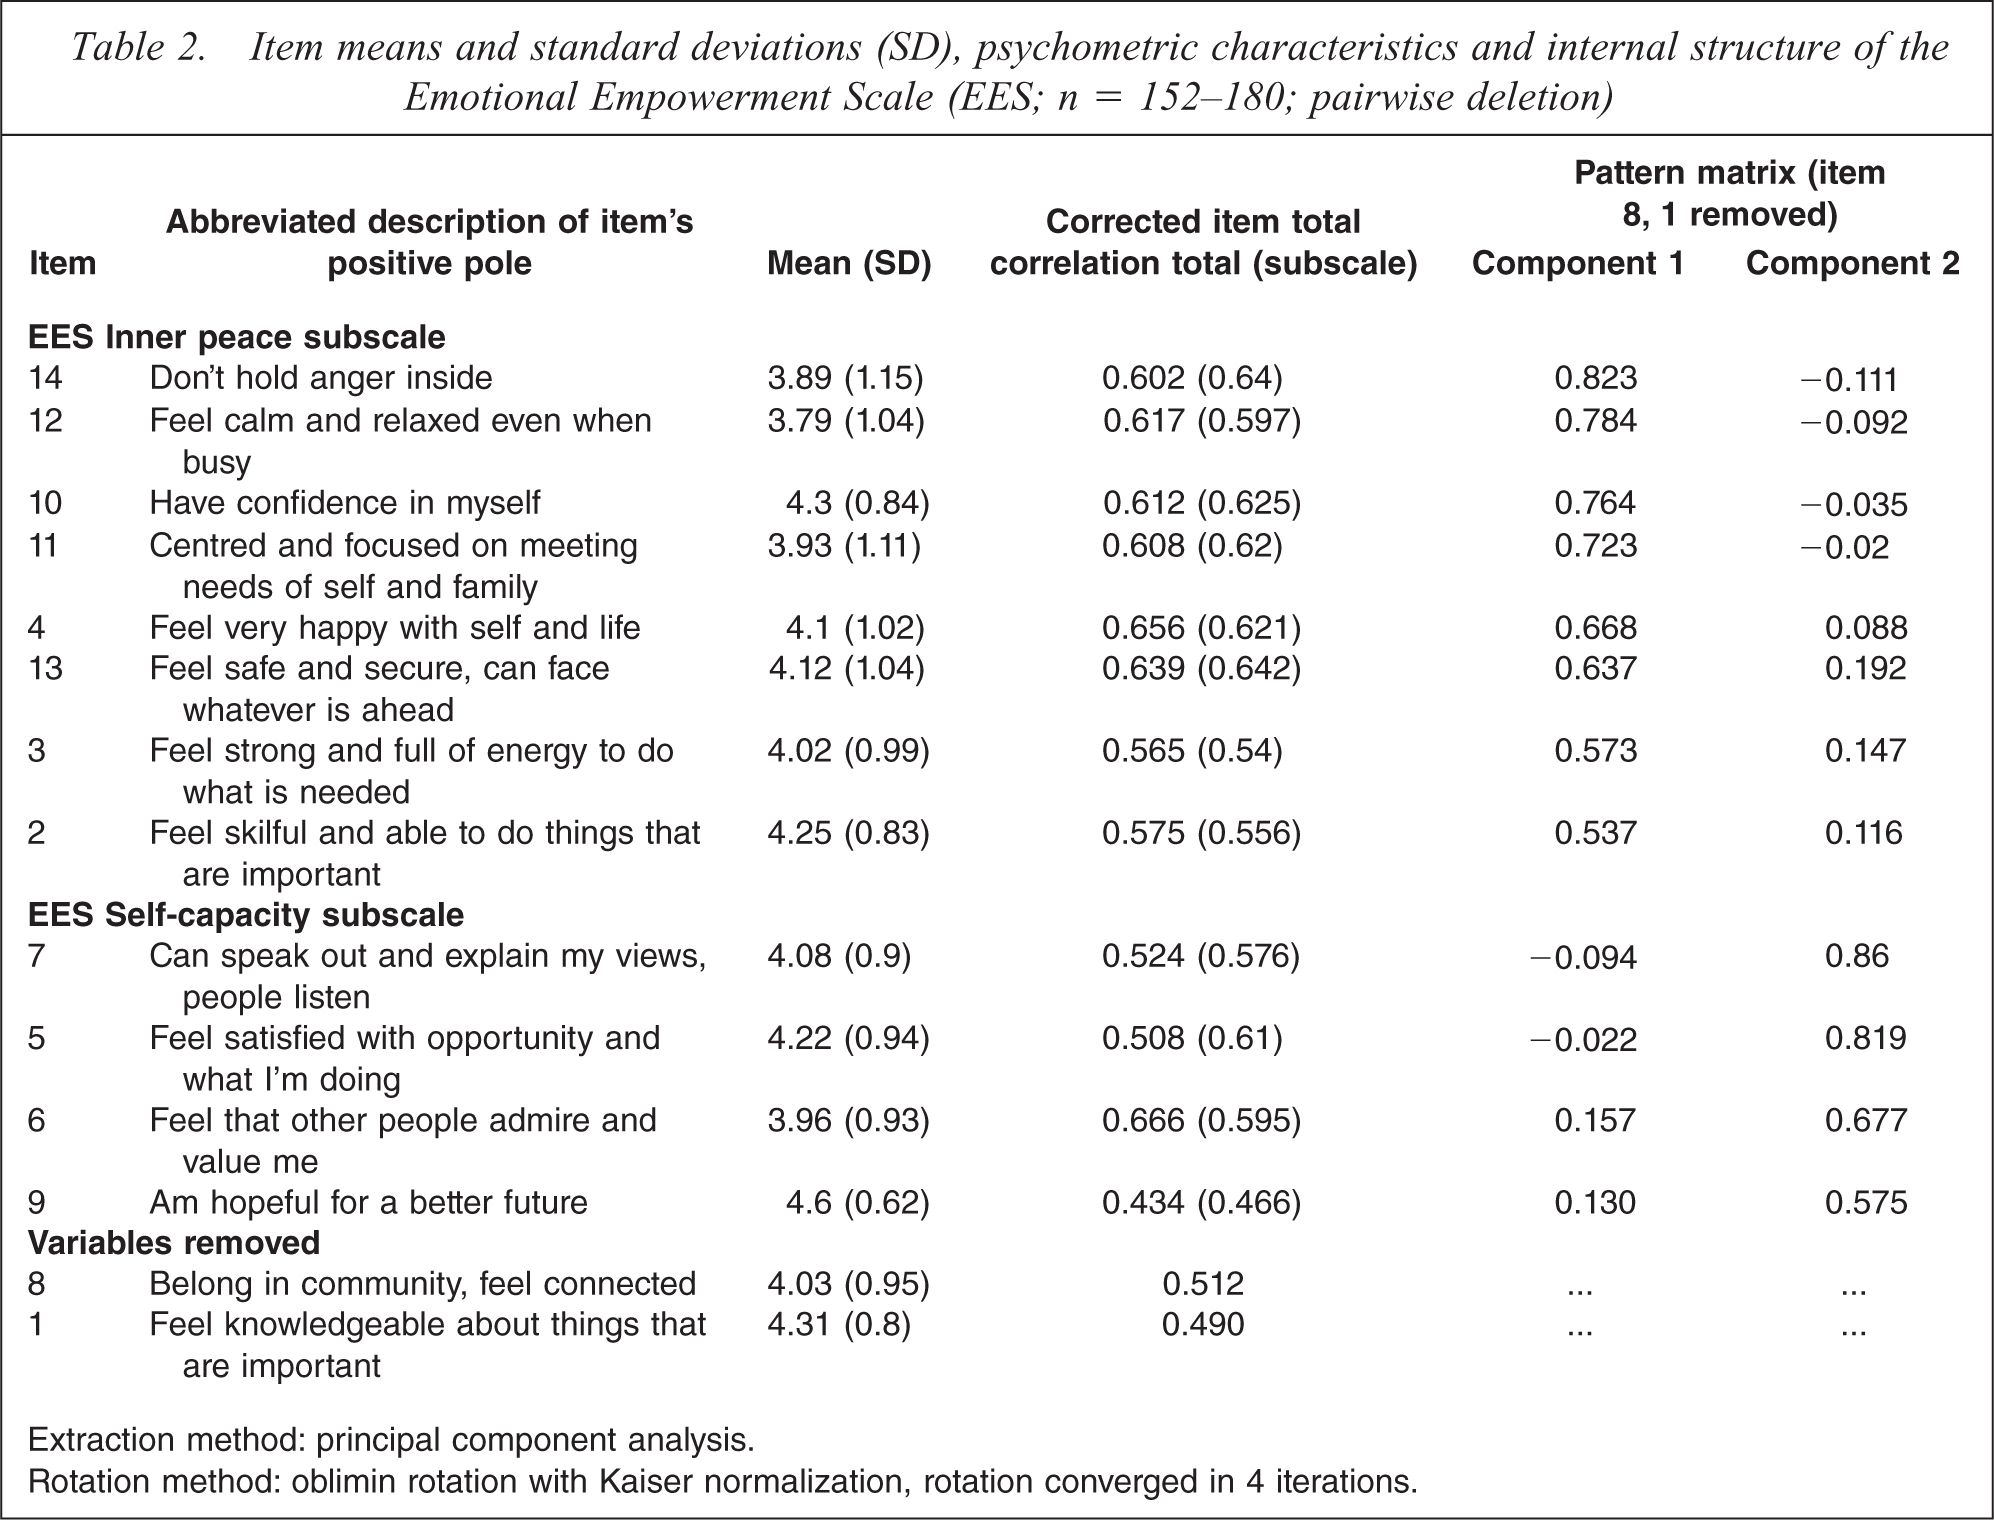
Means and standard deviations of EES items are shown in Table 2. The most highly scored items were ‘being hopeful’ and ‘feeling knowledgeable’, and the lowest were ‘feel calm and relaxed’ and ‘not holding anger’. The average total for the EES14 was 57.83, out of a possible 70 (n = 150, SD 8.58, skewness −0.499, normal distribution). The scale showed high internal consistency (alpha = 0.891, or 0.883 for the first 13 items; n = 170). Individual items had minimal impact on the scale mean, variance or alpha, and all corrected item-total correlations exceeded 0.40 (Table 2).
Item means and standard deviations (SD), psychometric characteristics and internal structure of the Emotional Empowerment Scale (EES; n = 152–180; pairwise deletion)
Extraction method: principal component analysis.
Rotation method: oblimin rotation with Kaiser normalization, rotation converged in 4 iterations.
Principal component analysis was performed on the EES14, using pairwise substitution for missing values (n = 152–180). The KMO measure of sampling adequacy (0.886) and Bartlett's test of sphericity (χ2 = 808.4, df 91, p < 0.001) supported the use of the analysis. Oblimin rotation with Kaiser normalization initially revealed three components with Eigen values over 1. However, the third component showed extensive cross-loadings, with only item 8 (‘feel connected’) having unequivocal loadings. Removal of item 8, then item 1 (‘feel knowledgeable’), revealed two comprehensible and distinguishable sets of loadings (Table 2).
Eight items (‘dealing with anger’, ‘feeling calm and relaxed’, ‘feeling safe and secure’, ‘being centred and focused’, ‘confident’, ‘happy with self and life’, ‘feeling strong and full of energy’ and ‘feeling skilful’) loaded on the first component, giving an Eigen value of 5.22 (explaining 43.5% of the variance). These items appear to reflect the extent that the person feels ‘Inner peace’ and may indicate social and emotional outcomes of empowerment. The Inner peace subscale had a mean of 32.52 out of a possible 40 (SD 5.75, skewness −0.809) and a Cronbach's alpha of 0.858. All corrected item-total correlations exceeded 0.4.
Four items assessing ‘voice’, ‘satisfaction with opportunity’, ‘feeling valued’ and ‘feeling hopeful’ loaded on the second component (Table 2). The Eigen value for this component was 1.221 (10.17% of the variance). The four items appeared to indicate the extent to which the person is achieving ‘Self-capacity’ to engage confidently with the world. The Self-capacity subscale had an overall mean of 16.88 out of a possible 20 (SD 2.61, skewness −0.623) and Cronbach's alpha was 0.757. All corrected item-total correlations exceeded 0.4.
These two subscales, comprising 12 of the 14 EES items, explained 53.67% of the total variance. The subscales significantly correlated with each other (r = 0.591) and with the total EES (r = 0.949 for Inner peace and 0.785 for Self-capacity).
Empowerment scenarios
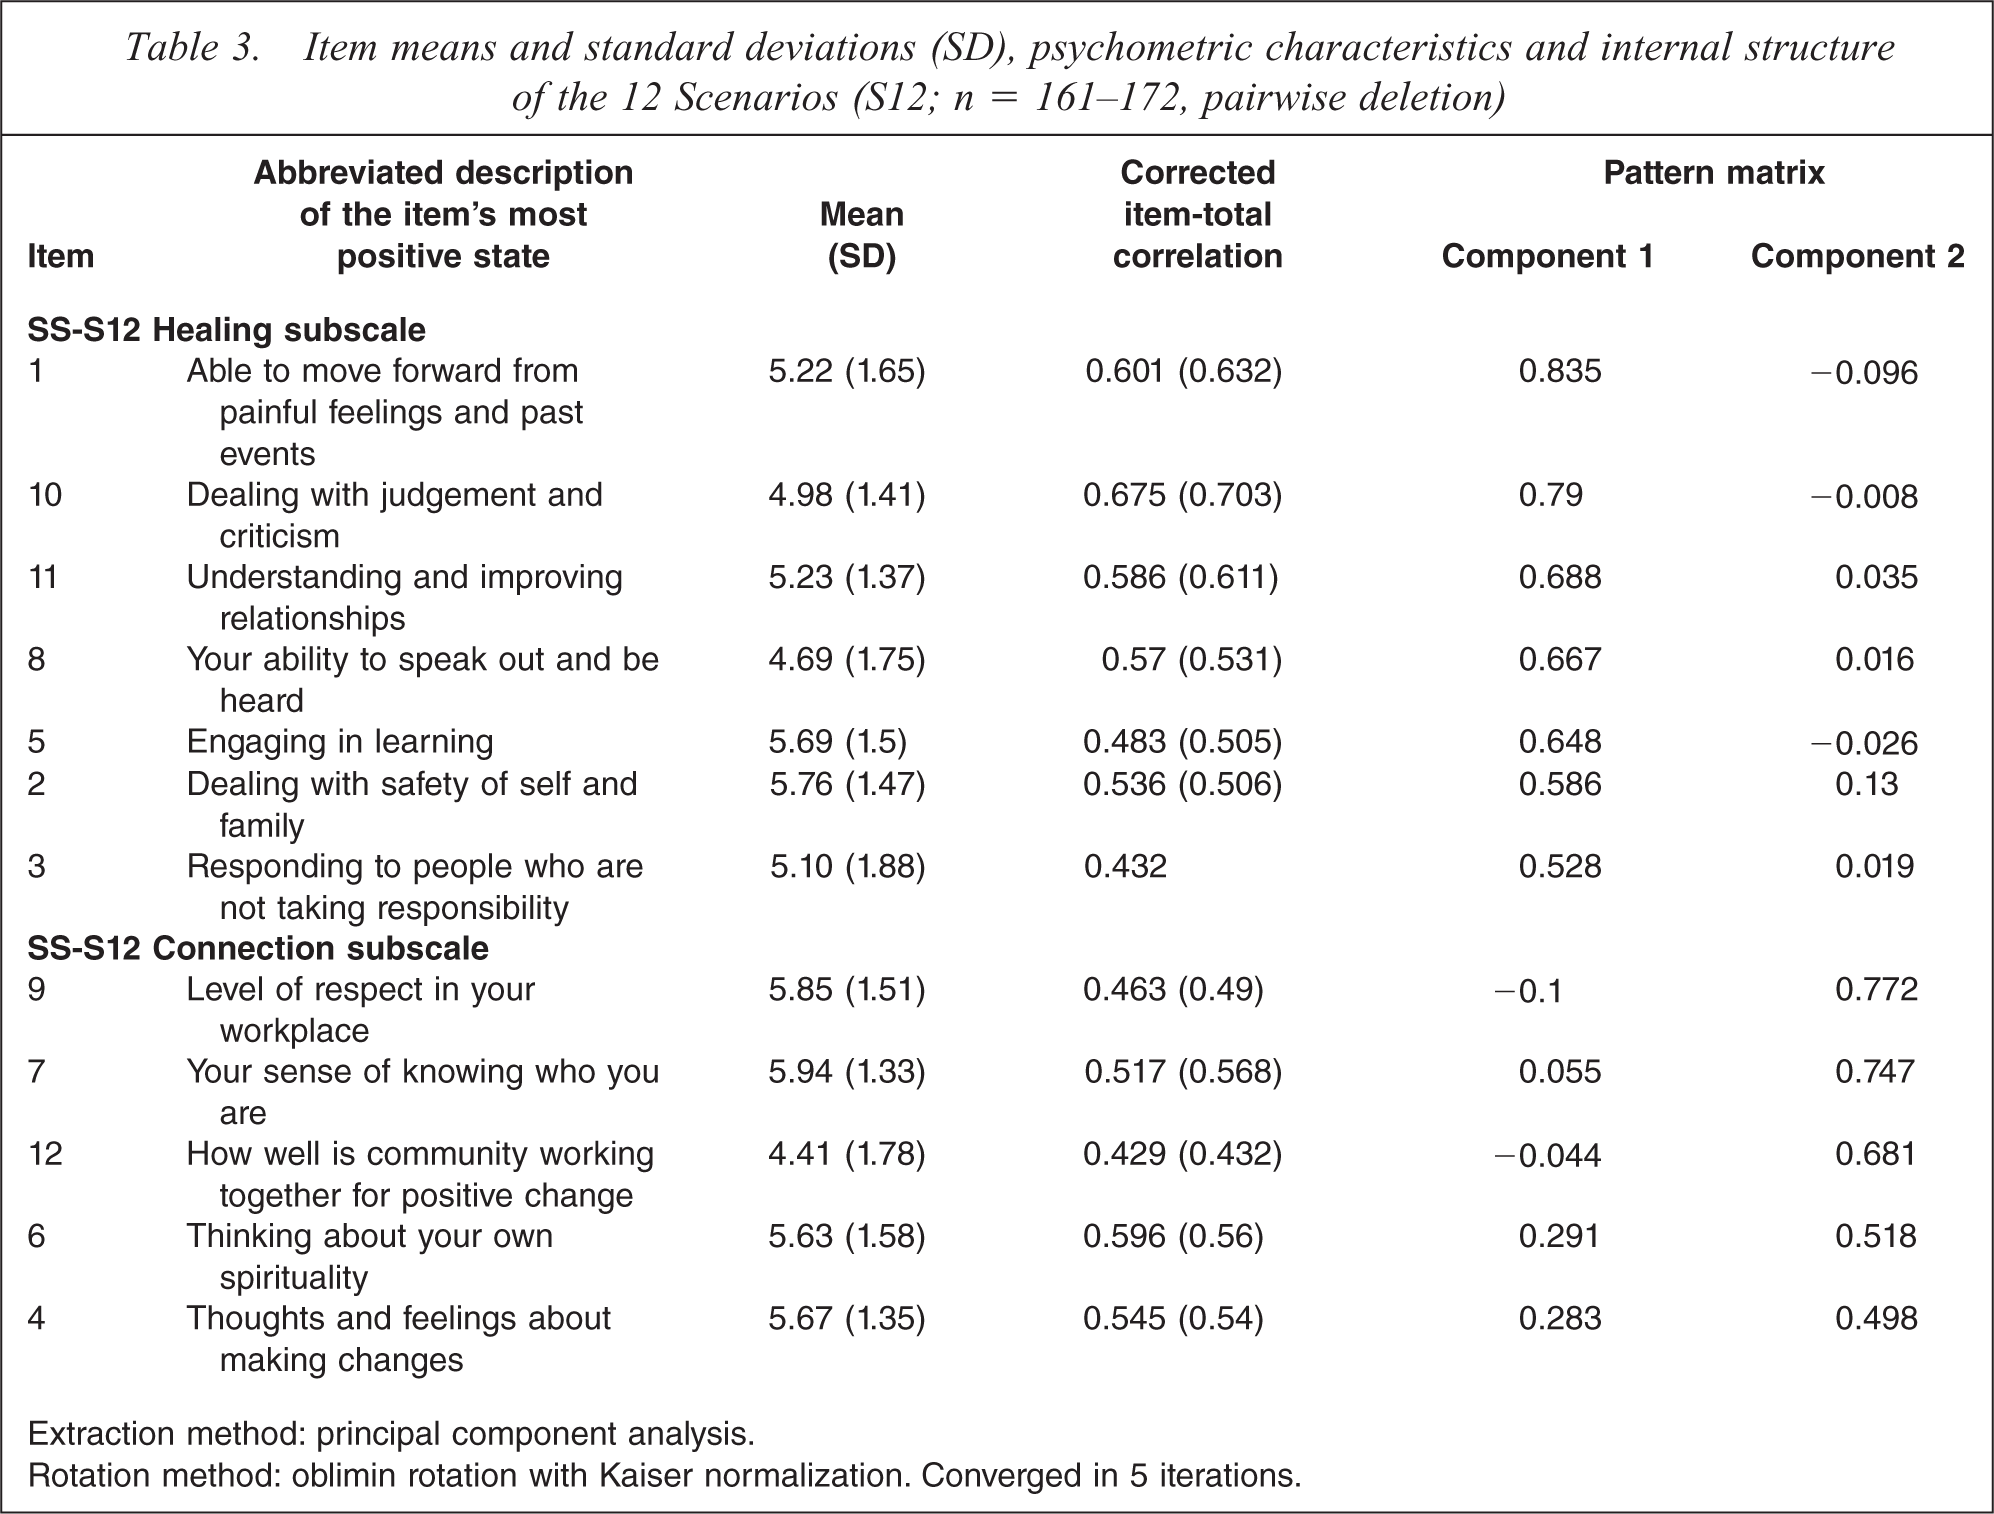
Scenario topics with the highest average scores were ‘knowing who you are’ and ‘respected in your workplace’, while those with the lowest were ‘community working together’ and ‘can speak out’ (Table 3). The mean score for 12S was 64.17 out of a possible 84 (n = 144, SD 11.63, skewness −0.728). The scores fitted a normal distribution and responses showed strong internal consistency with a Cronbach's alpha of 0.856. Deletion of individual items had minimal impact on the scale mean, variance or alpha.
Item means and standard deviations (SD), psychometric characteristics and internal structure of the 12 Scenarios (S12; n = 161–172, pairwise deletion)
Extraction method: principal component analysis.
Rotation method: oblimin rotation with Kaiser normalization. Converged in 5 iterations.
The KMO measure of sampling adequacy (0.877) and Bartlett's test of sphericity (approximate χ2 = 564.4, df 66, p < 0.001) supported the use of a principal component analysis. An initial analysis revealed three components with Eigen values > 1. Only two items (‘able to say no’ and ‘creating safety’) loaded unambiguously on a third component (Eigen value = 1.007), and for the sake of parsimony, a two-component solution (Table 3) explaining 48.97% of the variance was favoured.
One component comprised scenarios on ‘dealing with painfulfeelings’, ‘creating safety’, ‘reaction to judgement’, ‘engaging with learning’, ‘having a voice’, ‘being able to say no’ and ‘improving relationships’. These seven scenarios appeared to explore ‘Healing and enabling growth’. The subscale, SS-S12 Healing, had a mean of 31.6 out of a possible 49 (SD 6.59, skewness −0.794), and an alpha of 0.811 (n = 160). All corrected item-total correlations exceeded 0.4.
Scenarios exploring ‘identity’, ‘spirituality’, ‘being able to change’, ‘respected in the workplace’, and ‘community working together’ loaded on the second component. These five items appeared to reflect ‘Connection and purpose’, particularly in relation to the community. The subscale, SS-S12 Connection, had an overall mean of 27.53 out of a possible 35 (SD 5.36, skewness −0.656) and alpha was 0.747 (n = 150). All corrected item-total correlations exceeded 0.4.
The two subscales correlated with each other (r = 0.618) and with the total score (r = 0.933 for Healing; 0.858 for Connection).
Correlations and exploratory factor analysis between scales
Most scores from the three measures intercorrelated strongly (Table 4). The closest correlations were between the total EES14 and 12S (r = 0. 678), and both were similarly associated with K6 (r = −0.483 and −0.449), especially when the two additional questions on happy and angry feelings were included (r = −0.524 and −0.488, respectively).
Intercorrelations of the K6, K6+2 and GEM scales and subscales
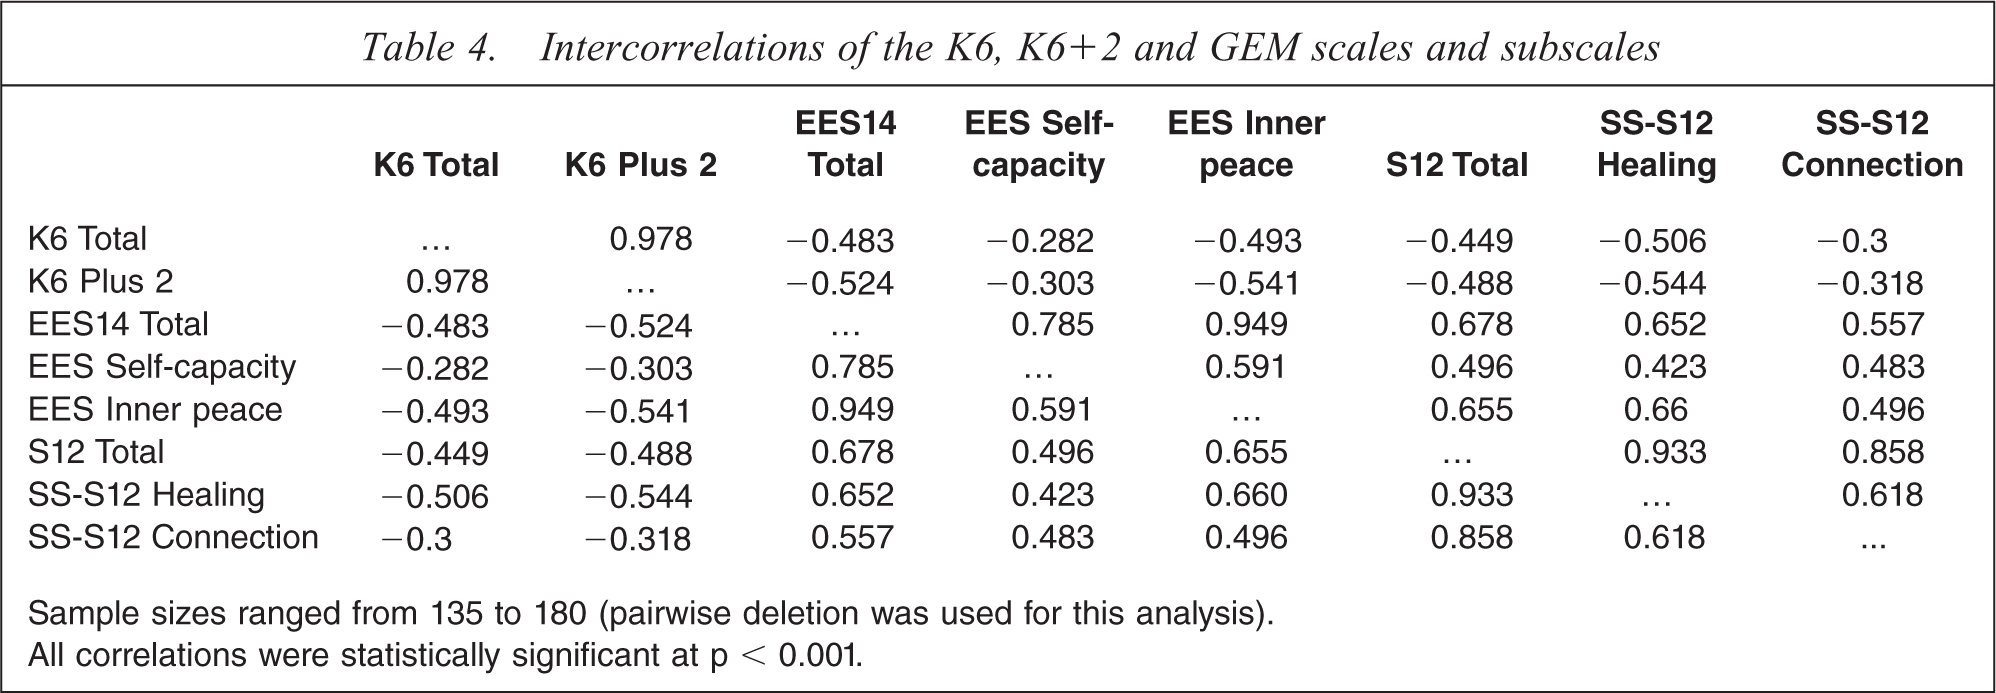
Sample sizes ranged from 135 to 180 (pairwise deletion was used for this analysis).
All correlations were statistically significant at p < 0.001.
In general, correlations with the Inner peace subscale of EES and the Healing subscale of S12 were stronger than those involving EES Self-capacity and S12 Connection. EES Inner peace and SS-S12 Healing scores were closely intercorrelated (r = 0.66), and associated with K6 +2 (r = −0.54). In comparison, EES Self-capacity and S12 Connection were less strongly correlated, −0.30 and −0.32, respectively, with K6+2.
Given these strong intercorrelations, exploratory factor analyses were performed with the items of the K6+2 and those of each of the GEM subscales to determine whether they measured the same (hence loading onto a single factor) or distinct (loading onto separate factors) aspects of well-being. In all cases, the K6 and the anger items loaded clearly onto one component, the EES and S12 subscale items loaded onto a second component. Notably, the K6+2 item ‘happy in yourself’ loaded unequivocally with the EES items in the Inner peace subscale and crossloaded with both the K6 and the anger items and the items of the other three subscales. Table 5 presents an example analysis with items of the EES Inner peace and the K6+2.
Exploratory factor analysis using items of the Kessler 6 plus 2 items (K6+2) and the EES Inner peace subscale (n = 148–178, pairwise deletion)
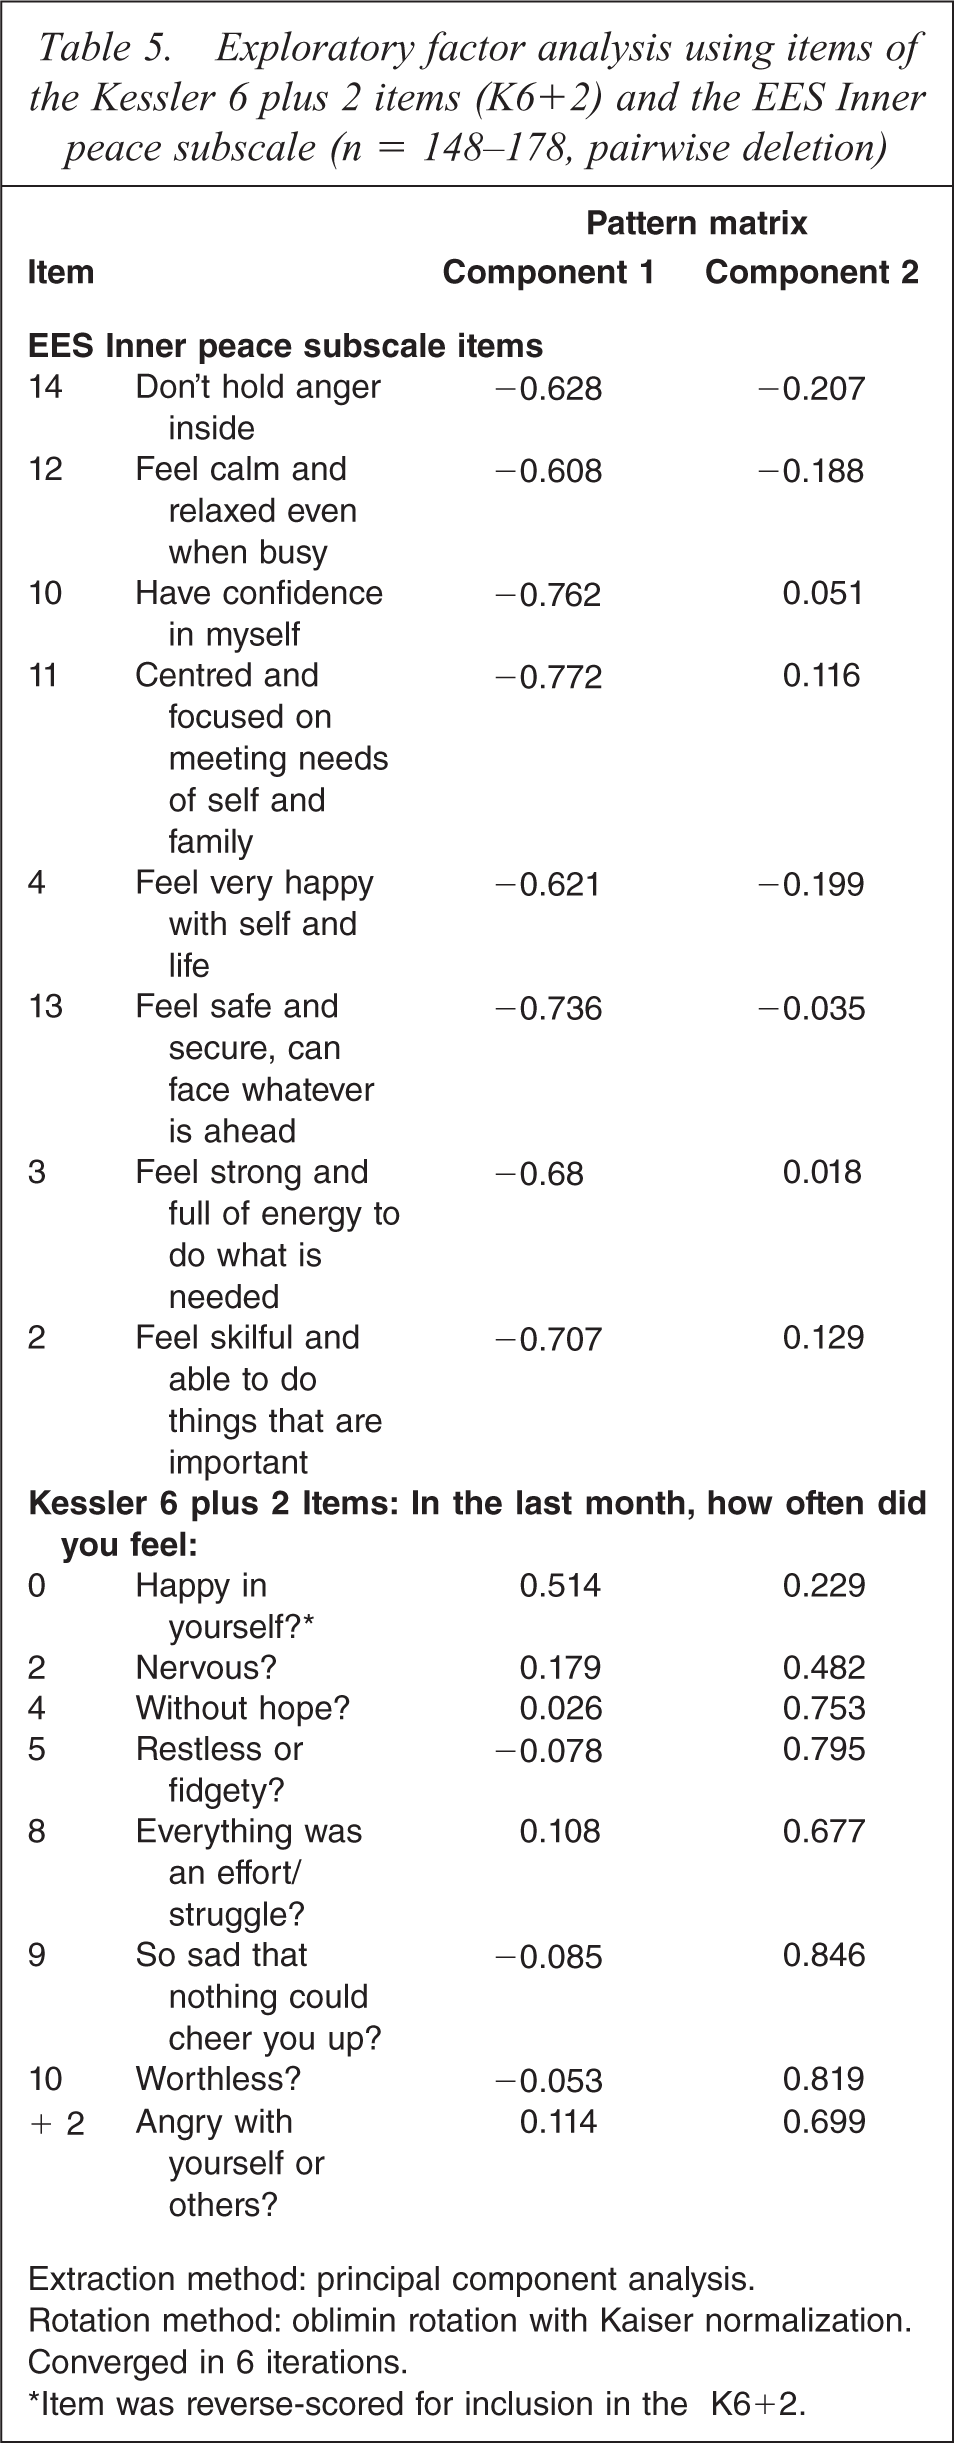
Extraction method: principal component analysis.
Rotation method: oblimin rotation with Kaiser normalization.
Converged in 6 iterations.
∗Item was reverse-scored for inclusion in the K6+2.
Discussion
This paper presents a first analysis of psychometric properties and intercorrelations of GEM, a new tool developed from descriptions of the experience of empowerment of Indigenous participants in the Family Well Being programme.
Validation processes for similar instruments have focused on endorsement, validity, discrimination, reliability and sensitivity [16,19–26,28,41]. Both EES and 12S measures from GEM gave promising results on these criteria. Internal consistency was robust, with alpha exceeding 0.7 in all cases. Individual components and summary scores appeared to measure inter-related but distinct aspects of empowerment and well-being.
Two items assessing happy and angry feelings were added to the standard Kessler 6 based on our and others’ experiences that these specific emotions are important in Indigenous health and well-being [38]. Anger is often associated with grief and loss, frustration and feelings of injustice, and has been linked to violence, incarceration and harmful outcomes for Indigenous men [42]. The ‘Kessler 6 plus 2’ had slightly enhanced internal consistency and stronger correlations with the GEM scales and subscales, and may provide a more complete picture of respondents’ emotional experience.
These observed patterns in internal structure and correlations are consistent with qualitative results on the impact of FWB. As participants gain more understanding of their identity, spirituality, emotions and relationships, they are more effective in engaging with community organizations and activities to enhance their external environment, and achieve greater calmness and security in their lives [9–12].
This first validation study has several limitations. The sample was not systematic or random; it was a convenience sample that included Aboriginal people involved in social and emotional well-being efforts of various types, health managers and health and mental health workers, social health teams, men attending leadership and knowledge sharing forums, Family Well Being programme participants and men commencing residential alcohol rehabilitation. Awareness of these aspects of life is likely to be enhanced among this sample, compared with Aboriginal people who are not engaged in well-being activities or work. It combined people from across a wide range of living situations and life experiences. Different response characteristics, reliability scores and psychometric properties may emerge in other groups and settings.
More work is clearly required to explore the characteristics of these scales and the phenomena they aim to measure. It should test their sensitivity to change, distinction or overlap with other existing measures and psychometric variation or stability across cultures and settings. The capacity for GEM to inform relationships between well-being and empowerment in rehabilitation settings is currently under test, as are its relationships with measures of mental health recovery, and its capacity to predict successful reintegration after release from prison. These studies will enhance our understanding of reliability, validity and usefulness of GEM and the contribution of empowerment to greater global equity. This fits well with a global view of human development as: ‘Human development is about putting people at the centre of development. It is about people realizing their potential, increasing their choices and enjoying the freedom to lead lives they value.’ [43].
In summary, preliminary data on GEM suggest that the tool is collecting valid and reliable data on domains of empowerment that are relevant to Indigenous Australians and probably also to others. Emerging subscale structures suggest that Indigenous experience of empowerment encompasses the extent that a person can live a life that honours their identity, values and abilities in harmony with others. Through this process, they achieve a positive sense of calm and well-being, even in difficult external circumstances. While factor analyses demonstrate that GEM scales are separable from a measure of distress, they do significantly predict distress. GEM clearly has direct relevance to mental health, a key issue in Indigenous Australian communities.
Footnotes
Acknowledgements
We thank the participants and colleagues Mary Whiteside, Vicki Saunders, Rachael Wargent, Trevor Crowe, Martin Billingham, Ernest Hunter, Jason Connor, Janya McCalman for assistance. We especially acknowledge the creators of the Family Well Being Program, the Aboriginal Education Development Branch, Office of Vocational Education and Training, South Australia.