
Abstract
We study an Expectation-Maximization (EM) algorithm for estimating product-term regression models with missing data. The study of such problems in the frequentist tradition has thus far been restricted to an EM algorithm method using full numerical integration. However, under most missing data patterns, we show that this problem can be solved analytically, and numerical approximations are only needed under specific conditions. Thus we propose a hybrid EM algorithm, which uses analytic solutions when available and approximate solutions only when needed. The theoretical framework of our algorithm is described herein, along with three empirical experiments using both simulated and real data. We demonstrate that our algorithm provides greater estimation accuracy, exhibits robustness to distributional violations, and confers higher power to detect interaction effects. We conclude with a discussion of extensions and topics of further research.
We consider the problem of missing data in regression models with product-term predictors. In the educational and behavioral sciences, product-term regression models are widely used to test hypotheses pertaining to interactions (Aiken & West, 1991), moderation (Baron & Kenny, 1986), and/or conditional processes (Hayes, 2018). For example, these hypotheses may refer to the difference in an effect between two groups, the dependence of an outcome-predictor relationship on other variables, or the effect of two simultaneous symptoms above and beyond their constituent effects. A considerable amount of methodological research has been dedicated to interpreting these models (Dawson, 2014; McCabe et al., 2018; Preacher et al., 2006), attesting to their importance and popularity.
However, the estimation of product-term regression models is complicated by the issue of missing data, which is particularly prevalent for data involving human subjects. It can arise from subject dropout, item non-response, logistical errors, or even serve as a designed aspect of data collection (Graham, 2009; Raghunathan, 2004). If the mechanism of missing data meets certain conditions, this problem (or design) can be accommodated and consistent estimates can be obtained. In particular, we consider the situation under which the missing data mechanism is called ignorable (Schafer, 1997). Colloquially speaking, it means that the probability of an observation being missing does not depend on its own would-be realized value, and that the data value-generating mechanism is distinct from the missingness-generating mechanism.
Previous literature on this problem can be broadly cast into two categories: correctly specified and misspecified characterizations of the joint distribution of the data. For product-term regression models, incorrect specification generally occurs for the product terms. The most common type of misspecification is naively assuming the product terms are jointly Gaussian along with their constituent factors (von Hippel, 2009). This has also been called the “just another variable” approach (Seaman et al., 2012) as it treats the product term simply as another Gaussian random variable. However, this introduces a contradiction of distributional assumptions, as a product of Gaussian random variables cannot itself be Gaussian. While some studies have shown that there may be some conditions under which this method is reasonable (Enders et al., 2014; Seaman et al., 2012), it is not guaranteed to provide unbiased estimates in general (Bartlett et al., 2015; Lüdtke et al., 2019; Zhang & Wang, 2017).
To address these issues, correctly specified methods have been developed. This is typically accomplished by factorizing the joint distribution into a product with conditional distributions. In this way, it can be easier to correctly specify the constituent factored distributions, rather than the original joint distribution itself (Ibrahim, 1990). Hence, this technique can ensure compatibility between the substantive model of interest, and the overall joint distribution of the data (J. Liu et al., 2014). It has also been called factored regression modeling (Lüdtke et al., 2019), substantive model compatibility (Bartlett et al., 2015), and model-based handling (Enders et al., 2020).
The application of this technique however, has been largely focused on multiple imputation methods with Markov Chain Monte Carlo under a Bayesian paradigm (Kim et al., 2015; Lüdtke et al., 2020; Zhang & Wang, 2017). On the other hand, research in the frequentist framework has been scant. Currently, only an EM algorithm using full numerical integration has been proposed by Lüdtke et al. (2019). While their method is flexible and handles a variety of nonlinear models, numerical integration is known to suffer in accuracy and computational complexity as the number of dimensions increases (Hinrichs et al., 2014; Simonovits, 2003). Hence, the feasibility of this method is in question even when the number of variables is moderate. Indeed to date, this method has only been tested under very optimistic conditions.
The premise of the current research is to propose a hybrid EM algorithm that obviates much of the required calculations done by numerical integration. Specifically, we will show that numerical integration is not necessary for most missing data patterns, and we will demonstrate how to use analytic solutions in their place. These exact solutions will yield more accurate estimates relative to their approximate counterparts. Therefore, this research has two main goals: (a) to develop the theoretical motivation of the hybrid EM algorithm and (b) to empirically study the benefits of analytic solutions in practical data scenarios.
Model and Notation
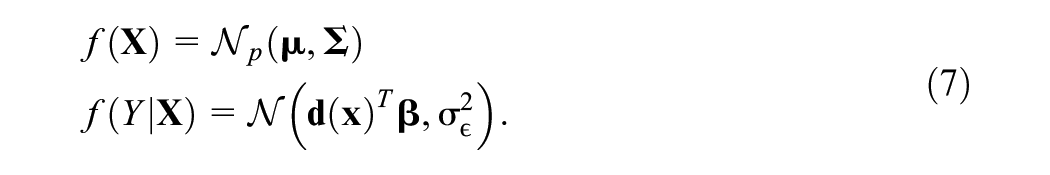
Let

where
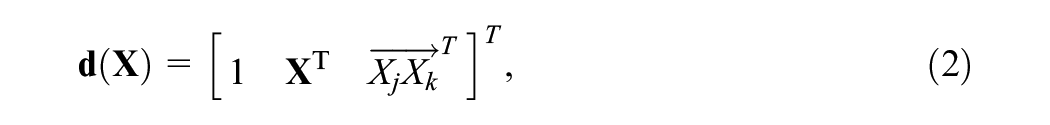
where
We note that there are two implicit assumptions with this model for the purposes of generality. First, we assume that the vector
Missing Data Assumptions
To recast the data from a predictor-outcome distinction to a missing-observed distinction, we use the following notation. Denote an augmented data vector as
We assume that the elements of

Taking MAR in tandem with the distinctness of
The EM Algorithm for Missing Data
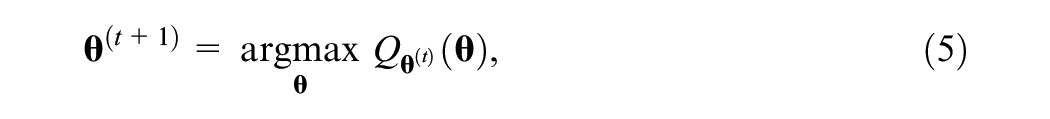
The EM algorithm is a two-step iterative procedure for obtaining parameter estimates for models with missing data (Dempster et al., 1977). The steps are as follows:
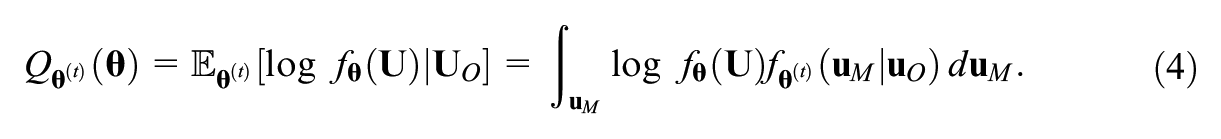
where we use the integration symbol with respect to a vector as shorthand for multiple integration or summation with respect to all elements of the vector, depending on if the random variable is continuous or discrete (e.g.,
Application to Product-Term Regression Models
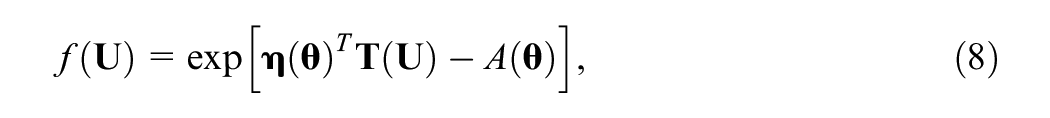
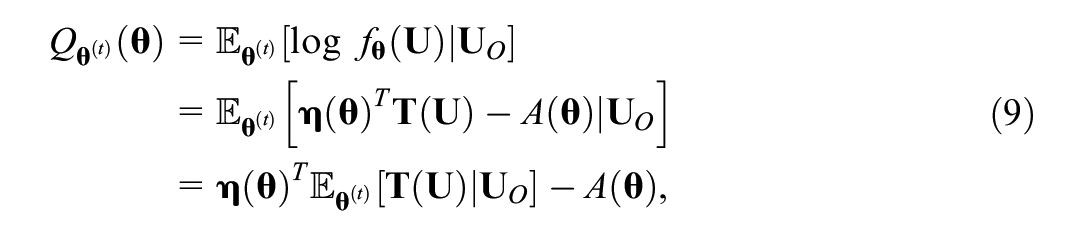
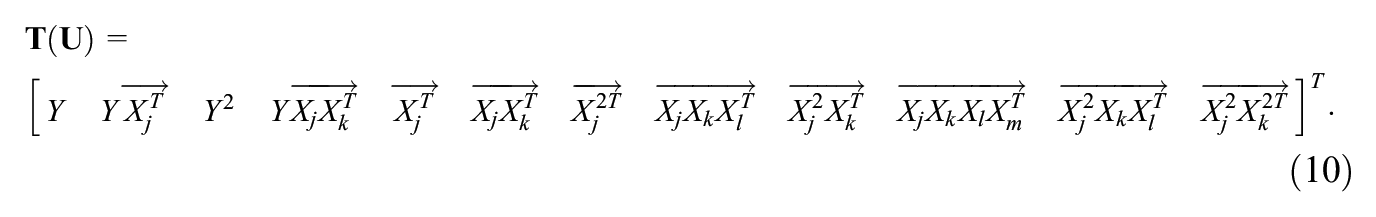
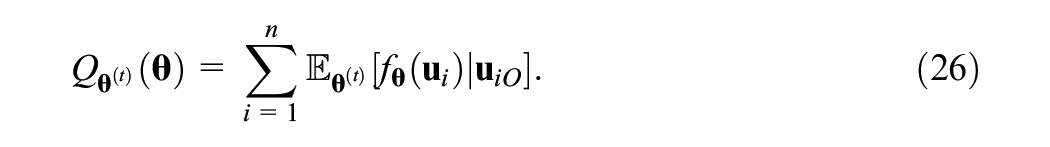
For practical uses, the main task of applying the EM algorithm is setting up the

where
Since
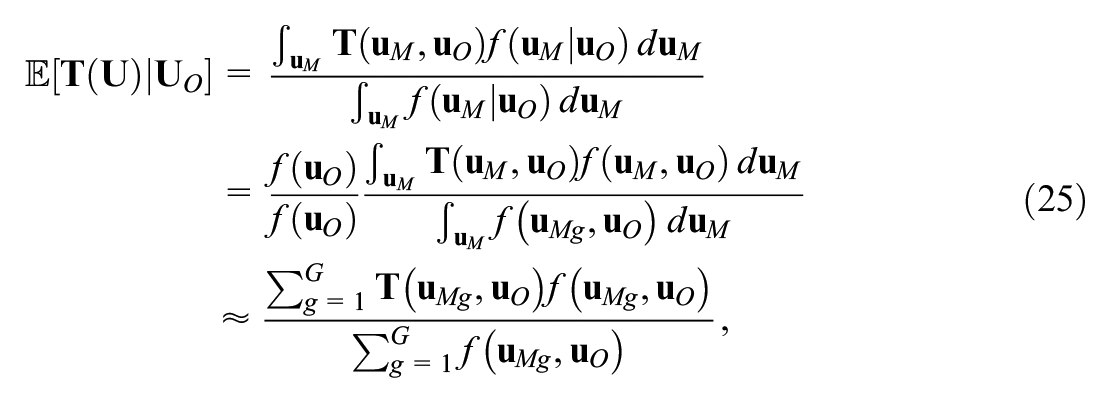
which yields a
where
The derivation of
Missing Data Patterns
The theoretical motivation of this research is the derivation of analytic
We will provide the methods of calculating
Missing Data Pattern 1
MDP 1 is concerned with the case when
First, we consider the sufficient statistics that are solely a function of
where
Our strategy will make use of two key facts. First, Gaussian random vectors are closed under conditioning, hence
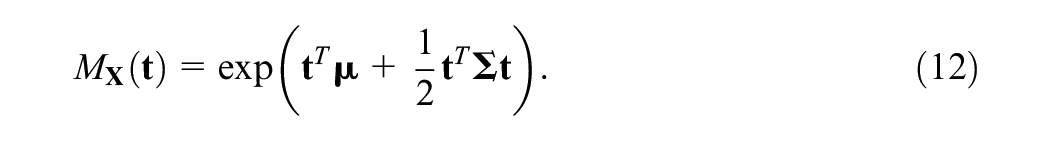
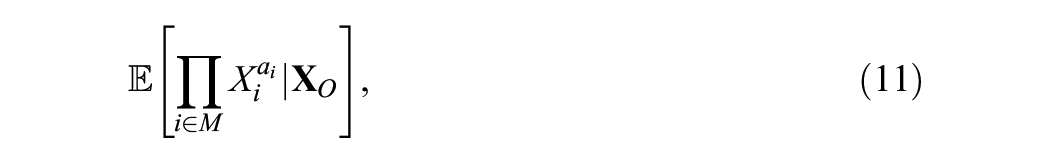
Then by the moment calculation property, any arbitrary product moment can be calculated with
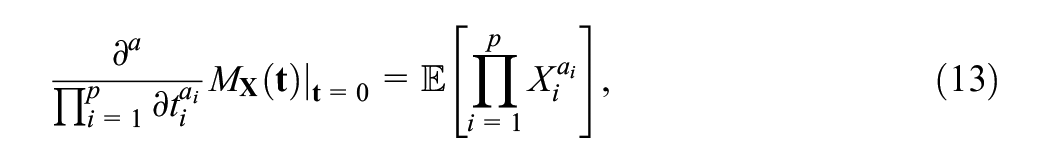
where
From here, the expectation in the form of Equation 11 can be obtained by seeing that the parameters of
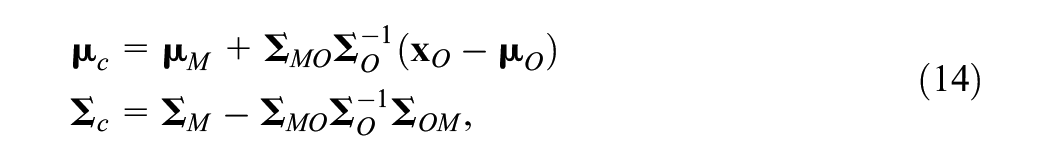
which follows from the well-known parameterization of conditioning on Gaussian random vectors. Then by applying Lemma 1 on
Among the remaining four sufficient statistics, we turn our attention to

which follows from applying the law of total probability and Bayes’ rule (see Supplemental Appendix C [available in the online version of this article] for explicit proof). Noting that
Finally, the remaining expectation is
where
Missing Data Pattern 2
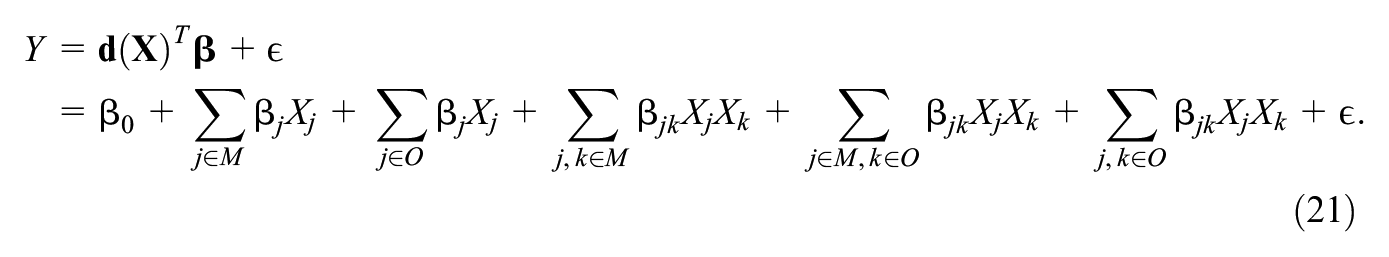
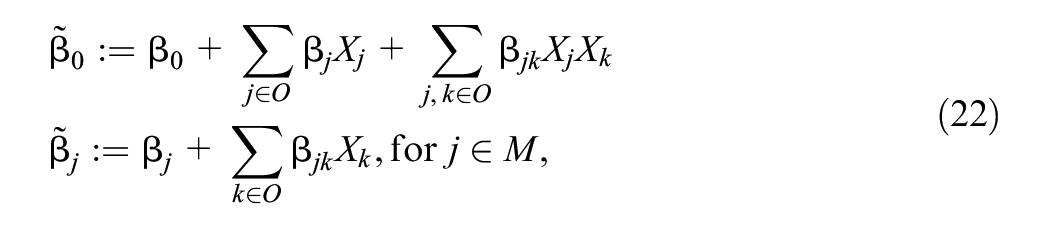
MDP 2 considers the scenario where
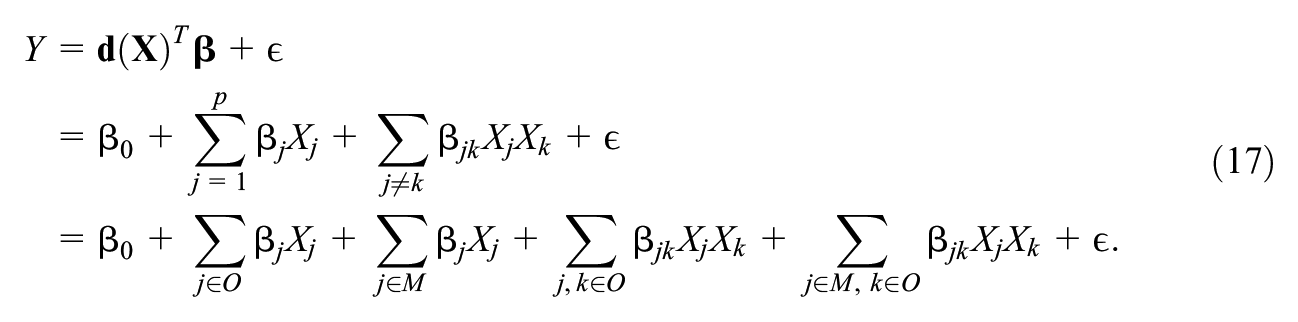
Then, we can regard all
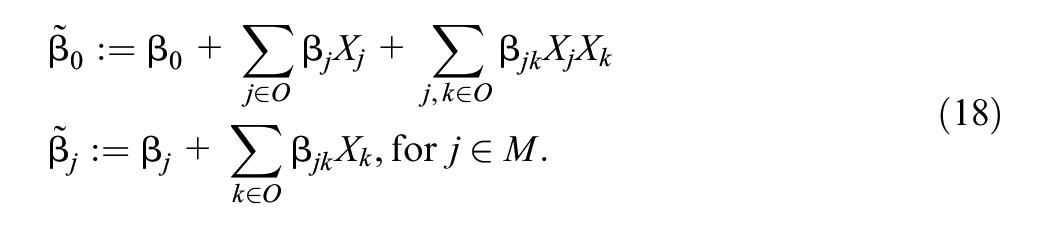
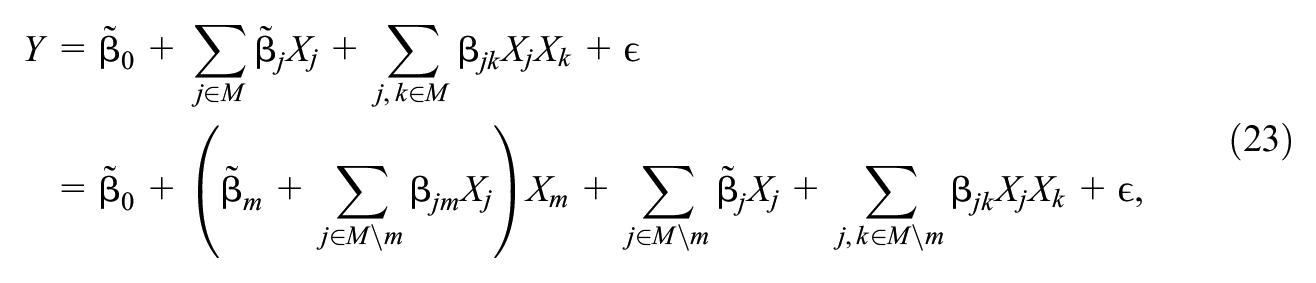
This allows us to re-write the model only in terms of the missing variables as
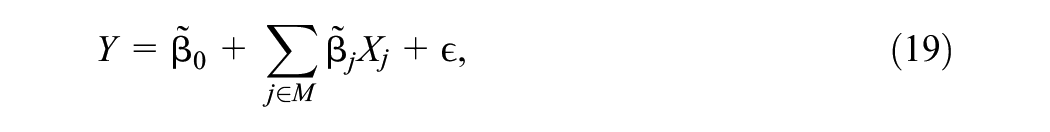
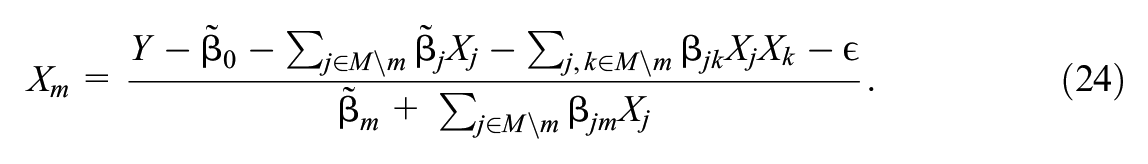
from which we can write for any fixed
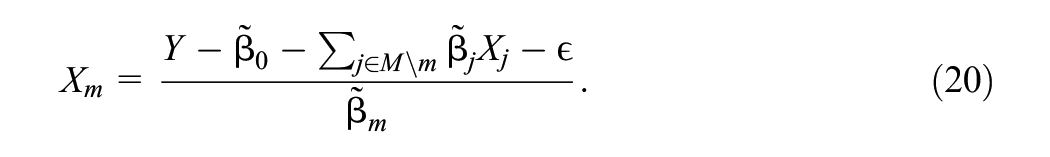
Thus, any
Since
Missing Data Pattern 3
MDP 3 concerns the case where
Then we treat the observed variables as constants and absorb them into the
then for any
which implies that
From here we can see that
where
Summary of Results
We propose to construct a hybrid EM method that uses the analytic results derived in this section for MDPs 1 and 2, and numerical integration for MDP 3. To incorporate these results into a hybrid EM algorithm, first consider the
The key observation of this characterization is that the conditional expectation can be taken in a case-wise manner. Thus the calculation of the conditional expectation for each case can differ depending on the missingness pattern, which dictates if numerical integration is necessary or not. That is, the analytic solutions described earlier can be used if case
Empirical Studies
Given that the hybrid EM algorithm minimizes the use of numerical approximations, we now investigate the impact this has on data analysis. We do this over three empirical studies: (a) a basic simulation study varying several characteristics of the data, (b) a simulation study using real data with behavioral measures, and (c) a study on power.
Basic Simulation Study
For a basic simulation study, we sought to study estimator performance over several settings:
Estimation methods: hybrid EM (HYB), full numerical integration (NI), and complete data least squares (CD) as a baseline.
Sample size (
Proportion of missingness (
r = 100 replications per condition combination.
Our primary interest was to study the effect of analytic EM iterations versus NI. As such, we specifically generated missingness patterns from MDP 1 and MDP 2, which resulted in the HYB method using only analytic integration. The NI method uses numerical integration regardless of missing data pattern, and we used the Riemann midpoint method following Robitzsch and Lüdtke (2021) and used 40 grid points spread uniformly between
Data Generation
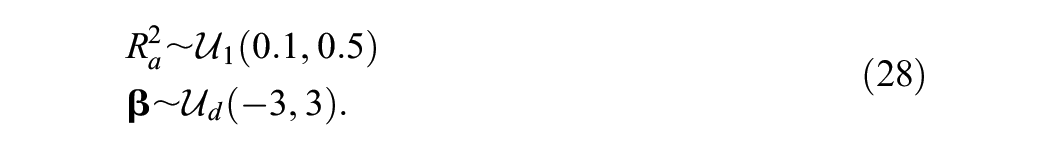
The parameters for

where
For the regression model, three of the seven predictors were chosen at random to form product terms in
Given a sample of
Once
Performance Metrics
To evaluate performance, we calculated bias and mean square error (MSE) quantities aggregated within coefficient vectors as follows:
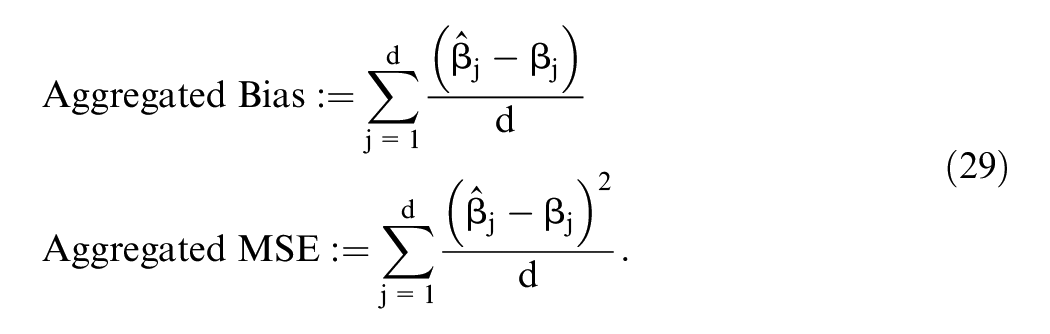
We then examined these quantities averaged over
Results
Plots of aggregated bias and aggregated MSE are displayed in Figure 1. Across all conditions, the HYB method had a lower MSE than NI. While the MSE increased with
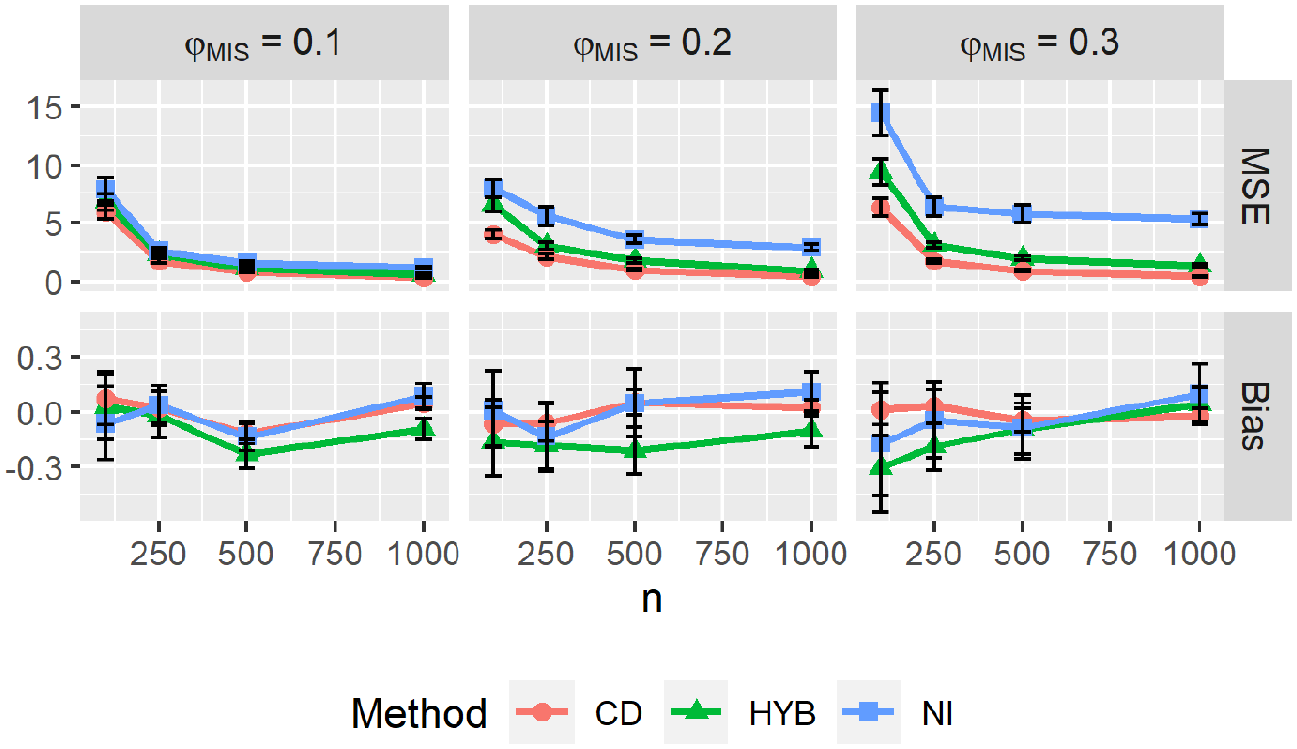
Aggregated MSE and bias by
Real Data Study
In this study, we compared the practical use of the HYB and NI methods by using data from real behavioral measures. Educational and behavioral data may be discrete or skewed, contrary to the multivariate Gaussian assumption that we utilize for the predictors. The Gaussian assumption is typically not required when the data are complete, but utilized here to accommodate missingness in the predictors. Therefore, we study the robustness of the multivariate normality assumption when the predictors are instead discretized or skewed as real data would be. We do this by taking a set of real, complete, behavioral data and setting it as our population of interest. We then sample from this population by non-parametric bootstrap and then artificially insert missingness to the bootstrapped datasets. The performance of the HYB and NI methods are then evaluated in their ability to recover the regression parameters from these bootstrapped datasets.
We analyzed measures of psychopathology from the Adolescent Brain Cognitive Development (ABCD) Study (https://abcdstudy.org). The ABCD is a large, multi-site study, whose data are publicly available (Volkow et al., 2018), which was approved by the institutional review boards of the participating sites (Clark et al., 2018). To avoid potential clustering effects by site and to reduce the sample size to a more realistic scale, one site was selected randomly to provide the basis of our data (
We considered a linear model of conduct disorder as a function of attention deficit hyperactivity disorder (ADHD), depression (DEP), their product-term (ADHD × DEP), controlled for by anxiety (ANX), and oppositional defiant disorder (ODD). Previous work has shown comorbidity among these variables (Angold et al., 1999; Jensen et al., 1997). Measures were taken using summary scores of the child behavior checklist (Achenbach & Rescorla, 2001). These scores are fairly skewed and discrete, residing on the integers 0 to 15. We display histograms of these scores in Figure 2.
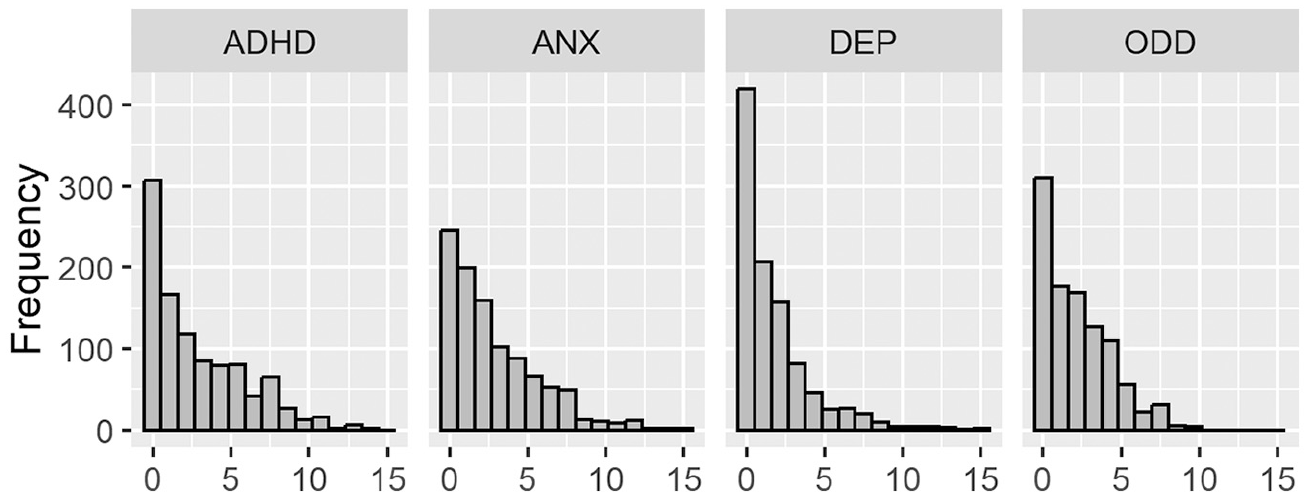
Histograms of the predictors variables for the real data study.
For each bootstrapped data set, missingness was inserted using the same MAR generating procedure as the previous basic simulation study (equal proportions of MDPs 1 and 2) but fixed

These metrics were evaluated over
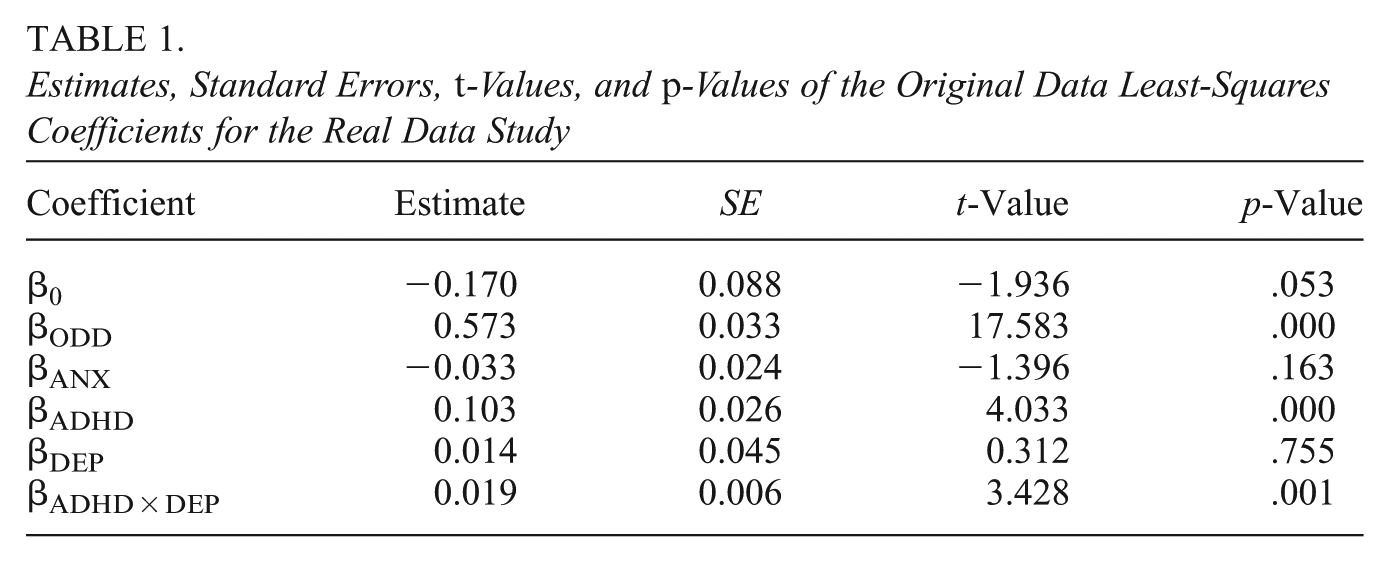
Estimates, Standard Errors,

Boxplots of the results are displayed in Figure 3. On average, the biases from all methods were close to zero across all parameter estimates, with the only exception being the NI method underestimating the
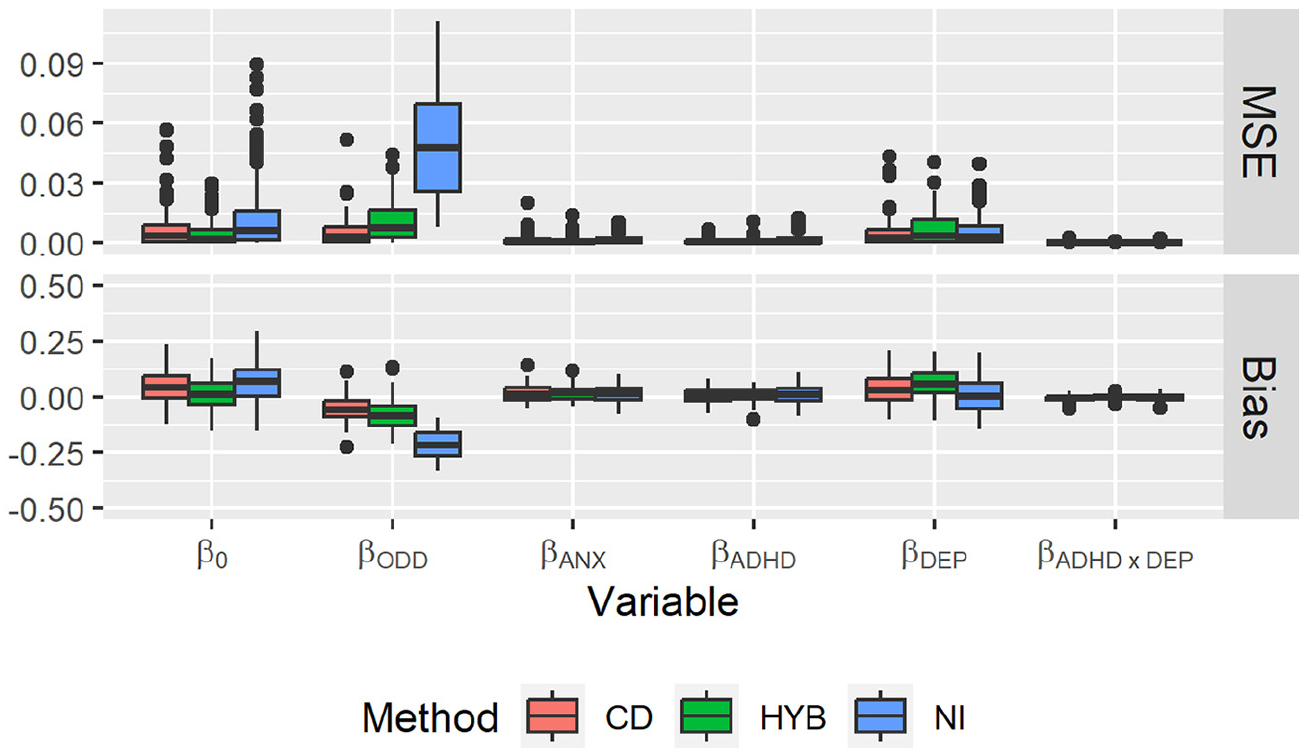
Empirical MSE and bias by method over all regression parameters.
Power Study
Given that analytic iterations confer improved MSE as demonstrated by the basic simulation study and the real data study, we examine how this may translate to increased power. We used the same dataset as the real data study as a basis, and once again set the least-squares estimates of the complete data as the true coefficient vector. Then we used a parametric bootstrap to generate error terms such that the alternative hypothesis will be true on the interaction coefficient before missingness is inserted with an approximate power of 0.80 (in a one-tailed
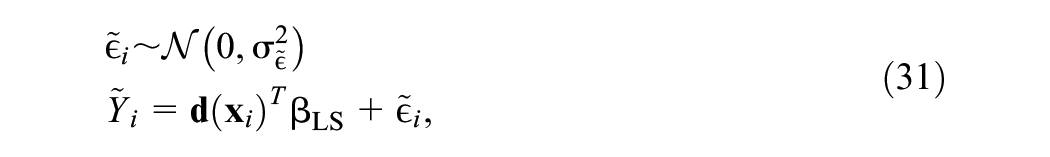
for all
where we calculated the standard errors for the HYB and NI by numerically differentiating the Fisher score function (Jamshidian & Jennrich, 2000). Then the estimated power was taken to be the proportion of times that the
We display the estimated power of each method in Figure 4a. Complete data least-squares estimates are included as a control comparison. The estimated power was 0.82 for the complete data, 0.77 for HYB, and 0.42 for NI. As is expected by the insertion of missingness, both the HYB and NI methods show reduced power. However, the HYB method was substantially more robust, only having a reduced power of 0.05, whereas the NI method had a reduced power of 0.40 relative to the complete data power. Consistent with the results of the previous two studies, this is attributable to the increased estimation variance of the NI method, which can be seen in Figure 4b. These box plots display magnitudes of
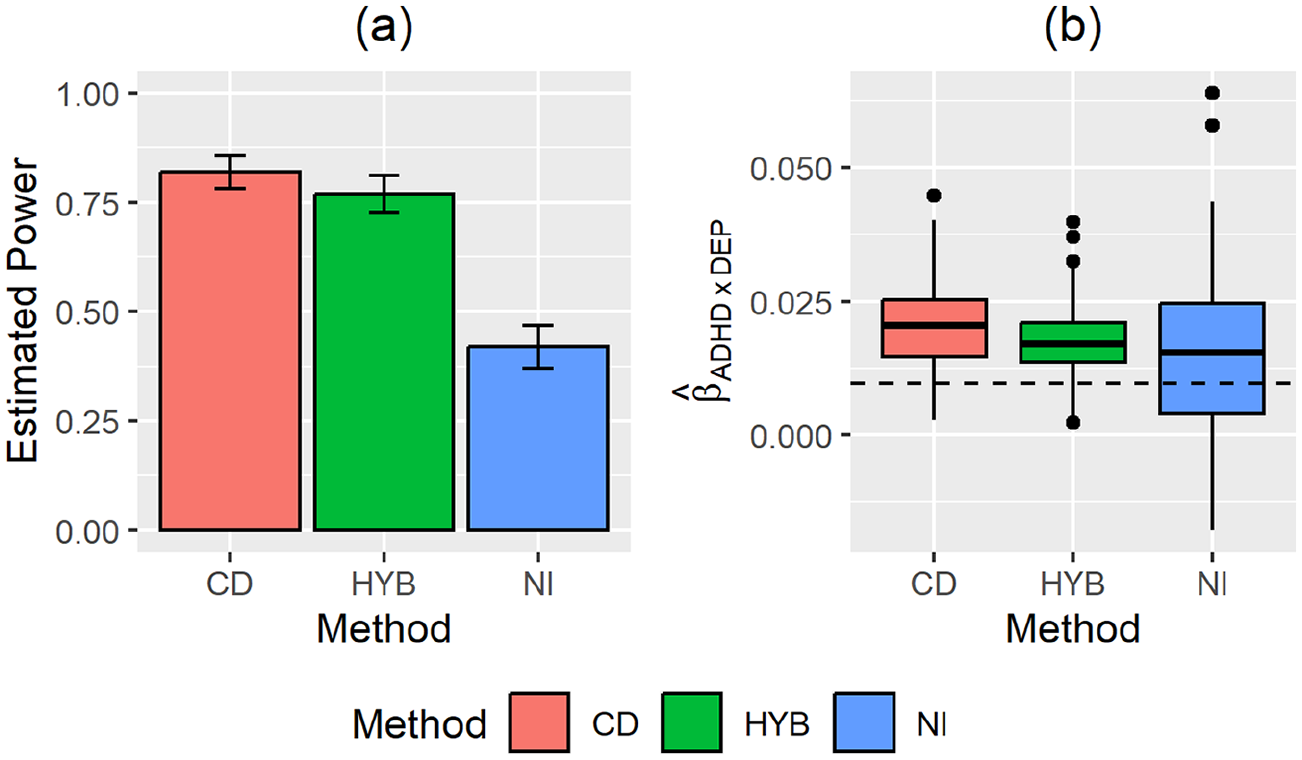
Estimated power of the three methods (a) and the box plots of
Discussion
In this research, we sought to improve the EM algorithm for linear models with two-way product terms by deriving analytic
Comparing the hybrid method to NI, several themes arose across the three simulation studies. First, both methods showed very little bias, even when the predictors were non-normal. Second, the hybrid method outperformed NI primarily in terms of estimation variability, in both normal and non-normal scenarios. And third, this reduction in variability can translate to substantial increases in power.
Tempering these promising results is the fact that the hybrid method used in this study is specific only to product-term regression models. Certain aspects of this research may generalize well toward other models, for example, our analysis of MDP 1 may readily generalize into polynomial predictors. For other regression designs, such as the generalized linear model and/or discrete predictors, further study will be required to parse their idiosyncratic characteristics. In contrast, the NI method remains general and readily applicable.
Another avenue for future research is to investigate other missingness mechanisms. In the current study, we focused on an ignorable missingness mechanism. However recently, frameworks have been developed to determine situations where consistent estimates can be obtained when the missingness mechanism is non-ignorable (Mohan & Pearl, 2021; Rabe-Hesketh & Skrondal, 2023). Also, the robustness of these methods to distributional violations could be more systematically studied through more carefully designed experiments that vary aspects such as discreteness and skewness.
From a computational perspective, the scalability of these methods can be further investigated by varying the number of variables. At higher proportions of missingness, a more principled strategy for start values may also be called for. Additionally, the hybrid approach may also be incorporated into Monte Carlo methods of integration, including Gibbs and Metropolis-Hasting variants (Levine & Casella, 2001; Wei & Tanner, 1990). The NI method may also be improved via other approximating functions (Q. Liu & Pierce, 1994) and/or by adaptive methods (Rabe-Hesketh et al., 2002). In the context of the current research, these topics are amenable directions for further study in missing data methods for regression models, and may also result in higher power to detect effects.
Supplemental Material
sj-pdf-1-jeb-10.3102_10769986241304015 – Supplemental material for A Hybrid EM Algorithm for Linear Two-Way Interactions With Missing Data
Supplemental material, sj-pdf-1-jeb-10.3102_10769986241304015 for A Hybrid EM Algorithm for Linear Two-Way Interactions With Missing Data by Dale S. Kim in Journal of Educational and Behavioral Statistics
Footnotes
Declaration of Conflicting Interests
The author declared no potential conflicts of interest with respect to the research, authorship, and/or publication of this article.
Funding
The author received no financial support for the research, authorship, and/or publication of this article.
Author
DALE S. KIM is an Assistant Professor in the Department of Statistics & Data Science at University of California, Los Angeles, Math Sciences Building 8125, 520 Portola Plaza, Los Angeles, CA 90095, e-mail:
References
Supplementary Material
Please find the following supplemental material available below.
For Open Access articles published under a Creative Commons License, all supplemental material carries the same license as the article it is associated with.
For non-Open Access articles published, all supplemental material carries a non-exclusive license, and permission requests for re-use of supplemental material or any part of supplemental material shall be sent directly to the copyright owner as specified in the copyright notice associated with the article.