
Abstract
Observed-score test equating is a vital part of every testing program, aiming to make test scores across test administrations comparable. Central to this process is the equating function, typically estimated by composing distribution functions of the scores to be equated. An integral part of this estimation is presmoothing, where statistical models are fit to observed score frequencies to mitigate sampling variability. This study evaluates the impact of commonly used model fit indices on bivariate presmoothing model-selection accuracy in both item response theory (IRT) and non-IRT settings. It also introduces a new model-selection criterion that directly targets the equating function in contrast to existing methods. The study focuses on the framework of non-equivalent groups with anchor test design, estimating bivariate score distributions based on real and simulated data. Results show that the choice of presmoothing model and model fit criterion influences the equated scores. In non-IRT contexts, a combination of the proposed model-selection criterion and the Bayesian information criterion exhibited superior performance, balancing bias, and variance of the equated scores. For IRT models, high selection accuracy and minimal equating error were achieved across all scenarios.
1. Introduction
One of the key components of an educational testing program is to ensure fair assessments for all examinees. A routine task of most testing organizations therefore is test score equating, which refers to the procedure of putting scores from different test administrations on a common scale so that they can be compared and used interchangeably (González & Wiberg, 2017). The difficulty of a test may differ from time to time as many of the test items are typically not reused to ensure a high validity. Without any score adjustment, admission to university programs, for example, will not solely be based on the test-taker’s ability but will also be influenced by the difficulty level of the test forms. Furthermore, in many realistic testing scenarios, the test groups are not randomized and therefore systematically differ from each other. In other words, the effect of test form difficulty is confounded by the latent ability, making it a highly non-trivial task to adjust for. The statistical task in test score equating therefore is to find a function that maps the scores of the new test form to the scale of the old, using samples from two non-randomized groups, thereby adjusting for the difference in difficulty while taking the difference in ability into account. Test score equating is thus a crucially important and fundamental component of fair assessments.
The starting point for any equating method is to define what notion of equivalence, in terms of the test scores and the latent ability, to use. The most common approach is to define two scores,
The most common presmoothing model is the log-linear model (Holland & Thayer, 1987; Kolen, 1991). Several studies are showing the positive effect of log-linear presmoothing on equating accuracy, see, for example, Hanson (1991), Livingston (1993), Moses and Holland (2007), and Moses and Liu (2011). Previous studies have also evaluated different model fit indices for log-linear models (Moses & Holland, 2010a) and their effect on traditional equating estimators (Liu & Kolen, 2020; Moses & Holland, 2009). There are furthermore other presmoothing options suggested in the literature, for example, the beta-4 model (Kim et al., 2005), the cubic B-spline, and direct presmoothing (Cui & Kolen, 2009).
If the tests are calibrated with an item response theory (IRT) model, options for IRT equating are also available. IRT equating methods have been implemented for both true-score and observed-score equating methods (Kolen & Brennan, 2014), thus considering both classical and modern test theory approaches. Recently, Andersson and Wiberg (2017) implemented IRT within kernel equating (von Davier et al., 2004), an equating framework that includes both the traditional and modern equating methods.
This study is concerned with the sensitivity of presmoothing model selection on the equated scores. We specifically evaluate the performance of the Akaike information criterion (AIC; Akaike, 1974), the Bayesian information criterion (BIC; Schwarz, 1978), and the likelihood ratio chi-square statistic for selecting the parameterization of log-linear and IRT models, respectively, when the overall goal is test score equating. We furthermore propose a new model-selection method, which directly targets the equating function rather than the fit of the empirical score data. This study is different from Moses and Holland (2010a) since the selection of model parameterization is evaluated in terms of equated scores and not for the distributions being estimated. This study further differs from both Moses and Holland (2009) and Liu and Kolen (2020) who evaluate model fit indices for the equivalent groups (EG) design, as the focus here is on non-equivalent ability test groups. Moses and Holland (2010b) study model-selection for bivariate distributions for NEAT equating but only consider the selection of cross-moments in the log-linear model and not the full model. They do moreover not consider IRT equating. In this study, we furthermore consider a family of equating functions which includes both traditional and modern equating methods, and non-IRT and IRT data. It makes this the most comprehensive study of model-selection for test score equating. The proposed model-selection criterion, which targets the asymptotic standard error of equating (ASEE; Holland & Thayer, 1989; von Davier et al., 2004) and is based on the AIC, BIC, and likelihood ratio test (LRT), furthermore makes it possible to study the equating properties of these model-selection criteria. The results will be presented for both empirical data from a real admissions test and a comprehensive simulation study.
The article is organized as follows. We start by giving an introduction to test score equating and kernel equating, followed by a presentation of log-linear and IRT presmoothing. Next the empirical study is described, followed by the simulation study. The article ends with a discussion and practical recommendations.
2. Test Score Equating
In this section, we will introduce all of the necessary definitions, notation, and terminology. We begin with clearly defining the equating function, before presenting the kernel equating framework and the model-selection strategies that we consider in this study.
2.1 Score Variables and Examinee Populations
Let

Equation 1 gives a general expression for the comparison of two continuous distributions (Wilk & Gnanadesikan, 1968) and is in the equating literature known as the equipercentile transformation (González & Wiberg, 2017; Kolen & Brennan, 2014). In Figure 1, the idea of the equipercentile transformation is illustrated. Note that the score variables need to be continuous for the equipercentile transformation to be properly defined. Since most testing programs utilize discrete test scores, certain continuous approximation is almost always required, which we present next.
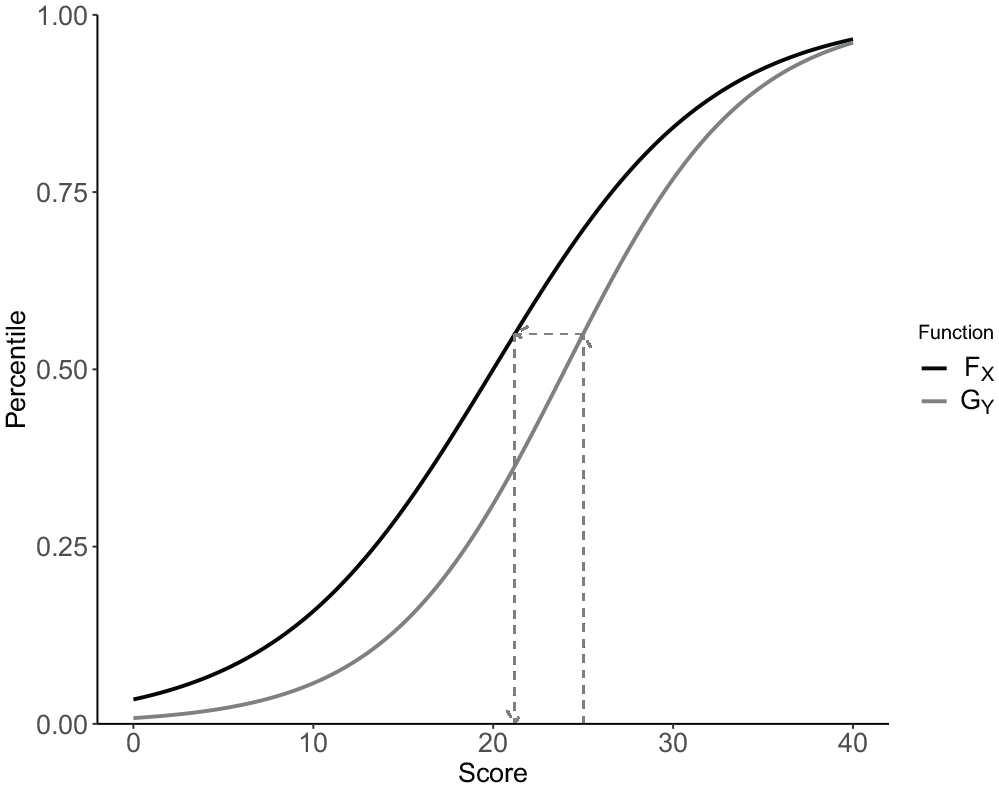
An illustration of the equipercentile transformation for two score distributions
2.2 Test Score Equating Using Kernel Functions
Test score equating can be described as comprising of four steps:
1
(a) Estimation of the score probabilities, (b) Continuization, (c) Equating, and (d) Evaluation of the equating function (González & Wiberg, 2017; von Davier et al., 2004). Modern equating methods that employ a kernel function in the second step are referred to as kernel equating methods (von Davier et al., 2004). Since the first step is commonly combined with presmoothing of the score distributions, which we describe in the next section, we start with Step 2 here. To define the equating function within this framework, we begin by denoting the possible realizations of
where
The bandwidth
Two popular methods for equating in the NEAT design are chained equating (CE) and post-stratification equating (PSE). The CE function is given by
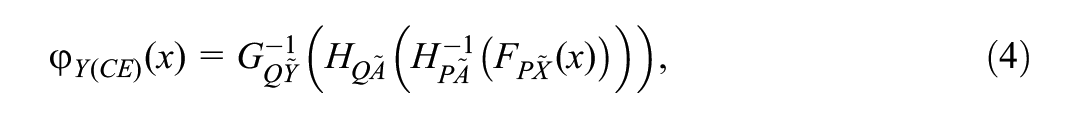
where
The PSE function is given by

where
We conclude this section by pointing out that, with the bandwidth as the only exception, the distributions
3. Presmoothing of Test Score Distributions
In this section, we present two ways of estimating the population test score probabilities, depending on whether an IRT or a non-IRT approach is used. We present the two most common model choices and begin with the non-IRT approach, for which the log-linear model are the most common presmoothing model.
3.1 Log-Linear Models
Let the possible score values of the anchor score


and that
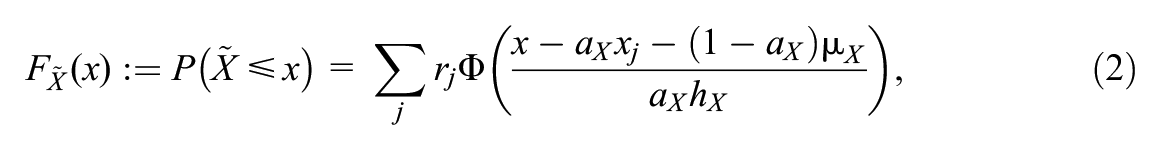
In the NEAT design, the bivariate distributions of
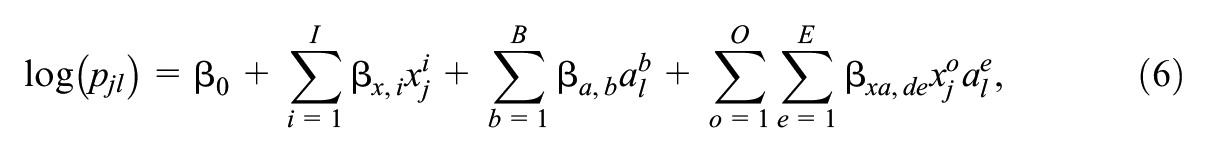
where
As for the univariate case, the bivariate log-linear model possesses a moment-matching property when the parameters are estimated using maximum likelihood (Moses & Holland, 2010a). From (6) it follows that
Log-linear models with
Once we have fitted a log-linear model to


For PSE, we transform

and

where
3.2 IRT Models
Another approach for estimating the score probabilities within the kernel equating framework is by using an IRT model (Andersson & Wiberg, 2017). For this class of models, the underlying assumption is that the probability of answering an item correctly is a function of the latent ability and of item parameters. Let
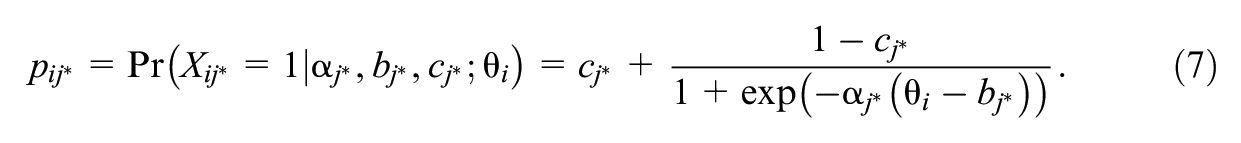
When
As the probability specified in Equation 7 is on item level and not for the sum score, the estimated probabilities need to be cumulated. Therefore, let

denote the sum-score of individual
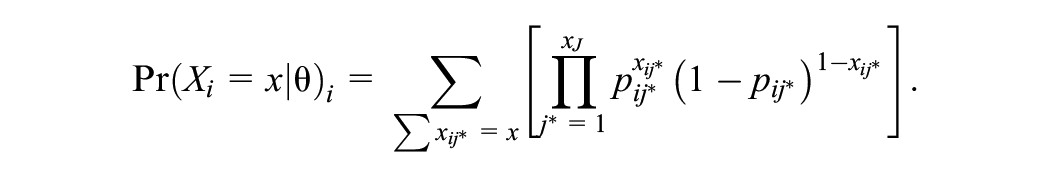
As the compound binomial distribution is computationally intensive (González et al., 2016), an iterative process such as the Lord and Wingersky (1984) algorithm can be used to calculate the probabilities. See Andersson and Wiberg (2017) for explicit approximating formulas to generate the score probabilities for CE and PSE for IRT equating.
4. Goodness-of-Fit Indices
Model fit indices are often classified as belonging to either a significance testing strategy or a parsimony strategy (Liu & Kolen, 2020; Moses & Holland, 2010a). For the former, there have been several statistics suggested which are asymptotically chi-square distributed. One option is the the LRT (Haberman, 1974a, 1974b), which is based on the following test statistic:

where
The indices belonging to the parsimony strategy try to balance model fit with the parameterization of the model. The model selection is made by comparing a number of competing models with different parameterizations with respect to some suitable statistic. Two common choices for this statistic are the AIC and the BIC, which are defined as


where

and for the 2-PL model,

In this study, the same approach as in Liu and Kolen (2020) is taken, where only the likelihood ratio chi-square, AIC, and BIC indices are evaluated. As pointed out in Liu and Kolen (2020), previous studies such as Moses and Holland (2009, 2010a) have shown that these indices perform as well or better than other existing indices. For the significance testing strategy, an adjusted significance level of
Recently, Brown et al. (2015) pointed out that although the 1-PL, 2-PL, and 3-PL models are nested, the LRT is not appropriate when selecting between the 2-PL and 3-PL model. This is due to the fact that the guessing parameter
4.1 Our Implementation
In our implementation, we set up candidate models up to the user-specified polynomial degree for the univariate and cross moments, that is, the
4.2 A Selection Algorithm Targeting the Equating Function
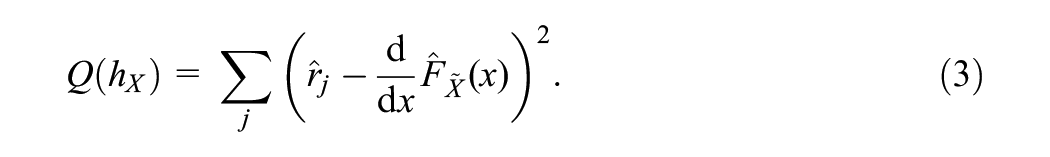
In addition to the AIC, BIC, and LRT, we propose a new model selection algorithm for log-linear presmoothing that directly targets the equating function. The idea is a two-step approach: First, we search for the best-fitting models to the bivariate data

for all

where ||·|| denotes the Euclidean norm. We summarize the procedure in Algorithm 1
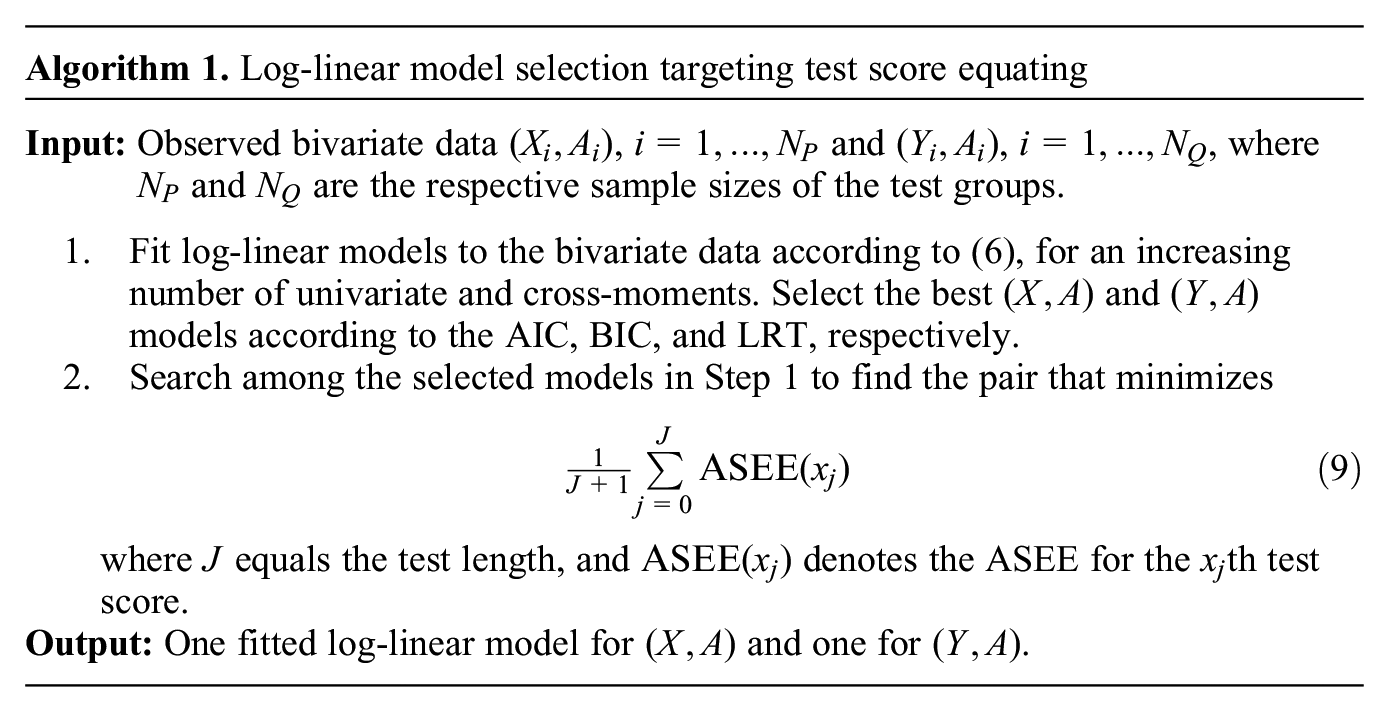
It is possible to give different importance to score points. In that case,
Note that Algorithm 1 can be seen as both a way to select the log-linear presmoothing models and as a way to evaluate the AIC, BIC, and LRT criteria when the goal is to equate test forms. In our simulation study, which we present in Section 6, we simulate test data, select the presmoothing model according to the AIC, BIC, and LRT, respectively, and count how many times Algorithm 1 selects each criterion. In that way, we can use Algorithm 1 to evaluate which of the AIC, BIC, and LRT most often select models that minimize the ASEE. Since the output of Algorithm 1 is a pair of presmoothing models, we are in turn able to evaluate Algorithm 1 as a model-selection tool. Note also that this algorithm does not make sense to use in an IRT setting since we do not wish to end up with for example a Rasch model for the
5. Empirical Study
In this section, we explore the influence of the presmoothing model and model selection criteria on the equated scores, using real data from two forms of the Swedish Scholastic Aptitude Test (SweSAT). The test comprises both a verbal and a quantitative section, each of them equated separately. Each section consists of 80 binary-scored multiple-choice items. In addition, a 40-item anchor test is administered. For this study, we are considering only the quantitative section, and utilize a sample of 7,322 examinees from each of two groups from a test administration within the last 10 years. The new test form is denoted by X and the previous form by Y.
Detailed information about the quantitative test form and the associated anchor test can be found in Table 1. For instance, a clear difference between the mean scores of the new and old test forms and their respective skewness can be clearly observed. The correlation between the new test form (X) and the anchor test scores stands at .808, while that between the old test form (Y) and the anchor test scores is slightly lower at .806.
Mean, SD, Skewness, and Number of Examinees (N) in the Empirical Study and for the Created Test Forms Used in the Simulation Study
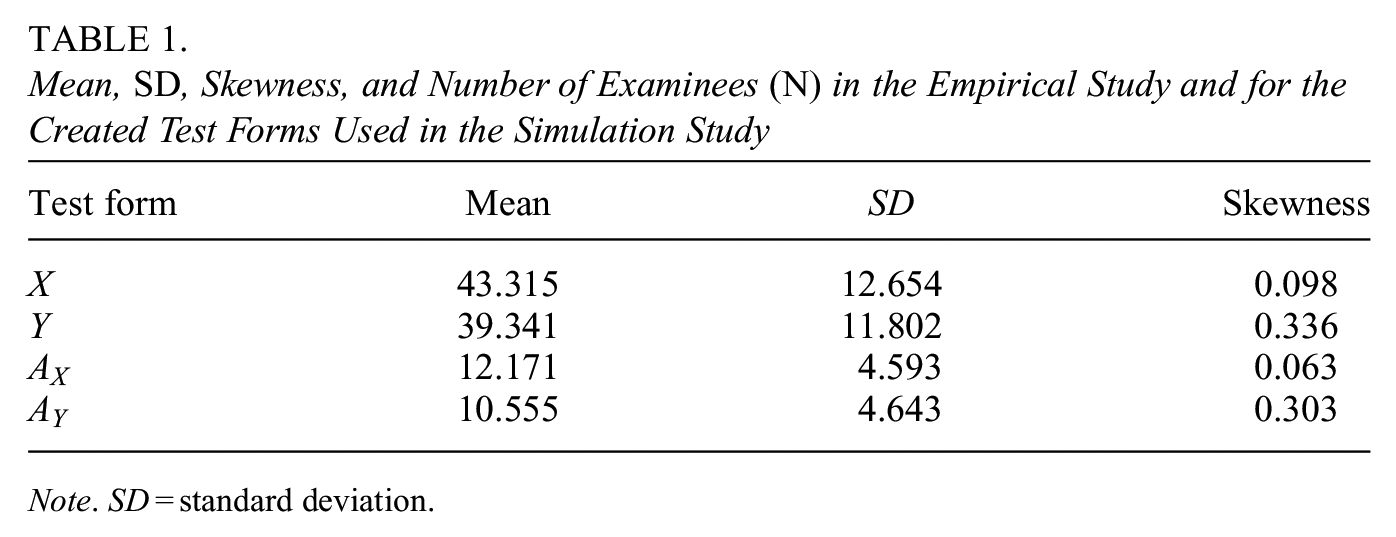
Note. SD = standard deviation.
Figure 3 displays the score distributions for both X and Y, in addition to the anchor test scores, denoted as
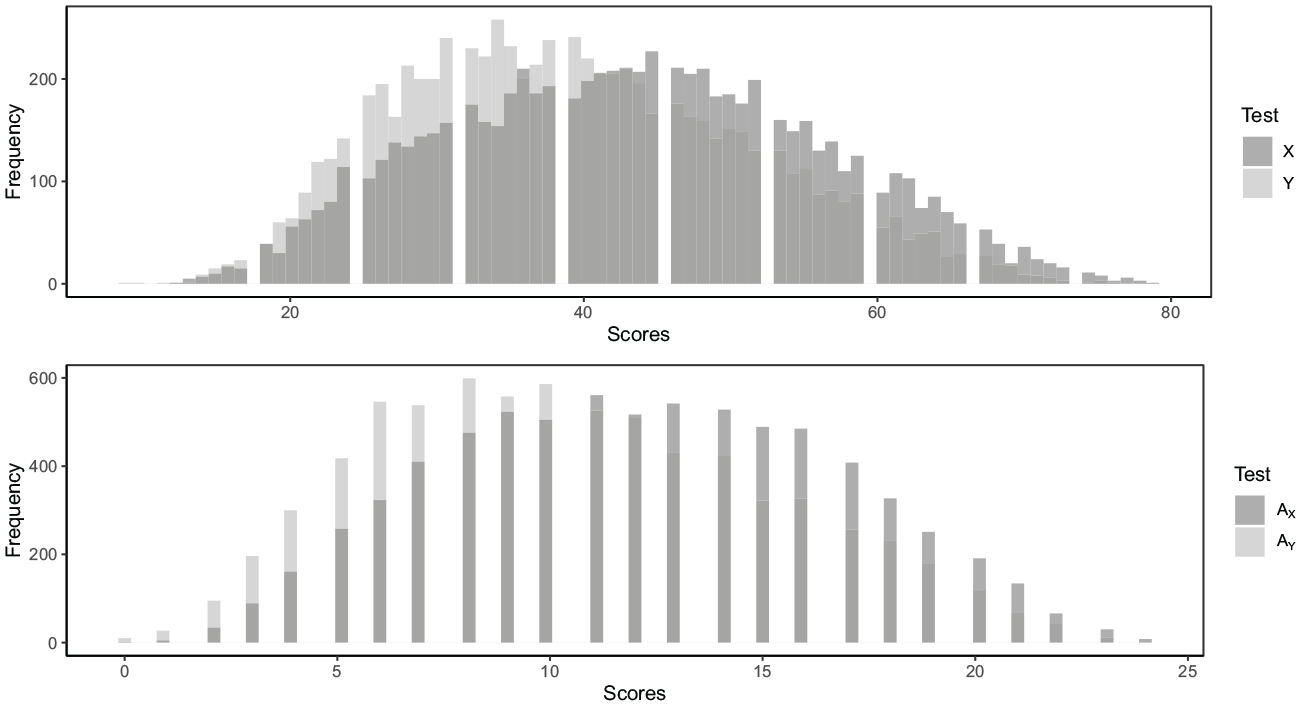
The score distributions of the X and Y scores (upper panel) and the anchor scores (lower panel), where X represents the new test form and Y the old test form.
At the time of these test administrations, a SweSAT result retained its validity for 5 years. Examinees were permitted unlimited attempts, with only the highest test result being considered when applying to a university program. In practice, the SweSAT is equated using non-IRT methods under the NEAT design (Lyrén & Hambleton 2011). The available data consists solely of the total score, as opposed to individual item scores. Therefore, we will employ log-linear presmoothing and equate the test forms using the smoothed score distributions for both CE and PSE.
5.1 Results of Empirical Study
Table 2 shows the presmoothing models chosen by each model-selection criterion. Only the highest power moment is displayed, meaning for example that
The Selected Log-Linear Models for Each Model Fit Index
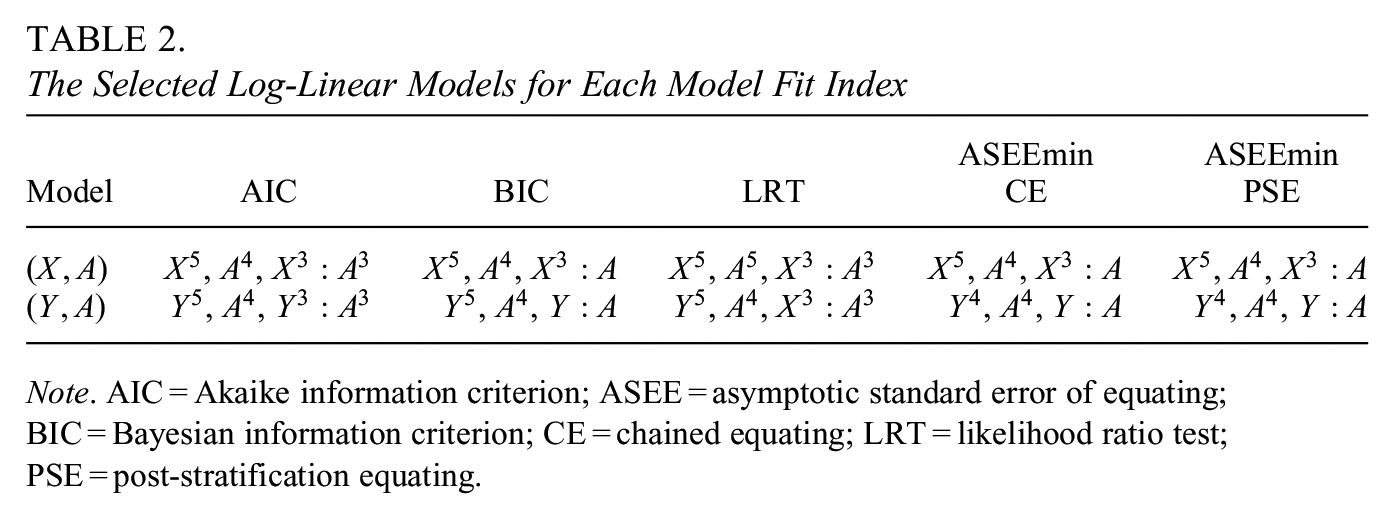
Note. AIC = Akaike information criterion; ASEE = asymptotic standard error of equating; BIC = Bayesian information criterion; CE = chained equating; LRT = likelihood ratio test; PSE = post-stratification equating.
We see that the BIC, ASEEmin CE, and ASEEmin PSE select the same
Figure 4 demonstrates the estimated equated scores (with the raw score deducted) and the corresponding ASEE values by the CE (left column) and PSE (right column) estimator. Due to the selection of identical pairs of presmoothing models, the BIC and ASEEmin criteria produce identical results. Since the AIC and LRT criteria selected very similar models, their results are also close to identical. In Figure 4, we therefore see two unique curve patterns in each panel: the solid line, derived from models chosen by the AIC, and the dot-dashed line, which is the result of presmoothing models chosen via the BIC and ASEEmin.
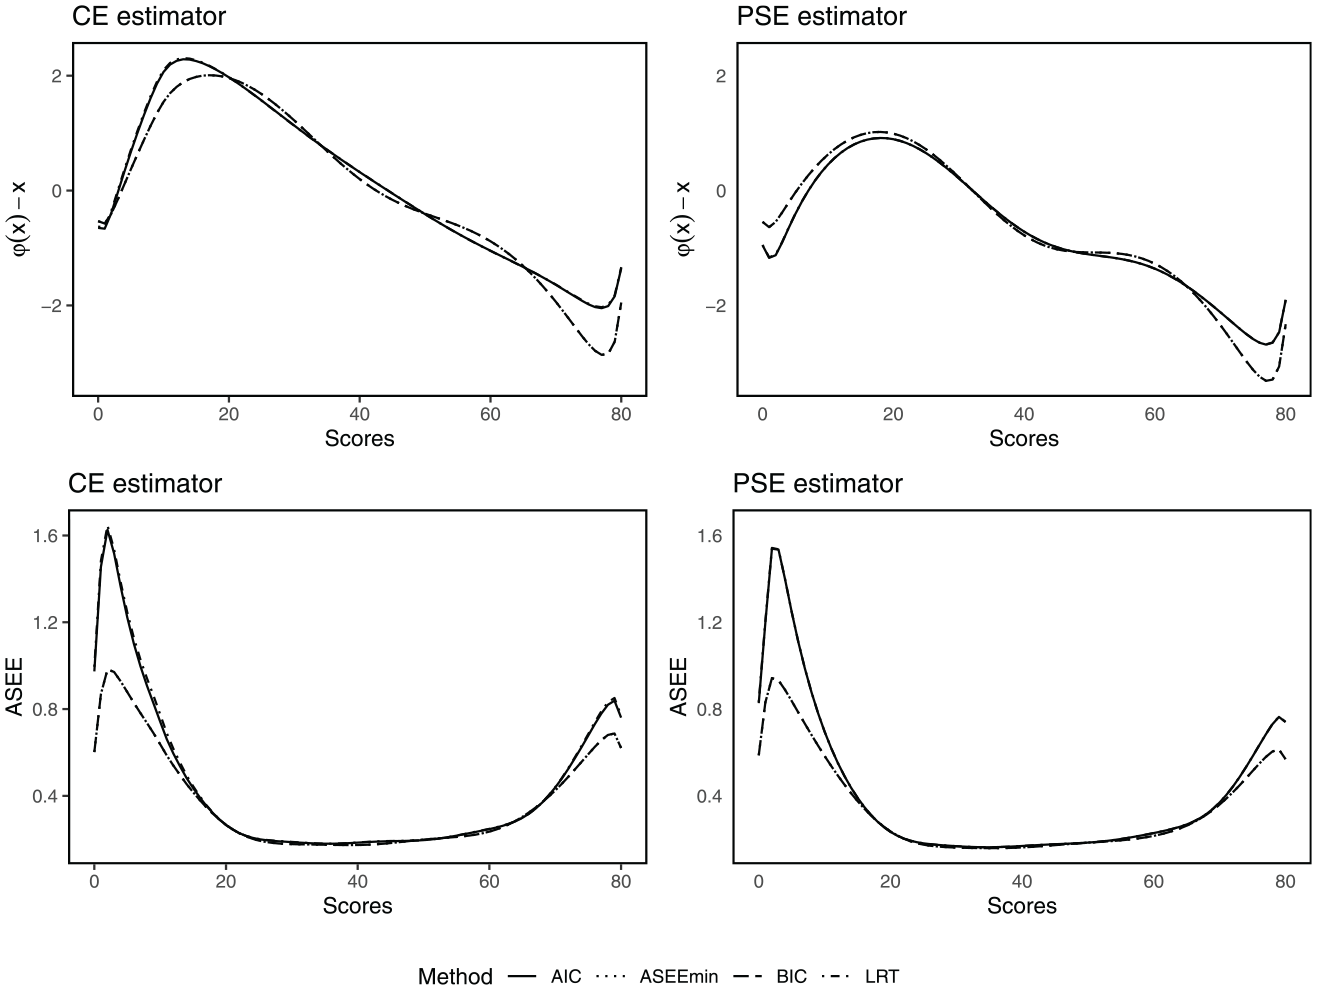
The difference between the equated scores and the raw scores (first row) and the ASEEs (second row), for each respective equating estimator using the CE and PSE estimator, respectively.
These curves reveal that the equating estimators, although based on presmoothing models selected using different selection criteria, share a high degree of similarity across a substantial portion of the score scale. At the extremes of the score scale, however, differences emerge. These differences at the tails exceed the so-called “difference that matters” (DTM; Dorans & Feigenbaum, 1994), defined as a difference of half a score unit. In practical terms, this indicates that these methods will produce different equated scores at the score range where many critical decisions are being made. Therefore, the equated scores depend significantly on the presmoothing model-selection criterion. Lastly, we note that the BIC and ASEEmin criteria produce substantially smaller ASEE values for the lowest and highest score values.
From the empirical analysis, we conclude that the presmoothing model selection has an impact on the equated scores, and the magnitude of this influence is dependent on the choice of equating estimator. We study this phenomenon in greater depth in the following section, which includes a comprehensive simulation study.
6. Simulation Study
We evaluate the performance of all of the considered model-selection criteria and their influence on the estimation of the equating function through an extensive simulation study. We consider two setups that will be treated in separate subsections. The first setup generates data from an underlying log-linear model and the second setup from an underlying IRT model. In this way, we can evaluate the performance of the model selection criteria both when the score distributions are smoothed using log-linear models, and when the test is calibrated with an IRT model. For both setups, we vary the underlying, true data-generating process, together with other key quantities such as the sample size and the number of items. The results are based on 100 iterations using sample sizes of 3,000 and 6,000, and with test lengths of 40 and 80. When the test length is 40, we set the anchor length to 13, and when the test length is 80, we set it to 25. Since the results for a sample size of 3,000 and 6,000 were very similar, we have placed the results based on the larger sample size in the Supplemental Appendix (available in the online version of this article). For the same reason, we did the same for some of the results based on
6.1 Setup A: Data Generated by Log-Linear Models
In the first setup, we follow the design of Wallin et al. (2021). We, therefore, start by generating the true score probabilities
In the next step, we sample test score frequencies
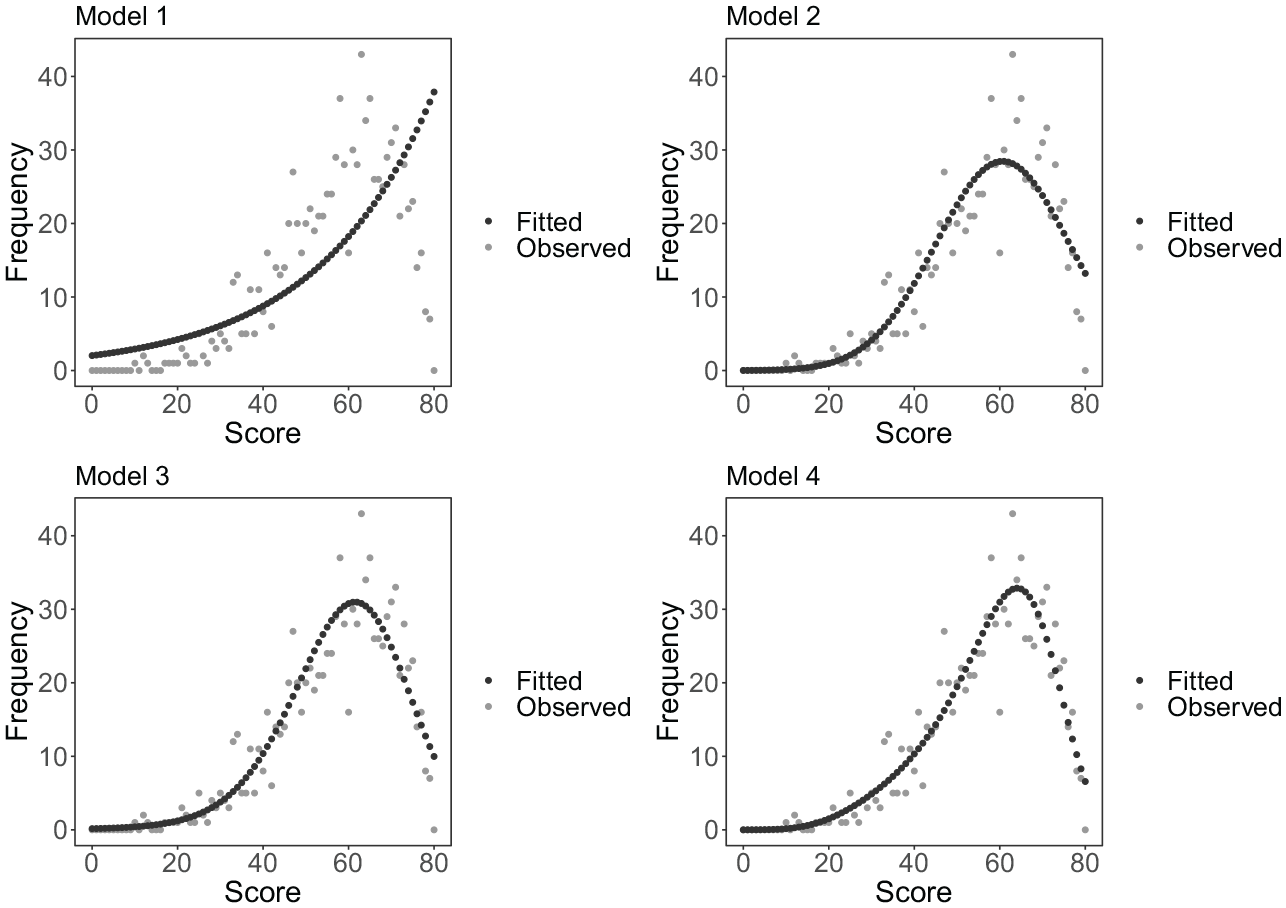
In Figure 5 we illustrate the true score distributions
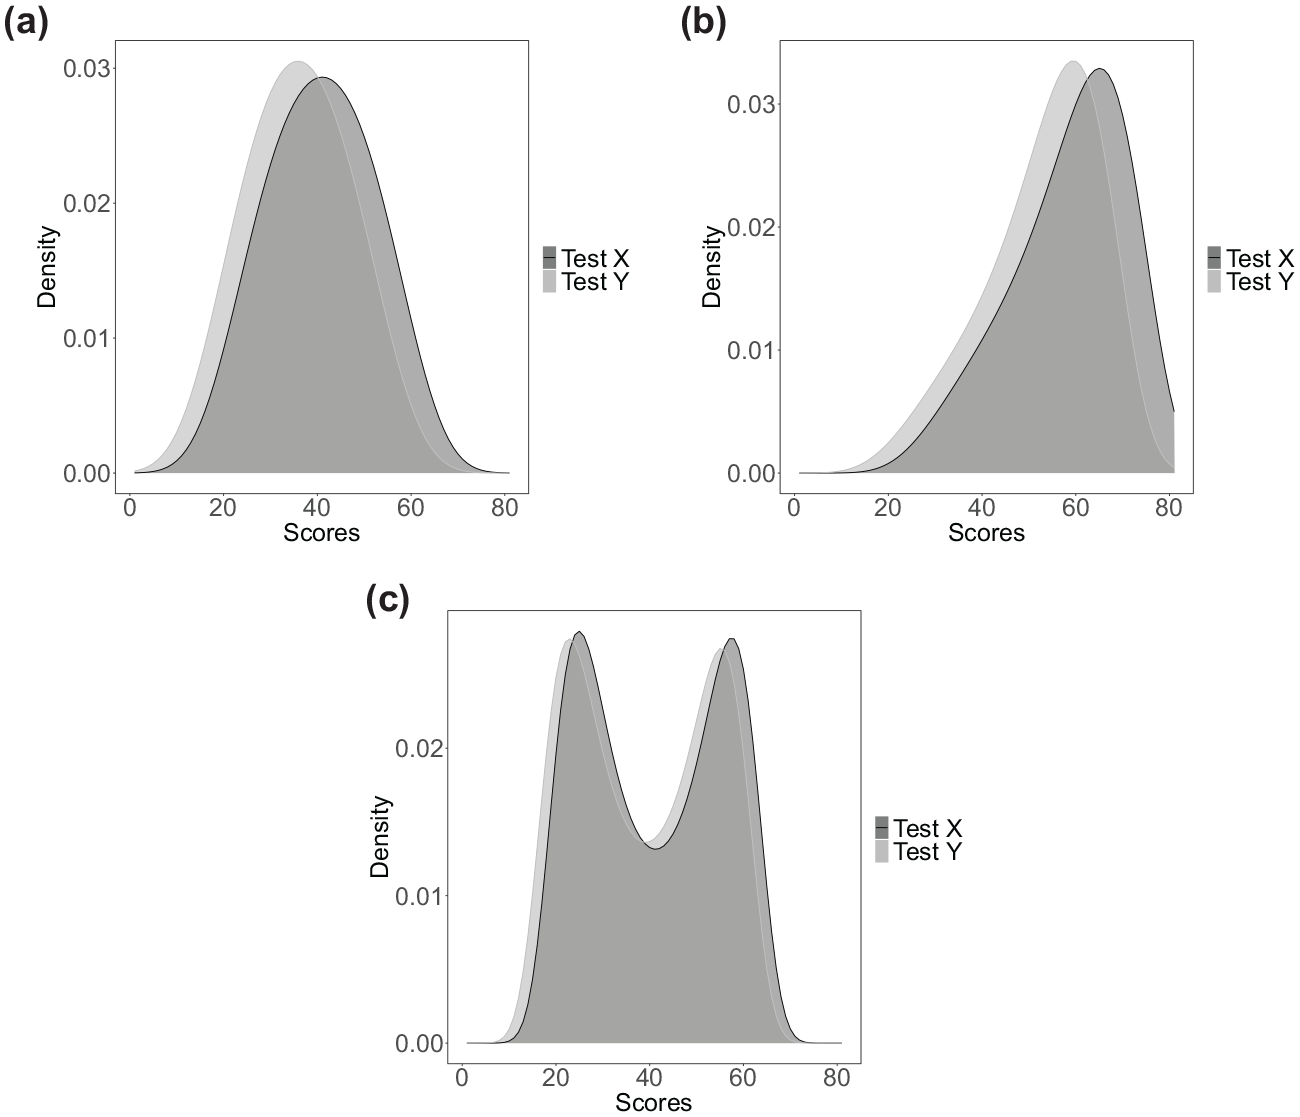
True total-score distributions for three distributional scenarios: (a) Symmetric: true test score probabilities generated from symmetric distributions, (b) Skewed: true test score probabilities generated from skewed distributions, and (c) Bimodal: true test score probabilities generated from bimodal distributions.
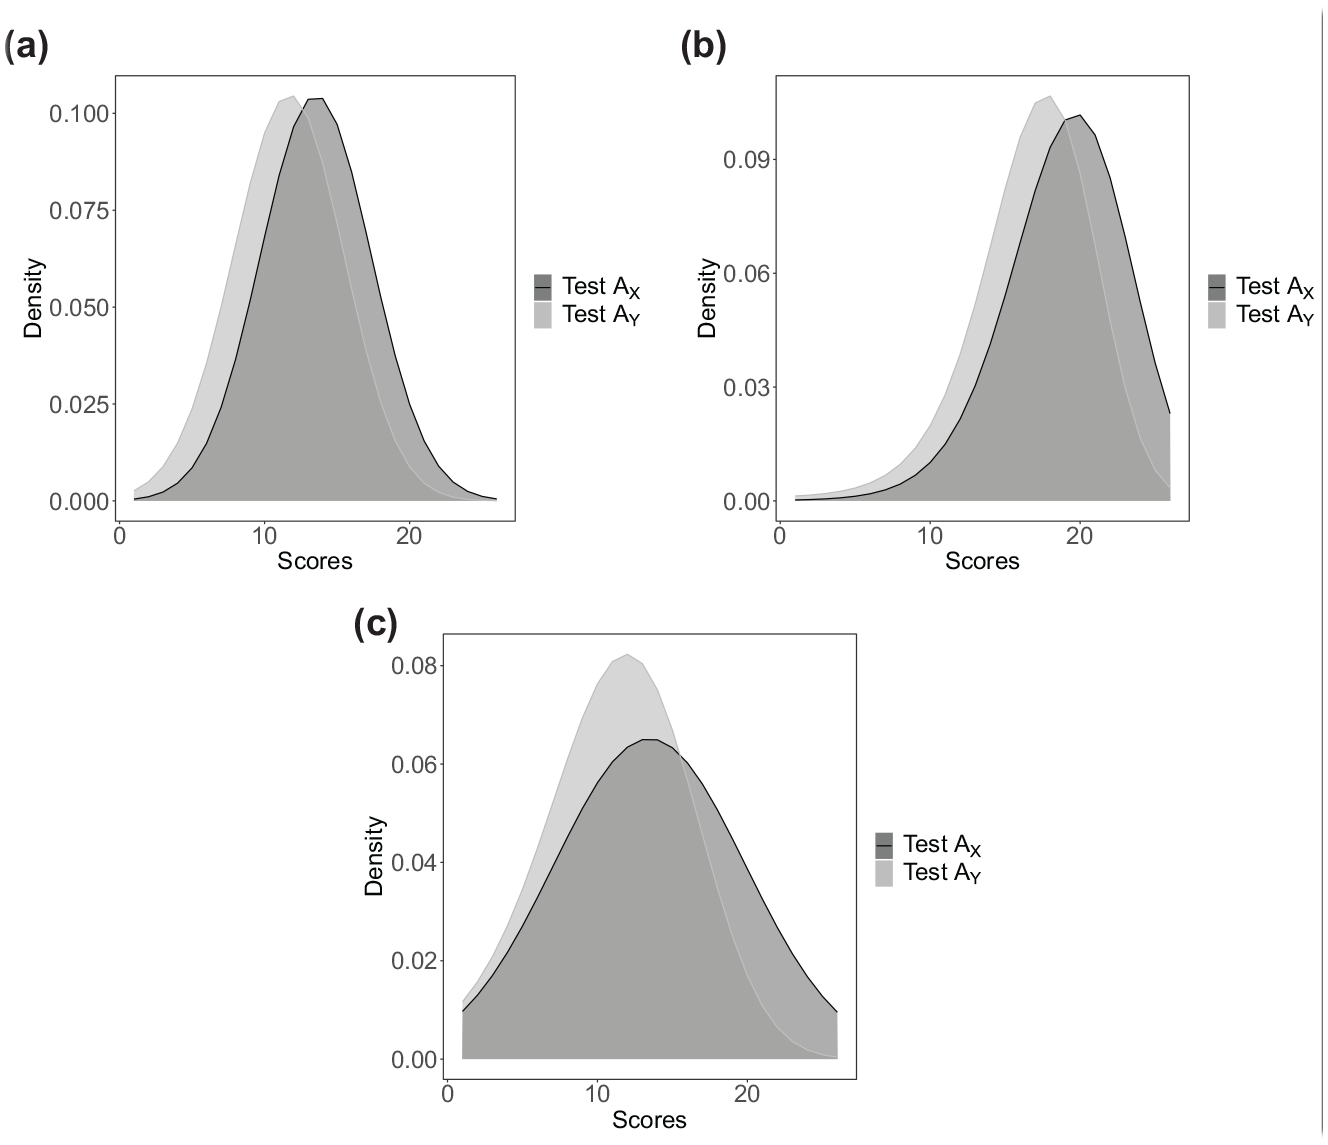
True distributions on anchor-set scores for three distributional scenarios: (a) Symmetric: the anchor score probabilities generated from symmetric distributions, (b) Skewed: the anchor score probabilities generated from skewed distributions, and (c) Bimodal: the anchor score probabilities generated from bimodal distributions.
6.2 Set-Up B: Data Generated by IRT Models
In Set-Up B, the data is generated by an IRT model, where we let the true model equal the Rasch, 2-PL, and 3-PL models, respectively. The data generation and equating estimation procedure follows the kernel-equating IRT method proposed by Andersson and Wiberg (2017). This equating method generates test score probabilities from IRT models using the Lord-Wingersky algorithm (Lord & Wingersky, 1984) and uses these probabilities in the continuization step of the kernel equating framework. First, we generate item parameters for the test forms. These parameters include difficulty parameters, discrimination parameters, and guessing parameters, depending on which model defines the true model. The difficulty parameters are generated from a
For each individual in the
Since the aim of this article is to inform practitioners on model selection for smoothing of test score distributions, and since IRT equating with kernel functions still lacks full implementation in R, we employ the traditional percentile-rank with the PSE method in this set-up. We note that this is a special case of kernel equating, using a uniform kernel with a fixed bandwidth of 0.33 (von Davier et al., 2004). This method is available in several R packages for all IRT models that we consider in thisarticle. For this study, we use the equateIRT package (Battauz, 2015).
6.3 Evaluation Measures
The equating estimators are evaluated in terms of bias, simulation standard errors (SE), and the ASEE based on the asymptotic distribution of the equating function. Let

then
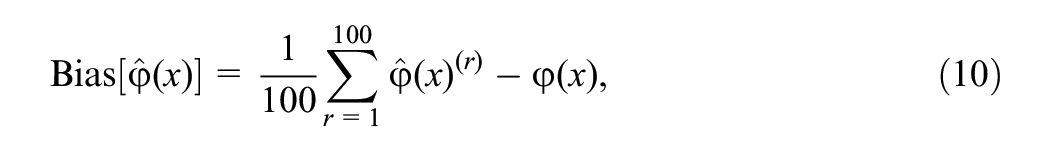
and
6.4 Results: Set-Up A
Figure 7 presents the percentage of accurately selected models (
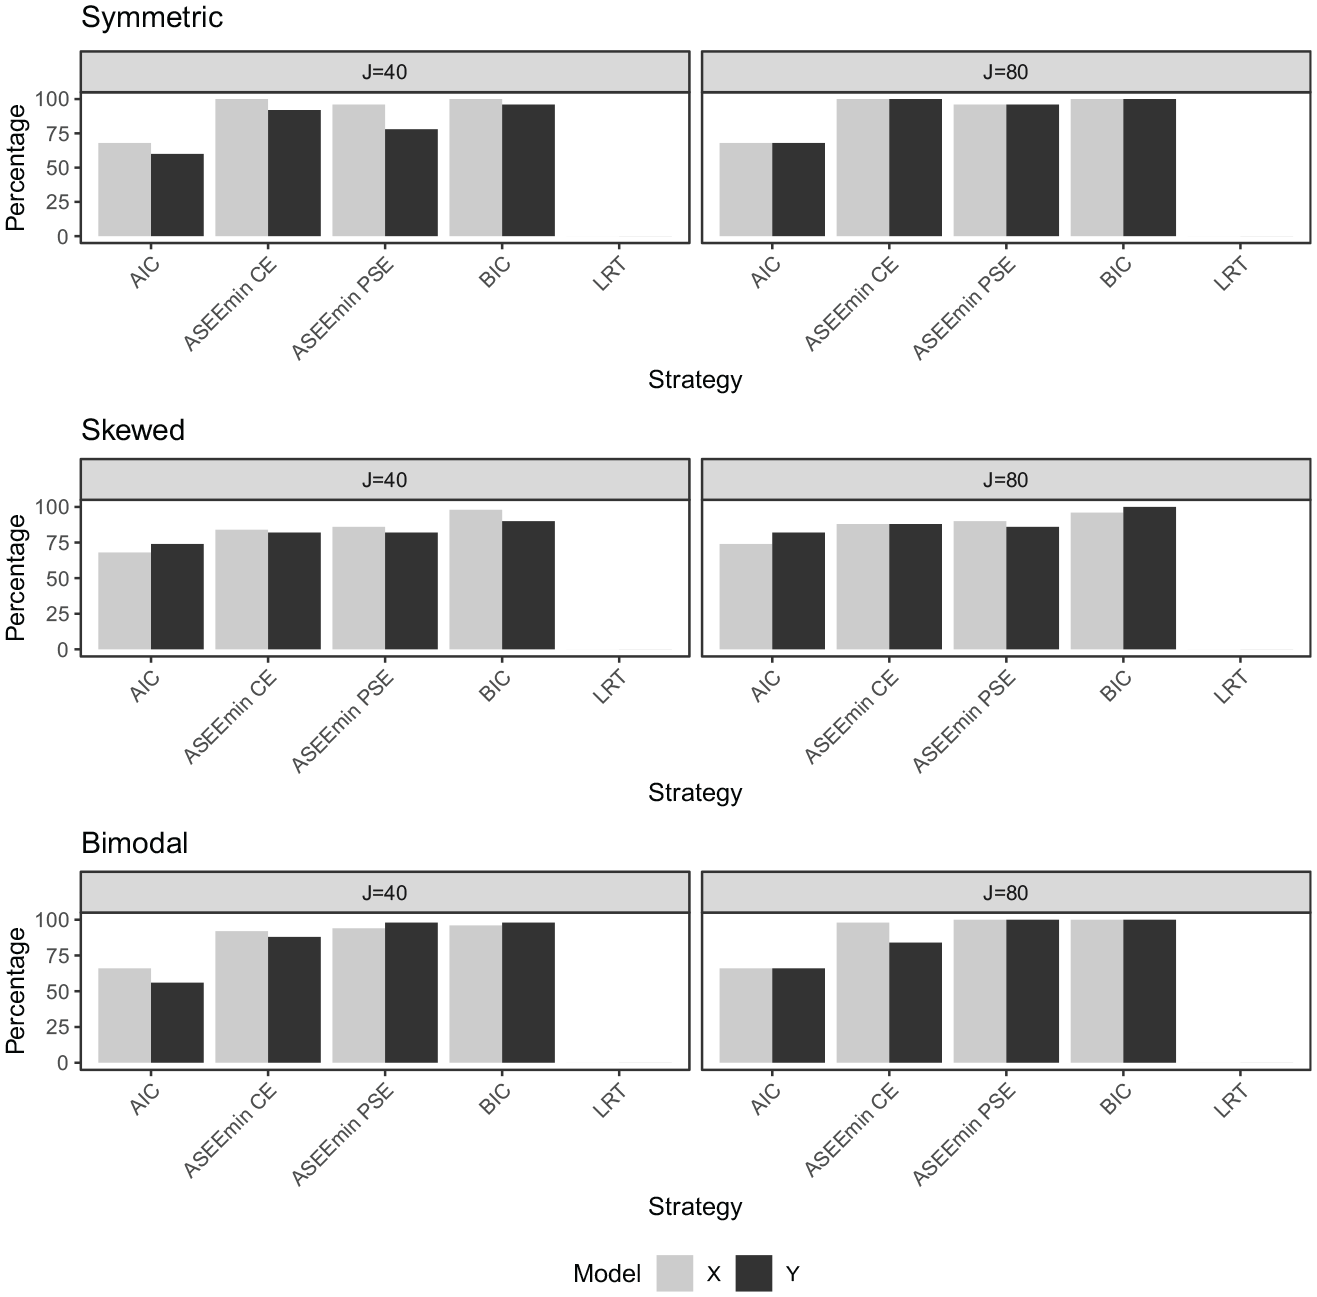
The percentage of correctly selected models (
In Figures 8 to 10, the percentages of times that the AIC, BIC, and LRT, respectively, were chosen by the ASEEmin criteria are presented. In the symmetric data setting for the
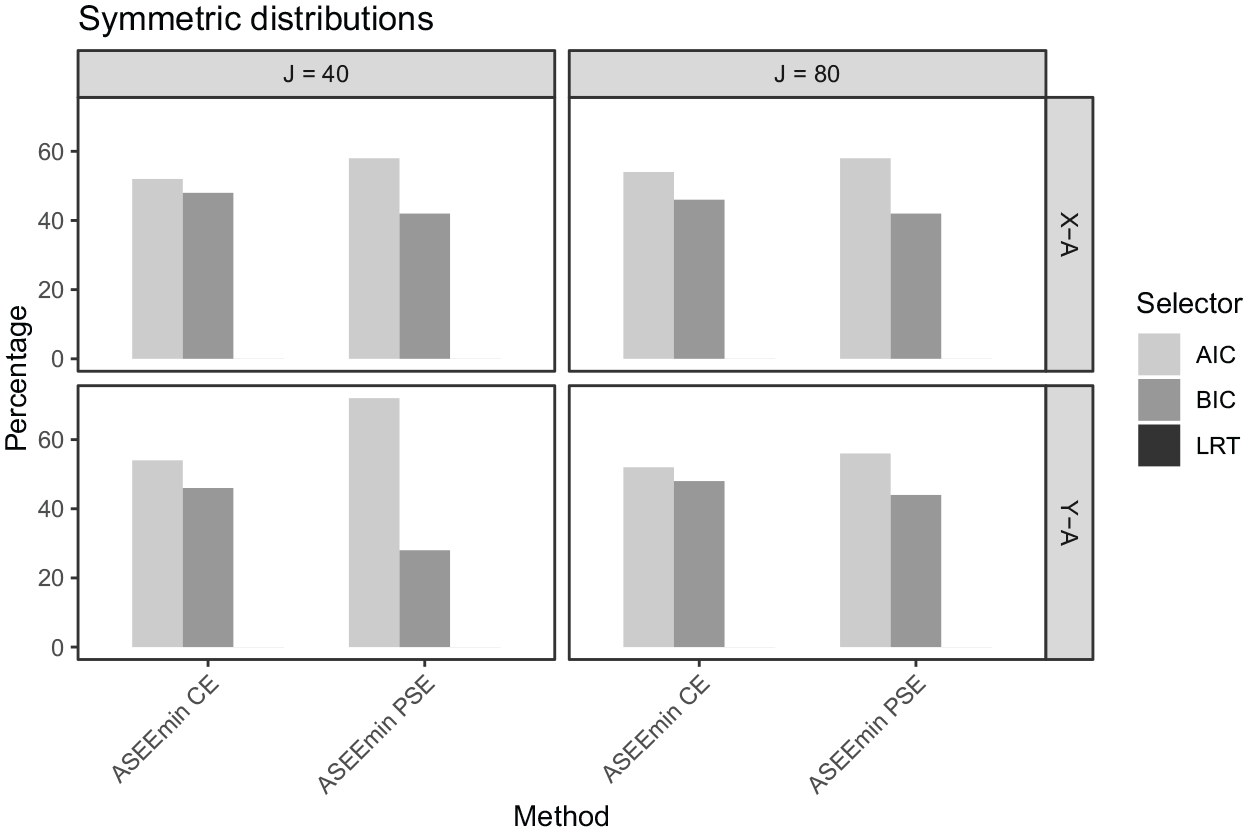
The percentage of times each selector was used in the proposed methods (X–A model, Y–A model) under the symmetric data setting, for
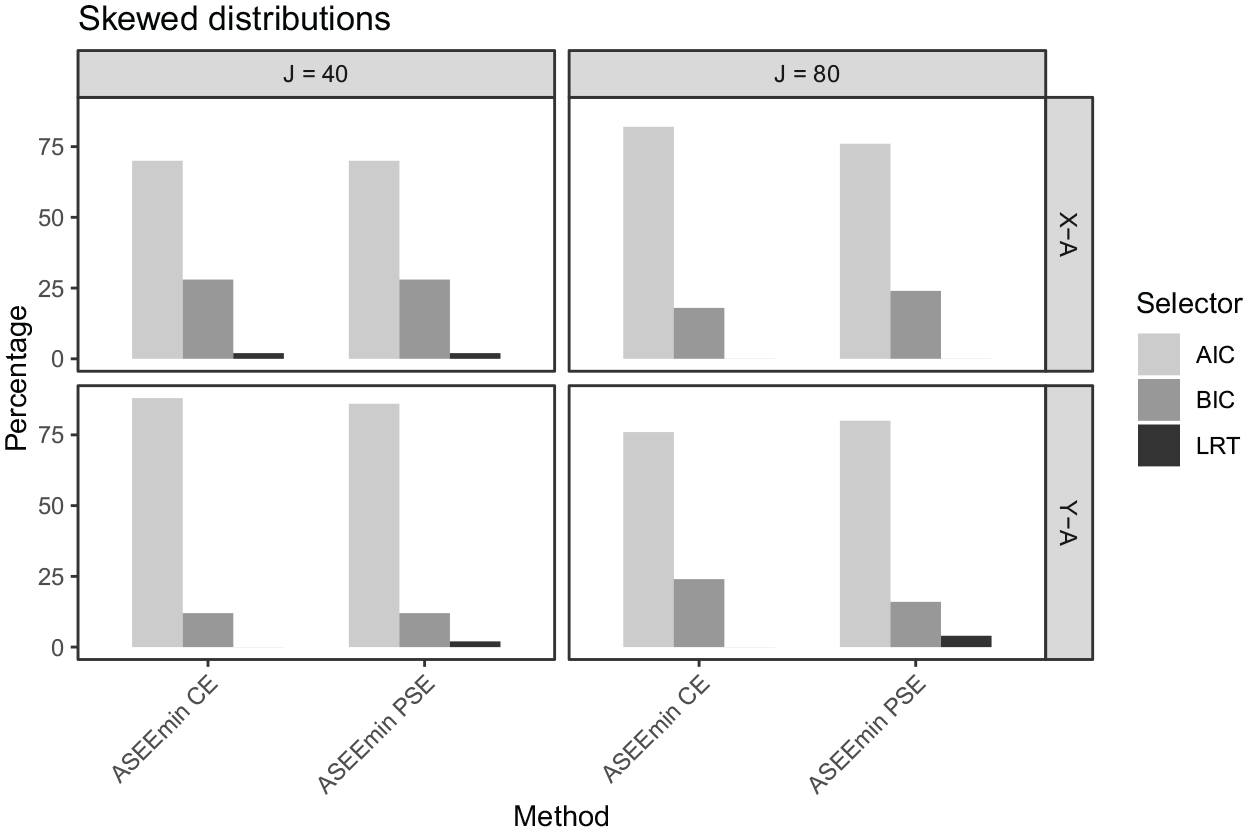
The percentage of times each selector was used in the proposed methods (X–A model, Y–A model) under the skewed data setting, for
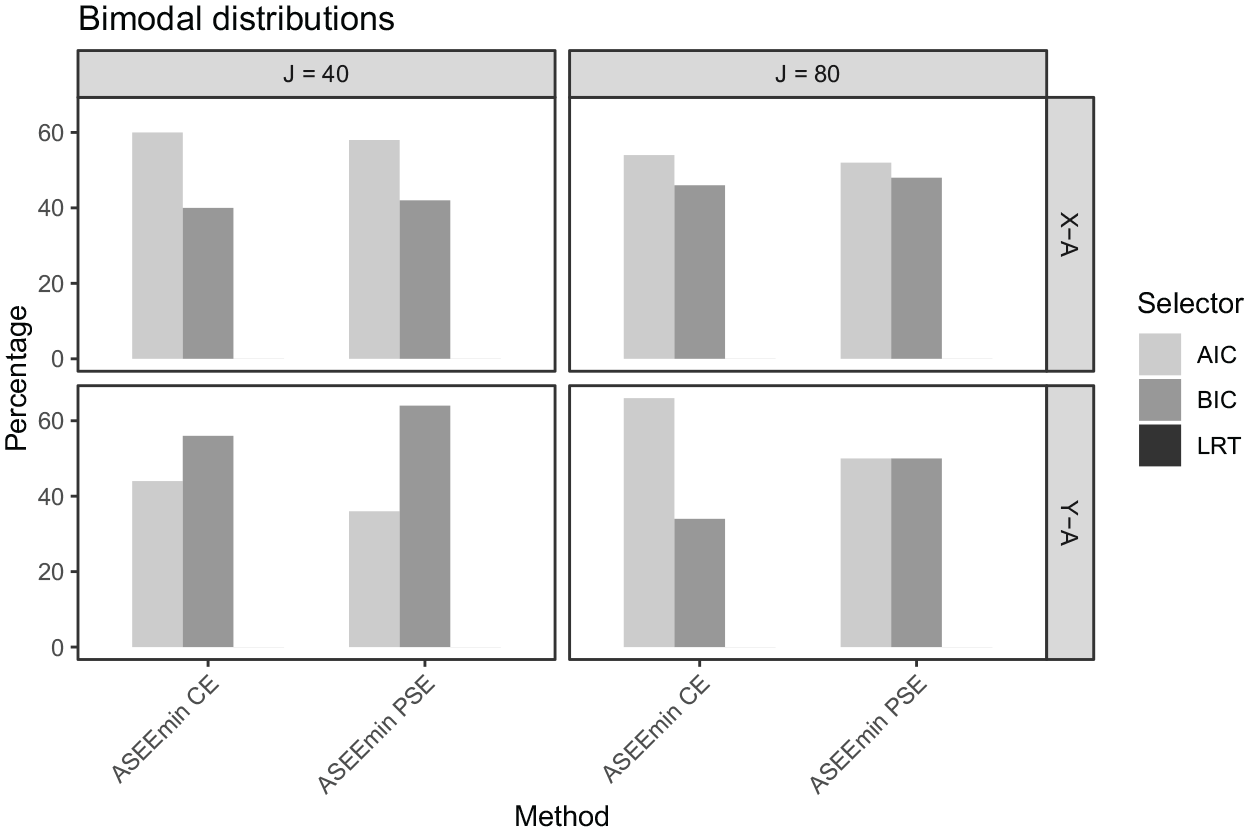
The percentage of times each selector was used in the proposed methods (
In Figure 11, the bias, SE, and ASEE are displayed under the symmetrical distribution setting considering both the CE estimator (left panel) and the PSE estimator (right panel). As was seen in the empirical analysis, the estimators perform similarly along a majority of the score scale and exhibit differences in the tails. In the upper range, the biases are the largest. The BIC and ASEEmin criteria show close to the identical performance, especially for the CE estimator, since they selected very similar presmoothing models. Note that the AIC and BIC often select the same model, and when different, they select very similar models. The ASEEmin selects the AIC slightly more often for the symmetric design (see Figure 8), but the performance of the resulting equating estimator is very similar to both the AIC and the BIC-selected estimators. This is indeed reflected in Figure 11. Also, note that the BIC has an almost perfect model selection performance in all of the distributional scenarios, so whenever the ASEEmin selects the BIC, which it does 40% to 50% of the time, it typically selects the true model. It will therefore be reflected in the results. Interestingly, the LRT has smaller bias than the AIC for the top scores, even though it consistently failed to select the true model. Instead, it seems like the slightly larger presmoothing models are not a disadvantage in terms of equating error. On the other hand, the LRT does produce the largest SE and ASEE values, thus aligning well with the bias-variance tradeoff for model complexity. We lastly notice that there is no clear winner between the CE and PSE estimators, as they both show similar performance.
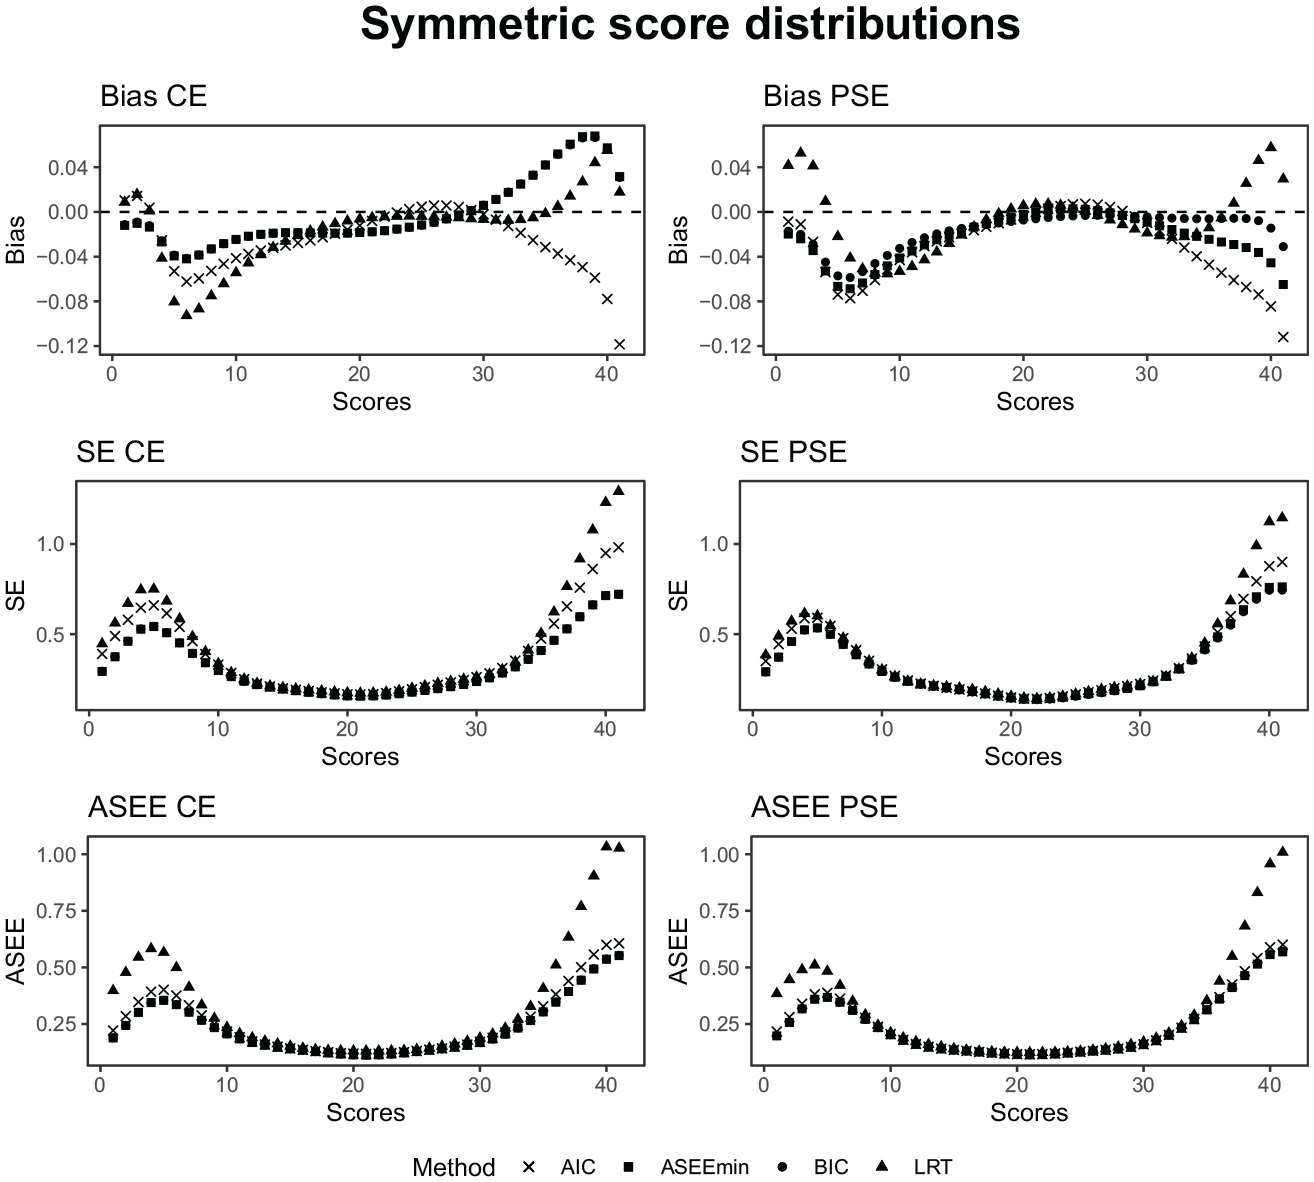
The bias, SE, and ASEE of each equating estimator for a test length of 40, a sample size of 3,000, and symmetric score probability distributions.
As seen in Figures 12 and 13, the relative performance of the model-selection criteria remains similar for the skewed and bimodal data settings, where the sparse data at certain intervals from the respective distributions are reflected in increased equating error and uncertainty. It is noteworthy that the SE and ASEE for the equatings based on LRT-selected modes are particularly high in the tails of the score distributions for the skewed and bimodal settings.
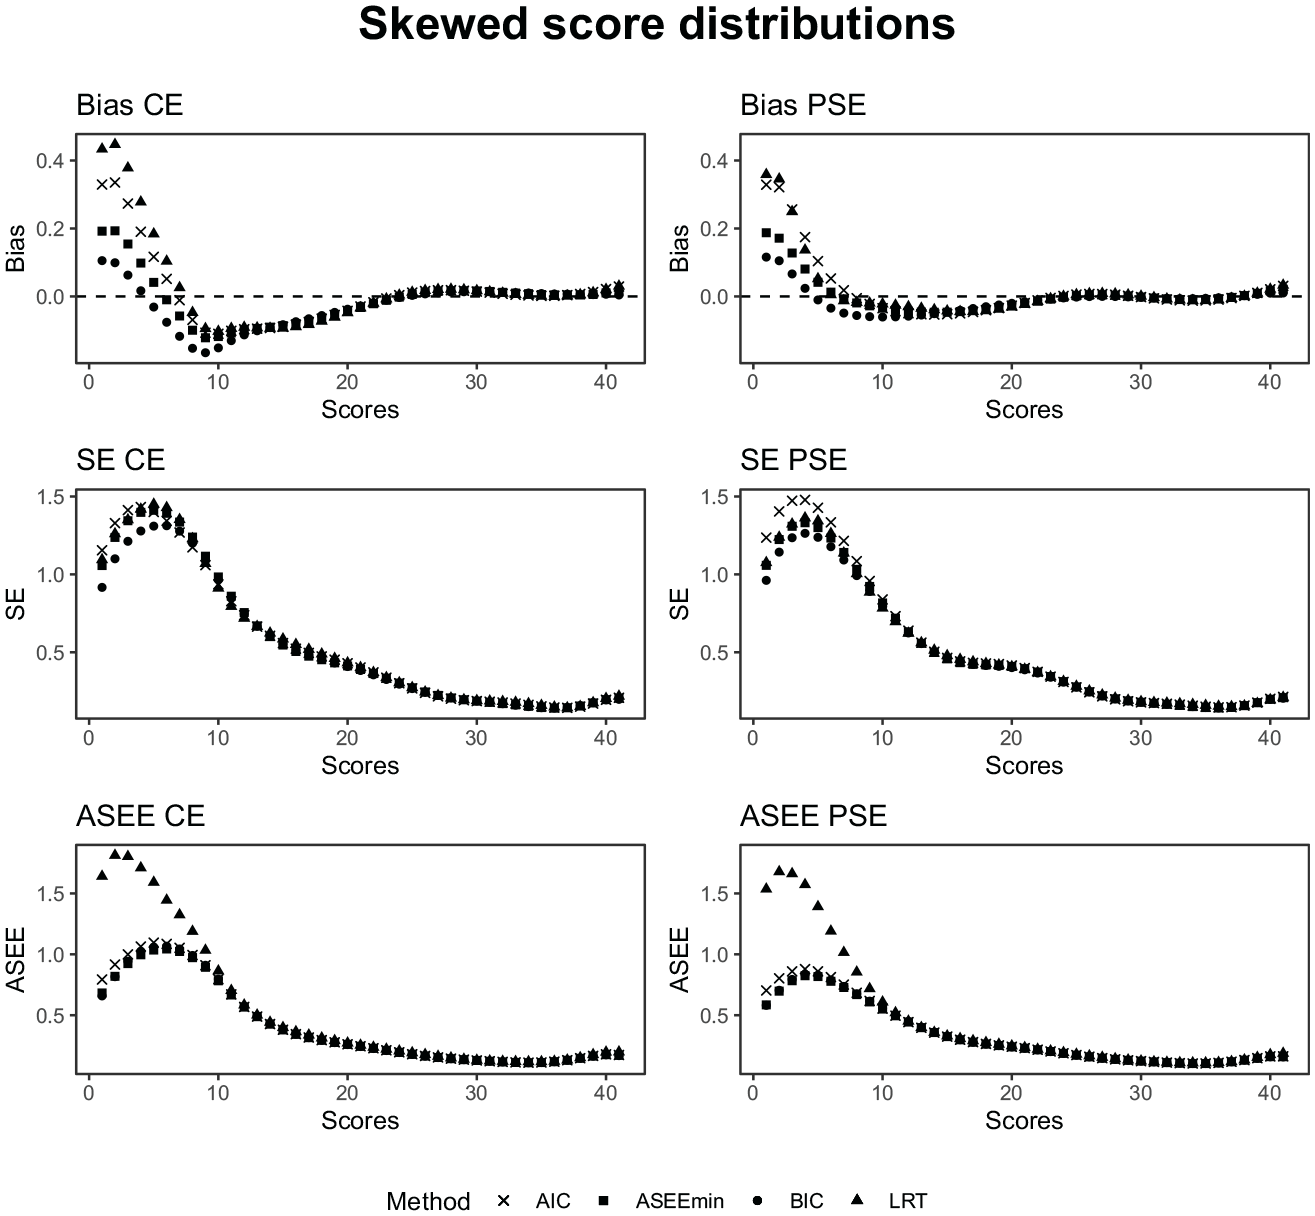
The bias, SE, and ASEE of each equating estimator for a test length of 40, a sample size of 3,000, and skewed score probability distributions.
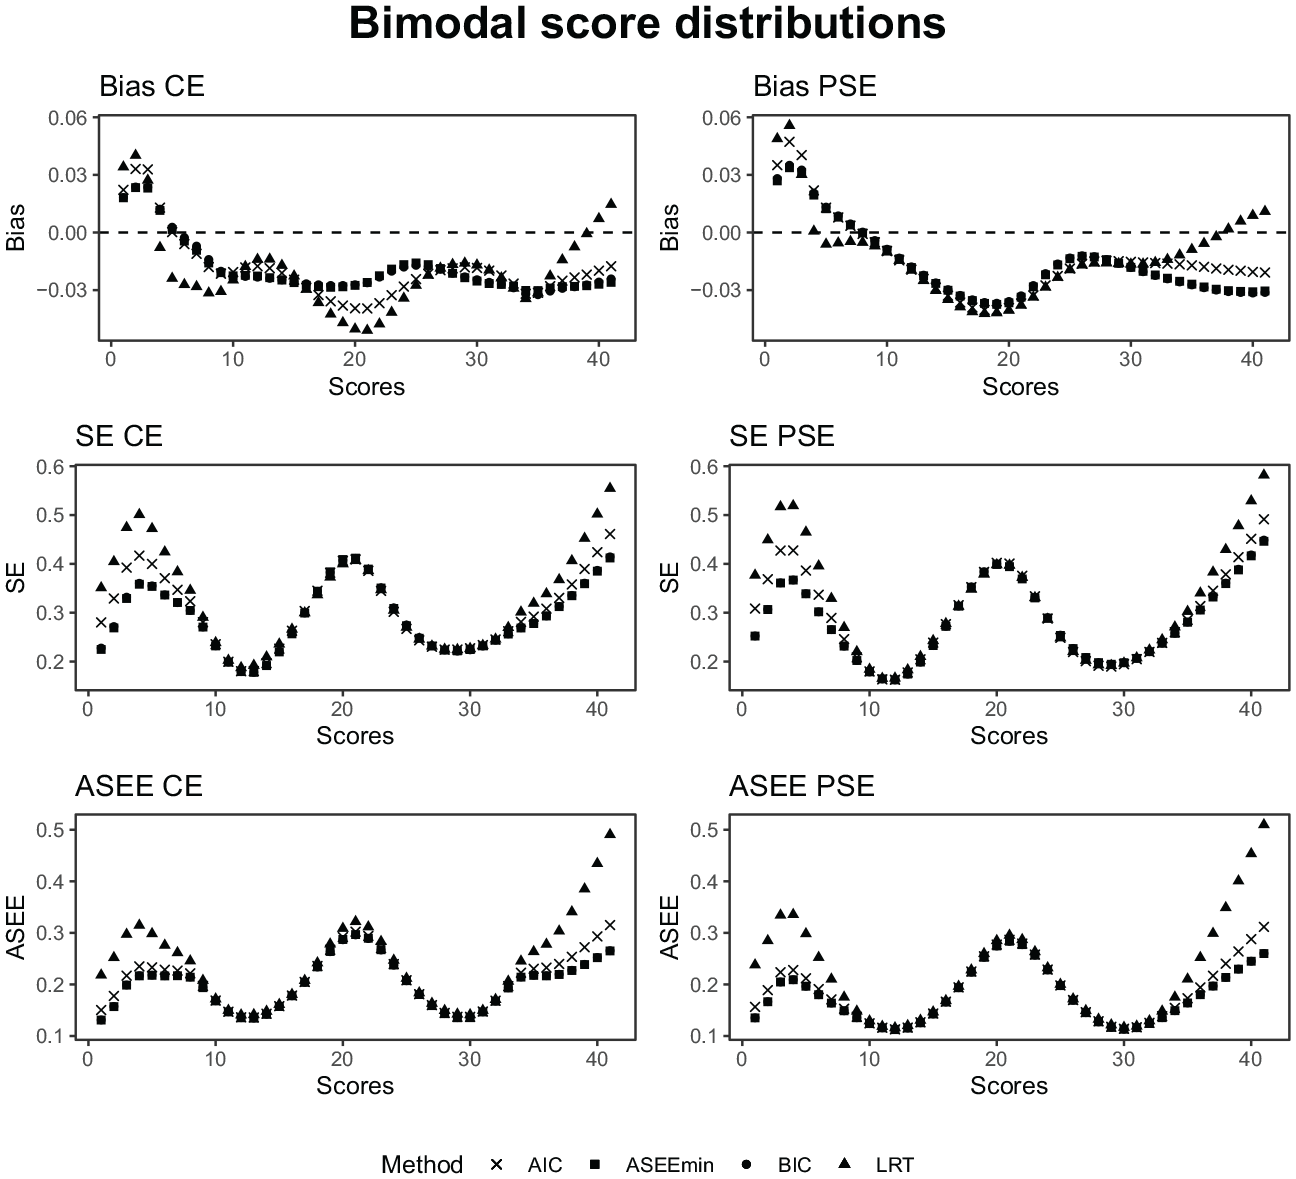
The bias, SE, and ASEE of each equating estimator for a test length of 40, a sample size of 3,000, and bimodal score probability distributions.
6.5 Results: Set-Up B
In Figure 14, the percentage of correctly selected models in the IRT setting is displayed. Under the 1-PL data setting, the AIC and LRT criteria showed a distinct advantage in model selection, achieving 100% accuracy across all tested sample sizes and test lengths. In contrast, the BIC strategy demonstrated variable performance, with the percentage of correctly selected X–A and Y–A models fluctuating around 50% to 60%.
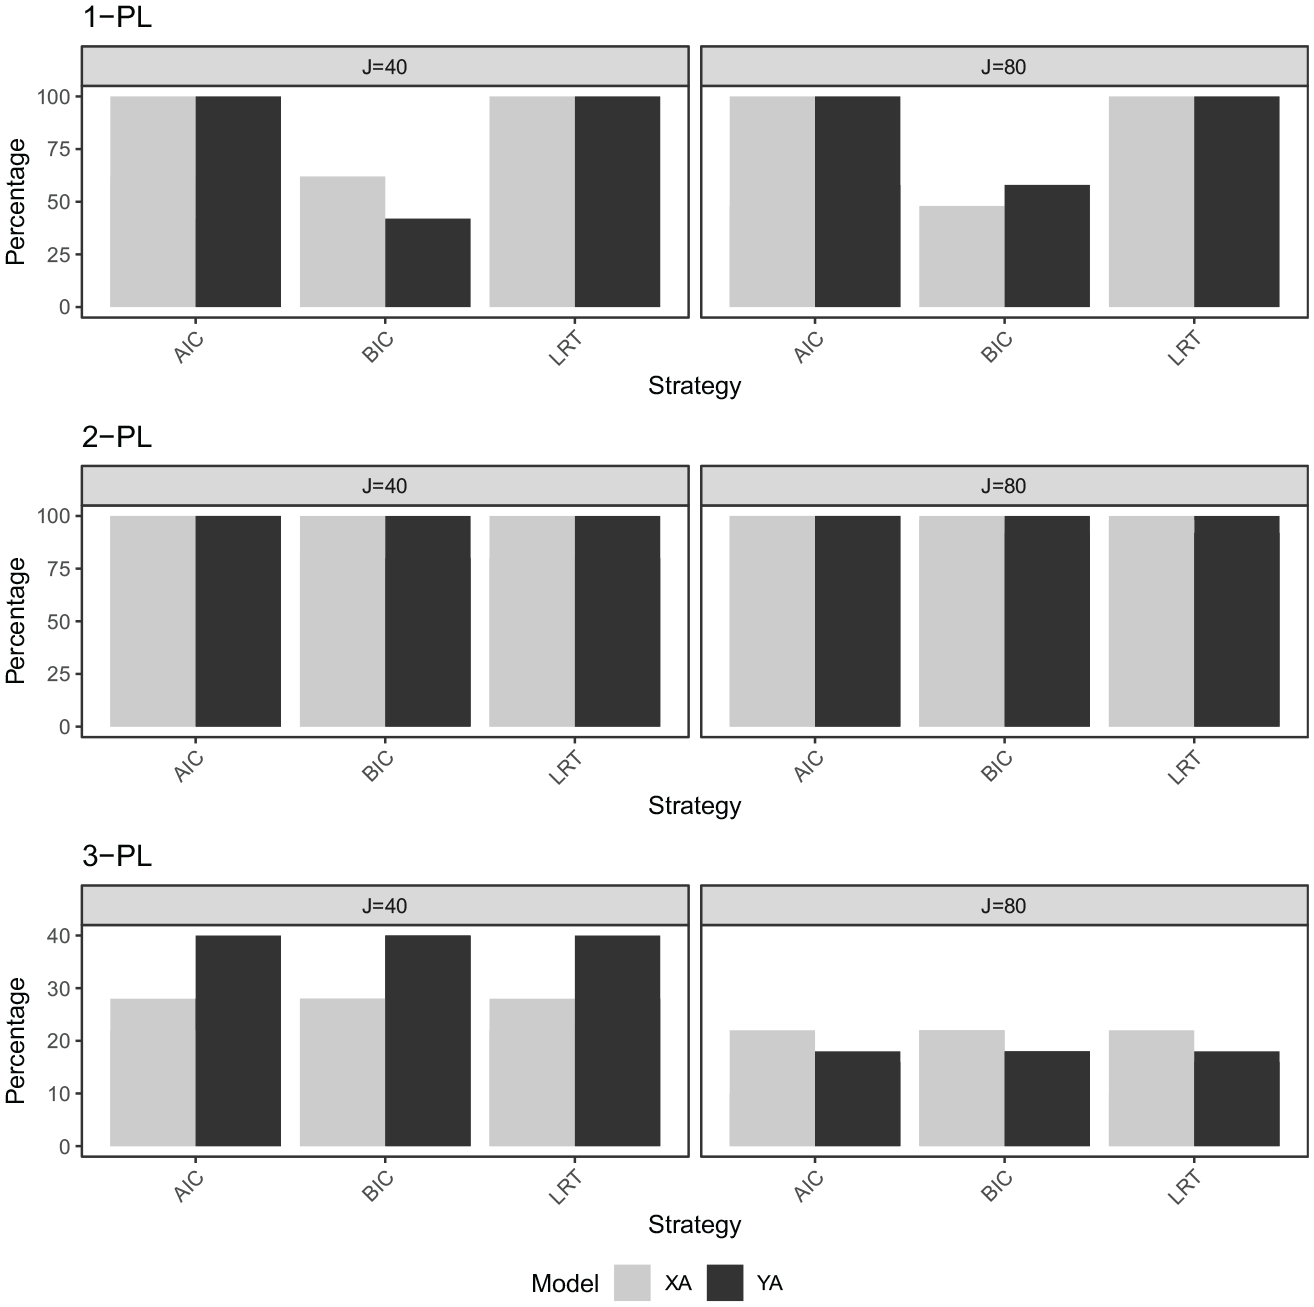
The percentage of correctly selected models
The 2-PL data setting saw all criteria correctly identifying the true model 100% of the time. The 3-PL data setting presented more challenging conditions for all three strategies, which performed the same model selection accuracy for both test lengths. The accuracy levels ranged from 10% to 46% depending on the test length, thus showing the overall worst performance of all IRT settings. When the selection criteria selected an incorrect model in the 3-PL data-generating case, they always selected the 2-PL model. We made sure to generate a guessing parameter that did not have values too close to 0, and so the 3-PL-generated data would be different from the 2-PL-generated data. It is however a challenging task to decide between the 2-PL and the 3-PL, a problem nicely discussed and investigated in Brown et al. (2015), and also reflected in our results. In summary, the AIC and LRT criteria stood out in the simpler 1-PL and 2-PL data settings, but all strategies experienced diminished performance in the more complex 3-PL setting.
In Figure 15, the bias, SE, and ASEE are displayed under all three data-generating scenarios. We see that the bias of all equating estimators when the true data-generating process is either described by a 1-PL model or a 2-PL model is negligible. When the data is generated from a 3-PL model, on the other hand, the bias increases. We also see that the simulation SEs and ASEE values generally increase as the complexity of the data-generating process increases. We conclude that when there is any practical difference between the methods, the LRT seems to perform the worst, followed by the AIC, and the BIC consistently performs the best.
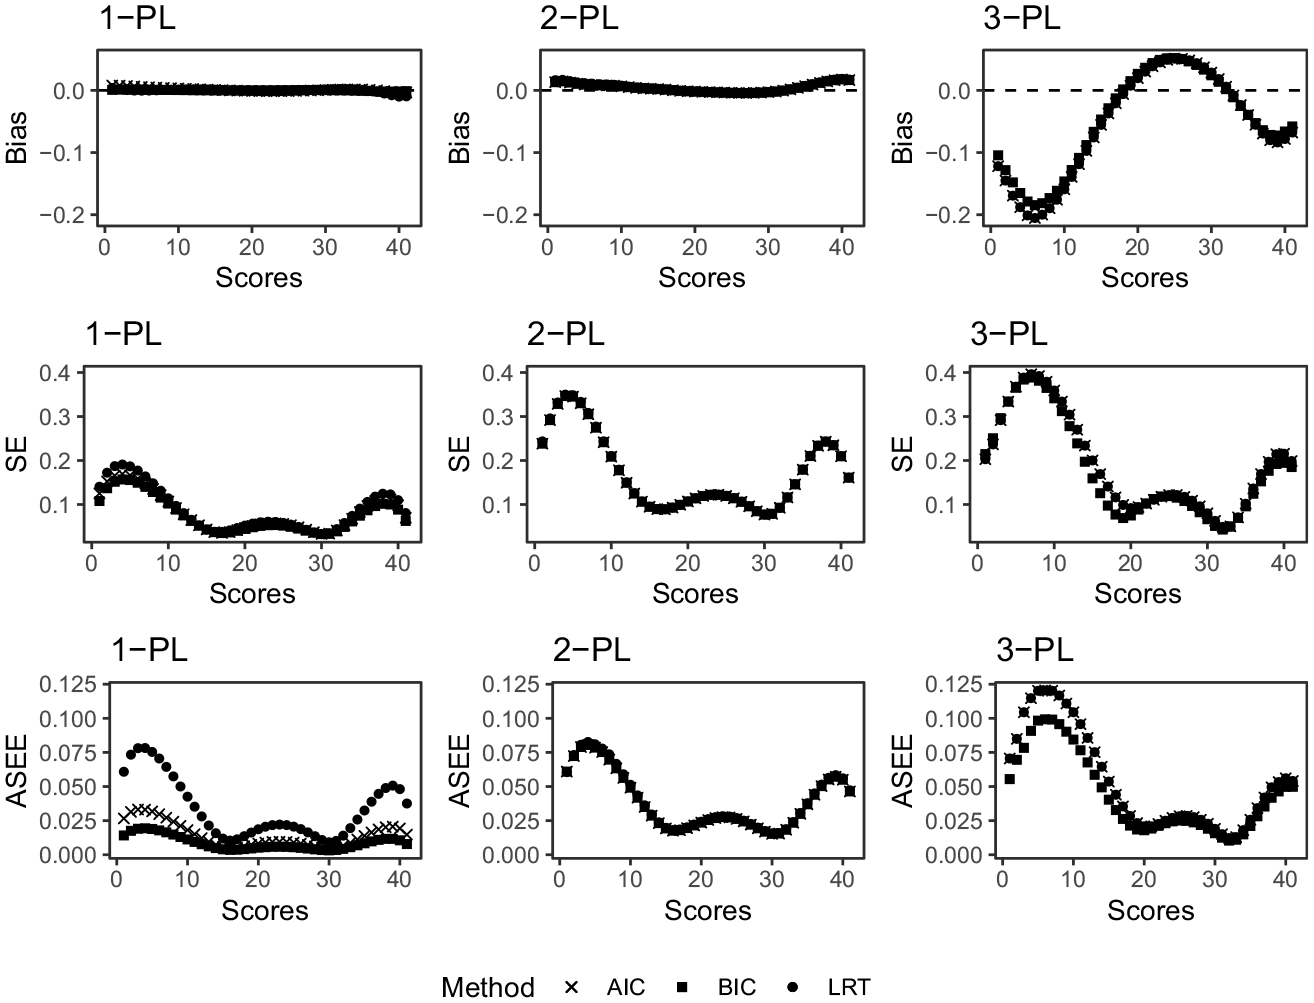
The bias, SE, and ASEE under the 1-PL, 2-PL, and 3-PL data-generating setting, for
Finally, we note that the differences between the equated scores from the considered estimators were within the DTM for all considered scenarios in both simulation set-ups, which differs from our empirical analysis. We, however, note that the SE and ASEE values have clearer differences which could be of practical importance, especially in cases where the sample size is small.
7. Discussion
This study aimed to evaluate the impact of the AIC, BIC, and LRT criteria for log-linear and IRT models when they are used to estimate the score distributions within the kernel equating framework. An algorithm is proposed which uses these three criteria and selects the pair which minimizes the ASEE. Since test groups are often heterogeneous, both within the group and between groups, it is not necessarily the case that the same criterion will select the model that minimizes the estimated ASEE for both groups. We believe that the proposed criterion can serve as a tool to inform the user on which criterion actually performs best in some well-defined sense. It could, for example, in the best of cases, confirm that the selected model is the one that minimizes the ASEE, or at least that the selected model is very similar to the one that minimizes the ASEE. If several criteria point in the same direction, it might give further evidence in favor of a certain model. So even though it might be slightly unnatural to consider different criteria for different groups, we solve the model selection problem in an unconstrained way and use the ASEEmin criterion as a way to further inform us on the model selection. The study has considered both empirical and simulated data for the NEAT design and was motivated by the fact that the three model fit indices considered are all commonly used to select parameterization for these classes of models (Andersson & Wiberg, 2017; Léoncio et al., 2023; Moses & Holland, 2010a). Our findings, based on both real and simulated data, reveal that the choice of presmoothing model and model fit index impacts the equated scores, especially in terms of SE and ASEE, emphasizing their practical importance.
Our analysis of log-linear models showed that model selection performance is dependent on the selection criterion. We discovered that the BIC and ASEEmin criteria were most effective in accurately selecting models across diverse distributional scenarios, which included symmetric, skewed, and bimodal data. While the AIC also demonstrated high accuracy in selecting the true model, it usually favored larger models with more cross-moments when it failed to do so. We, however, conclude that for both symmetric and skewed data, the AIC is the criterion that most often selects the pair of models that minimize the ASEE in finite samples. For bimodal data, the BIC instead most often minimizes the ASEE.
Another intriguing finding was the relatively smaller bias displayed by LRT for top scores, despite its consistent failure in model selection. The LRT always selected a larger model than the true model, which implies that a larger presmoothing model may not inherently disadvantage equating error. However, caution is warranted as the LRT produced the highest SE and ASEE values, signaling potential inconsistencies in equating precision. We note that our implemented procedure is a slight alteration of the complex-to-simple strategy used in Moses and Holland (2009), where model selection of a univariate model, that is, a log-linear model for
In the IRT setting, the AIC and LRT criteria excelled in model selection in simpler 1-PL and 2-PL data settings, achieving 100% accuracy. However, under the more complex 3-PL data scenario, all strategies witnessed reduced performance, with accuracy levels ranging from a mere 10% to 46%. This observation underscores the increasing challenge faced by these criteria when dealing with more complicated IRT models and calls for further investigation into strategies that can maintain high model selection accuracy in these situations.
Concerning the bias, SE, and ASEE, the BIC criterion consistently demonstrated the best performance in the IRT context. A discernible pattern emerged where the bias, as well as the SE and ASEE values, generally increased with the complexity of the data-generating process.
The idea of targeting the equating function when selecting a log-linear presmoothing model has been considered recently by Liu and Kolen (2020), where a log-linear model-selection criterion aiming at minimizing an estimate of the mean squared error of the equating function was proposed. However, their method was only considered for univariate data under the EG design, which in general is a simpler task. Secondly, they aimed at minimizing a measure that requires the estimation of the equating bias, a quantity always unknown. The statistical properties of their selection method are therefore hard to determine. With the procedure proposed in Algorithm 1 there are certain statistical guarantees since we only consider models among the subset of models that have been selected by the AIC, BIC, and LRT in the first step, which all have good and theoretically established selection properties.
In conclusion, our study emphasizes the important role of model selection in test score equating and highlights the importance of the careful choice of model fit indices. Given the variable performance of different criteria under different distributional scenarios and test designs, a one-size-fits-all strategy might be inadvisable. We therefore recommend that practitioners test the sensitivity of their equating results to slight changes in the presmoothing model. One convenient way of doing so is to use our own R function for log-linear model-selection, which takes the bivariate score data as input and outputs the best-fitting model according to the AIC, BIC, LRT, and ASEEmin, for any number of univariate and bivariate moments, as specified by the user. We note that the ASEE is merely one of several possible equating-specific measures that can be used in the proposed algorithm. In our R function, we also give the user the possibility to select the model that minimizes the percent relative error (von Davier et al., 2004), another equating-specific evaluation measure. In our simulations, the results of such criterion did, however, not stand out but performed similar to the other criteria, and are therefore omitted. Further research on this and similar criteria are however motivated. It would also be of interest to examine which measure to use when including covariates such as age and gender in the presmoothing models, as described Wiberg and Bränberg (2015) and Wallin and Wiberg (2019). In these cases, the models may be more complicated or misspecified as in Wallin and Wiberg (2023) and thus more research is needed. One limitation to our study is that we have only considered external anchor items, motivated by the design of the empirical data. By considering internal anchor items, one has to, additionally, address the issue of structural zeros. Model-selection performance under such a setting is left for future research. Finally, we point out that this study has not considered postsmoothing, that is, smoothing of the equipercentile transformation rather than the test score probabilities. The topic of postsmoothing is left for future research.
Supplemental Material
sj-pdf-1-jeb-10.3102_10769986241300523 – Supplemental material for Smoothing of Bivariate Test Score Distributions: Model Selection Targeting Test Score Equating
Supplemental material, sj-pdf-1-jeb-10.3102_10769986241300523 for Smoothing of Bivariate Test Score Distributions: Model Selection Targeting Test Score Equating by Gabriel Wallin and Marie Wiberg in Journal of Educational and Behavioral Statistics
Footnotes
Declaration of Conflicting Interests
The author(s) declared no potential conflicts of interest with respect to the research, authorship, and/or publication of this article.
Funding
The author(s) disclosed receipt of the following financial support for the research, authorship, and/or publication of this article: The Swedish Research Council (2020-06484) and the Swedish Wallenberg MMW grant (2019.0129).
Data Availability Statement
The real admissions test data used in the manuscript is not possible to share, but the code for the simulations study is shared through the corresponding authors’ Github page.
Notes
Authors
GABRIEL WALLIN is a Lecturer in the School of Mathematical Sciences at Lancaster University, LA1 4YF Lancaster, United Kingdom. e-mail:
MARIE WIBERG is a professor at the Department of Statistics, Umeå School of Business, Economics and Statistics, Umeå University, SE-901 87 Umeå, Sweden; e-mail:
References
Supplementary Material
Please find the following supplemental material available below.
For Open Access articles published under a Creative Commons License, all supplemental material carries the same license as the article it is associated with.
For non-Open Access articles published, all supplemental material carries a non-exclusive license, and permission requests for re-use of supplemental material or any part of supplemental material shall be sent directly to the copyright owner as specified in the copyright notice associated with the article.