
Abstract
The testlet design is very popular in educational and psychological assessments. This article proposes a new cognitive diagnosis model, the multiple-choice cognitive diagnostic testlet (MC-CDT) model for tests using testlets consisting of MC items. The MC-CDT model uses the original examinees’ responses to MC items instead of dichotomously scored data (i.e., correct or incorrect) to retain information of different distractors and thus enhance the MC items’ diagnostic power. The Markov chain Monte Carlo algorithm was adopted to calibrate the model using the WinBUGS software. Then, a thorough simulation study was conducted to evaluate the estimation accuracy for both item and examinee parameters in the MC-CDT model under various conditions. The results showed that the proposed MC-CDT model outperformed the traditional MC cognitive diagnostic model. Specifically, the MC-CDT model fits the testlet data better than the traditional model, while also fitting the data without testlets well. The findings of this empirical study show that the MC-CDT model fits real data better than the traditional model and that it can also provide testlet information.
1. Introduction
A cognitive diagnosis model (CDM) allows us to detect the presence or absence of specific skills as measured by items in assessment measures. A considerable number of studies exploring CDMs have already been conducted (e.g., Hartz, 2002; Junker & Sijtsma, 2001; Rupp et al., 2010). However, most of the proposed CDMs are modeled based on the implementations of dichotomously scored data. These models depend on responses in the form of either 1 or 0. If an examinee chooses the key answer correctly, the response to this item is denoted as 1, and if they select a distractor rather than the correct answer, the response is denoted as 0. However, this method is not an optimal way to identify examinees’ skills because it ignores additional diagnostic information about their cognitive process and other concepts that could be obtained by considering the information provided via the distractor responses (Sadler, 1998). To maximize the potential value of multiple choice (MC) items on assessments, several CDMs that consider the additional information provided by distractors have been proposed, including the multiple choice deterministic inputs, noisy “and” gate (MC-DINA) model (de la Torre, 2009a), the scaling individuals and classifying misconceptions (SICM) model (Bradshaw & Templin, 2014), the generalized diagnostic classification models for MC (GDCM-MC; DiBello, Henson, & Stout, 2015), and the three-category structured DINA model for MC items (MC-S-DINA; Ozaki, 2015). Models such as these, which can be referred to generally as MC-CDMs, can collect additional diagnostic information obtained from distractors to further improve the estimation accuracy for examinees’ attribute profiles (de la Torre, 2009a; DiBello et al., 2015; Ozaki, 2015). For example, the MC-DINA model can improve the attribute profile classification rate by 29% when compared with the DINA model (de la Torre, 2009b) under the same simulation condition (de la Torre, 2009a). Hence, they are effective ways to improve the diagnostic accuracy when the test contents remain the same.
A testlet is a bundle of items that share a common stimulus (e.g., a reading comprehension passage; Wainer & Kiely, 1987; Wainer & Wang, 2000), which has been widely implemented in educational and psychological tests, such as the test of English as a foreign language (TOEFL), graduate record examinations (GRE), and programme for international student assessment (PISA). Many researchers and item developers believe that the testlet-based form has high test efficiency, especially for item writing and administration (Huang & Wang, 2012). Nevertheless, traditional CDMs cannot model testlet responses sufficiently due to local item dependence between items within a testlet. Thus, further research that incorporates testlets under the CDM framework is needed. Hansen (2013) introduced an alternative diagnostic model to describe local item dependence by including random effects in CDMs to account for potential residual dependence due to the common source of variations shared by a particular set of items. Zhan et al. (2018) proposed the joint testlet CDM framework to handle two types of random testlet effect, one for item response accuracy and the other for item response times. Although the testlet effect was generalized to the field of CDMs in both studies, neither of them considered the diagnostic information provided by the distractors, meaning that these two testlet CDMs were yet unable to estimate the MC data with distractors’ information because all distractors were not coded options in the existing testlet CDMs.
Finding a feasible CDM for testlet-based MC data continues to be a challenge. In this study, we proposed an MC-CDM that considered the testlet (MC-CDT), which can introduce random effects to represent the testlet effects. The new model can not only optimize the diagnostic function of MC items, but it also fits the testlet-based response data well.
This article is organized as follows. First, the MC-CDMs are briefly introduced and the new MC-CDT is proposed. Second, the parameter estimation of the MC-CDT model using the Markov Chain Monte Carlo (MCMC) method is presented. Third, two simulation studies are presented, which used the WinBUGS 1.4 software (Spiegelhalter et al., 2003) to assess parameter recovery of the MC-CDT and the model misspecification impact. Finally, conclusions and issues are discussed.
2. Cognitive Diagnostic Models for MC Items Using Testlets
We will first introduce some basic concepts and terms used in the MC-CDM model. Let
2.1. Traditional MC-CDMs
As previously mentioned, four MC-CDMs have already been proposed to fit MC data. de la Torre (2009a) developed the MC-DINA model, which can analyze MC items when distractors are coded by required attributes. More specifically, to incorporate diagnostic information from distractors when using MC-CDMs to estimate examinees’ attribute profile, the distractors should be coded to indicate which of the required attributes are missing in examinees’ responses. For example, an item with the content
If all distractors are not coded, the MC-DINA model is equivalent to the DINA model. For the MC-DINA model, the probability of choosing option h of item j by examinee i is represented by
To simplify the MC-DINA model, Ozaki (2015) proposed three structured DINA models for MC items, the structured DINA model for MC items 1, the structured DINA model for multiple-choice items 2, and the structured DINA model for MC items 3 (denoted as MC1, MC2, and MC3, respectively). For the MC1 model, the probability of choosing option h of item j by examinee i is

Here
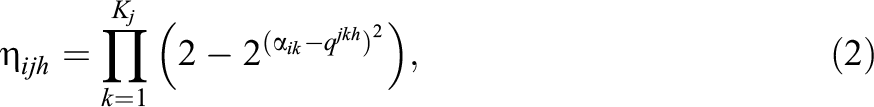
where Kj
is the largest number of required attributes for item j.
The SICM model merges the nominal response item response theory model (Bock, 1972) and CDMs, allowing the continuous ability and distinct misconception patterns to be estimated using both information from the coded key option as well as from the distractors. However, the SICM model is rather complex because a large number of the item and examinee parameters must be estimated (both continuously and categorically). This is to say that its estimation procedure is computationally intensive. Furthermore, the examinee’s attribute profile is expanded to include facets of thinking, which are either problematic (including misconceptions or partially correct) or desirable (both skills and conceptual understandings). The profile also includes the
Considering everything discussed thus far, the MC1 model does appear to be the most parsimonious traditional MC-CDM. According to the results of simulation studies conducted by Ozaki (2015), the recovery rates of examinee parameters were relatively comparable across the three MC-S-DINA models when the test length was relatively long. Furthermore, the biases and RMSEs of the item parameters obtained from the MC1 model were the smallest of these three MC-S-DINA models across various conditions. Therefore, prioritizing the principles of simplicity and effectiveness, the MC1 model was chosen as the basic model to incorporate the testlet effects in the current study.
2.2. The MC-CDM With Testlet
Various approaches have already been made to analyze response data obtained from testlets in psychological and educational measurement models, especially in the field of item response theory, resulting in, among others, the development of the second-order model (Rijmen, 2010), the bifactor model (Demars, 2006; Li et al., 2005), the random-effect testlet model (Bradlow et al., 1999; Wang & Wilson, 2005), and the fixed-effect testlet model (Kang et al., 2021). Those models offer different perspectives in describing testlet structures. However, no MC-CDMs thus far has been shown to accurately fit testlet items. Thus, the testlet structure needs to be incorporated into the MC-CDMs to fully consider testlet-based MC data.
This research focused on the random-effect testlet structure rather than the fixed-effect testlet structure because the former enables a transformable testlet effect at the examinee level, while the latter does not. As shown in Figure 1, the testlet model treats each item as an indicator of a general attribute profile, with one of M testlet effects set for each of the fixed- and random-effect testlet CDM. The fixed-effect testlet model (Figure 1A) treats the testlet effect as a constant on all examinees’ responses. However, the random-effect testlet model (Figure 1B) treats the testlet effect as a variant impact on the responses of different examinees. As an illustration, the MC1 model may be selected as it offers a generalized fit for testlet tests due to its simplicity and better parameter recovery. Nevertheless, the additional testlet effects can still also be applied in other MC-CDMs.
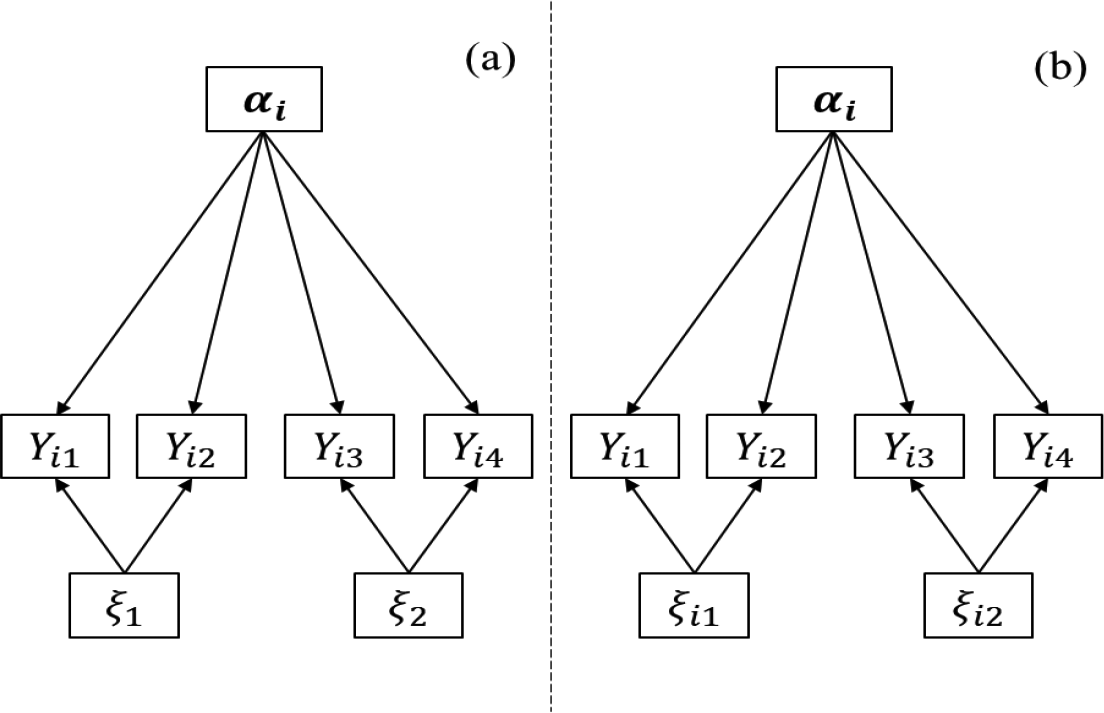
Directed acyclic graph of the cognitive diagnosis model with (A) fixed-effect testlet and (B) random-effect testlet and with four items within two testlets. Note.
To incorporate the random testlet effects into the MC1 model, an appropriate modification for Equation 1 is first required. The logit transformation of the item parameter
or

Therefore, the MC1 model can be re-expressed as
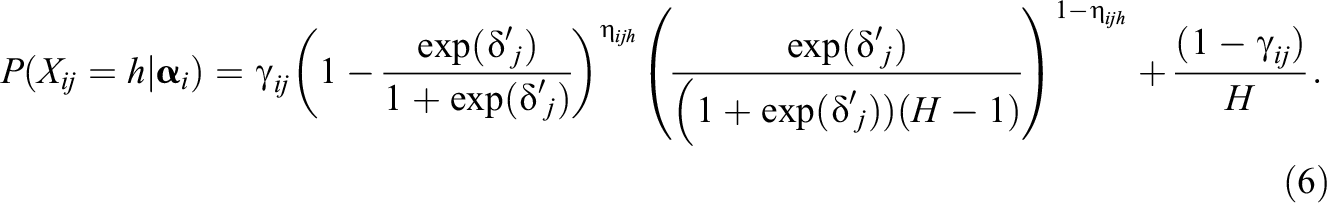
Inspired by modeling approaches utilized in previous studies, such as the joint testlet CDM (Zhan, et al., 2018), the Rasch testlet model (Wang & Wilson, 2005), the two-parameter logistic testlet model (Bradlow et al., 1999), and the three-parameter testlet model (Wainer et al., 2000), we also added the testlet effects into the MC1 model to reflect the testlets’ influence on response probabilities. Following the same modeling approach as adopted in previous studies, we extended Equation 4 to include an additional random effect for dependence between items within the same testlet. The kernel function of the MC-CDM with the testlet is expressed as
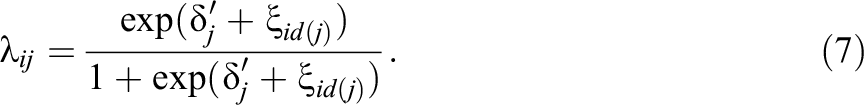
Similarly,

Specifically, if
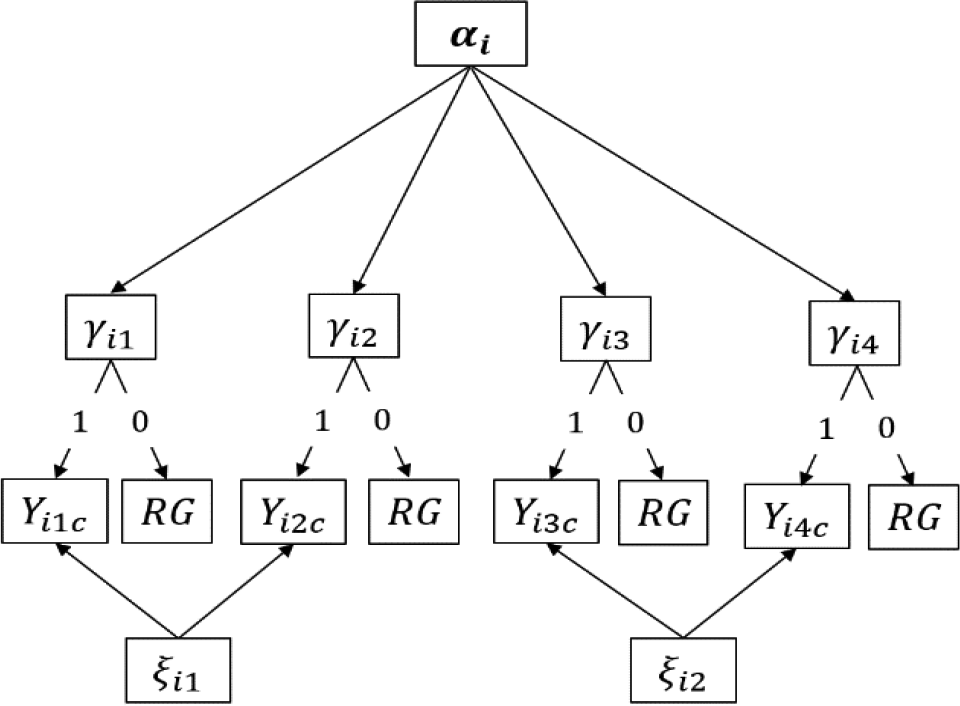
Directed acyclic graph of the multiple-choice cognitive diagnostic testlet model. Note. RG = random guessing.
3. Bayesian Estimation Algorithms
A fully Bayesian approach was used to estimate the parameters for the MC-CDT model. The MCMC method was adopted because it provides a simple and effective way to simulate joint posterior distribution of unknown quantities and get simulation-based estimates of posterior parameters. In this study, WinBUGS Version 1.4 software was employed to perform the MCMC method, and the means of the joint posterior distribution represented parameter estimates. WinBUGS Version 1.4 uses Gibbs sampling and the metropolis algorithm to generate a Markov chain by sampling from full conditional distributions. It allows users to define and calibrate a variety of models. For example, Curtis (2010) developed BUGS codes to fit commonly used item response models, such as a two-parameter logistic model, a three-parameter logistic model, a graded response model, a generalized partial credit model, a testlet model, and a generalized testlet model. Furthermore, it is easy to extend the BUGS codes to fit even more complicated models, including CDMs (Culpepper, 2015).
For the MC-CDT model, the prior distributions of examinee parameters are assumed as being
which generally represents randomness or no prior cases (Wang et al., 2021; Zhan et al., 2015).
The priors of item and testlet parameters are specified as
and
The testlet variances were assigned inverse-gamma prior distributions, the values of which are usually set in models as
4. Simulation Study 1
The main goals of Simulation Study 1 were (a) to evaluate the performance of the MC-CDT model under various conditions and (b) to test for possible issues triggered by using the traditional MC-CDM to fit MC data with testlets. The study had three manipulated independent variables that were fully crossed: the quality of item parameters, the testlet effect, and the number of testlets. We have also included the results of a small simulation study in the Online Appendix, which used sample size (i.e., 250, 500, 1,000, and 2,000) and test length (i.e., 15 or 30 items), to check the robustness of the two models using a small sample size and a limited number of item situations. Each data set in this study was generated using the MC-CDT model (see Equation 8) across all conditions.
A
4.1. Examinee Generation
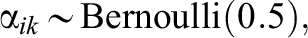
The attribute profile
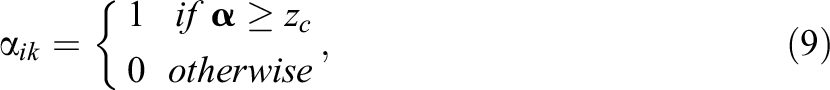
where zc is a cutoff value, which, in this study, was fixed at 0.
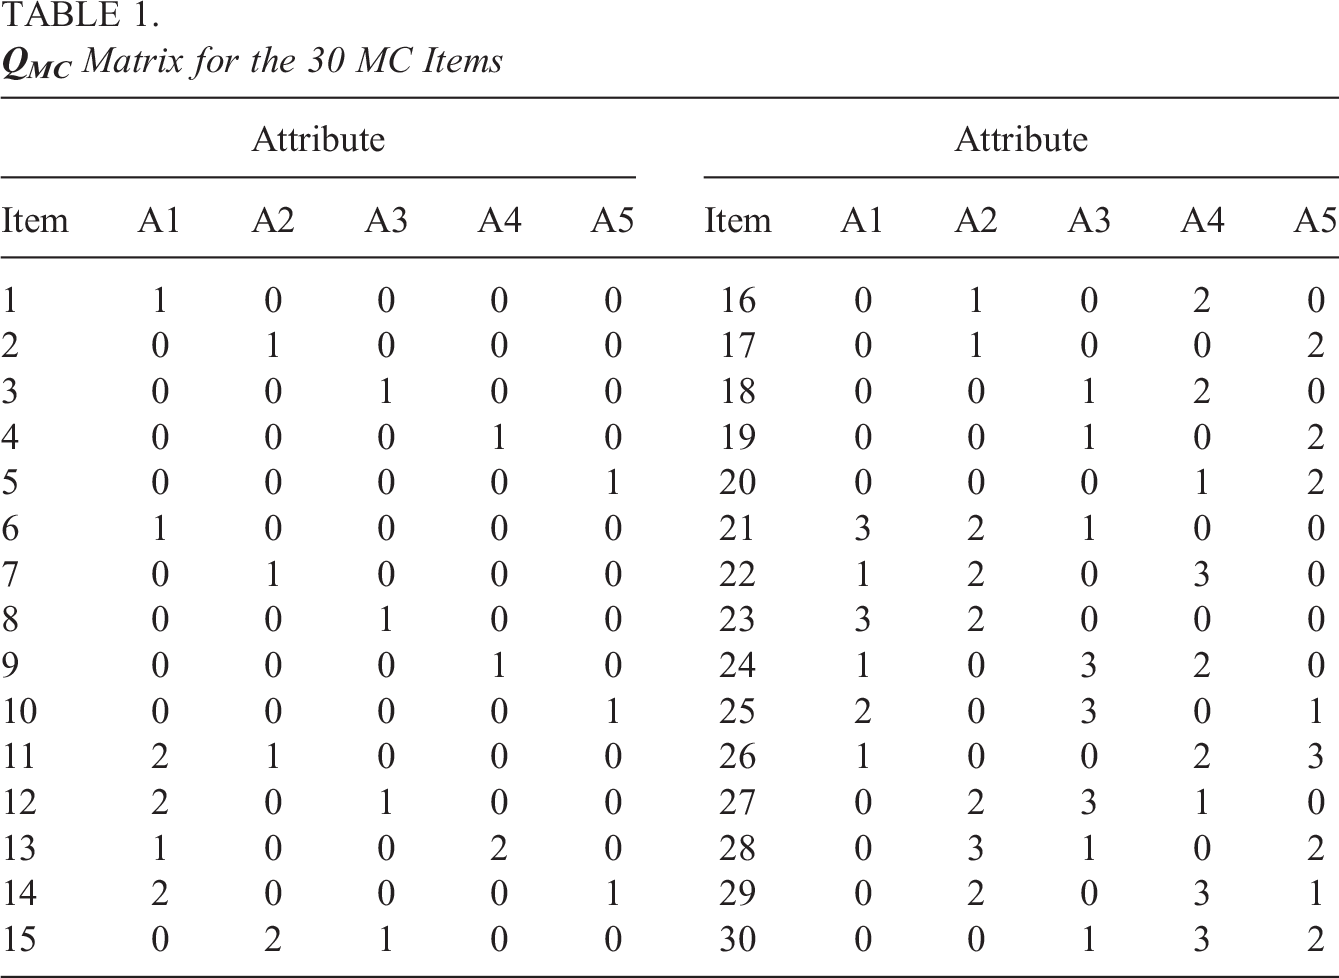
4.2. Testlet Number
The 30 items shown in Table 1 were assigned to either three or six testlets, according on the condition. The first 10 items constituted the first testlet, the middle 10 items constituted the second testlet, and the final 10 items constituted the third testlet for the three-testlet condition. For the six-testlet condition, each testlet was created out of five items, following the same assignment rule as for the other condition.
4.3. Testlet Effect
4.4. Item Parameters
Existing studies have shown that item quality has a significant impact on recovery accuracy of item parameters and examinees’ attribute profiles (Bradshaw, et al., 2014; de la Torre et al., 2010; Ma et al., 2016). Thus, it was necessary to investigate the influence of item quality in the MC-CDT model. Referring to Ma et al.’s (2016) setting of item parameters, items with
4.5. Estimation
The R package R2WinBUGS (Sturtz et al., 2005) was used to implement the MCMC method in WinBUGS. Parameter estimation was averaged over three parallel chains with initial values chosen randomly by WinBUGS. Thirty replications were performed for each condition. For every replication, each parallel chain had 10,000 iterations, with the first 5,000 iterations as burn-in. These numbers were determined using the criterion of the multivariate potential scale reduction factor
4.6. Evaluation Criterion
The bias and root mean square error (RMSE) of item parameter estimates (denoted as
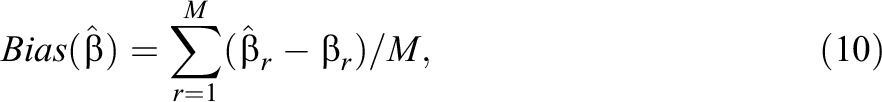
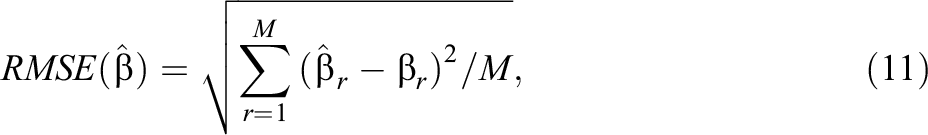
where
The pattern correct classification rate (PCCR) and the attribute correct classification rate (ACCR) were used to quantify the estimation accuracy of the attribute profile and each individual attribute, respectively. The PCCR and ACCR for each replication were computed as follows:

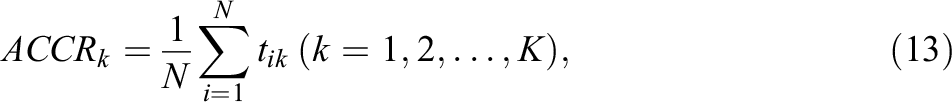
where N was the number of examinees. If the ith examinee had mastered (or not mastered) the attribute, and they were classified correctly, then
4.7. Study 1 Results
Figure 1 shows the average bias and RMSE values of variance of the testlet effect parameters (
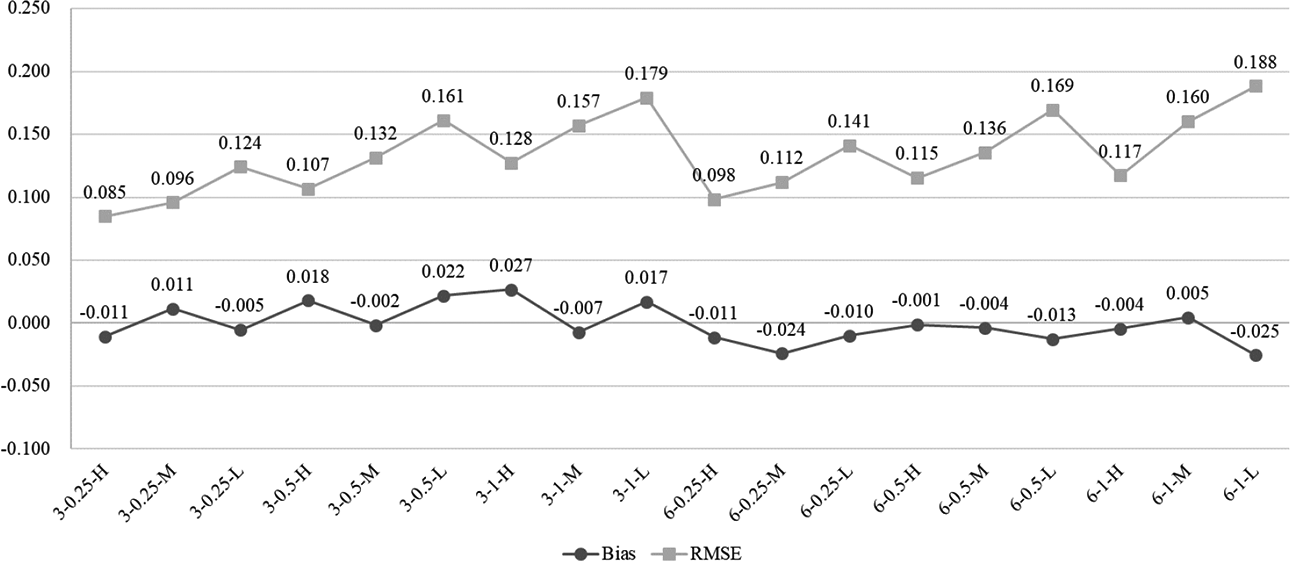
Bias and root mean square error of testlet effect variance (
Figures 4 and 5 show the bias and RMSE values of the item parameters for the MC-CDT and MC1 models under the various conditions. For the MC-CDT model, the estimation accuracy of the item parameters was fairly good, with bias and RMSE values all relatively small across all item quality levels and testlet effect configurations. Reported biases ranged from −0.086 to 0.097, close to zero. The RMSE values ranged from 0.026 to 0.287. Notably, the bias and RMSE values of the item parameters were relatively small in the high item quality condition and the largest in the low quality condition. These results were expected because, in these same conditions, more accurate estimates of item parameters were obtained when the values were smaller. The results were in accordance with the conclusion drawn by de la Torre, that extreme response probabilities have less sampling variability (de la Torre et al., 2010). Furthermore, the results indicated that data sets generated with a low level of testlet effect led to slightly more accurate parameter estimates. It is worth noting that the number of testlets had little effect on either bias or RMSE. This suggests that the MC-CDT model can accurately estimate the item parameters regardless of the number of testlets in a particular test. Overall, the desired estimation accuracy of item parameters was achieved using the MC-CDT model.
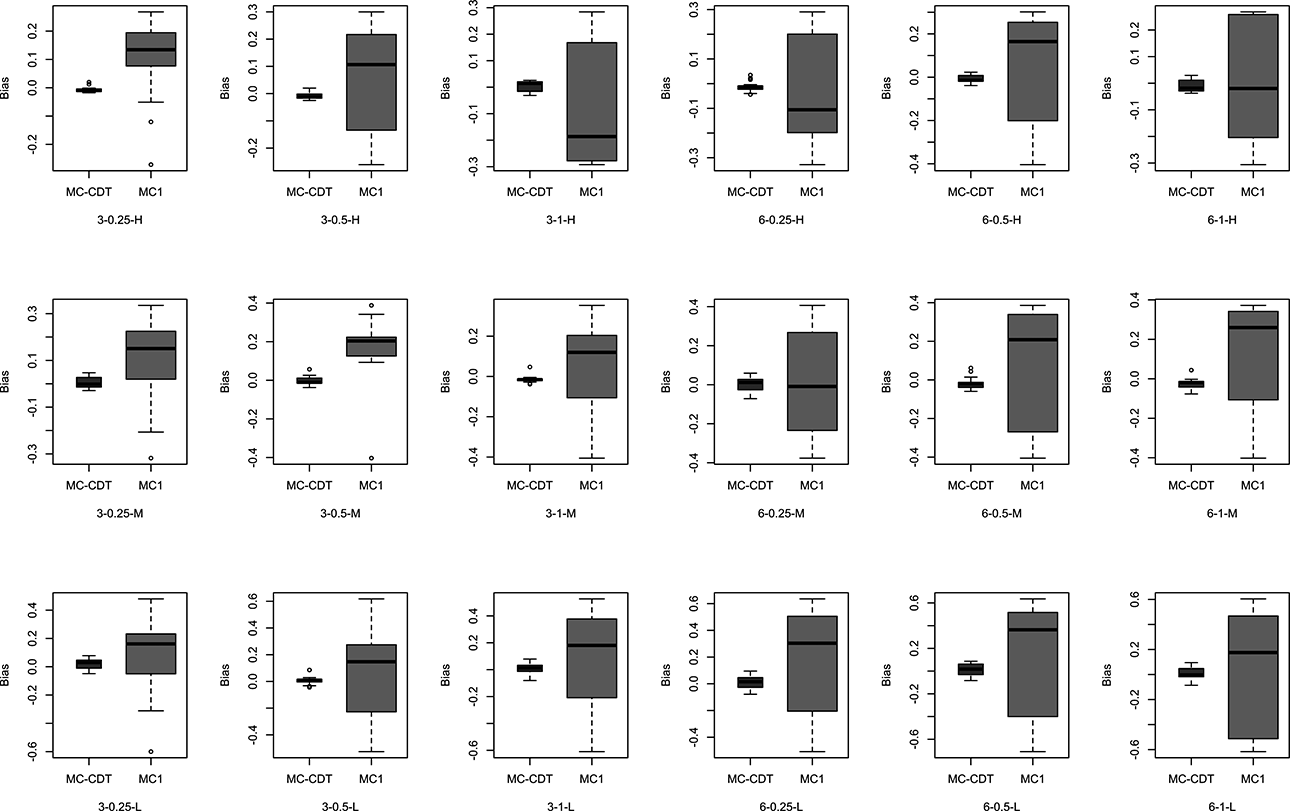
Bias of item parameters for the multiple-choice cognitive diagnostic testlet (MC-CDT) and MC1 models (true model = MC-CDT). Note. In the axial coordinates, 3 and 6 represent the testlet number; 0.25, 0.5, and 1 represent the testlet effect (i.e.,
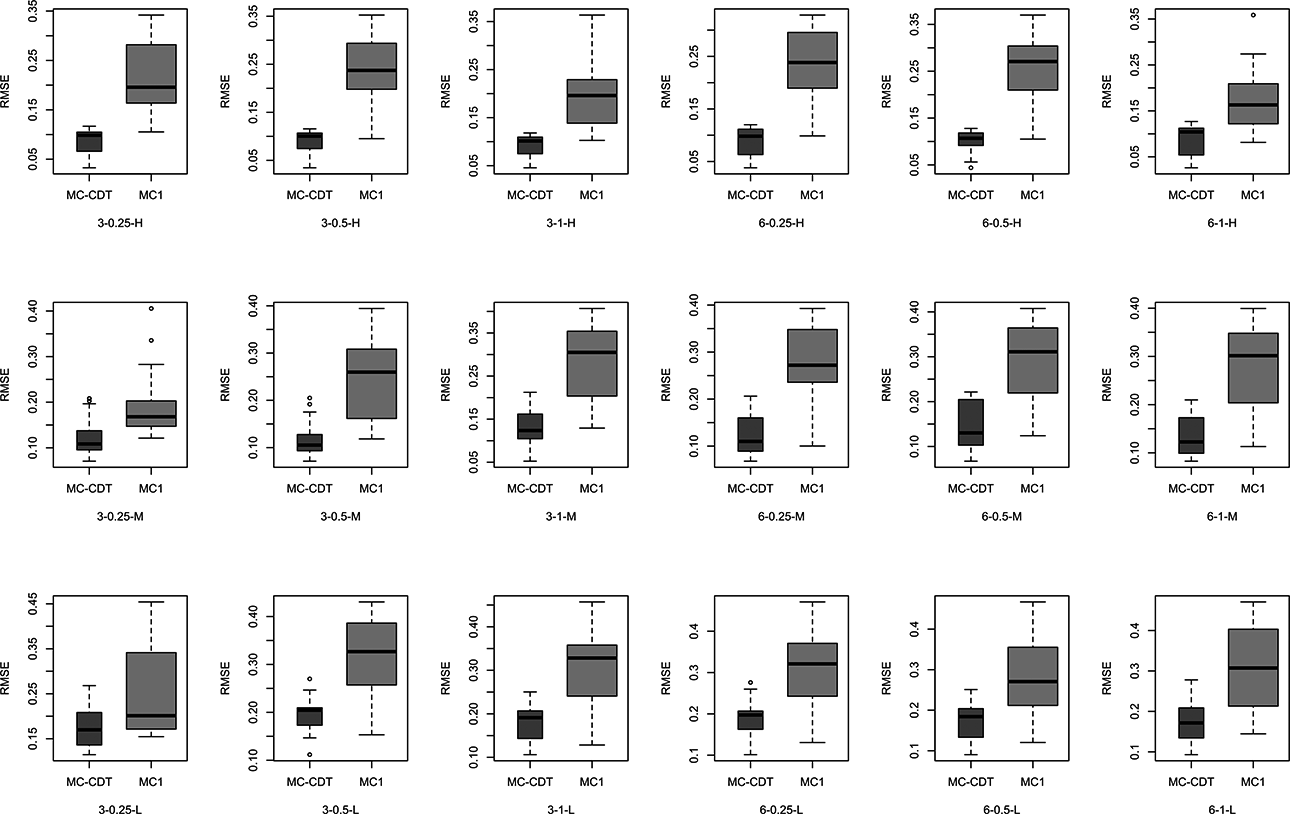
Root mean square error of item parameters for the multiple-choice cognitive diagnostic testlet (MC-CDT) and MC1 models (true model = MC-CDT). Note. In the axial coordinates, 3 and 6 represent the testlet number; 0.25, 0.5, and 1 represent the testlet effect (i.e.,
As for the MC1 model, the estimation accuracy of item parameters was worse across all conditions. Bias values achieved through the MC1 model ranged from −0.708 to 0.637, and the RMSEs ranged from 0.083 to 0.474. It was obvious that the bias and RMSE values from the MC1 model were much larger than those from MC-CDT model, as shown in Figures 3 and 4. In other words, the MC-CDT model recovered item parameters much better than the MC1 model. These results supported our expectation that when MC data were generated using testlets, the use of traditional MC-CDM would yield much worse parameter estimates.
The average correct classification rate of the examinees’ attribute profiles and individual attributes using both the MC-CDT and the MC1 models were also investigated. As seen in Table 2, the PCCR and the mean of the ACCR (denoted as AACCR) values were virtually unaffected by the number of testlets. This suggests that the MC-CDT model has strong stability across the different numbers of testlets. However, the estimation accuracy of examinees’ parameters was influenced most by item quality. This result was expected because higher item parameter values have a stronger effect on the examinees’ probability of answering items correctly, that is, it increases the possibility of unreasonable item-biased item responses. This trend was consistent with the psychometric literature at large (Bradshaw et al., 2014; de la Torre et al., 2010). For the MC-CDT model, results showed that the PCCR values were all above 0.94, and the AACCR values were all above 0.97 in the high item quality condition. In contrast, the PCCR and AACCR values decreased to 0.787 and 0.858, respectively, in the low item quality condition. As for the MC1 model, the PCCR and AACCR values were consistently smaller than those from the MC-CDT model under the same conditions. In particular, the minimum values of the PCCR and AACCR decreased to 0.703 and 0.804, respectively, when the item quality was low. The strength of the testlet effect also had a mild effect on the estimation accuracy of examinees’ parameters, as shown in Table 2. With the increase of the testlet effect, the PCCR and AACCR values slightly decreased. The higher random testlet effect would increase the probability of examinees possessing the same attribute profile choosing a different option for one item. This result is similar to those from previous studies (Glas et al., 2000) and suggests that an inaccurate estimate of examinee parameters would be obtained if traditional MC-CDM is used to fit MC data with testlets. Furthermore, this negative effect may be increased when item quality is not particularly high.
Recovery Rate of Examinee Parameters for Model Comparison in Simulation Study 1
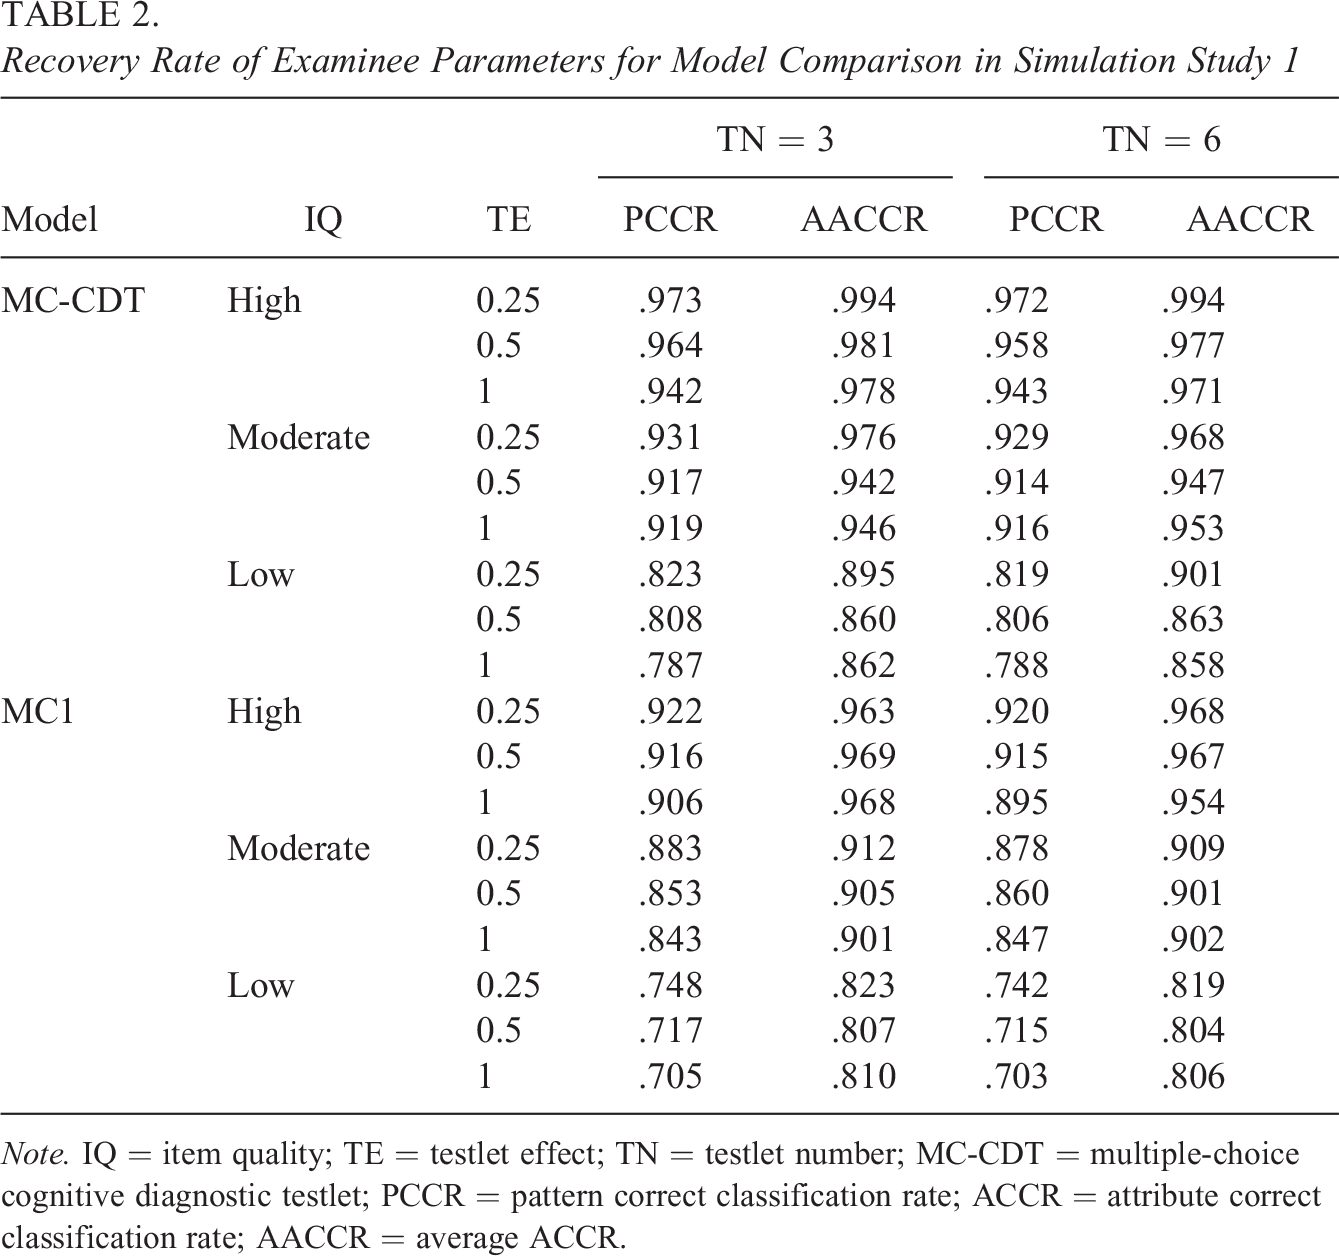
Note. IQ = item quality; TE = testlet effect; TN = testlet number; MC-CDT = multiple-choice cognitive diagnostic testlet; PCCR = pattern correct classification rate; ACCR = attribute correct classification rate; AACCR = average ACCR.
An additional small simulation study considering limited item length and small sample size was performed to investigate the robustness of the MC-CDT model. As shown in Table S1 of the Online Appendix, the magnitudes of the PCCR of the MC-CDT were between 0.582 and 0.968. Compared to the MC1 model, the MC-CDT results showed PCCR improvements of 3%–20.8%. The magnitudes of the AACCR of the MC-CDT were between 0.779 and 0.992. Compared to the MC1 model, the MC-CDT model improved the AACCR by 0.3%–11.8%. Test length, sample size, and item quality also showed a great impact on the PCCR and AACCR values in the supplementary simulations. When the test length was 15 items, an acceptable classification rate (i.e., PCCR > 0.75 and AACCR > 0.85) occurred in the sample size of 500 and moderate item quality condition. As the test length increased to 30, a similar classification rate of the MC-CDT model was obtained when the sample size was only 250. These results indicated that the MC-CDT model showed promising performance when item numbers were limited sample sizes were small. Furthermore, these findings indicate that lower PCCR and AACCR values will be obtained if traditional the MC-CDM model fits the MC data with testlets. Moreover, the bias and RMSE values of item parameters in the MC-CDT model were smaller than those in the MC1 model, and the testlet parameters of the MC-CDT model also led to accurate estimations in these scenarios, as shown in Figures S1 through S3 of the Online Appendix.
5. Simulation Study 2
The purpose of Simulation Study 2 was to investigate the robustness of the MC-CDT model. While the true model in this study was the MC1 model, both the MC-CDT and MC1 models were used to fit the MC data without testlets to evaluate (a) whether the MC-CDT model provides comparable accuracy of the parameter estimation compared to the MC1 model and (b) whether the MC-CDT model can identify that there are no testlet effects.
5.1. Design
The data sets were generated using the MC1 model. Both models were then investigated to explore the MC data with no testlet effect present. Note that no testlet effects were included when the data sets were generated by the MC1 model, so the true values of
5.2. Study 2 Results
Figure 6 shows the average bias and RMSE values of the testlet effect variance for the MC-CDT model. There was no variance estimation result of testlet effect parameters for the MC1 model because it was exclusive of testlet effect terms in the MC1 model. The bias values ranged from 0.0040 to 0.0079, while RMSEs ranged from 0.0093 to 0.0122 for the MC-CDT model. The results showed that these values were very close to zero across all conditions, indicating that the MC-CDT model can effectively identify a no testlet-effect result when there was no testlet in the test.
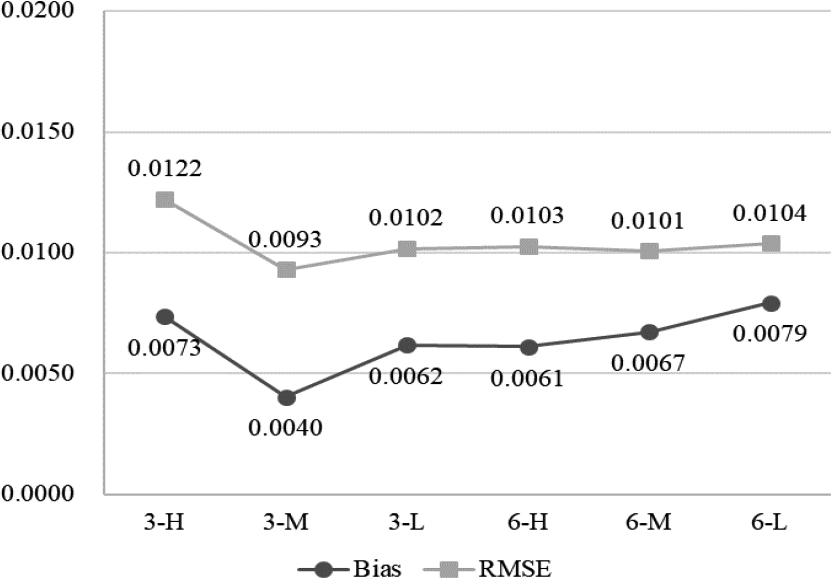
Bias and root mean square error of testlet effect variance for the multiple-choice cognitive diagnostic testlet model in Simulation Study 2. Note. In the axial coordinates, 3 and 6 represent the testlet number; H, M, and L represent the high, medium, and low item quality.
Figures 7 and 8 give the bias and RMSE values of the item parameters for the MC-CDT and MC1 models. The bias values obtained from the MC1 model ranged from −0.016 to 0.026 with a mean value of 0.006, and RMSE values ranged from 0.012 to 0.118 with a mean value of 0.061 in the high-quality item condition. Meanwhile, bias values acquired using the MC1 model ranged from −0.033 to 0.069 with a mean value 0.032, and RMSE values ranged from 0.023 to 0.219 with a mean value of 0.108 in the low-quality item condition. These results indicated that the MC1 model had relatively accurate estimates for item parameters. The accuracy of the estimates made using the MC1 model can be treated as a baseline to compare the estimation results obtained from the MC-CDT model. Although the range and mean of both bias and RMSE values in the low-quality item condition were larger than those in the high-quality item condition, the differences between the two conditions were trivial.
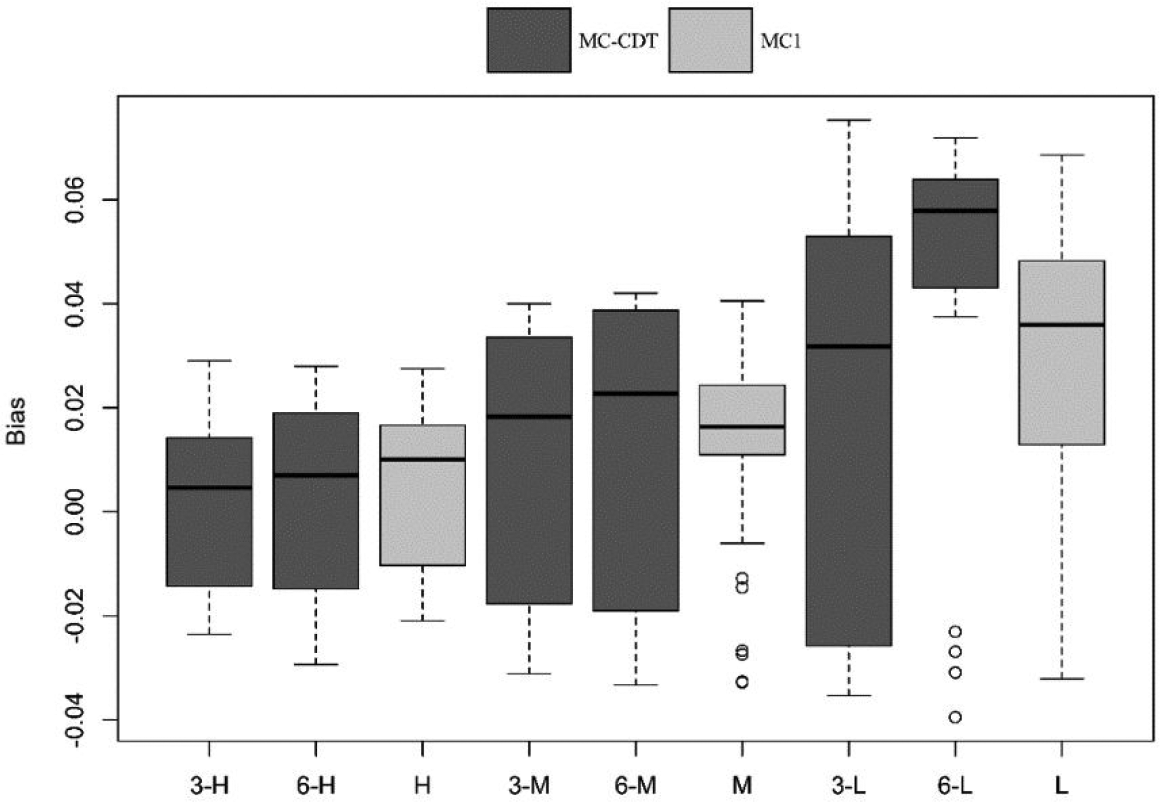
Bias of item parameters for the multiple-choice (MC) cognitive diagnostic testlet and MC1 model. Note. In the axial coordinates, 3 and 6 represent the testlet number; H, M, and L represent the high, medium, and low item quality.
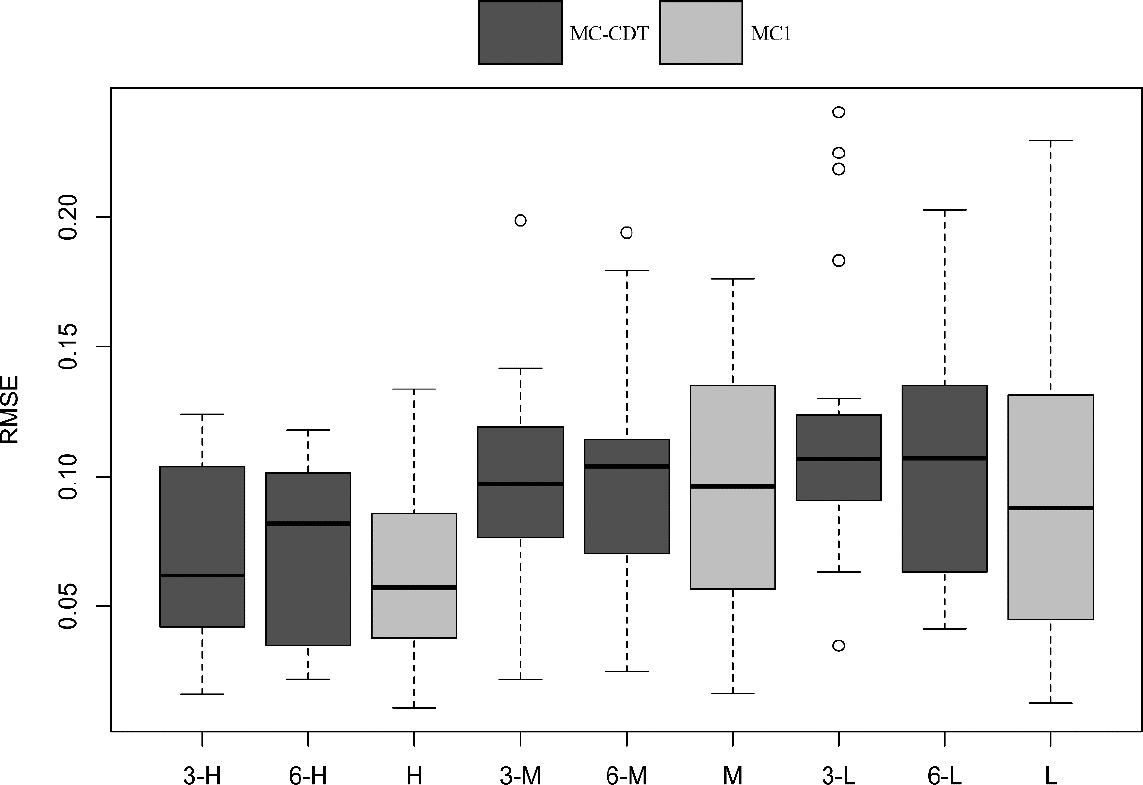
Root mean square error of item parameters for the multiple-choice (MC) cognitive diagnostic testlet and MC1 model. Note. In the axial coordinates, 3 and 6 represent the testlet number; H, M, and L represent the high, medium, and low item quality.
The dark part of the box plot in Figures 4 and 5 shows the item parameters estimation results for the MC-CDT model. Note that the bias and RMSE values were almost the same across the different testlet numbers, which indicated that the influence of the number of testlets was negligible in terms of the estimation accuracy of the item parameters. The magnitudes of the bias (between −0.031 and 0.029, mean = 0.008) and the RMSE (between 0.015 and 0.133, mean = 0.072) were small in the high-quality item condition. Similarly, the magnitudes of bias (between −0.038 and 0.077, mean = 0.038) and the RMSE (between 0.032 and 0.236, mean = 0.116) were also small in the low-quality item condition. These results were comparable to those obtained from the MC1 model in the same conditions. This suggests that the MC-CDT model can be used to fit MC data without the use of testlets.
Table 3 shows the PCCR and AACCR values calculated using both the MC-CDT and the MC1 models. The estimation accuracy of examinees’ parameters was also affected by item quality in this study. Higher item quality led to higher PCCR and AACCR in both models. However, the PCCR and AACCR values were basically unaffected by the number of testlets in the MC-CDT model. Although the performance of the MC1 model was better than that of the MC-CDT model in terms of both the PCCR and the AACCR, the difference was trivial. The PCCR and AACCR values ranged from 0.829 to 0.977 and 0.958 to 0.995, respectively, for the MC1 model, while the PCCR and AACCR values ranged from 0.821 to 0.970 and 0.948 to 0.991, respectively, for the MC-CDT model. These results were considered to be reasonable because, in this case, the MC1 was the true model for generating response data. Most importantly, the estimation accuracy of the examinees’ parameters in the MC-CDT model was comparable to that of the traditional MC-CDM model. In other words, the MC-CDT model fit the MC data very well, even without testlets.
Recovery Rate of Examinee Parameters for Model Comparison in Simulation Study 2
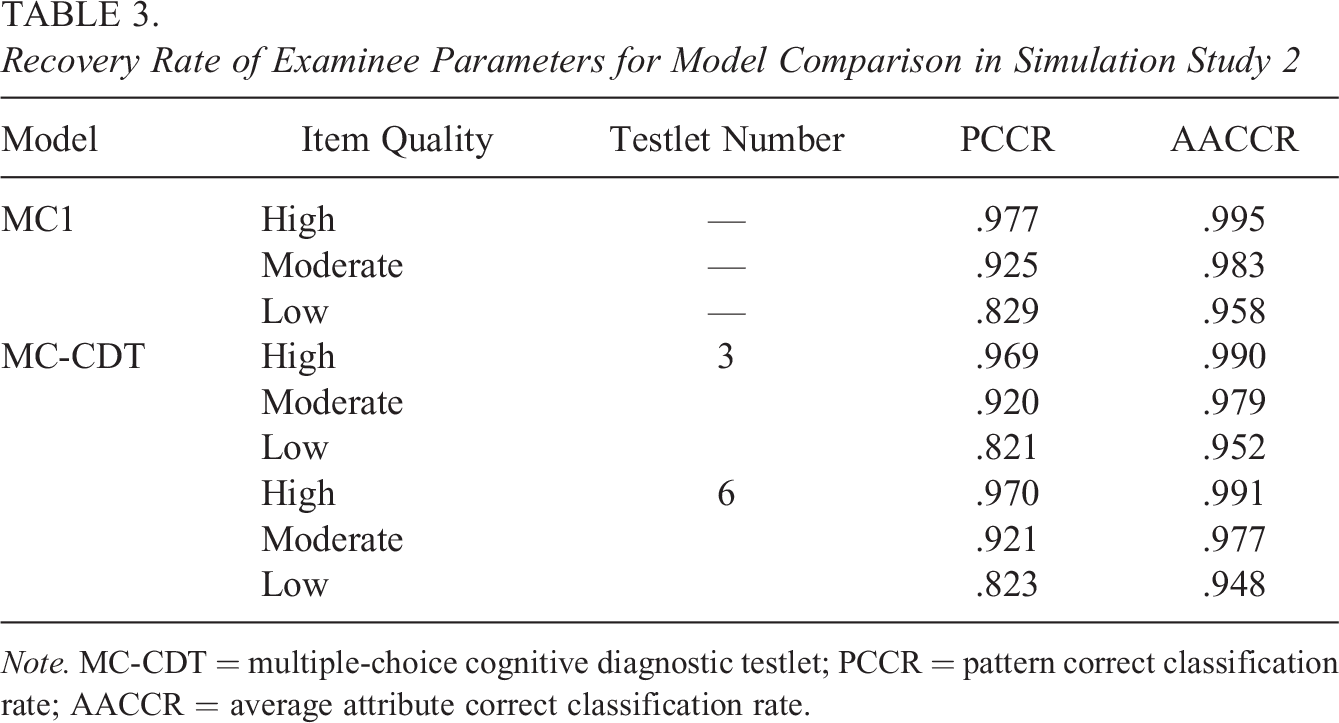
Note. MC-CDT = multiple-choice cognitive diagnostic testlet; PCCR = pattern correct classification rate; AACCR = average attribute correct classification rate.
6. An Empirical Study
6.1. Data Description
To investigate the performance of the MC-CDT model using the real data, we analyzed 15 items from an advanced English reading assessment. The assessment used three testlets in total. Each testlet contained five MC items, and each item consisted of four options. The data were collected from a sample of 607 undergraduate students in a Chinese University.
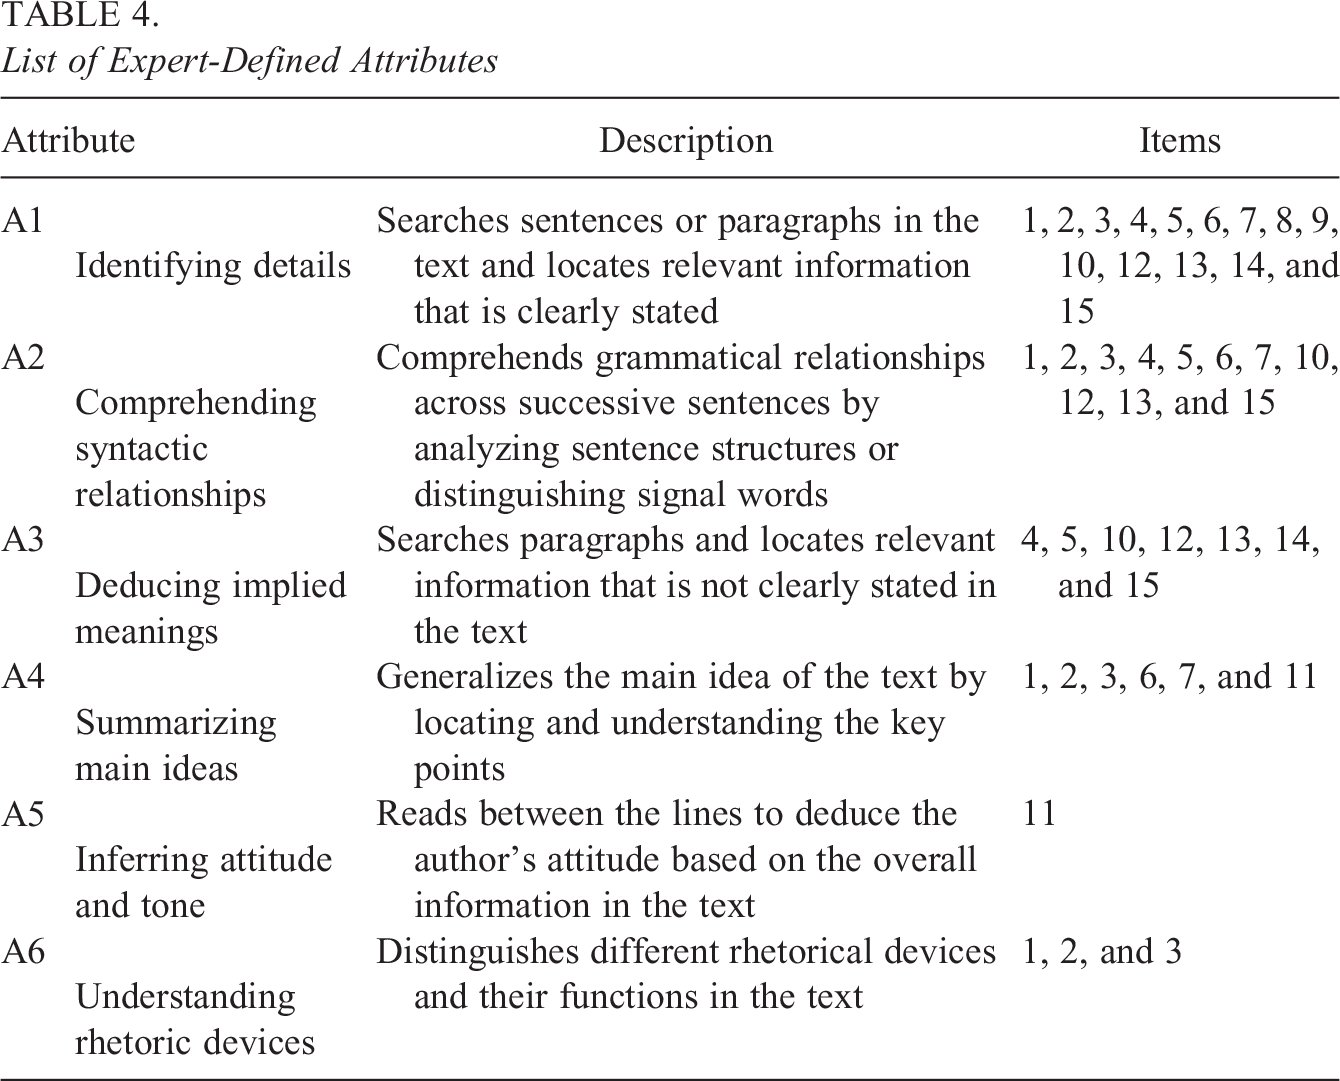
This assessment was developed with consideration of the National Language Standard, China’s Standards of English Language Ability, which is published by the Ministry of Education of the People’s Republic of China and the National Language Commission of the People’s Republic of China, which also serves as a yardstick for English teaching and learning (National Education Examinations Authority, 2018). Four foreign language professors (two of whom were involved in developing the assessment) worked together to develop the required attributes for the assessment. The six attributes that were measured by the assessment were: (A1) identifying details, (A2) comprehending syntactic relationships, (A3) deducing implied meaning, (A4) summarizing main ideas, (A5) inferring attitude and tone, and (A6) understanding rhetoric devices. Q-vectors for the option-level of each item were also specified. Table 4 presents the description of attributes and their affiliations with each item. All four professors agreed that the coding of all 15 items were reasonable and accurate.
List of Expert-Defined Attributes
Details of the
The
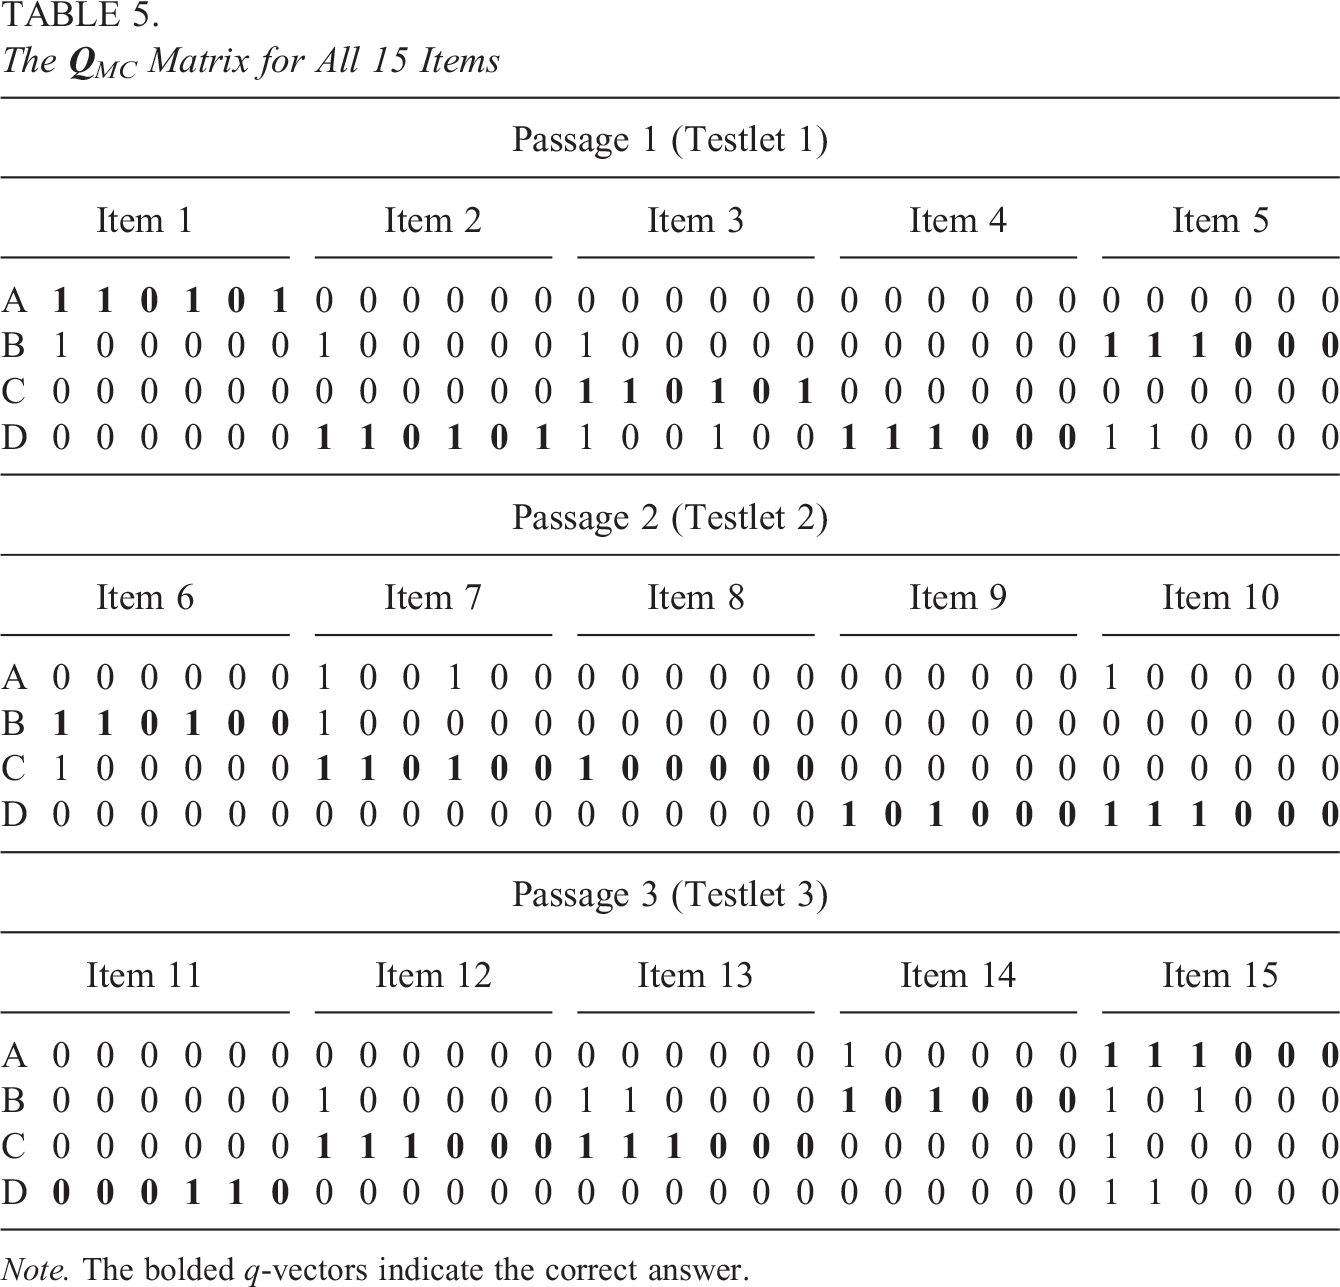
Note. The bolded q-vectors indicate the correct answer.
The Akaike information criterion (AIC; Akaike, 1974) and the Bayesian information criterion (BIC; Schwarz, 1978) were computed for the model fit comparisons. In Bayesian analysis, the AIC and the BIC can be defined as
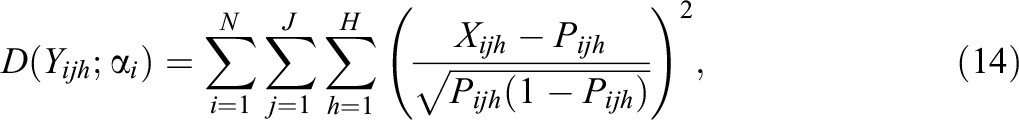
where
6.2. Results
As shown in Table 6, the AIC, BIC, and −2LL values obtained from the MC-CDT model were consistently lower than those obtained from MC1 model, which means that the MC-CDT model was the preferred fit for this dataset. The PPP value of the MC1 model was 0.84, and PPP value of the MC-CDT model was 0.78. This indicates that even though both models fit the empirical data adequately, the MC-CDT model had a better fit than the MC1 model.
Model Fittings in the Empirical Study
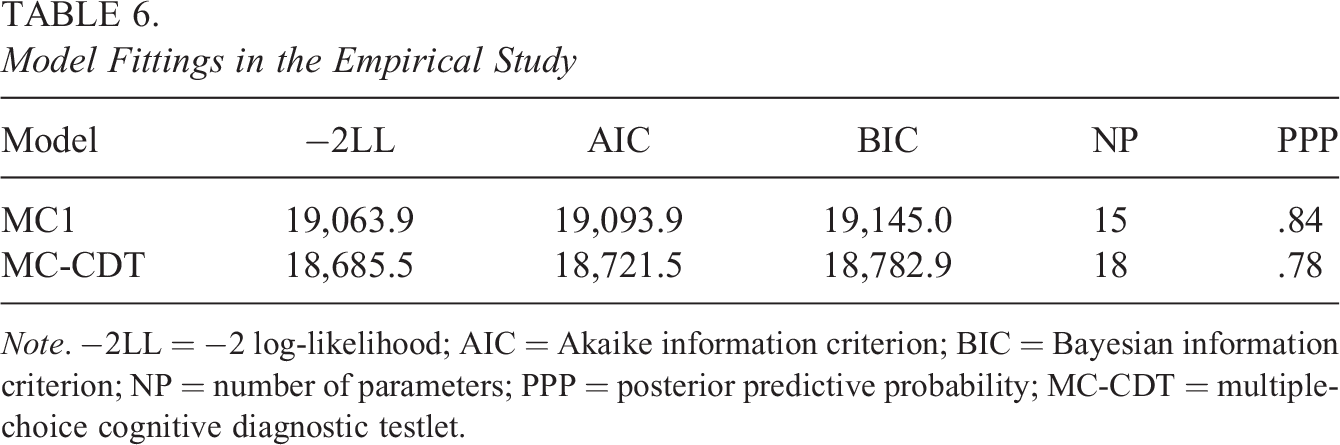
Note. −2LL = −2 log-likelihood; AIC = Akaike information criterion; BIC = Bayesian information criterion; NP = number of parameters; PPP = posterior predictive probability; MC-CDT = multiple-choice cognitive diagnostic testlet.
Table 7 presents the estimated item parameters and the variances of the testlet effect. To compare the item parameter estimates in the same scale, the item parameters (
Estimated Item Parameters (
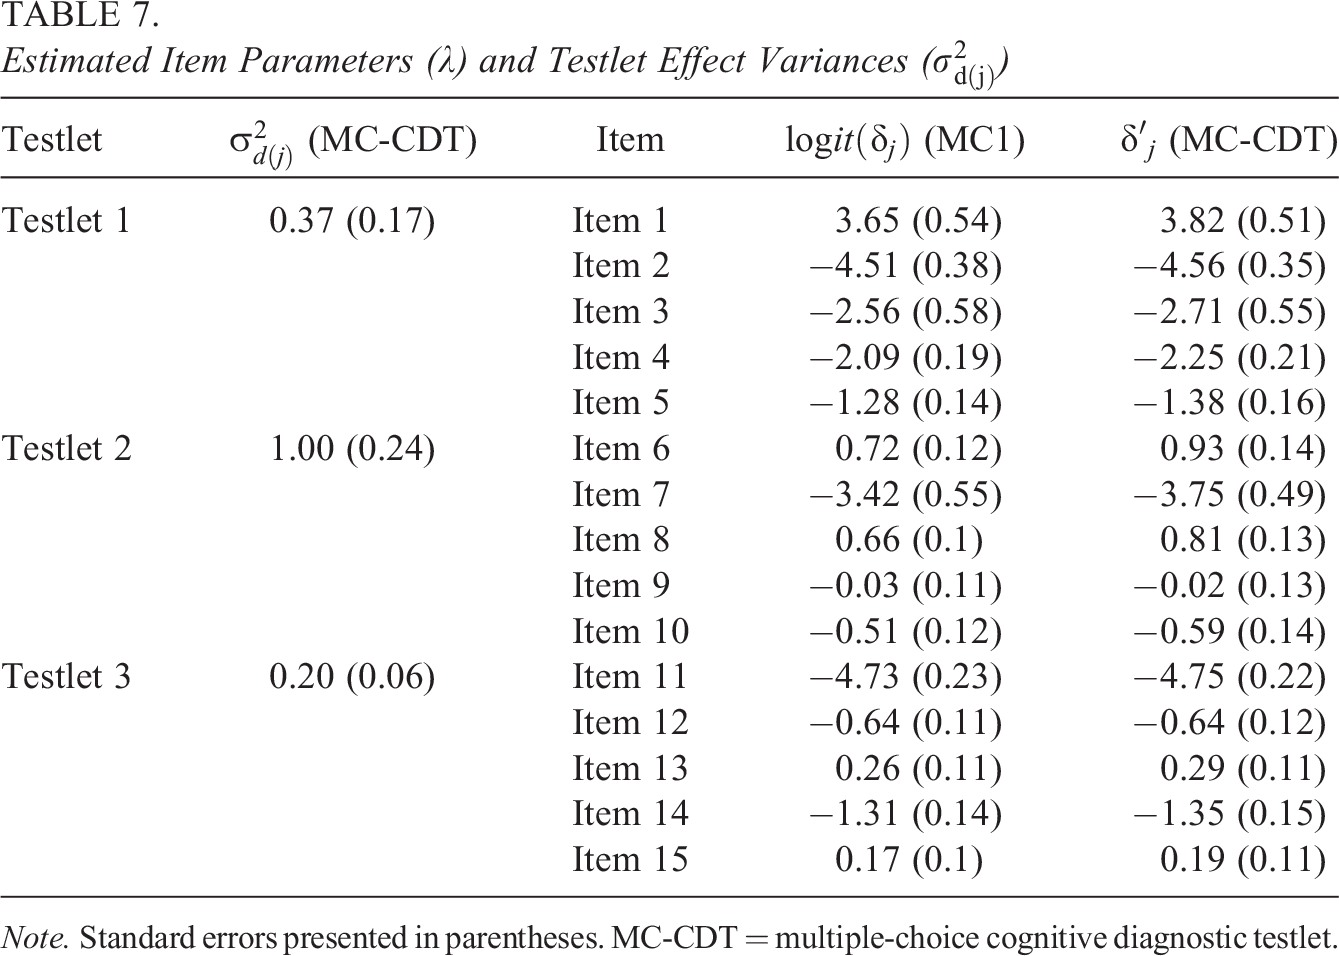
Note. Standard errors presented in parentheses. MC-CDT = multiple-choice cognitive diagnostic testlet.
7. Discussion
Although there are already various CDMs proposed to analyze response data with testlets (Hansen, 2013; Zhan et al., 2018), none of these have shown an ability to process MC data. This article proposes a new CDM for MC items in tests with testlets, the MC-CDT model. The results of Simulation Study 1 demonstrated that the item and examinee parameters in the MC-CDT model could be estimated accurately using a full Bayesian MCMC algorithm. Specifically, the item quality and testlet effects size affected the item and examinee parameter estimations, but the number of testlets had negligible influence. This suggests that test developers should pay more attention to item quality and the degree of dependence between items within testlets. In contrast, the performance of the traditional MC-CDM (MC1 model in the article) was not a favorable fit for testlet-based tests. Bias and RMSE values increased greatly, while the PCCR and AACCR showed a notable decrease. These results indicate that traditional MC-CDMs are not an appropriate fit for MC data involving testlets, which means that to ignore local dependence between items within testlets is inappropriate.
The results of our Simulation Study 2 showed that the MC-CDT model was also suitable for fitting MC data without testlets. The MC-CDT model showed an ability to recover not only item parameters
The results of this empirical study indicate that the MC-CDT model fit real data better than the MC1 model for the MC test using testlets. Moreover, the MC-CDT model can be used to calculate the size of a testlet effect to describe local dependence for each testlet, which cannot be achieved using the traditional MC-CDM model.
Although the MC-CDT model did demonstrate advantages in our two simulation studies and the one real data study, several areas should be explored further in future research. First, the MC1 model was used as the base model in the current research due to its simplicity and feasibility. However, the MC1 model is a constrained model, which strongly assumes that each item contains only one item parameter, so the MC1 model may not be able to solve all problems in reality. Beyond that, another limitation of the MC-CDT model is that it only allows the testlet effect impact the response when
Second, the random-effect testlet structure was integrated into the MC1 model in this article to allow us to analyze the MC data with testlets. However, the fixed-effect testlet model also has certain advantages in terms of describing local item dependence within a testlet (Hoskens & De Boeck, 1997; Tuerlinckx & De Boeck, 2001; Wang & Wilson, 2005). Further studies should be conducted to compare the random- and fixed-effect testlet approaches in MC diagnosis assessments.
Third, the current research only investigated the independent attribute hierarchy structure, and while it considered already existing cognitive diagnostic studies, it did not consider other attribute hierarchy structures, such as linear, convergent, divergent, or unstructured (Leighton et al., 2004). If other attribute hierarchy structures were considered, some possible combinations of attribute profiles may be nonexistent. So, the MC-CDT model should be expanded to integrate it with other attribute hierarchy structures and explore the performance of MC-CDT model. Indeed, de la Torre (2004) has also proposed a method for modeling the joint distribution of a latent attribute vector based on higher order latent traits. It would also be interesting to probe the effectiveness of the HO-DINA model in the context of MC data with testlets.
Furthermore, in the current study, a moderate correlation was conducted within the examinee ability correlation matrix. However, Henson and Douglas (2005) also set as zero to represent independence between attributes. Future research should explore conditions of none, low, or high correlations to further explore the influence of
Finally, as previously stated by de la Torre (2009a), the attribute profiles represented by the distractors should be included in the subset of the attribute profiles corresponding to the key answers. The MC-CDT model must also follow this principle. However, the q-vector of distractors may not necessarily be the subset of the q-vector of the key answer when some of the misconceptions are examined further. In these instances, further investigations using the MC-CDT model may provide interesting insights.
Supplemental Material
Supplemental Material, sj-docx-1-jeb-10.3102_10769986231165622 - Cognitive Diagnosis Testlet Model for Multiple-Choice Items
Supplemental Material, sj-docx-1-jeb-10.3102_10769986231165622 for Cognitive Diagnosis Testlet Model for Multiple-Choice Items by Lei Guo, Wenjie Zhou and Xiao Li in Journal of Educational and Behavioral Statistics
Footnotes
Authors' Note
Declaration of Conflicting Interests
The author(s) declared no potential conflicts of interest with respect to the research, authorship, and/or publication of this article.
Funding
The author(s) disclosed receipt of the following financial support for the research and/or authorship of this article: This work was supported by, National Natural Science Foundation of China (31900793), and Fundamental Research Funds for the Central Universities (SWU2109222).
Note
References
Supplementary Material
Please find the following supplemental material available below.
For Open Access articles published under a Creative Commons License, all supplemental material carries the same license as the article it is associated with.
For non-Open Access articles published, all supplemental material carries a non-exclusive license, and permission requests for re-use of supplemental material or any part of supplemental material shall be sent directly to the copyright owner as specified in the copyright notice associated with the article.