
Abstract
This article introduces a new framework for articulating how educational assessments can be related to teacher uses in the classroom. It articulates three levels of assessment: macro (use of standardized tests), meso (externally developed items), and micro (on-the-fly in the classroom). The first level is the usual context for educational measurement, but one of the contributions of this article is that it mainly focuses on the latter two levels. Co-ordination of the content across these two levels can be achieved using the concept of a construct map, which articulates the substantive target property at levels of detail that are appropriate for both teacher planning and within-classroom use. This article then describes a statistical model designed to span these two levels and discusses how best to relate this to the macrolevel. Results from a curriculum and instruction development project on the topic of measurement in the elementary school are demonstrated, showing how they are empirically related.
The great bulk of theoretical and developmental work in formal educational measurement for the last 120 years has taken place in what is often termed a “summative” context—that is, when students have spent a certain period of time learning about a school subject (the period might range from a month to a year). In this case, the measurement is aimed at being an evaluation of the overall attainment of the child in that subject area. In some situations, the information will be used for great impact, such as part of a prediction of later success at college and so on. This reflects the following dictionary definition: “A summative assessment happens after a student has finished being taught about a subject, for example at the end of a year or unit of work” (downloaded from https://dictionary.cambridge.org/dictionary/english/summative). This sense of cumulative evaluation is seen as being in contrast to a formative context. Here, a similar dictionary definition is: “A formative assessment happens while a student is being taught about a subject, rather than at the end of a year or unit of work, in order to check their progress” (downloaded from https://dictionary.cambridge.org/dictionary/english/formative).
Approaches to formative assessment have been a topic of more recent discussion and research and development efforts. The results from formative assessment can be used for (a) cognitive diagnosis when applied at the individual level and (b) instructional planning support when applied at the group (including classroom) level. One particular thrust of the effort to promote formative assessment was couched within the assessment for learning formulation (AfL; e.g., Assessment Reform Group, 2006; Black et al., 2003; Black & Wiliam, 2009; Harlen, 2006), which was supported by an earlier research synthesis that sought to evaluate the contribution of formative evaluation to student learning (Black & Wiliam, 1998) as well as later meta-analyses (Hattie & Timperly, 2007; Kingston & Nash, 2011). Formative assessment is not a unitary concept, but rather a bundle of strategies that can be useful for promoting learning in the classroom. It has spawned a number of typologies (e.g., Torrance and Pryor, 2001). One such is the following, based on work by Shavelson et al. (2008):
(a) Embedded-in-the-Curriculum Formative Assessment
This includes assessment development materials, such as items and scoring guides, as well as other interpretative materials. [It] comes “ready-to-use”; teachers or curriculum developers place formal assessments ahead of time in the ongoing curriculum to create goal-directed “teachable moments.” These assessments are embedded at junctures or “joints” in a unit where an important sub-goal should have been reached before students go on to the next lesson. Embedded assessments inform the teacher about what students currently know, and what they still need to learn (i.e., “the gap”) so that teachers can provide timely feedback. (Shavelson et al., 2008, p. 301)
(b) Planned-for-Interaction Formative Assessment
This is deliberately planned-for ahead by the teacher, but full assessment development for it (e.g., formal items and scoring guides, etc.) is not usually a part of the material accompanying the curriculum and its assessment. A teacher plans for and crafts ways to find the gap between what students know and what they need to know. For example, while developing a lesson plan, a teacher may prepare a set of “central questions” that get at the heart of the learning goals for that day’s lesson. These questions may be general (“Why do things sink and float?”) or more specific (“What is the relationship between mass and volume in floating objects?”). At the right moment during class, the teacher poses these questions, and through a discussion the teacher can learn what students know, what evidence they have to back up their knowledge, and what different ideas need to be discussed. (Shavelson et al., 2008, pp. 300–301)
(c) Informal Formative Assessment Conversations (also known as “on-the-fly” assessment)
The occasion for these may be deliberately planned-for, but the content is usually determined by the specific happenstances of the classroom conversation. [It] arises when a “teachable moment” unexpectedly occurs, for example, when a teacher circulating and listening to the conversation among students in small groups overhears a student say that, as a consequence of her or his experiment, “density is a property of the plastic block and it doesn’t matter what the mass or volume is because the density stays the same for that kind of plastic.” The teacher recognizes the student’s grasp of density and challenges the student with other materials to see if she or he and her or his group-mates can generalize the density idea. (Shavelson et al., 2008, p. 300)
Yet, despite being a major instigator and contributor to the AfL movement, Paul Black was concerned that the effort was doomed to eventual failure if it was constituted principally as a countervailing force to summative assessment. In his view, the better resolution was to create an infrastructure for schooling that included support for both summative and formative assessments, and capitalized on the virtues of each, while disparaging neither (Black & Wiliam, 2018; Black et al., 2011).
This, then, is the background to the current article. The purpose of this article is to layout a measurement framework that is centrally focused on the idea of encompassing the full breadth of educational assessment contexts referenced above, ranging from the broad summative (“macro”) testing of school subjects through the two levels of formative assessments that operate in the classroom setting (“meso” and “micro”). The next section of this article builds on the discussion above and provides more detail on the three levels of grain-size formulation, but focusing on the two formative levels. The section that follows concentrates on the requirements for the definition of the underlying construct of the measurement—utilizing the idea of a “construct map” as a way to bind the two levels (meso and micro) together. The next section focuses on the statistical model that is used to link together the assessments at each of the two levels, and this is followed by a section on the relationship of this model to a statistical model for the macro level. In order to illustrate the framework in a way that is strongly contextualized in the classroom environment, assessment at each of the two levels will be exemplified within a specific education research and development project—the Modeling Assessment to Enhance Teaching and Learning Project (Modeling Assessment Project for short). This article concludes with a brief recapitulation of the paper followed by a reflection on what are the next steps and what are the ultimate aims of this approach.
Three Levels of Educational Assessments
As mentioned above, the level of assessment most commonly associated with statistical modeling in education is the periodic testing of school subjects using standardized tests, such as in Language Arts, Mathematics, Science, and Social Studies. These types of testing are representative of the macro level of assessment, which is also called “summative testing.” The topics of the tests are typically quite coarse composite constructs, such as the traditional school subjects noted above, but also newer topics (the so-called 21st-century skills), such as argumentation and reasoning. These tests are largely used for important decisions outside of the immediate classroom context, by teachers, parents, administrators, and/or policymakers. They are used over relatively longer education time periods (years, semesters, program length, etc.) for relatively large-scale decision-making, such as passing a course, grade advancement, course-placement, and so on or in predictive contexts. Sometimes, they are used at an individual level, for decision-making about particular students and sometimes in aggregate in program evaluation situations.
However, if we wish to design measurements that aspire to the level of “accountable assessment”—that is, as assessments that provide “actionable information for improving classroom instruction”—then this narrow conceptualization must be extended (Lehrer, 2021). Moreover, following the discussion above about the importance of formative assessments and on the basis of the empirical results from research syntheses noted above, one must seek measurements that are more closely aligned with the actual instruction and learning that takes place in the classroom. In order to do so, I will distinguish a further two levels of measurement, each associated more closely to classroom activities. For most of the rest of this article, we will concentrate on just these two more basic levels but will return to discuss the macro level in the section after next.
The level most closely related to the macro level is the meso level of measurements: This is focused on a grain-size of topics that will generally occur within a school subject and that are the focus of a teacher’s instructional practices within the school quarter or semester, at the level of instructional planning. For example, in an elementary school mathematics curriculum, the topic area of arithmetic has traditionally been subdivided into distinctive topics, such as whole number operation and rational number. Commonly, textbooks written for school subjects are divided into these content-focused topics, such as those mentioned in the previous sentence for arithmetic, and often, they also include assessment items that focus on those subtopics (sometimes referred to as being “at the back of the book” and used as homework exercises by teachers). The focus in this article will be on a different way to organize the subtopics than that traditionally used in school textbooks—this principle of educational organization is referred to as a “learning progression” and that concept will be described in the next section. Moreover, rather than being deployed merely as distal aspects of the educational activity (e.g., as homework activities), the items will be used as embedded-in-the-curriculum formative assessments. At this meso level, a crucial aspect of teacher support will be the provision of curated items (and more generally, sets of items within “tasks”) that are coordinated with rich descriptions of the skills and knowledge that students are expected to learn.
However, most often, these midrange measurements obtained with curated items do not go to a finer grain-size, and hence, they can miss out on perhaps the most crucial and active level of interaction between a teacher and their students. This is the daily theater of instructional activities orchestrated by teachers for students, including individual and small group work, whole-class conversations, and an ensemble of products and investigations of varying duration. This is focused on cognitive diagnosis and characterized in this article as the micro level of measurement. Here, at this level, one can see events that fall into the planned-for-interaction formative assessments mentioned in the introduction as well as the informal conversational formative assessments also mentioned there. The nature of the assessments at this level will, of necessity, be more adaptive and more fleeting, but the crucial feature they must have in common with the meso level assessments is that, in order that the information obtained about the student is cumulative, the assessment prompts and the teacher interpretations of responses are concordant with the specific learning progressions used at the meso level. While the items and tasks used at the meso level are prespecified, those at the micro level will vary from day to day and topic to topic and teacher to teacher and also at the teacher-to-student level, so that in the formulation at this level, the items are not prespecified.
A Model of the Construct for the Meso and Micro Levels
In order to enable measurement at both the meso and micro levels, one must have a specification of the underlying construct that is amenable at the two levels. To accomplish, we use the concept of a learning progression, which is composed of …descriptions of the successively more sophisticated ways of thinking about an important domain of knowledge and practice that can follow one another as children learn about and investigate a topic over a broad span of time. They are crucially dependent on instructional practices if they are to occur. (Center for Continuous Instructional Improvement, 2009)
The ideas behind a construct map are drawn, in part, from research on the foundational cognitive structure of the assessment domain, but, importantly, also from educators’ professional views about the nature of higher and lower levels of performance, and how it is manifested in student work. These construct maps do not represent complete and detailed theories of learning, but instead, are designed to focus on aspects of learning that can help with the next instructional steps in particular content areas. Construct maps delineate how children’s thinking usually develops. They are intended to be intelligible and practical for teachers; they summarize important characteristics of student thinking, but like all models, leave out less common details. They can help teachers identify immediate “next steps” in student thinking, so that teachers can plan reasonable approaches to orchestrate student learning without having to manage overwhelming levels of information (Kim & Lehrer, 2015).
We illustrate the concept of a construct map using a construct drawn from the example used in the following, the modeling assessment project. The construct is called theory of measurement length (ToML): It describes how children (in the elementary school grades) come to constitute a theory of measure to compare magnitudes (extents) of lengths. The construct map for ToML is illustrated in Figure 1. Most often in achievement assessment, the construct will be conceptualized as describing successive points in a process of change, and the construct map can then be thought of as being analogous to a qualitative “road map” of change along the construct (see, e.g., Black et al., 2011). In recognition of this analogy, these qualitatively different locations along the construct are called “waypoints”—and these will, in what follows, be very important conceptually and useful in interpretation. Each waypoint has a qualitative description in its own right (as in Figure 1), but, in addition, it derives meaningfulness by reference to the waypoints below it and above it. The main series of waypoints is shown on the left-hand side of the figure, but each can be broken down into a finer categorization, as is shown for Waypoint 2 (ToML 2) on the right-hand side of the figure. We assume that the respondents can (in theory) be at any location in between those waypoints—that is, the underlying construct is dense in a conceptual sense.
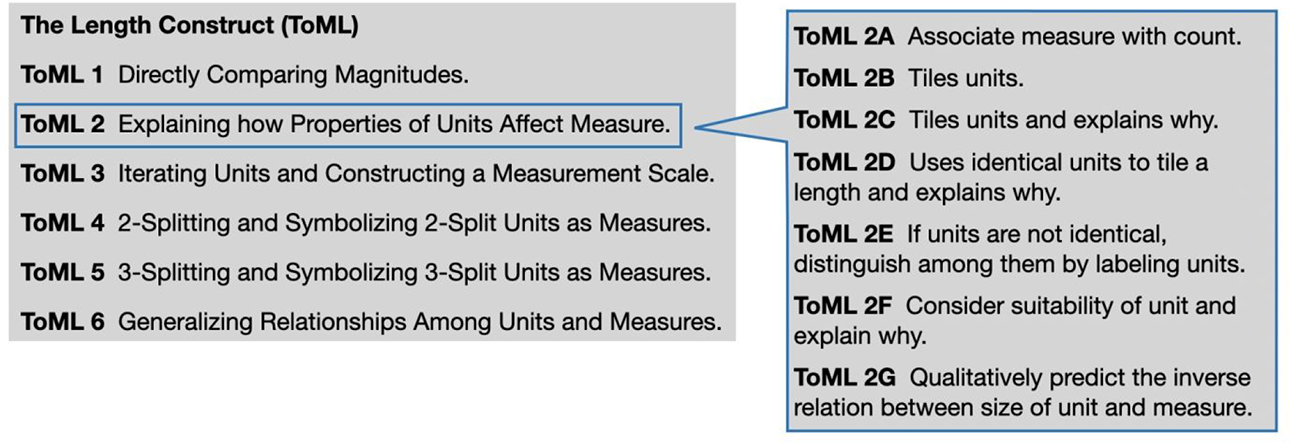
The construct map for theory of measurement length.
Moreover, although the map has a tabular structure that highlights performances associated with a waypoint that are readily discernable in classroom learning activity, in practice, conceptions emerge as an increasing coordination of these performances. For example, the compensation relation between measure and unit-length for a fixed magnitude of length in ToML 2G becomes more intelligible as one grapples with how and why the tiling (i.e., laying out unit-lengths along an object) of a length ensures consistent measure, as described in ToML 2B and ToMl 2C. Waypoints and associated performances also signify to teachers a penumbra of associated students’ ways of thinking, of which the waypoints and performances represent disciplined resolutions. For example, students who do not tile units have sensible reasons for not doing so, and to avoid recourse to ritual, a teacher stages situations in which the consequences of “gaps and laps” among units for the measure of a length become more visible to students (e.g., substantial variation in the measure of a fixed magnitude of length).
The right-hand side of Figure 1 gives a detailed account of the characteristics of student understanding that becomes increasingly coordinated (DiSessa & Sherin, 1998) at the second waypoint. An additional perspective is gained by noting the succeeding waypoint, where students’ understandings of the role of properties like tiling are resources for new challenges, such as those involved in repeated translation of a unit (as a practical matter, how does one avoid gaps and (over)laps?) and its symbolization on a scale of measure.
A crucial component of a construct map is the empirical research on how students respond to instruction or perform in practice (NRC, 2001), including in typical testing situations, as well as in classroom-embedded contexts. The construct map can be seen as a “boundary object” mediating between the assessment and the instruction that a teacher might devise based on the assessment outcomes, but also a mediator between the assessment developer and the curriculum structure that defines the context in which the assessment will be used (Fisher & Wilson, 2019; Lehrer et al., 2014).
The construct map is a core feature of the approach we adopt here, articulating the continuity of the underlying construct through both the micro and meso levels of the assessment. Construct maps have a second role as well, being the basis in terms of “what is being measured” for both the development and interpretation of the ways that data are gathered in the assessments. With this foundation of the construct, data can then be gathered at both the meso and the micro levels, and the resulting information must then be combined using a statistical model, to yield measurements—this is the focus of the next section.
A Statistical Model for the Meso and Micro Levels
The statistical model governing the measurement calibration for the meso level of assessment is specified as follows. (For simplicity, it will be assumed that the items to be used are dichotomous.) Consider first an item i, one of a set of I items that have been subjected to a rigorous quality-control procedure, with Xi
=1 indicating success on the item, and Xi
= 0 indicating failure. Then, for student p with ability θ
p
taking item i, of difficulty
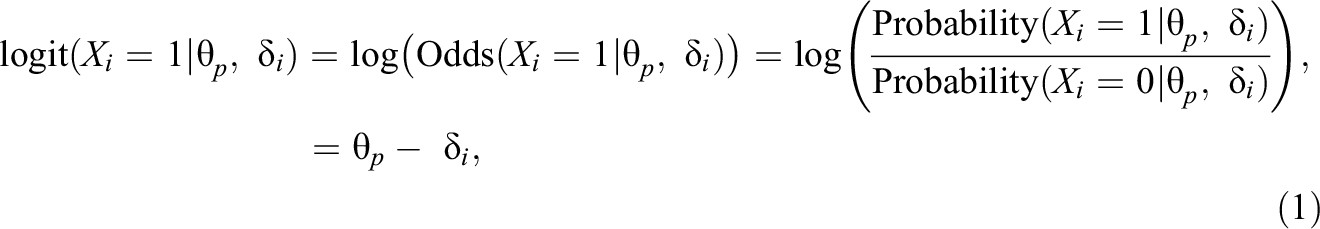
for i = 1,…, I, and where
The crucial connection between this statistical model and the model of the construct described in the previous section (i.e., the construct map) is the delineation of segments of the ability, θ, as corresponding to waypoints in the construct map—these segments are called bands. These bands are represented graphically using a Wright map, which relates the student distribution to the waypoints and the items (an illustration is given in Figure 6). The successful development of this representation pertains to the validity of both the construct map and the instrument(s) developed to measure the underlying construct. This is an empirical rather than statistical operation so will not be described here, but rather it will be exemplified in the section describing the modeling assessment example.
Passing now to the micro level, the equivalent expression is somewhat more complicated, as follows. Here, we are modeling an assessment occasion, n, for each teacher t. Here, this is not a fixed item, as it was for the meso-level situation, but is comprised of a set of observation situations selected (by teacher t) for that day. The rating of the response of student p for occasion tn (i.e., the nth occasion rated by teacher t) is indicated by Xptn
, and we assume the rating is dichotomous, as for the item in Equation 1. The harshness of teacher t on that occasion is parameterized by

For simplicity’s sake, we can renumber the teacher-occasions consecutively, and index them by k = I + 1,…, I + K, where K is the total number of teacher-occasions, so that Equation 2 becomes:

In fact, although these are useful separately (and we will make direct use of Equation 1, as shown in Figure 6), what we ultimately want is to be able to compare across the two situations, and hence, we need a single expression for that:

where
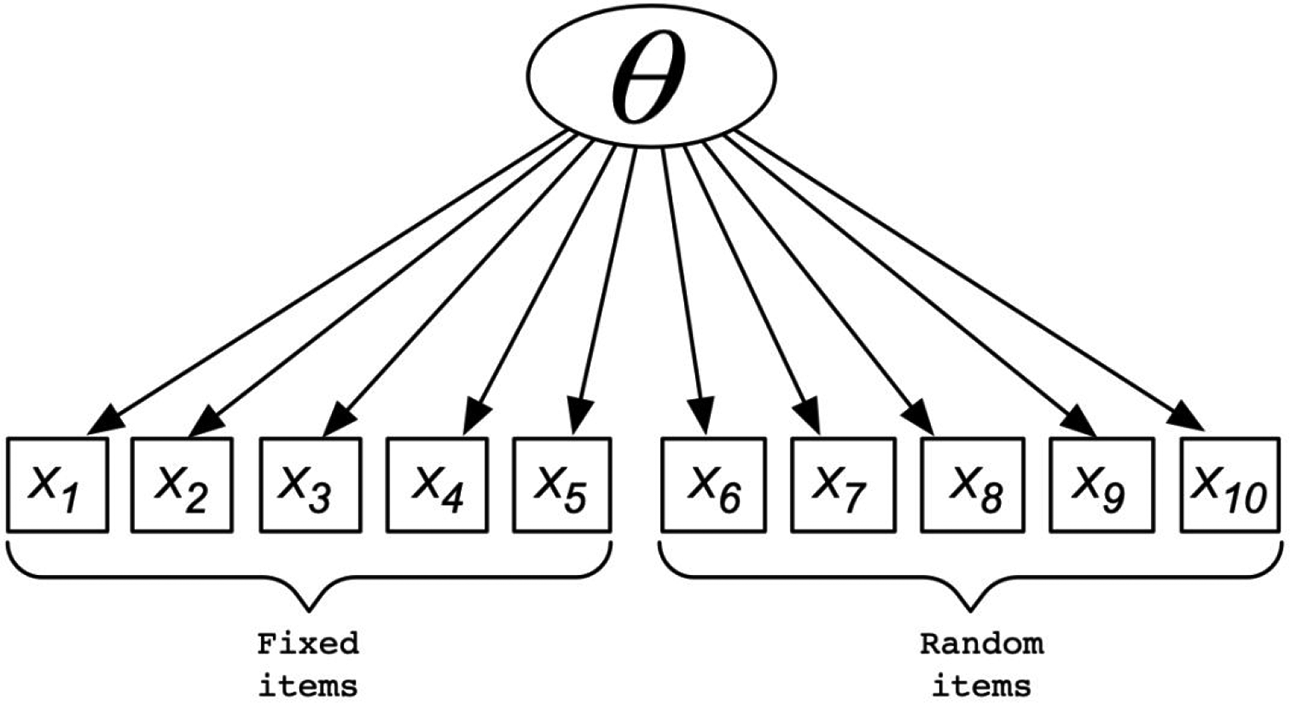
A diagram of the model in Equation 4.
In this formulation, the teacher parameter is best interpreted as a rater harshness (i.e., the higher the value, the harder it is to get the positive outcome for this student). The teacher is seen as interpreting the cognitive variable under measurement—this will be instantiated in the form of the “construct map” in the next section of this article.
We estimate this model using the rstan package (Stan Development Team, 2022b) in R (R Core Team, 2022), which provides an R interface to Stan (Stan Development Team, 2022a). Stan is a C++ library intended for Bayesian estimation that uses the No-U-Turn sampler (Hoffman & Gelman, 2014). A small simulation study was designed to check that this estimation was working satisfactorily. It is described in Appendix A.
Incorporating the Macrolevel Statistical Model
The macro level of assessments has been largely absent in the account above, but as promised, we return to it here. This is because we have been primarily interested in coordinating the assessments that are most effective at bringing about change in educational settings (as was established in the research syntheses mention in the introduction). However, it would be remiss not to include the macro level in the formulation we have discussed here, as it is nevertheless very important for many purposes in society having to do with education (certification, promotion, entrance decisions, etc.). The traditional form of a macrolevel subject achievement test in education is to include a relatively large number of items, each of which is related to one of the topics within the subject.
For example, in the case of a typical State Science test, the underlying construct across the whole test might be thought of as “science achievement,” with the science content taken as being what is being taught at a particular educational level in which the topic areas of, say, (a) life science, (b) earth and space science, and (c) physical science are the most salient parts of the syllabus. From this perspective, the property itself can be thought of as having a multiple dimensional nature (i.e., because the curriculum concentrates on different topics), but also the test that is designed to measure that property will, typically, be composed of three subsets of items, one for each of the three topic areas. In practice, both of these levels of interpretation will be of interest: (a) A principal in a school, or other higher level administrator, will most likely be interested in the coarser level—What is the science achievement of students in my school, my region, and so on? In contrast, (b) a science teacher, when thinking about what needs to be taught next, would be more likely to want information at the finer grain-size—Which topic needs closer attention? How are students thinking about a particular idea? Thus, the question of how best to frame the analysis and interpretation of the results from using this test, one is left with a somewhat unclear resolution—focus on the “whole” or focus on the “parts”?
In attempting to answer this question, Wilson and Gochyyev (2020) have proposed that by employing a hybrid statistical model—which they call the composite model—one can avoid having to make a decision to favor one sort of interpretation over the other, and, have assessment reporting that is useful and valid for both purposes. The hybrid model they propose is one that is both reflective and formative: (a) A test is reflective if it assumes that the item outcomes are caused by an underlying construct (as was the case for the models in Equations 1 and 4), while (b) a test is formative if the item outcomes can be combined to estimate the measurement. For example, in the assessment modeling project described in the following used a reflective approach: The responses to the meso-level items and the micro-level teacher observations of student behavior are both modeled as being due to (i.e., reflective of) the underlying construct.
The question then is, when one wants to calibrate the next, coarser, grain-size in terms of outcome variable, say measurement, what is the best way to go about that? Technically, one can simply apply an enlarged reflective approach—using a version of Equation 1 with more items, in a willy-nilly fashion ignoring the content relationships that have been established with such care during developmental stages. There are other reflective techniques that can be structured according to subtopics, such as hierarchical modeling, bifactor models, and multidimensional models, but each has their pros and cons. Pondering on this, Wilson and Gochyyev (2020) see a virtue in not applying the reflective logic at this macro level, as the focus on the instructional practices of teachers bringing about the student learning is principally focused on the topic level rather than on the subject level. That is, although the educational system has “science” teachers, this is mainly an administrative classification: What the science teachers do, and what the science students learn is focused on the topic level and on students’ conceptions of these topics. 1
An illustration of a composite model is shown in Figure 3. Here, the items are represented by the boxes, and the three underlying constructs are represented by the three circles in the middle rung of the diagram (each representing, say, life science (= “L”), earth and space science (= “E”), or (c) physical science (= “P”): The constructs each are seen as causing the item responses, shown by the arrows going from the circles to the items. Then, the composite construct (say, science) is represented by the circle at the bottom, and it is caused by the combination of the three science topics, as is represented by the arrows going from the each of them to the circle at the bottom.
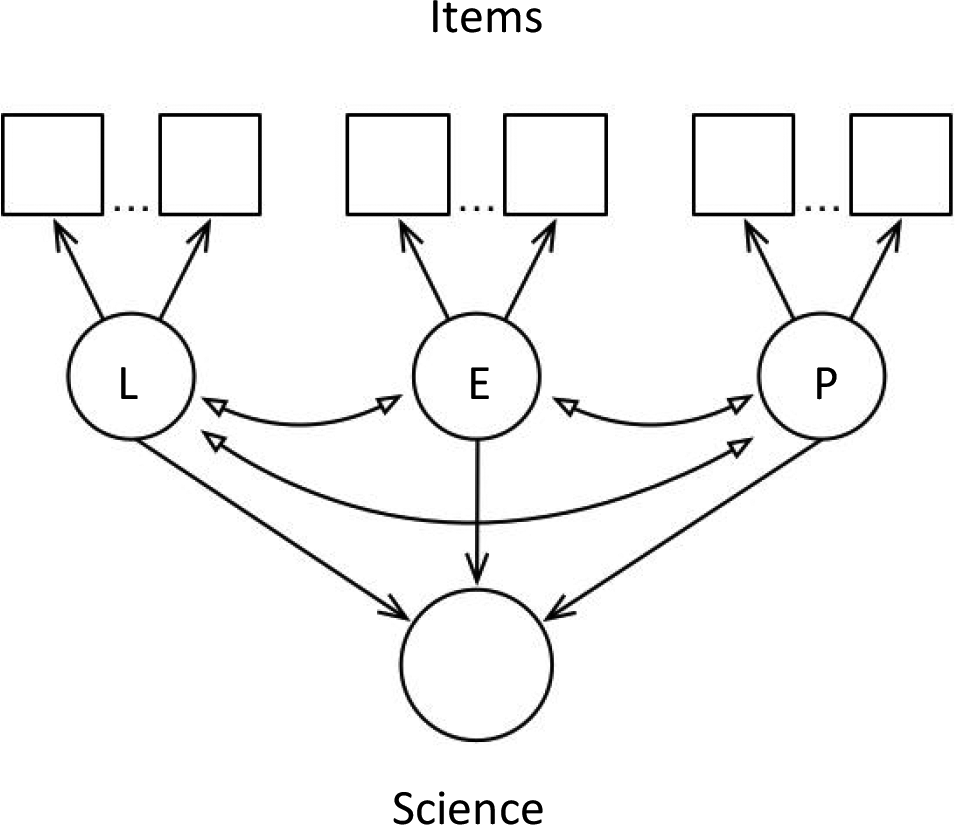
Representation of the composite model (for symbols, see text).
Thus, using the composite model, one can maintain the usefulness of the construct maps at the topic (meso), and at the same time, selected outcomes from the meso level can also be used for summative purposes at the macro level.
Illustration of the Framework in an Educational Context
The data to be used as an example in this article is from the NSF Collaborative Research Project Modeling Assessment to Enhance Teaching and Learning (abbreviated as modeling assessment), which was a collaboration among: Richard Lehrer, Leona Schauble, and Corey Brady from Vanderbilt University and Mark Wilson and Perman Gochyyev from the University of California, Berkeley. The purpose of the project was to create and test out a novel assessment system designed to address two coordinated purposes: to provide ongoing, instructionally productive evidence to teachers about student learning in the context of learning progressions, and to link dense information from student work products and student talk in situ, including student responses to formative assessments, relating the micro level to the meso level assessments in new models that generate robust estimates of the growth of student learning.
The specific topics of instruction across the elementary grades (K–5) are the measures of length, area, volume, and angle, and the use of conceptions of measure as an entrée to the arithmetic of rational number (i.e., fractions as measured quantities and fractions as operators on measured quantities). Children’s progressive elaboration of conceptions of measure over time are organized as constructs (Wilson, in press). As noted above, the focus here will be on the construct ToML, which was described in the text above associated with Figure 1.
The BEAR assessment system (BAS; Wilson, in press) was used as the developmental framework for all of the assessments. It includes four “building blocks” to help address the challenges for good assessment: (a) the construct map, (b) the items design, (c) the outcome space, and (d) the statistical model. These building blocks are seen as being used in a specific cyclical sequence during assessment development, a cycle that may iterate. For a detailed account of instrument development through these building blocks, see Wilson (in press).
The first building block, the construct map, has been described above, and the construct map for ToML has been shown (see Figure 1) and discussed. Thus, the following text is devoted to the other three building blocks, starting with the meso level instrument, as that is used to develop the bands for ToML, followed by the microlevel instrument.
Mesolevel—BEAR Assessment System Software (BASS)
The items design (building block 2) is a plan for systematic observations using assessment tasks or activities, which are aligned with the waypoints of the construct map. The BAS can utilize a wide range of styles of assessment tasks, including tasks that involves student readings, laboratory exercises, interactive exercises, individual and group challenges, and data interpretation questions. The range and contents of the instructional practices used in the curriculum should be reflected in the items, and the items must be placed in appropriate spots to adhere to the “rhythm” of the instruction. They should occur when it makes instructional sense to include them, typically where instructors want to know how much progress their students have made on a specific topic. This brings the content-depth and topic-relevancy of curriculum development into assessment and, at the same time, instills the discipline and hard-headedness of assessment data into the design of instruction.
In the modeling assessment project, items such as the one shown in Figure 4 were designed to be used at the meso level. This item is focused on the transition from Waypoint 1 to Waypoint 2—see Figure 1 for the description of these waypoints (note that student design of “foot-rulers” was a commonplace in the modeling assessment classrooms). As noted above, this is the level of assessment for teaching and tends to deal with the contents of broader standards. Specifically, it relates to what one might call “teachable constructs,” such as, for example, buoyancy, variability, or measurement. They can be used by teachers to put together tests, and the results would be used by teachers, and, when mature enough, students themselves. Typically, they might be used at instructional-scale time-periods and up (i.e., days, weeks, teaching units, etc.) for making instructional decisions, such as planning for a day/week’s topics, what topics to revisit, which students need extensive help, and so on. The BASS meso items were developed and delivered using the BASS (Wilson et al., 2019).
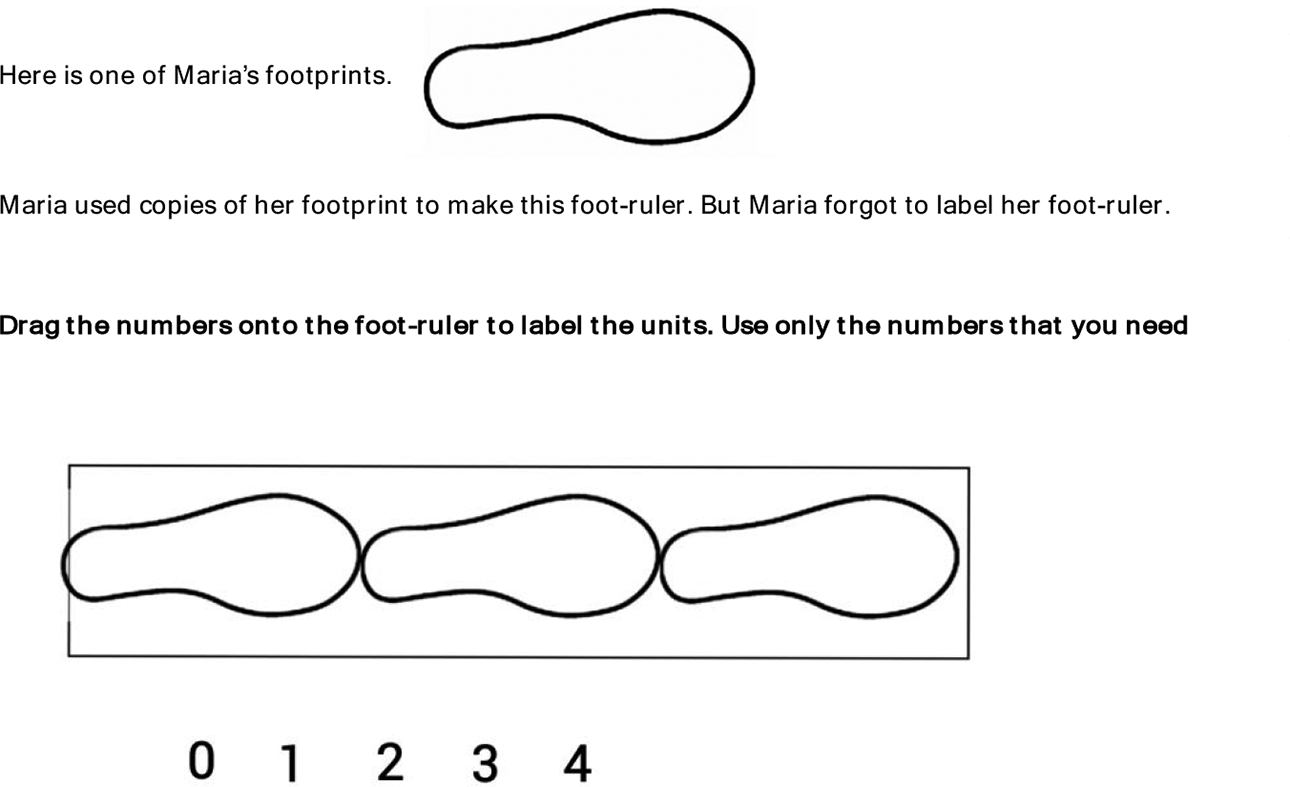
The “footprint” item: An example meso level item for theory of measurement—length.
The outcome space (building block 3) is a mapping from the student responses to the waypoints in the construct map. Consider the mesolevel items, which were delivered in BASS. In selected response items, this can be specified quite exactly, with the item developer being charged with allocating each alternative selection to a waypoint (although informal responses must also be dealt with). Constructed response items demand a more complex set of rules, often called a “scoring guide,” which is a more detailed version of an outcome space, focused on an individual item. For example, the scoring guide for the footprint item (which was shown in Figure 4) needs to specify “appropriate” positions for each required label (from incorrect to ToML 3C), as well as giving examples for misplacement and so on (see Figure 5). As such, each scoring guide must include a somewhat elaborated version of the construct map, allowing for the fact that some waypoints that may not be present in some items, as well as complications where there is more than one way for certain waypoints to be manifested.
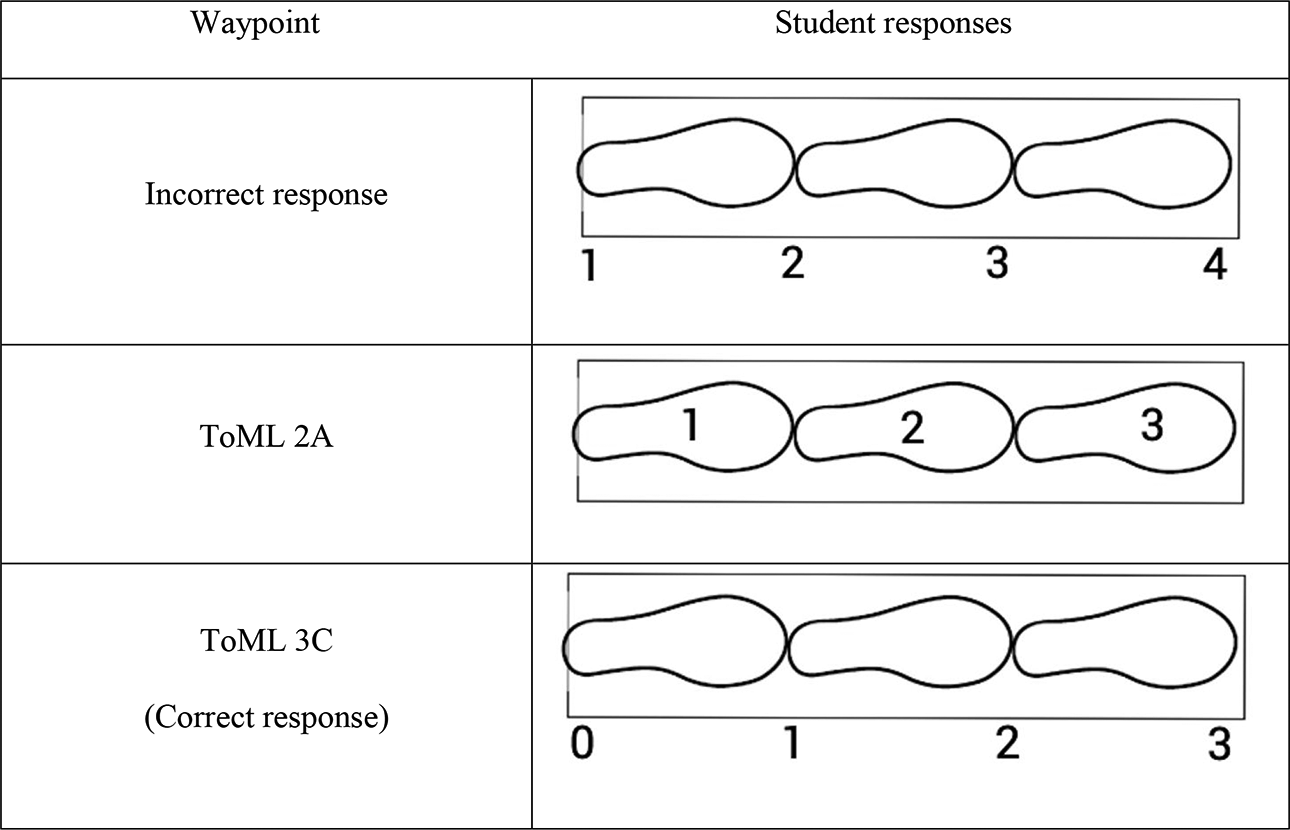
The scoring guide for the “footprint” item.
The statistical model (building block 4) governs how the data collected from the items is scaled to allow the results to be compared back to the original intended construct, as expressed in the construct map. Often, this will result in edits and deletions among the items, but sometimes, especially in the initial iterations of the development cycle, this process may result in reforms to the construct map itself. The statistical models were discussed above and shown in Equations 1 and 4. For the Equation 1 model (the Rasch model), its application in educational measurement is familiar enough, and the statistical features well-developed enough for use in classroom-based assessments in a fairly routine and feasible way, with accompanying software that is available to be used by district- and school-based professionals and classroom teachers (Wilson et al., 2019).
In a first round of analyses for the modeling assessment data, a polytomous version of Equation 1 (the partial credit model; Masters, 1982), estimated using the ConQuest software package (Adams et al., 2020) was applied to each of the four constructs—we will examine only the ToML case here. Responses were gathered in 2019 from 282 students in Grades 2 through 5 from several schools in the U.S. South on 15 meso level ToML items. 2 The results are displayed in Figure 5 using a Wright map, which simultaneously shows estimates for both the students and items on the same (logit) scale. On the left-hand side of the Wright map, the distribution of student abilities is displayed as a histogram (on its side), where ability entails knowledge of the skills and practices for ToML. The student abilities have a roughly symmetric distribution. On the right-hand side are 15 columns showing the thresholds for 15 items in ToML (where Items 1 and 7 are polytomous—that is, for these two items, the student responses can point to more than one level of the ToML construct map). The thresholds 3 for each item are represented on the Wright map using the label “ToML Wk,” where W represents the ToML waypoint of that item and k represents the finer-grade coding illustrated on the right-hand side in Figure 1.
The results displayed in the Wright map in Figure 6 were used to check for consistency with respect to waypoints of the thresholds across 15 items. We used a standard-setting procedure called “construct mapping” (Draney & Wilson, 2011) to develop cut scores as boundaries between the sets of thresholds for each of the waypoints. Following that process, we found that the thresholds fall quite consistently into the ordered levels from ToML 1 to ToML 5, with a few exceptions at the borderlines between the boundaries for the waypoints (i.e., see horizontal lines across Figure 6). This finding is a primary piece of validity evidence for the internal structure validity of the ToML instrument (Wilson & Lehrer, 2021).
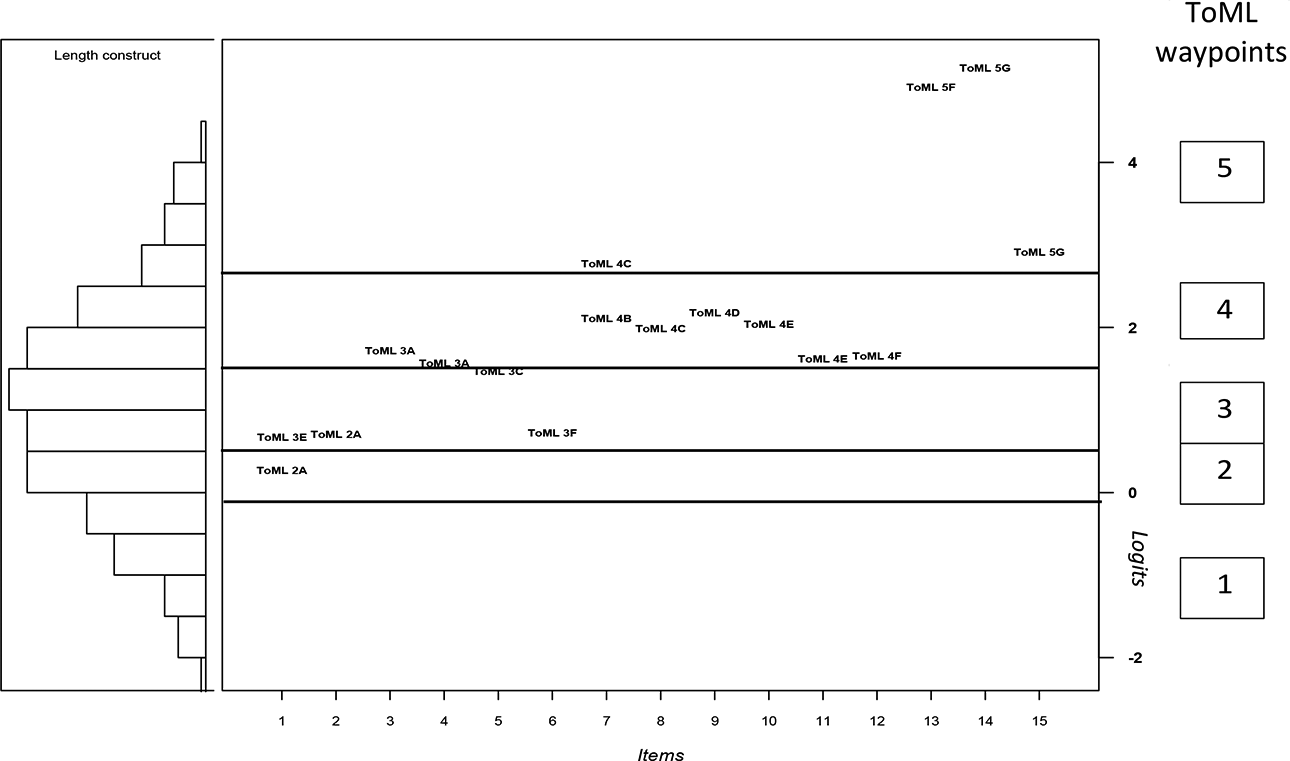
The ToML Wright map.
Having established these cut points between ToML levels based on mesolevel items, we also can use purpose-built BASS reports such as the Group Report shown in Figure 7, which lays out the distribution for a whole class across the ToML Waypoints 1 through 3 (the student names are left out for privacy). In these reports, the estimated student location is noted as a black dot, and a 66.7% (i.e., 1-sigma) confidence region is shown around that location. Here, we can see that this class extends from Waypoint 2 to Waypoint 3, just bordering on Waypoint 4.
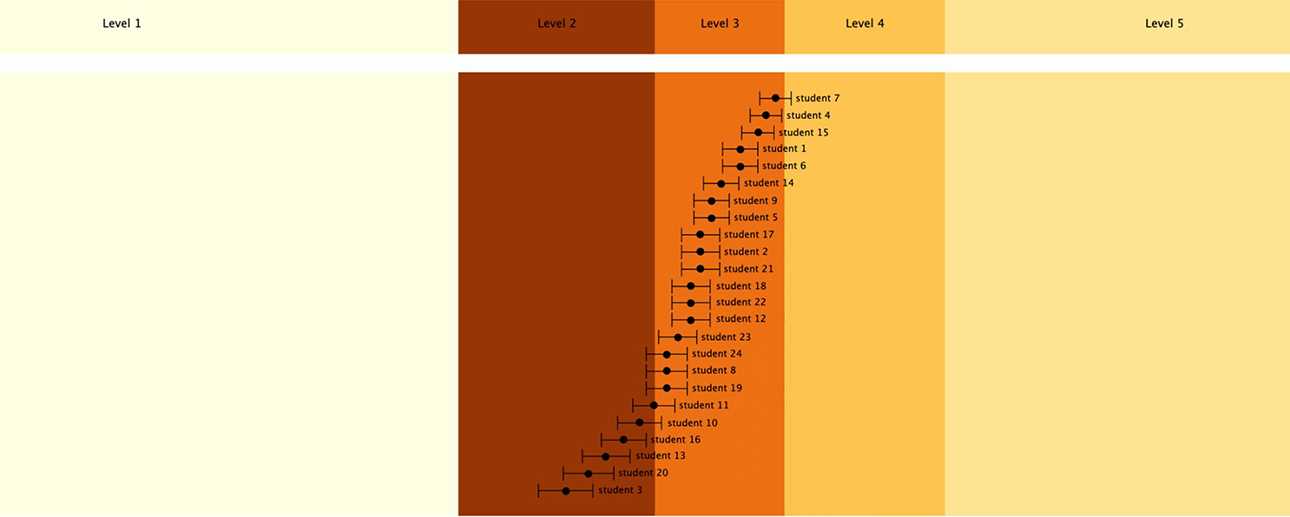
A BEAR assessment system software group report for a class.
Microlevel—Teacher Observation Tool (TOT) Software
Turning now to the micro level, a different approach to items design is needed. In the modeling assessment project, this level was primarily encountered in two ways. One consisted of teachers’ use of student responses to selected BASS meso-level items (as in Figure 4), which teachers took as evidence of student thinking consistent with particular waypoints and associated performances. This occurred in formative assessment conversations, during which teachers juxtaposed distinctive student responses to an item with the aim of elaborating and understanding better how students were thinking about a particular waypoint and to help students compare their way of thinking with that of other students. For example, in one such conversation, students contested the meaning and location of zero on a scale with paperclip units of length measure. Teachers would make observations about the positions that students took, and the arguments they made. Clearly, this way of gaining information is different than that that derives from simply scoring the BASS items (i.e., as in the meso-level usage of the items)—the situation is fleeting and the judgment by the teachers is contingent on their appreciation of the whole classroom prospect at the time, but nevertheless, evidence can be recorded about it—videos/photos and voice recordings can be made, and teacher judgment recorded.
A second form of teacher judgment was based on in situ observation of student talk and work products during the course of instruction. In this spirit, the project, led by C. Brady, developed the TOTs, 4 a web-based tool kit implemented on iPads. The tool kit allows teachers to record and store evidence of student thinking (typically video, photo, and field notes) that they observe during the course of instruction and to associate this evidence with particular waypoints and associated ways of student thinking for one or more constructs by means of a built-in coding system based on the construct maps. A screenshot from this software is shown in Figure 8. It shows a still from a video taken by the teacher, the teacher’s note, the teacher’s selection of the relevant ToML waypoint (TOML 2), and associated performances (e.g., ToML 2C) is highlighted, as is the teacher’s attribution to a student (a pseudonym). The class roster is truncated for the purposes of illustration). When warranted, a sublevel (e.g., ToML 2C) can be attributed to multiple students.
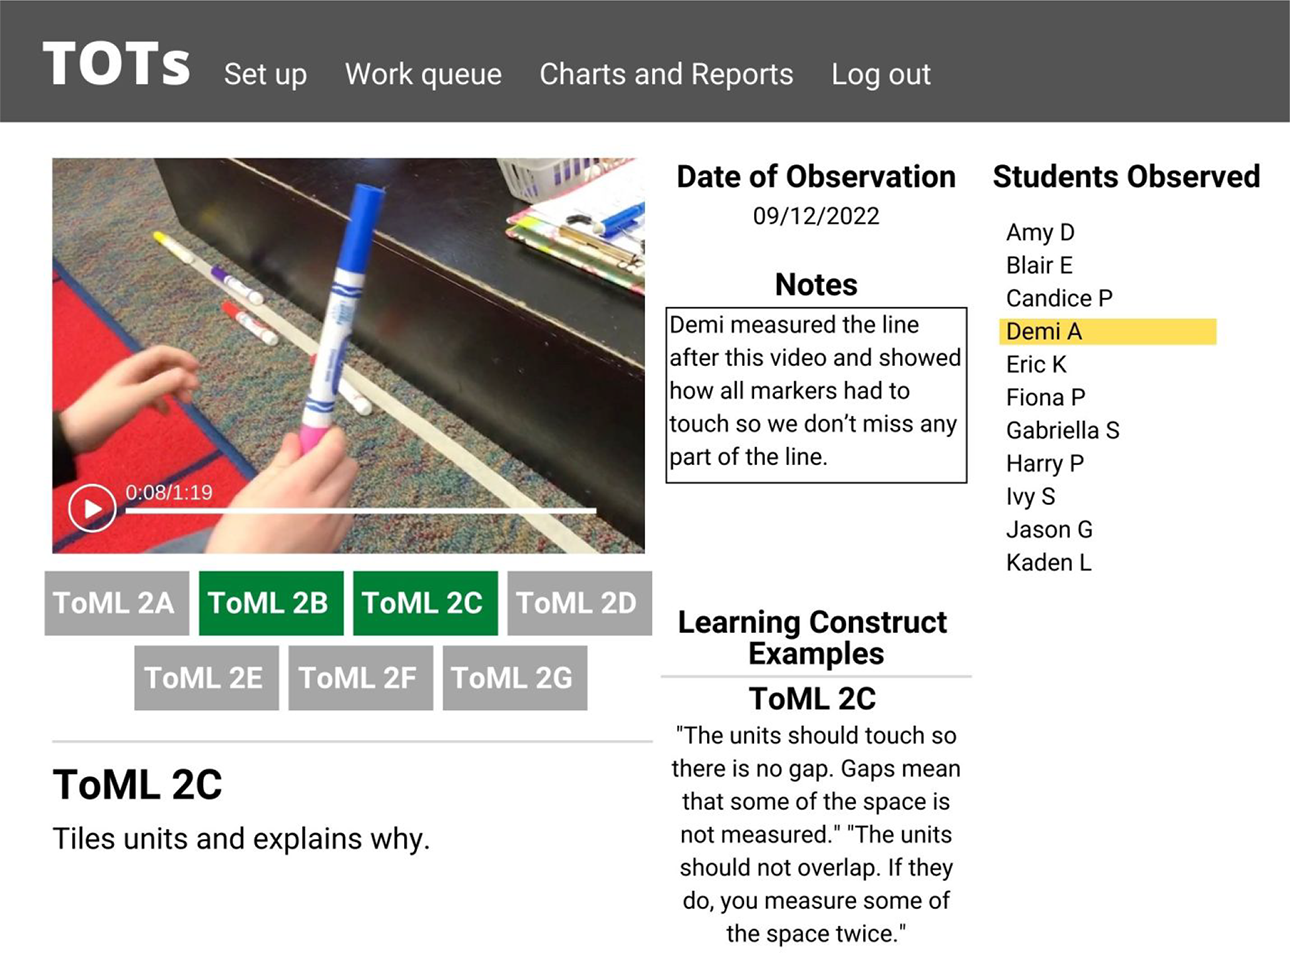
Recording evidence of student thinking: A teacher observation tools screenshot.
In terms of the outcome space, the situation is different for the microlevel TOTs observations. Here, the “scoring guide” for each observation is the teacher themselves, in some sense the sum-total of their experiences and knowledge as elementary school math teachers as well their specific experiences within the modeling assessments project, and their knowledge and understanding of the ToML construct map. Thus, this building block is effectively collapsed into the previous one in this microlevel approach.
To extend the statistical modeling to the micro level, we used a polytomous version of Equation 4 to model successive waves of student data from (a) meso initial assessments (in BASS) at the beginning of Fall 2020, (b) microassessments (i.e., teachers using TOTs) in Fall 2020, to mesoassessments (in BASS) in late May in 2021. These were linked together using a concurrent calibration (using the rstan package, as noted above) based on both common students and common items. The results of this linkage are shown on the Wright map in Figure 9. As for Figure 7, the results are displayed with student locations on the left-hand side and the item locations on the right-hand side, but this time with the additional teacher observations located on the far right (specifically, in columns 70–92).
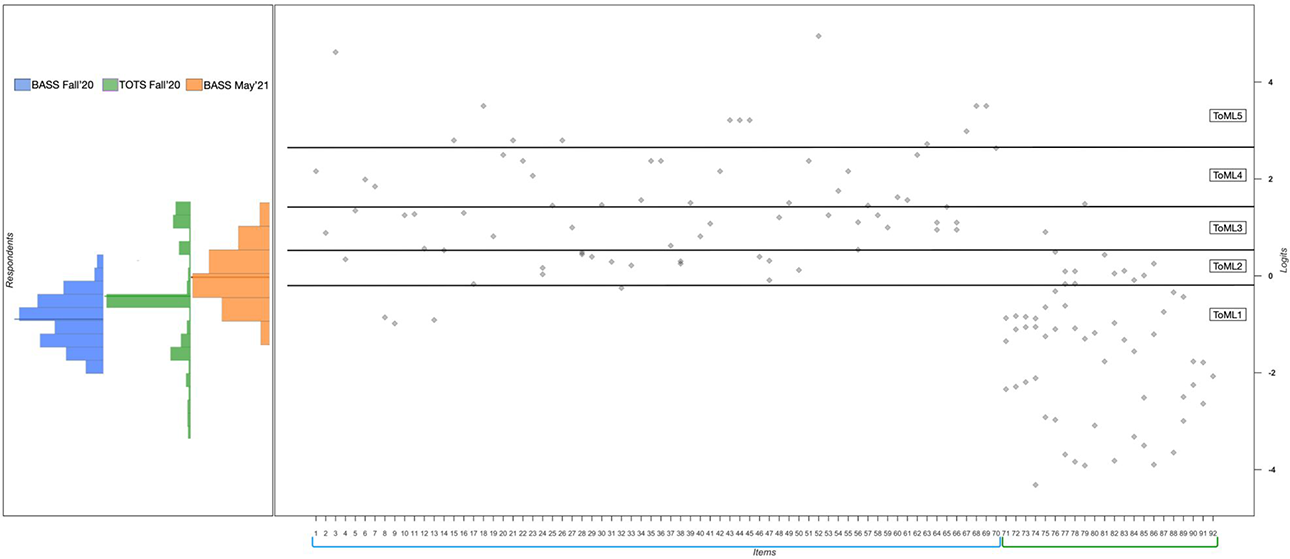
Linked Wright map for meso (BEAR assessment system software) and micro (teacher observation tools) assessments.
As one can see on the left-hand side in Figure 9, the students (who ranged from Grade 1 to Grade 5) spread along the scale from ToML Waypoints 1 through 5. The first histogram on the left-hand side is a blue histogram showing the student estimates at the beginning of the Fall semester in 2020 5 from the meso-level BASS items—as one might expect, these are somewhat low on the construct map waypoints, ranging up to only Level 2. The next histogram (green) shows the TOTs estimates for students in the first part of the 2020/2021 academic year, 6 and here, we see an interestingly broader range than for the initial assessment. This increase in breadth can be attributed partly to (1) the initial instruction in the program, but also to (2) the scaffoldings to student performance provided in the classroom, and (3) the increased appreciation of teachers for how to leverage students’ thinking to advance conceptualizations of measure. The third (orange) histogram shows the student estimates at the end of the Spring semester in 2021 7 from a second administration of the meso-level BASS items. 8 This shows an educationally meaningful increase in the distribution across the academic year—on average, equivalent of approximately 1.0 logit, or approximately the same as the width of each of the third and fourth waypoints on the ToML construct map (0.96 logits and 1.20 logits, respectively). Again, these estimates are not so spread out as the micro assessment locations were, although the microlocations do not go any higher than the highest mesoassessment locations at the end of the semester.
Turning now to the locations for the items and the teacher observations in Figure 9, one interesting feature is the set of locations of the TOTs observations on the right-hand side of this Wright map (i.e., numbered as 71–92 along the bottom of the figure). The locations are all lower than for those of the mesolevel BASS items, and we see this as being attributable to the contrast between the situated nature of student thinking in the moment and that of student thinking in the more sequestered and temporally distal occasions of pre- and post-test. Despite the difference in location for the items at the two grain-sizes (i.e., micro and meso), nonetheless, the estimates of student performance on the two were substantially associated (r = 0.79).
Once the results from the micro and mesolevel models are linked together both technically through a common scale and substantively (via the ToML construct map), the microlevel TOTs results can be used to generate construct map reports parallel to those shown in Figure 7. This is illustrated in Figure 10 (for a different class than for Figure 7). In this report, we can see that this class is operating mainly at Waypoint 1 and edging up to Waypoint 2, but with a few students who may be close Waypoint 3, who are measured with less precision (as indicated by their large standard errors).
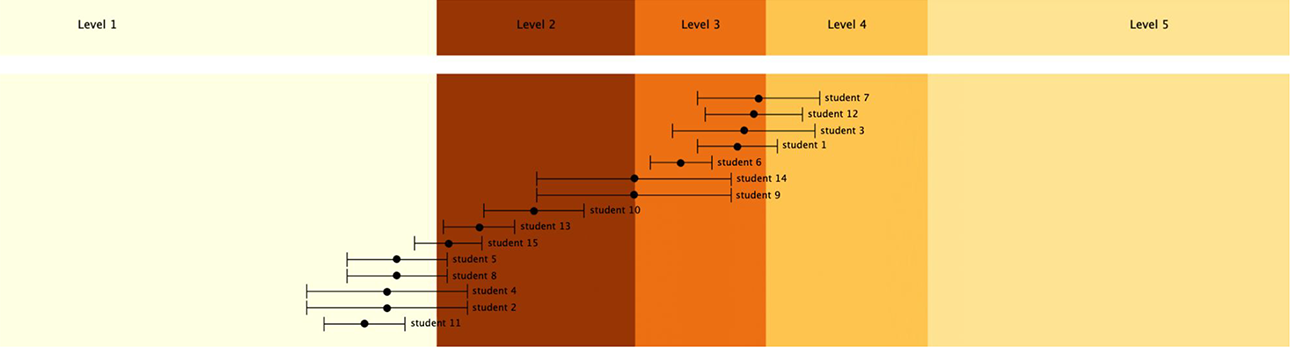
BEAR assessment system software group report for the teacher observation tools data.
Conclusion
In conclusion, we note that our conceptualization of “accountable assessment” involves the matching development and interpretation of assessments at the meso- and microlevels of assessment. In this article, we have demonstrated how the construct-related concept, the construct map can be capitalized on for that purpose. Between them, the BASS and TOTs software span the meso- and microassessment levels, and appropriate deployment of novel calibration model (i.e., as in Equation 4) allows the results from the two levels to be combined into a single scale. This allows for a single framing for the interpretation of the results from the two levels. Other approaches to this conceptualization are also possible (e.g., Doignon & Falmagne, 1999), though generally they are built only at the finest (micro) grain-size, which, while needed for applications such as computer-based teaching, may not serve human teachers so well.
This is the first simultaneous deployment and scaling of assessments at these two levels. The successful achievement of this is a significant accomplishment for educational measurement. But as with any initial deployment, its limitations must be acknowledged. The impact of the mesolevel BASS assessments, while it has been established in an earlier project that took a similar approach at the meso level (see Lehrer et al., 2014; Wilson & Lehrer, 2021), has not been fully realized in the application described here. The mesolevel BASS assessments were not distributed across the semester as initially planned due to (a) difficulties implementing software so that it was compatible with the participating schools’ IT systems and (b) the external pressures from the COVID-19 pandemic, which resulted in unpredictable swings between in-person and online learning. However, they were used as prompts for the formative assessment conversations in the classrooms, as noted above. As can be seen in Figure 8, they function appropriately as pre- and post-tests, but the full impact of the potential instructional role of the meso-level items was not tested-out in this study. Clearly, a follow-on study is needed to investigate the effects, and of course, possible negative effects of a full implementation, such as (a) potential issues of uneven sampling of students across the two levels, and (b) the possibility that simultaneous information from the two levels might prove distracting for teachers.
Looking beyond immediate next steps, one can see a large scope of potential opportunities and challenges. The development of new construct-map-based versions of school curricula and assessments is no easy task—it takes a stronger commitment to the establishment of content validity for the instruction and assessment and a more direct engagement with teacher expertise and practices than is typically the case for education curricula. The incorporation of the microlevel into the assessment framework for a curriculum opens up the challenge of designing and delivering a teacher professional training program that can support teachers in their daily interactions with students (see Lehrer, 2021, for discussion of this). The construct map idea offers a structure for organizing the topic content of such a professional training program in a way that is efficient for the teachers. Building a mesoassessment system based on the same idea deepens the ways, in which the constructs are communicated to teachers (and to students, where they are mature enough for such information). With this two-level approach to teacher professional development, teachers have multiple sources of information available to them about their students’ progress. Each of these can be seen as both opportunity and challenge. Our experiences with the modeling assessment project have led us to believe that this effort is worthwhile, and we would be delighted to help out others who take this on.
Footnotes
Appendix A
Author’s Note
The psychometric modeling included here was carried out by Perman Gochyyev from the BEAR Center at UC Berkeley. An earlier version of this article was to be presented as the American Educational Research Association (AERA) E. F. Lindquist Lecture at the AERA annual meeting in 2020 but was not delivered due to the Covid-19 pandemic. It was rescheduled for the AERA annual meeting in 2021, in April of that year. Due to technical difficulties, this was delayed and then presented in November 2021 as an online webinar.
Acknowledgments
The author would like to acknowledge the contributions of his partners and inspirational leaders in the National Science Foundation project in which this work was carried out: Richard Lehrer and Leona Schauble of Vanderbilt University.
Declaration of Conflicting Interests
The author(s) declared no potential conflicts of interest with respect to the research, authorship, and/or publication of this article.
Funding
The author(s) disclosed receipt of the following financial support for the research and/or authorship of this article: This material is based upon work supported by the National Science Foundation under Grant 1621265: Collaborative Research: Modeling Assessment to Enhance Teaching and Learning. Any opinions, findings, and conclusions or recommendations expressed in this material are those of the author(s) and do not necessarily reflect the views of the National Science Foundation.