
Abstract
To address response style or bias in rating scales, forced-choice items are often used to request that respondents rank their attitudes or preferences among a limited set of options. The rating scales used by raters to render judgments on ratees’ performance also contribute to rater bias or errors; consequently, forced-choice items have recently been employed for raters to rate how a ratee performs in certain defined traits. This study develops forced-choice ranking models (FCRMs) for data analysis when performance is evaluated by external raters or experts in a forced-choice ranking format. The proposed FCRMs consider different degrees of raters’ leniency/severity when modeling the selection probability in the generalized unfolding item response theory framework. They include an additional topic facet when multiple tasks are evaluated and incorporate variations in leniency parameters to capture the interactions between ratees and raters. The simulation results indicate that the parameters of the new models can be satisfactorily recovered and that better parameter recovery is associated with more item blocks, larger sample sizes, and a complete ranking design. A technological creativity assessment is presented as an empirical example with which to demonstrate the applicability and implications of the new models.
Introduction
Rater-mediated assessments conventionally require raters to provide ratings by directly responding to a scoring rubric (e.g., a Likert-type rating scale) to evaluate the degrees of proficiency with respect to specified criteria. Performance assessments are produced by external raters in many fields of applied social science, and well-known examples are performance appraisals in organizational behavior fields, writing assessments in language testing situations, patients’ recovery evaluations in medical contexts, and creativity assessments in educational settings. Unlike measured outcomes obtained from the selected-response item format used in educational assessments and the self-reported rating scale used in psychological testing, human rater scoring is subject to rater effects on rater-mediated assessments (Myford & Wolfe, 2003). Although psychometric models, such as item response theory (IRT) and latent trait models, have been developed in earlier studies to account for several commonly observed rater effects (e.g., rater leniency, rater inconsistency, consensual observer drift, and halo effects; Engelhard, 1994; Hung et al., 2012; Jin & Wang, 2018; Linacre, 1989; Myford & Wolfe, 2003, 2004; Wang et al., 2014; Wang & Wilson, 2005; Wilson & Hoskens, 2001), rater scoring is more vulnerable to various sources of bias and error due to the nature of scale-based rating assessments (Myford & Wolfe, 2003). Alternatively, a comparative judgment approach (i.e., forced-choice formats) to evaluating personal performance rather than direct scoring (i.e., single-stimulus formats) may provide a new direction to improve measurement properties in rater-mediated assessments (Laming, 2004; Pollitt, 2012).
Two types of comparative judgment approaches can be applied to rater-mediated assessment contexts based on Thurstone’s (1927) theorem of cognitive processes in comparative judgment. When objects are compared with respect to a prespecified attribute—for example, students’ assignments are evaluated with respect to creative thinking—a rank order of objects (e.g., students) can be created to indicate different proficiency levels in the measured attribute. This comparative approach, known as the between-object comparison design, is widely used in a variety of contexts, such as art appraisals (Newhouse, 2014), educational achievement measures (Crompvoets et al., 2020), essay evaluations (Steedle & Ferrara, 2016), and creativity ranking (Florida et al., 2015). Because the between-object comparison design requires multiple pairwise comparisons among a large number of objects, the high rater burden and time-consuming process may compromise the efficiency and validity of measurement. In addition, existing measurement models mostly require raters to perform comparisons with respect to a single attribute under a unidimensional testing structure (e.g., Crompvoets et al., 2020), which limits the applicability of this approach to comparisons of multiple attributes. Rather than producing comparisons among persons, an alternative approach to distinguishing between attributes requires raters to compare items representing different attributes and to measure distinct latent traits in an item block by ranking these items within each block. The between-trait comparison design uses forced-choice formats rather than single-stimulus formats, so that the response distortions that have been observed in Likert-type rating scales, such as those due to response styles, can be eliminated across items under comparison (Cheung & Chan, 2002). In this study, we focus on the between-trait comparison approach and develop a variety of measurement models for raters’ ranking data.
There is growing interest in the application of rank-ordered choice formats to rater-mediated assessments, and the corresponding measurement models are developed progressively. For example, 360-degree appraisals of employees in organizations are widely used for purposes of promotion, salary increases, and training to evaluate employee behavior and performance in job roles from distinct perspectives (e.g., those of superiors, peers, and subordinates) with respect to different competencies and can be thought of as a type of high-stakes assessment in organizations. Because the Likert-type rating rubrics used in 360-degree appraisals are more likely to be subject to rater biases, Brown et al. (2017) designed an analysis of the rater-mediated ranking task, in which four items measuring distinct latent traits in a block are partially ranked by external raters according to their judgments of ratees’ performance. Additionally, the Thurstonian IRT (TIRT) model (Brown & Maydeu-Olivares, 2011, 2012, 2013) is used to calibrate employees’ propensities in job performance. With the fit of the TIRT model to forced-choice ranking data, Brown et al. found that several potent rater errors, such as acquiescence, extreme tendency, and halo effects, could be effectively eliminated by direct item comparison. Although their results were significant and the analysis considered multiple latent traits simultaneously, several limitations should be noted.
First, for the TIRT model, the model parameters are estimated using confirmatory factor analysis based on traditional bivariate information rather than full information, and the two-step estimation procedure (i.e., estimating traits after structural parameters have been calibrated) results in imprecise parameter estimation because estimation errors are ignored. Second, for the purpose of model identification, the TIRT model requires inverse items to be designed as item blocks of opposite polarity. This design has been found to be less robust against response biases because respondents prefer direct items to inverse items (Morillo et al., 2016). Third, personnel assessments, such as 360-degree appraisals, often instruct raters to produce partial rankings (i.e., to select the items that best and worst describe the ratee) rather than complete rankings. When partial ranking data are collected, as in Brown et al.’s study, each block should then be converted into multiple binary dummy items by means of pairwise comparisons, and missing responses to binary dummy items during the partial ranking process should be statistically imputed to avoid bias in parameter estimation (Brown & Maydeu-Olivares, 2012). Although the TIRT model can be applied to complete ranking analysis without statistical imputation, the current application is limited to partial rankings and has been found to be less efficient than the full ranking method (Hontangas et al., 2015).
It is a common practice in econometric fields and marketing studies to ask respondents to provide a complete preference ordering among a set of option alternatives, such as different modes of transportation and different brands of a certain product (e.g., Ahn et al., 2006; Calfee et al., 2001). Therefore, several probabilistic choice models for rank-ordered choice data have been developed to relate the desirability of a choice pattern for respondents with the combination of the person’s characteristics (e.g., demographic variables) and attributes of each choice option. Based on the ranking choice theorem (Luce, 2005), the probability of a ranking event can be decomposed into the product of multiple-choice probabilities in the rank-ordered choice set, in which the choice events for each option are assumed to be statistically independent and follow a multinomial logit model (Gensch & Recker, 1979). By computing the product of the probabilities represented by the multinomial logit model for each choice event, the rank-ordered logit model (also known as the exploded logit model) and several variants can be formulized to express the choice probability of rank ordering, as has been demonstrated in the choice behavior model literature (e.g., Beggs et al., 1981; Chapman & Staelin, 1982; Fok et al., 2012). Although the traditional probabilistic choice models for rank-ordered choice data are statistically efficient and have been widely applied to marketing surveys for understanding customers’ preference judgments, several limitations should be outlined and discussed for applications to psychological measures and rater-mediated assessment.
Because respondents’ choice behavior always involves a deterministic process, a stochastic utility model that includes deterministic and random components is used to represent the underlying process of making a probabilistic decision (Manski, 1977). The deterministic component of the utility function operationalizes the choice probabilities of the multinomial logit model and is determined by the respondent’s observed characteristics rather than latent traits or attributes. In psychometric fields, measuring respondents’ latent traits is of interest and importance for obtaining their performance levels on a prespecified latent continuum; therefore, the rank-ordered logit model is not an ideal approach to provide respondents’ specific latent trait measures. Second, the random utility framework assumes a dominance process in a preference ranking task; that is, the larger the utility value an option has, the higher the probability of that option being selected. It is not always the case, however, that personal preference and choice follow a cumulative response process because a person may agree with or prefer an option that has an ideal description for them (Andrich & Luo, 2019; Coombs, 1964). In contrast, an ideal-point stochastic model may be more appropriate than a dominance model to describe the underlying process of comparative judgment (see below for more details). Third, self-reported rankings have regularly been used in preference rank-ordered surveys, and the “true” preference judgments of respondents can be directly reflected by their actual ranking patterns. In some cases, however, individual performances may be ranked by external raters with respect to several criteria (e.g., employees’ performance is ranked by superiors with respect to four items represented by distinct latent traits; see Brown et al., 2017). The results of the sorting on these criteria do not necessarily reflect the real performance of the respondents because the raters’ characteristics (e.g., rater leniency; Engelhard, 1994) would influence the deterministic choice process, and rater effects should be considered when developing a new ranking model for rater-mediated assessment.
Following the consecutive choice tradition and the explosion rule (Luce, 2005), the forced-choice ranking IRT model has been proposed. This model replaces the stochastic utility model and the multinomial logit model for modeling the choice probability of each ranking option with a specific IRT model (de la Torre et al., 2012; Joo et al., 2018; Lee et al., 2019). Similar to traditional probabilistic ranking models, self-reported rankings rather than rater-mediated rankings have been used in the forced-choice ranking IRT model, and rater effects have not been considered in previous studies. Our study builds on the contributions of the forced-choice ranking IRT model and extends it by quantifying raters’ leniency levels and introducing multiple measurement facets into the probabilistic choice function. Furthermore, we evaluate intrarater consistency by considering the possible randomness of raters’ leniency when their ranking data are collected. Note that we use “item” to describe the ranking option, and an item block is composed of a limited number of items measuring distinct latent traits to be compared and ranked. In typical raters’ ranking data, multiple item blocks are designed, and raters must rank the items according to their judgment of ratees’ performance for each item block. The newly developed forced-choice ranking models (FCRMs) have several advantages: Multiple latent traits can be measured and compared simultaneously, item response functions can be flexibly formulized by the dominance or ideal-point approach, and different measurement facets (e.g., respondents, items, raters, and materials) can be combined in relation to each item choice probability. This approach not only satisfies the practical demands of rater-medicated assessments but also contributes to theoretical progress in psychometric fields.
In recent decades, creativity has become an indispensable and essential skill for students’ future adaptability, and both schools and educational policymakers have sought approaches to improve and develop students’ creative potential in educational contexts by providing a supportive environment (e.g., Hernández-Torrano & Ibrayeva, 2020; Plucker et al., 2018). Abundant accumulated empirical evidence has shown the positive contribution of creativity to scholastic performance, problem-solving skills, and overall life success (Freund & Holling, 2008; Gajda et al., 2017; Sternberg, 2002). Among creativity assessments, the consensual assessment technique (Amabile, 1996) has frequently been used to evaluate a skill that is theorized to be relative to creativity. In such assessments, individuals are asked to create something, for example, by writing poems, telling stories, drawing pictures, or engaging in crafts, and experts are then asked to evaluate the products that the participants have created. The outcome measures in the consensual assessment technique are often obtained through human judgment on rating scales and have been found to be inconsistent with respect to raters’ rating procedures and use of rating scales due to differing rater cognition (for an intensive discussion, see Long & Pang, 2015). Corresponding to the purpose of improving student creativity and innovation that is central to science, technology, engineering, arts, and mathematics education (Perignat & Katz-Buonincontro, 2019), we chose a technology creativity assessment based on the consensual assessment technique and forced-choice ranking formats as a demonstrative example for the application of the newly developed FCRMs. Additionally, it has been suggested that schools must provide opportunities for students to develop creativity capacity in correspondence with the increasing need for technology skills in future jobs (Keane & Keane, 2016). In this empirical analysis, our proposed raters’ ranking models are used to measure diverse aspects of creativity on the basis of the technology products that students create.
The remainder of this study is organized as follows. First, the Model Specification section describes the rationales and justifications for developing the new class of FCRMs in the context of rater-mediated assessments, accounting for multiple facets, such as rater leniency and the ranking of multiple tasks or materials, and controlling for the impacts of rater inconsistency. Then, three simulation studies are presented to assess model parameter recovery for each of the proposed models using Bayesian estimation. Next, an empirical example demonstrates the applications and implications of the models. Finally, we close this article by presenting an overall discussion of the results and suggestions for future research.
Model Specification
To prevent raters from endorsing (or disaffirming) all items due to the halo effect or response styles in Likert-type rating scales, it is justifiable to alternatively use forced-choice formats and ask raters to provide a complete rank ordering of a ratee’s performance (Brown et al., 2017). We begin this section with the rank-ordered probabilistic formulation, followed by issues associated with the choice of the item endorsement probabilistic function. At the end of this section, we provide the FCRM with raters’ leniency and further extend the new model toward a general formulation to correspond to theoretical and practical considerations.
The Rank-Ordered Probabilistic Formulation
When an individual is required to rank items within a block from most preferred to least preferred, the probability of a particular ranking pattern can be partitioned into a sequence consisting of the independent probability of picking the “most preferred” statement from the diminishing set of alternative statements (henceforth called the PICK probability) at each step in the decision process. Then, the overall probability of this ranking pattern is the product of these PICK probabilities (Beggs et al., 1981; Chapman & Staelin, 1982; de la Torre et al., 2012; Fok et al., 2012; Joo et al., 2018; Lee et al., 2019). When this concept is applied to the analysis of raters’ ranking data, the proposed modeling approach can be illustrated for a hypothetical assessment scenario, in which individual students’ tasks (e.g., creative thinking, writing, or painting) are evaluated by raters using a forced-choice ranking format based on three criteria or dimensions (e.g., fluency, flexibility, and originality). Each dimension is measured by multiple items, from which a composite item (i.e., a forced-choice block) comprising three items that measure distinct dimensions can be formulated. The raters are required to rank such a composite item from most to least representative of the target’s performance. In the case of three items (iA
, iB
, and iC
) to be ranked in a forced-choice block, one possible ranking pattern among the

where
The PICK probabilities
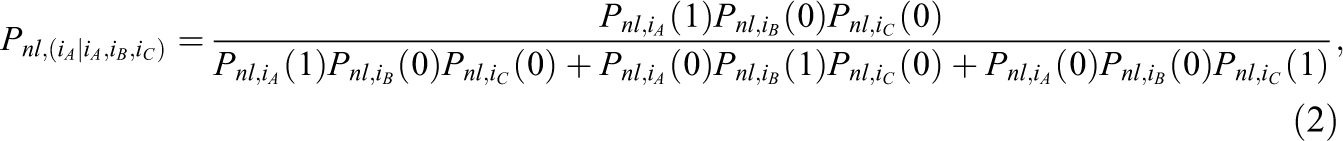
and

respectively, where
Issues Associated With the Choice of Item Endorsement Probabilistic Models
In traditional probabilistic ranking models, the probability of selecting an item is determined by a multinomial logit model under the random utility framework (e.g., Fok et al., 2012). In this study, we instead formulize the item endorsement probability using a binary IRT model because of the advantages mentioned above. For IRT modeling, the use of dominance (as in the two-parameter logistic model or 2PLM; Birnbaum, 1968) versus unfolding (as in the generalized graded unfolding model or GGUM; Roberts et al., 2000) to model the underlying process of forced-choice item evaluation remains controversial (Andrich & Luo, 2019; Drasgow et al., 2010). Within the framework of factor analysis, the TIRT model assumes a dominance process, whereas the IRT framework uses the almost equivalent multiunidimensional pairwise preference model developed by Morillo et al. (2016). For several reasons, we adopt an unfolding (or ideal-point) model for forced-choice responses. In pairwise comparisons, impersonal judgment implies that the rater’s judgment is objective. This eliminates personal parameters, meaning that probability is determined only by the stimuli (i.e., items) in the cumulative (dominance) IRT model (see Andrich & Luo, 2019, pp. 183–185). In practice, however, human raters’ evaluations do involve some subjective elements and rarely provide completely objective information about target behavior (Brown et al., 2017; Van der Heijden & Nijhof, 2004). For this reason, a single-peaked discrimination response function (i.e., unfolding) is more appropriate for assessing comparative judgments based on rater preference and choice (Andrich & Luo, 2019, pp. 186–188).
Formulation of the FCRM With Raters’ Leniency
Several probability functions have been proposed for modeling the selection process represented in Equations 2 and 3; for the purposes of the present study, unfolding IRT models are adopted to capture the nature of the raters’ subjective judgments. When applied to the probability of preferring a given item, the GGUM-rank model can be used to analyze multidimensional forced-choice items and ranking data (Joo et al., 2018; Lee et al., 2019; Roberts et al., 2000). However, because the GGUM-rank model was not developed for rater data and does not account for rater leniency in the selection of each item for comparison, a new forced-choice ranking IRT model is needed. As in many-faceted IRT models, a leniency parameter for each rater can be included in the unfolding probability function to adjust the range within which a rater’s evaluation of an item is more likely to be positive (i.e., representative of the target’s performance) than negative (i.e., unrepresentative of the target’s performance). Because the GGUM threshold parameter cannot be interpreted as the intersection of two adjacent categories (Roberts et al., 2000), it is difficult to adjust the range corresponding to a positive response on the continuum due to rater leniency. As an alternative, the threshold parameter in the hyperbolic cosine model (HCM) represents the latitude of acceptance of a stimulus and can be used to describe the intersection between the probabilities of positive and negative responses (Andrich, 1995; Andrich & Liu, 1993). Thus, a generalized HCM can be formulated by adding a slope (discrimination) parameter to each item in the HCM, and the probability function can be expressed as

where
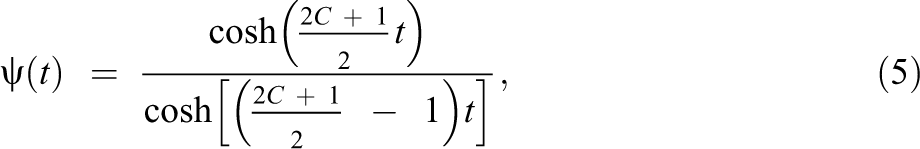
where C is the number of response categories minus one, and thus
The generalized HCM described in Equation 4 is appropriate for application to self-reported ranking data. When preference responses are produced by external human raters, a leniency parameter

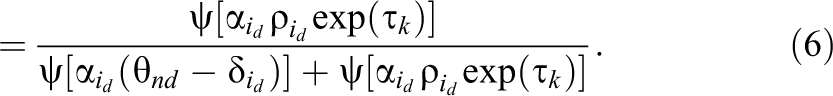
When the subscript k is added to Equations 2 and 3 (i.e.,
Take the following scenario as an example. When three raters with
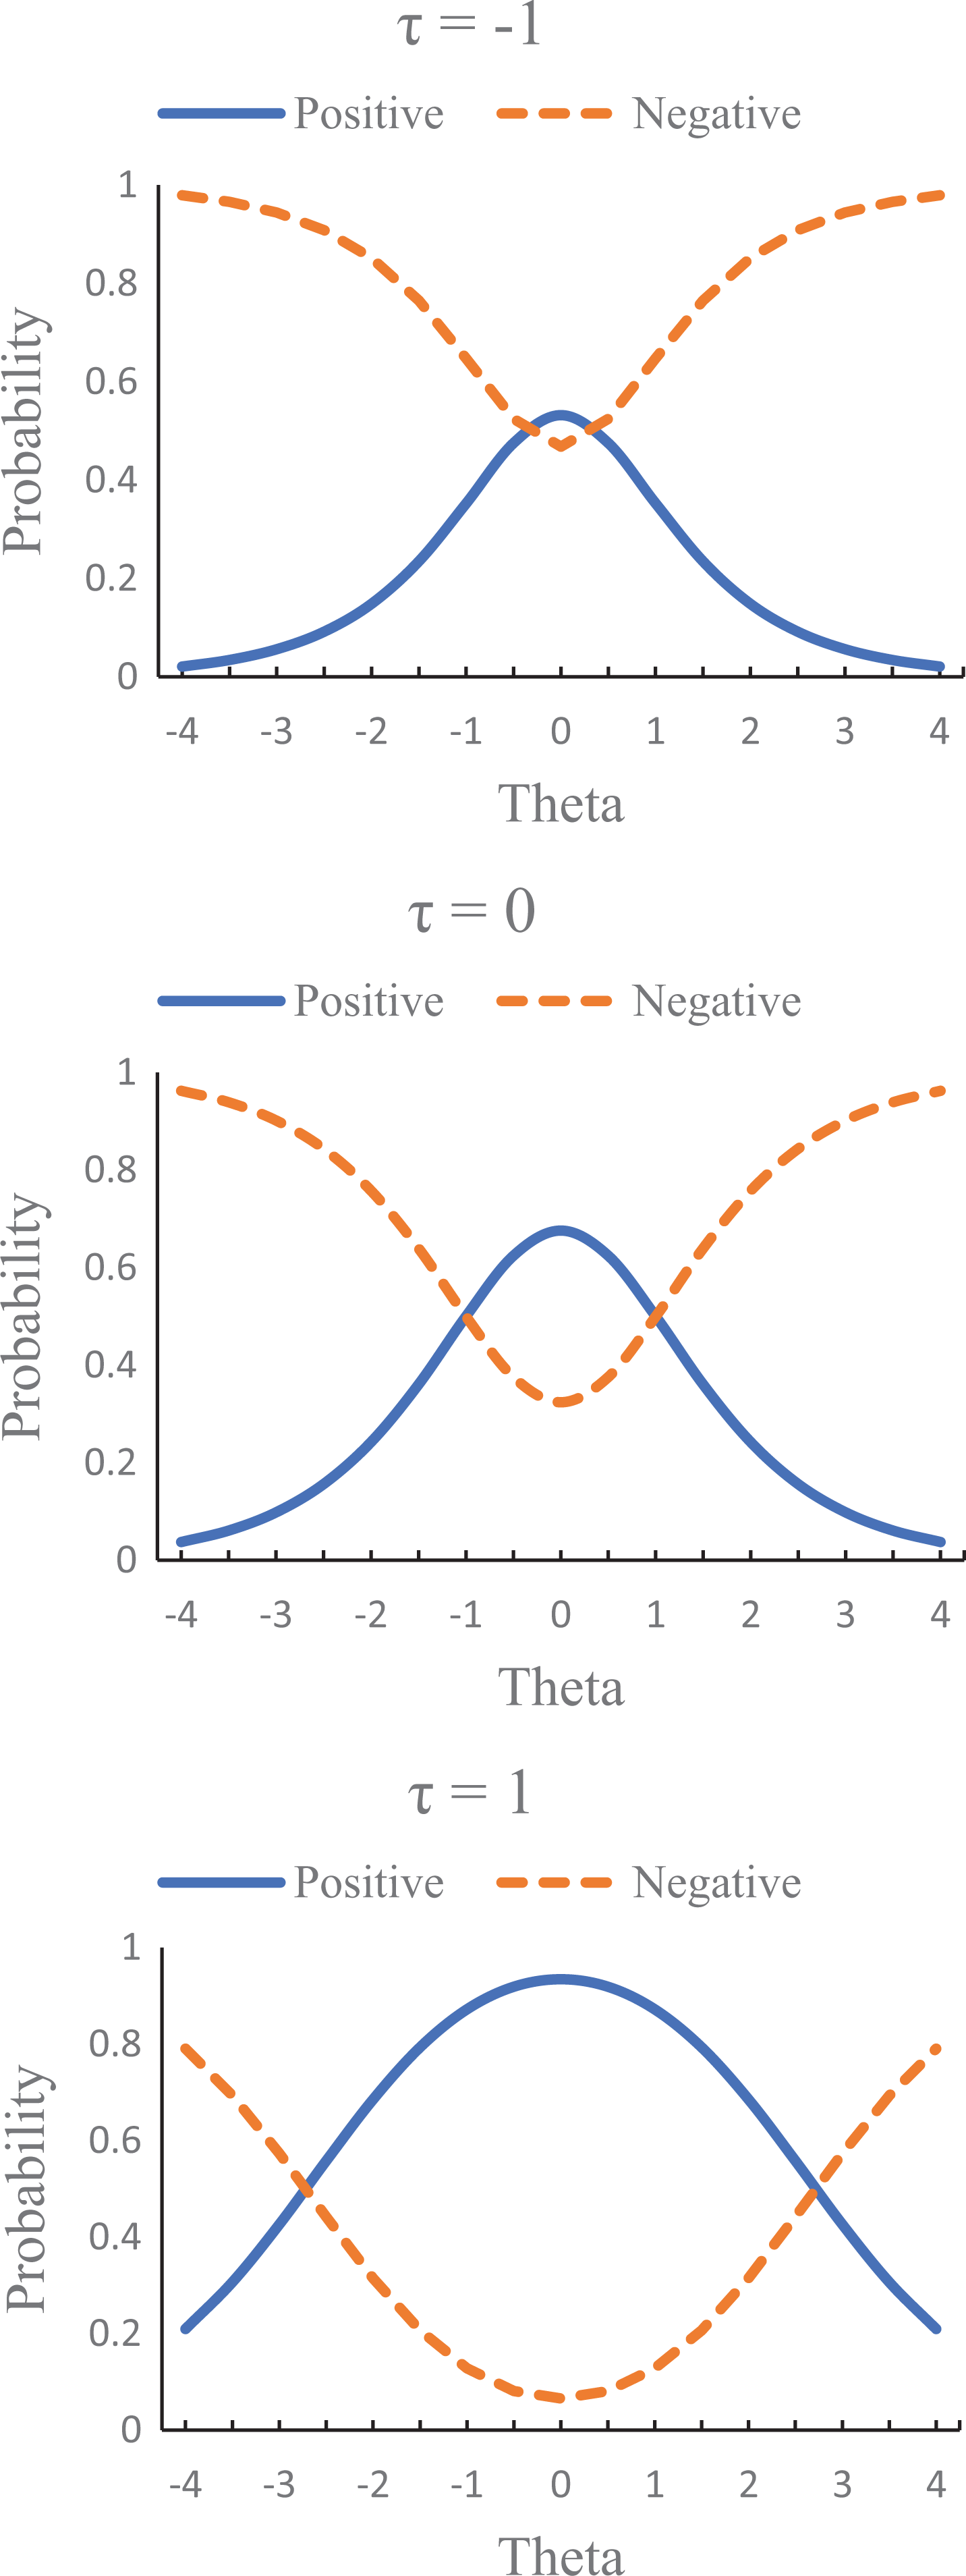
Probability function for three raters’ leniency parameters of −1, 0, and 1 on an illustrative item.
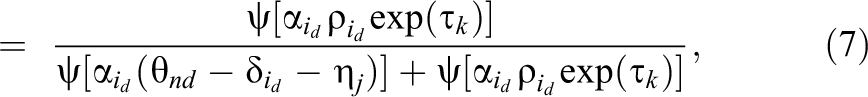
When the generalized HCM (i.e., with discrimination parameters) is used to compute the item selection probability in the rater-medicated ranking model, as shown in Equation 6, we classify it as the two-parameter FCRM with raters’ leniency (2P-FCRM-L), and when the HCM (i.e., without discrimination parameters) is used, we classify it as the one-parameter FCRM with raters’ leniency (1P-FCRM-L). Corresponding to the self-reported ranking contexts, the 2P-FCRM-L and 1P-FCRM-L are reduced to the 2P-FCRM and 1P-FCRM, respectively, without raters’ leniency. To simplify the model and reduce the computational burden, the threshold parameter
Notably, the proposed model relates to a single task assessment conducted by raters. In some cases, more than one task may be accomplished by individuals, and these tasks are evaluated by experts based on the same rubric. For example, college students in Hong Kong taking an English test wrote two essays (i.e., two tasks) that were evaluated by external raters along three criteria: organization, vocabulary, and grammar (Jin & Wang, 2018). When performance on multiple tasks is ranked by external raters with respect to various criteria, as in many-faceted IRT models of dominance responses, a topic difficulty parameter

where the other parameters and the operational function are as previously defined, and the subscript j is added to the PICK probabilities of all ranking patterns to represent the effects of different tasks. For example, the probability of the ranking pattern described in Equation 1 becomes

As in many-faceted IRT models, the mean topic difficulty parameter is constrained to zero for model identification.
Even with rater training, scoring behavior is often influenced by a rater’s own characteristics and unique prior experiences (Wang & Engelhard, 2019, p. 775). Variations in raters’ leniency across ratees and local item dependence caused by interactions between raters and ratees may interfere with parameter estimation. Specifically, while interrater reliability can be captured by the estimation of different

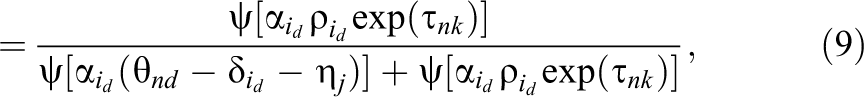
where
Adopting Equation 9 as the item endorsement probability in the FCRM leads to the most general rater-mediated ranking model, which is classified as the two-parameter many-faceted FCRM with random leniency (2P-MF-FCRM-RL) or the one-parameter many-faceted FCRM with random leniency (1P-MF-FCRM-RL) when the discrimination parameters are all set to one in Equation 9. Note that when
Simulation Studies
Three simulation studies were conducted to investigate parameter recovery for a range of FCRMs considering raters’ leniency. In each case, three dimensions, or criteria, were used to generate items for comparison in each item block, and five raters were required to rank the three items measuring different dimensions in terms of the ratee’s performance on a given task. The simulation design, prior distribution settings of Bayesian estimation, and results for the three studies are described separately as follows.
Simulation 1
Method
In the first simulation, each ranking pattern corresponded to the joint probability of multiple PICK functions and was generated by following the 2P-FCRM-L, where the PICK probability could be computed using the generalized HCM of rater leniency for each item (Equation 6). Three independent variables were manipulated: (a) the number of ratees (500 or 1,000), (b) the number of raters assigning rankings to a ratee (two or five), and (c) the number of item blocks (five or 10). In other words, in these ranking designs, each of 500 or 1,000 ratees was evaluated by two or five raters (out of five raters in total) using five or 10 item blocks, and each item block, which comprised three items of different dimensions, was ranked by the raters. The ranking designs in which only two raters assigned rankings to a ratee were considered incomplete; in these designs, each rater should evaluate 400 ratees from the large sample of 1,000 or 200 ratees from the small sample of 500. Specifically, as shown in Table 1, the ratees were split into five groups of equal size. Adjacent raters evaluated the same ratee group, and each group was evaluated by two raters. This concept is similar to the balanced incomplete blocking design for linkages between different tests and persons (Lord, 1965) and is consistent with the incomplete rating design used in previous studies (e.g., Jin & Wang, 2018).
Incomplete Ranking Design
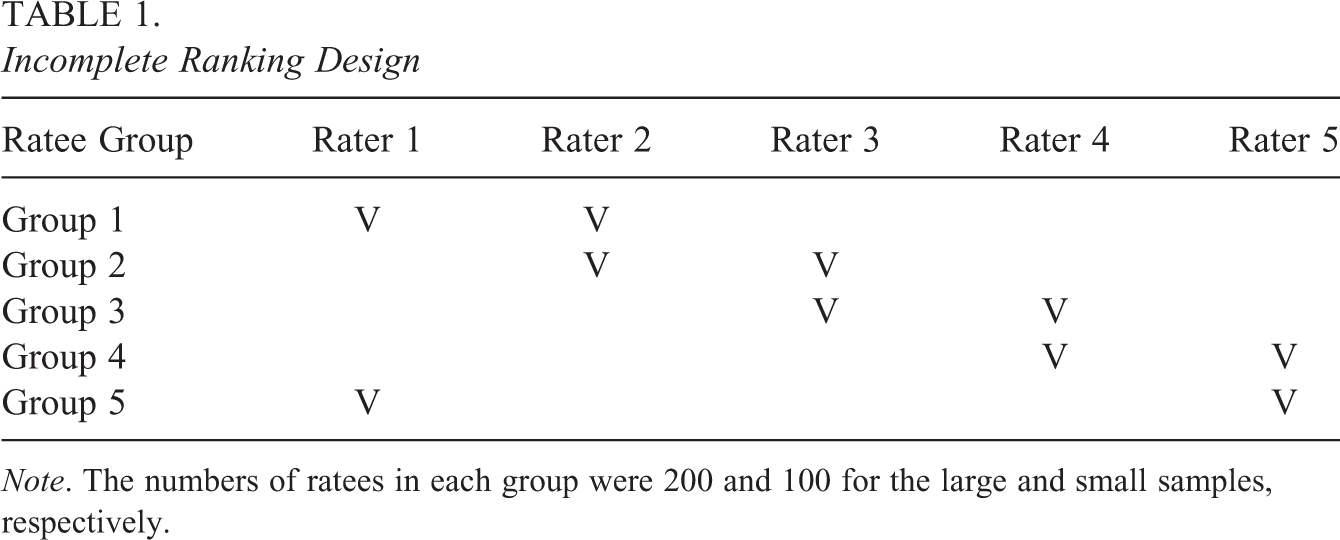
Note. The numbers of ratees in each group were 200 and 100 for the large and small samples, respectively.
For the simulations, the
Parameter Estimation and Analysis
The WinBUGS program (Spiegelhalter et al., 2003) was used to calibrate the model parameters based on the Bayesian estimation and Markov Chain Monte Carlo (MCMC) methods. Before a joint posterior distribution could be produced using the MCMC method, a statistical model and a set of prior distributions for the model parameters were required to specify the full conditional parameter distributions through sequential sampling. In line with previous studies using Bayesian estimation in IRT models (e.g., Jin & Wang, 2018; Lee et al., 2019; Liu & Wang, 2016; Morillo et al., 2016; Wang et al., 2013), the prior distributions of the model parameters were specified as follows. In the first simulation study, a lognormal distribution with a mean of 0 and a variance of 1 was used for the
Note that the uniform priors used for the correlation coefficients in the variance–covariance matrix were not restricted to specific bounds (e.g., positive values) because there may be a variety of correlations in practical situations (Jin & Wang, 2015). However, the sampling process in the MCMC method may yield numerical overflow due to the appearance of a nonpositive definite or singular matrix. According to our experience, setting appropriate initial values can improve the efficiency of parameter estimation and reduce the computation time needed to reach convergence. In real assessment situations, information on starting values can be obtained from experts or previous empirical analyses (e.g., Liu & Wang, 2016). In addition, if optimal initial values are not available, an alternative is to generate multiple sets of initial values to examine the parameter convergence over iterations within the Bayesian framework. The Online Appendix lists the WinBUGS codes for the 2P-FCRM-L, and the initial values were internally generated by the WinBUGS program.
Considering the large number of simulated conditions and the fact that each calibration required dozens of hours of computer time, we conducted 30 replications for each condition of the three simulation studies. Three parallel chains were implemented for five randomly selected simulated datasets under each condition to evaluate parameter convergence and determine the required number of iterations. Regarding the multivariate potential scale reduction factors (Brooks & Gelman, 1998), which were all less than 1.1, the results indicated that 15,000 iterations were sufficient to achieve satisfactory parameter convergence, with the first 5,000 iterations designated as the burn-in period.
Results
Because numerous parameters were estimated, in consideration of space constraints, the parameter recovery performance was examined by computing the means and standard deviations of the bias and root mean square error (RMSE) across items for the item parameters, across raters for the rater’s leniency parameters, and across dimensions for the covariance parameters of the latent traits. Tables 2 and 3 summarize the results of the proposed model tested in the first simulation study when using incomplete and complete ranking designs, respectively. The bias values were quite small in most cases except for some estimators in the five-item-block condition with the incomplete ranking design. When the complete ranking design was used, the bias values were closer to zero across all conditions. With respect to the RMSE, whether the incomplete or complete ranking design was used, the findings indicated that the RMSE magnitudes generally decreased when larger numbers of item blocks and ratees were used. As expected, the parameters could be recovered more satisfactorily when each ratee was evaluated by five raters (i.e., the complete ranking design) than when each ratee was evaluated by two raters (i.e., the incomplete ranking design), as shown in Tables 2 and 3.
Summary of Parameter Recovery Results for the Two-Parameter Forced-Choice Ranking Model With Raters’ Leniency in an Incomplete Ranking Design
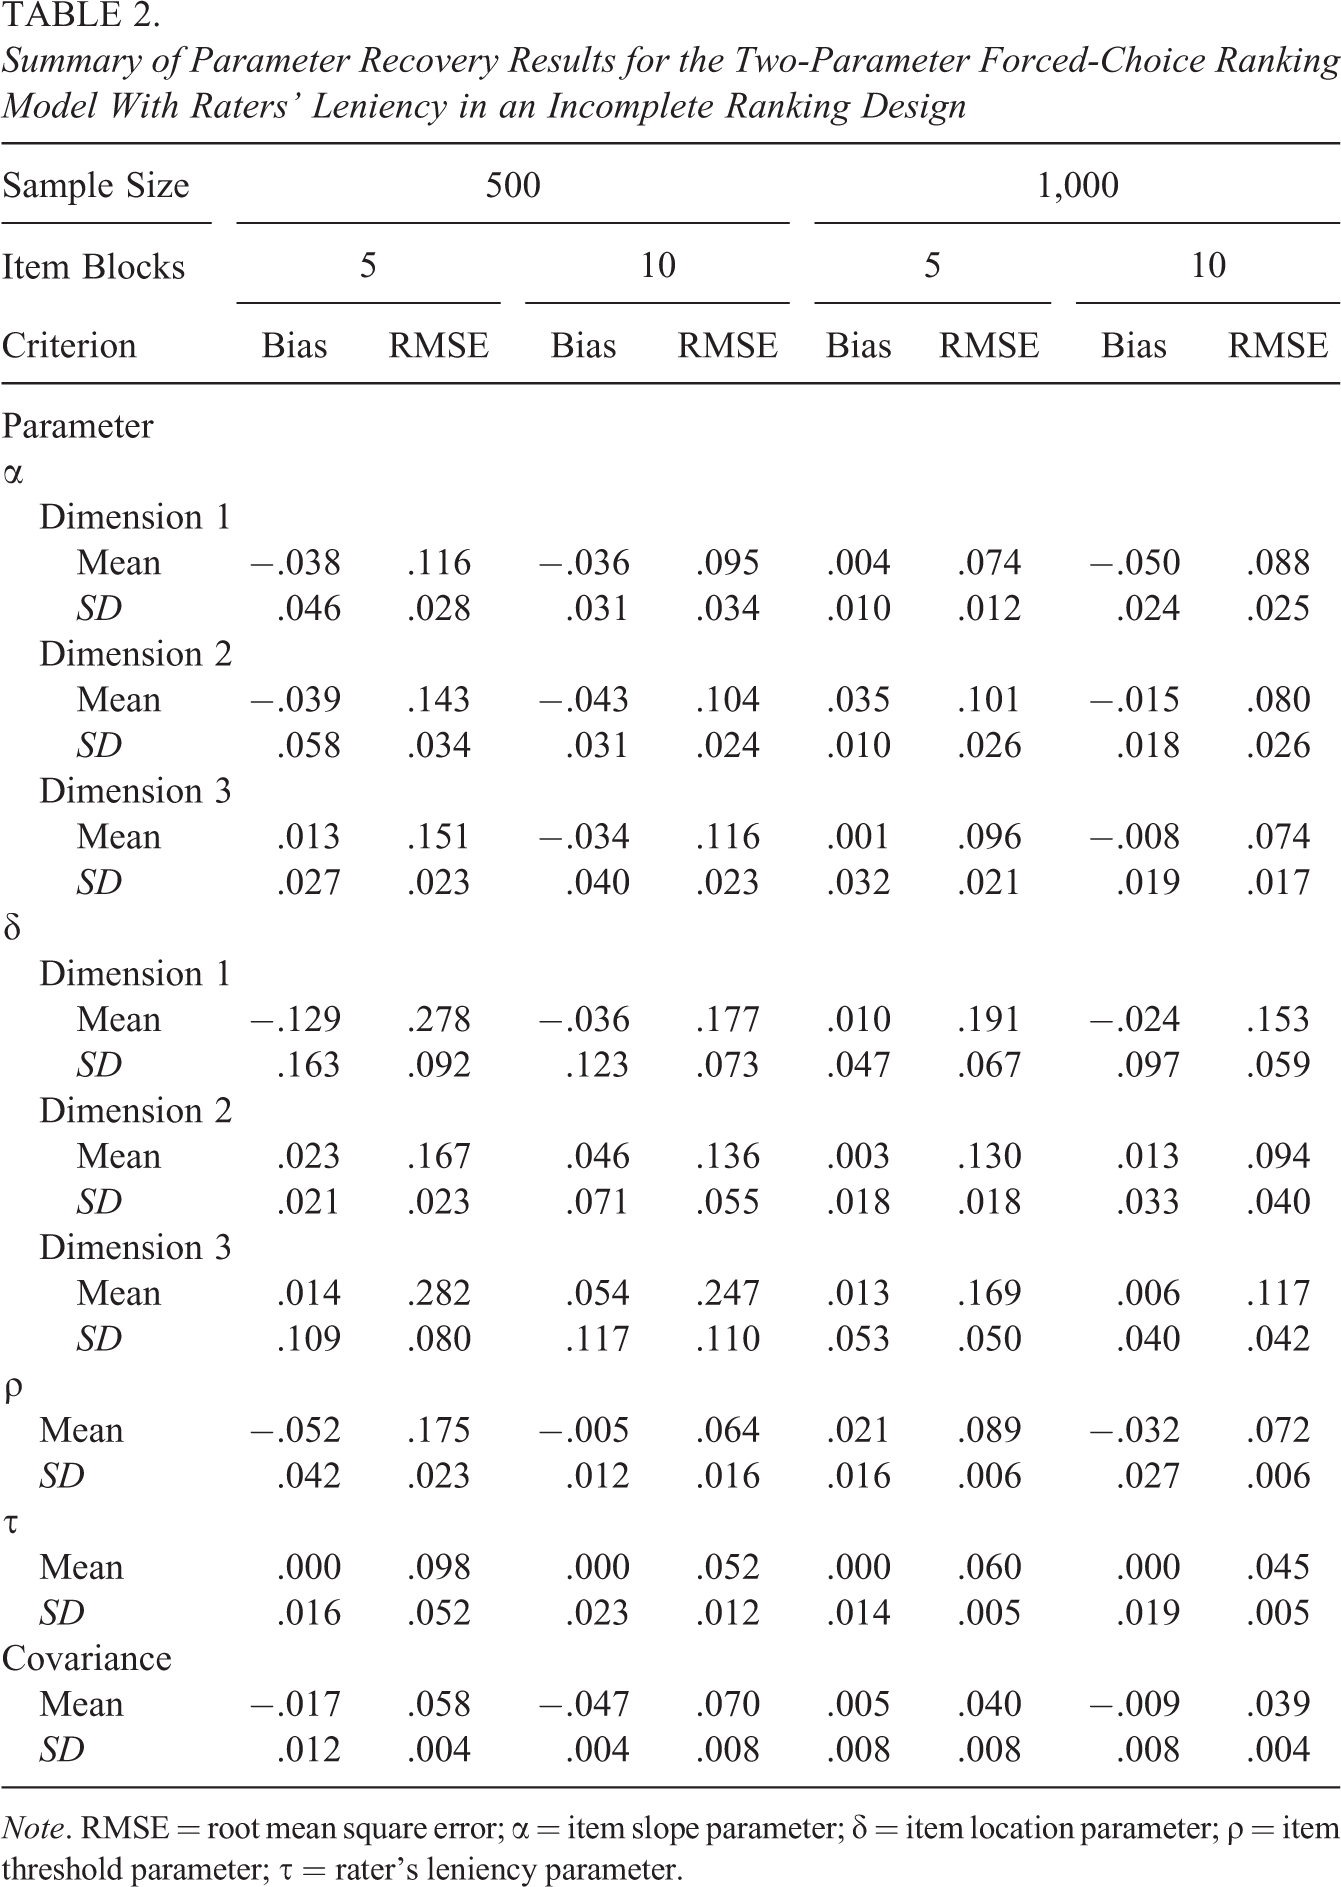
Note. RMSE = root mean square error; α = item slope parameter; δ = item location parameter; ρ = item threshold parameter; τ = rater’s leniency parameter.
Summary of Parameter Recovery Results for the Two-Parameter Forced-Choice Ranking Model With Raters’ Leniency in a Complete Ranking Design
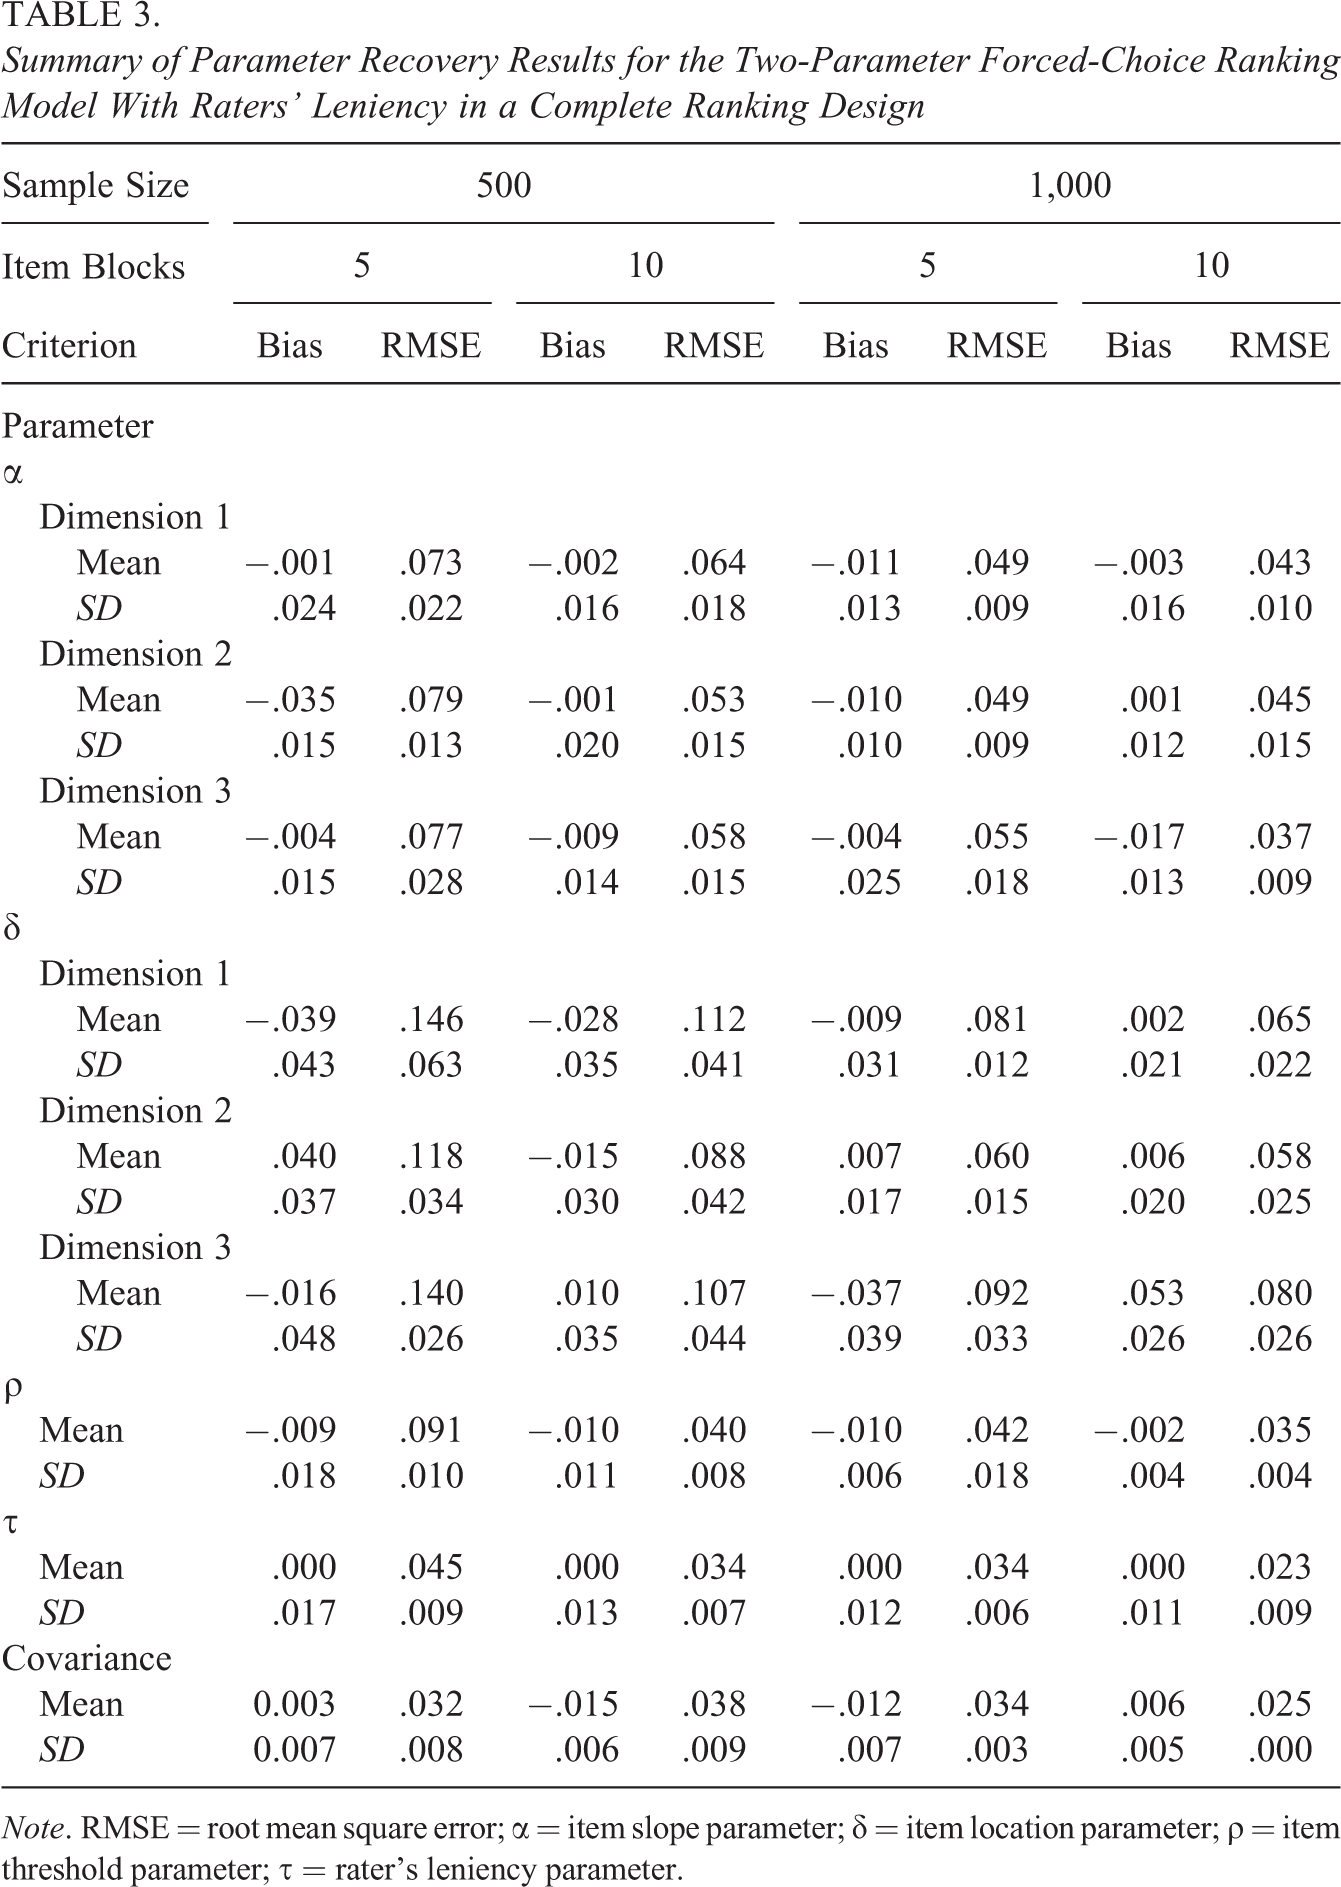
Note. RMSE = root mean square error; α = item slope parameter; δ = item location parameter; ρ = item threshold parameter; τ = rater’s leniency parameter.
Regarding the recovery of the person parameters, Table 4 shows the mean RMSEs of the person parameter estimates for the three dimensions across all replications. The results show that the use of both a larger number of item blocks and a complete ranking design increased the precision of person parameter estimation, as indicated by the substantial decrease in the mean RMSE values in both cases. In contrast, the sample size showed no systematic effect on person parameter recovery.
Mean RMSEs of Person Parameter Estimates for the Two-Parameter Forced-Choice Ranking Model With Raters’ Leniency
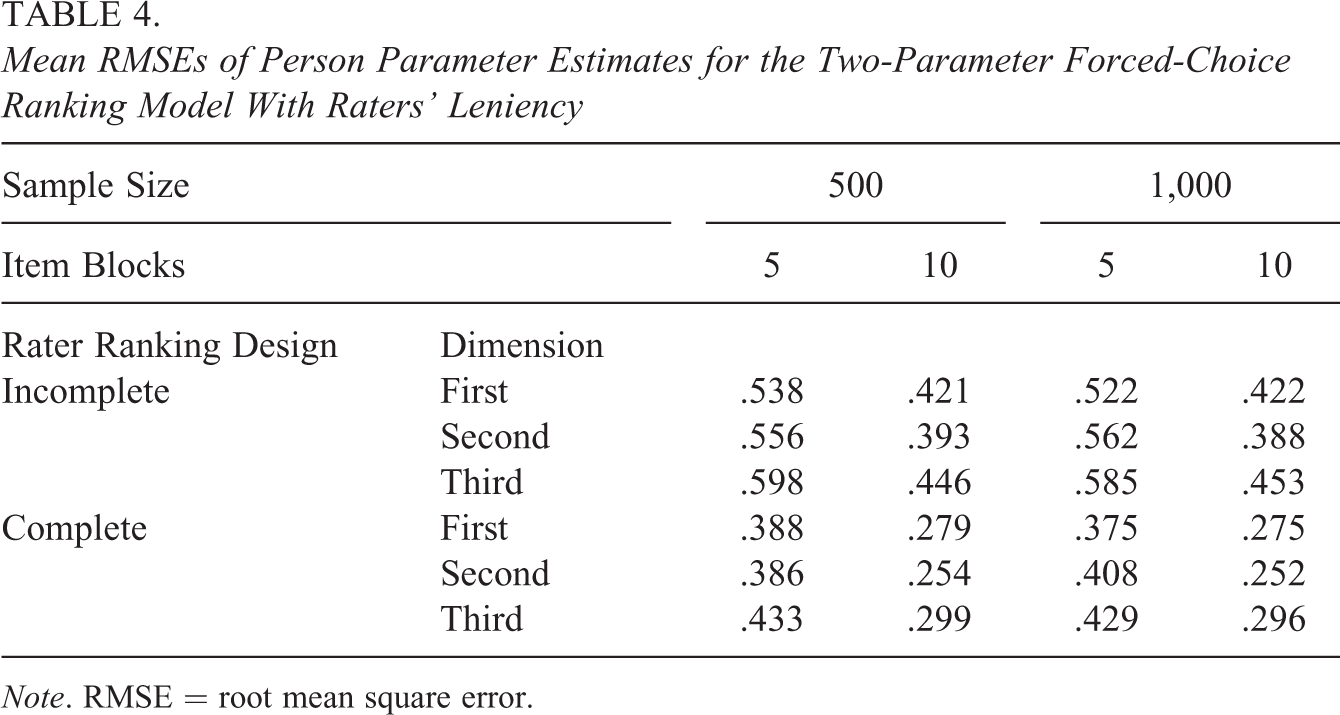
Note. RMSE = root mean square error.
Simulation 2
Method
The second simulation study considered a practical testing situation involving multiple tasks (e.g., essays), requiring the incorporation of topic effects into the probability function. Thus, ranking patterns for the respondents were generated according to the 2P-MF-FCRM-L. In the considered scenario, three tasks created by each of the 500 ratees were each evaluated by five raters, who ranked multidimensional forced-choice items along three dimensions in five item blocks. For the simulations, the topic parameters
Results
In the second simulation study, data were simulated in accordance with the performance of 500 ratees on three tasks each, evaluated by five raters in a complete ranking design, and the parameter recovery was assessed in terms of the bias and RMSE. As shown on the left-hand side of Table 5, the parameters were recovered satisfactorily, all bias values were close to zero, and the RMSE values were rather small. The additional topic parameters were estimated precisely, and it appears that the 2P-MF-FCRM-L produced better parameter estimates when multiple tasks were evaluated than when a single task was appraised under otherwise identical conditions (i.e., 500 ratees, five-item blocks, and the complete ranking design; see Tables 3 and 5). These findings are not surprising because when the raters ranked the item blocks multiple times for different tasks, a greater amount of information was obtained, facilitating accurate parameter estimation. Parameter recovery patterns similar to those for the item parameters were observed for the person parameters, as evidenced by the lower RMSE values of .229, .220, and .250 for the three latent trait estimates.
Summary of Parameter Recovery Results for the Second and Third Simulation Studies
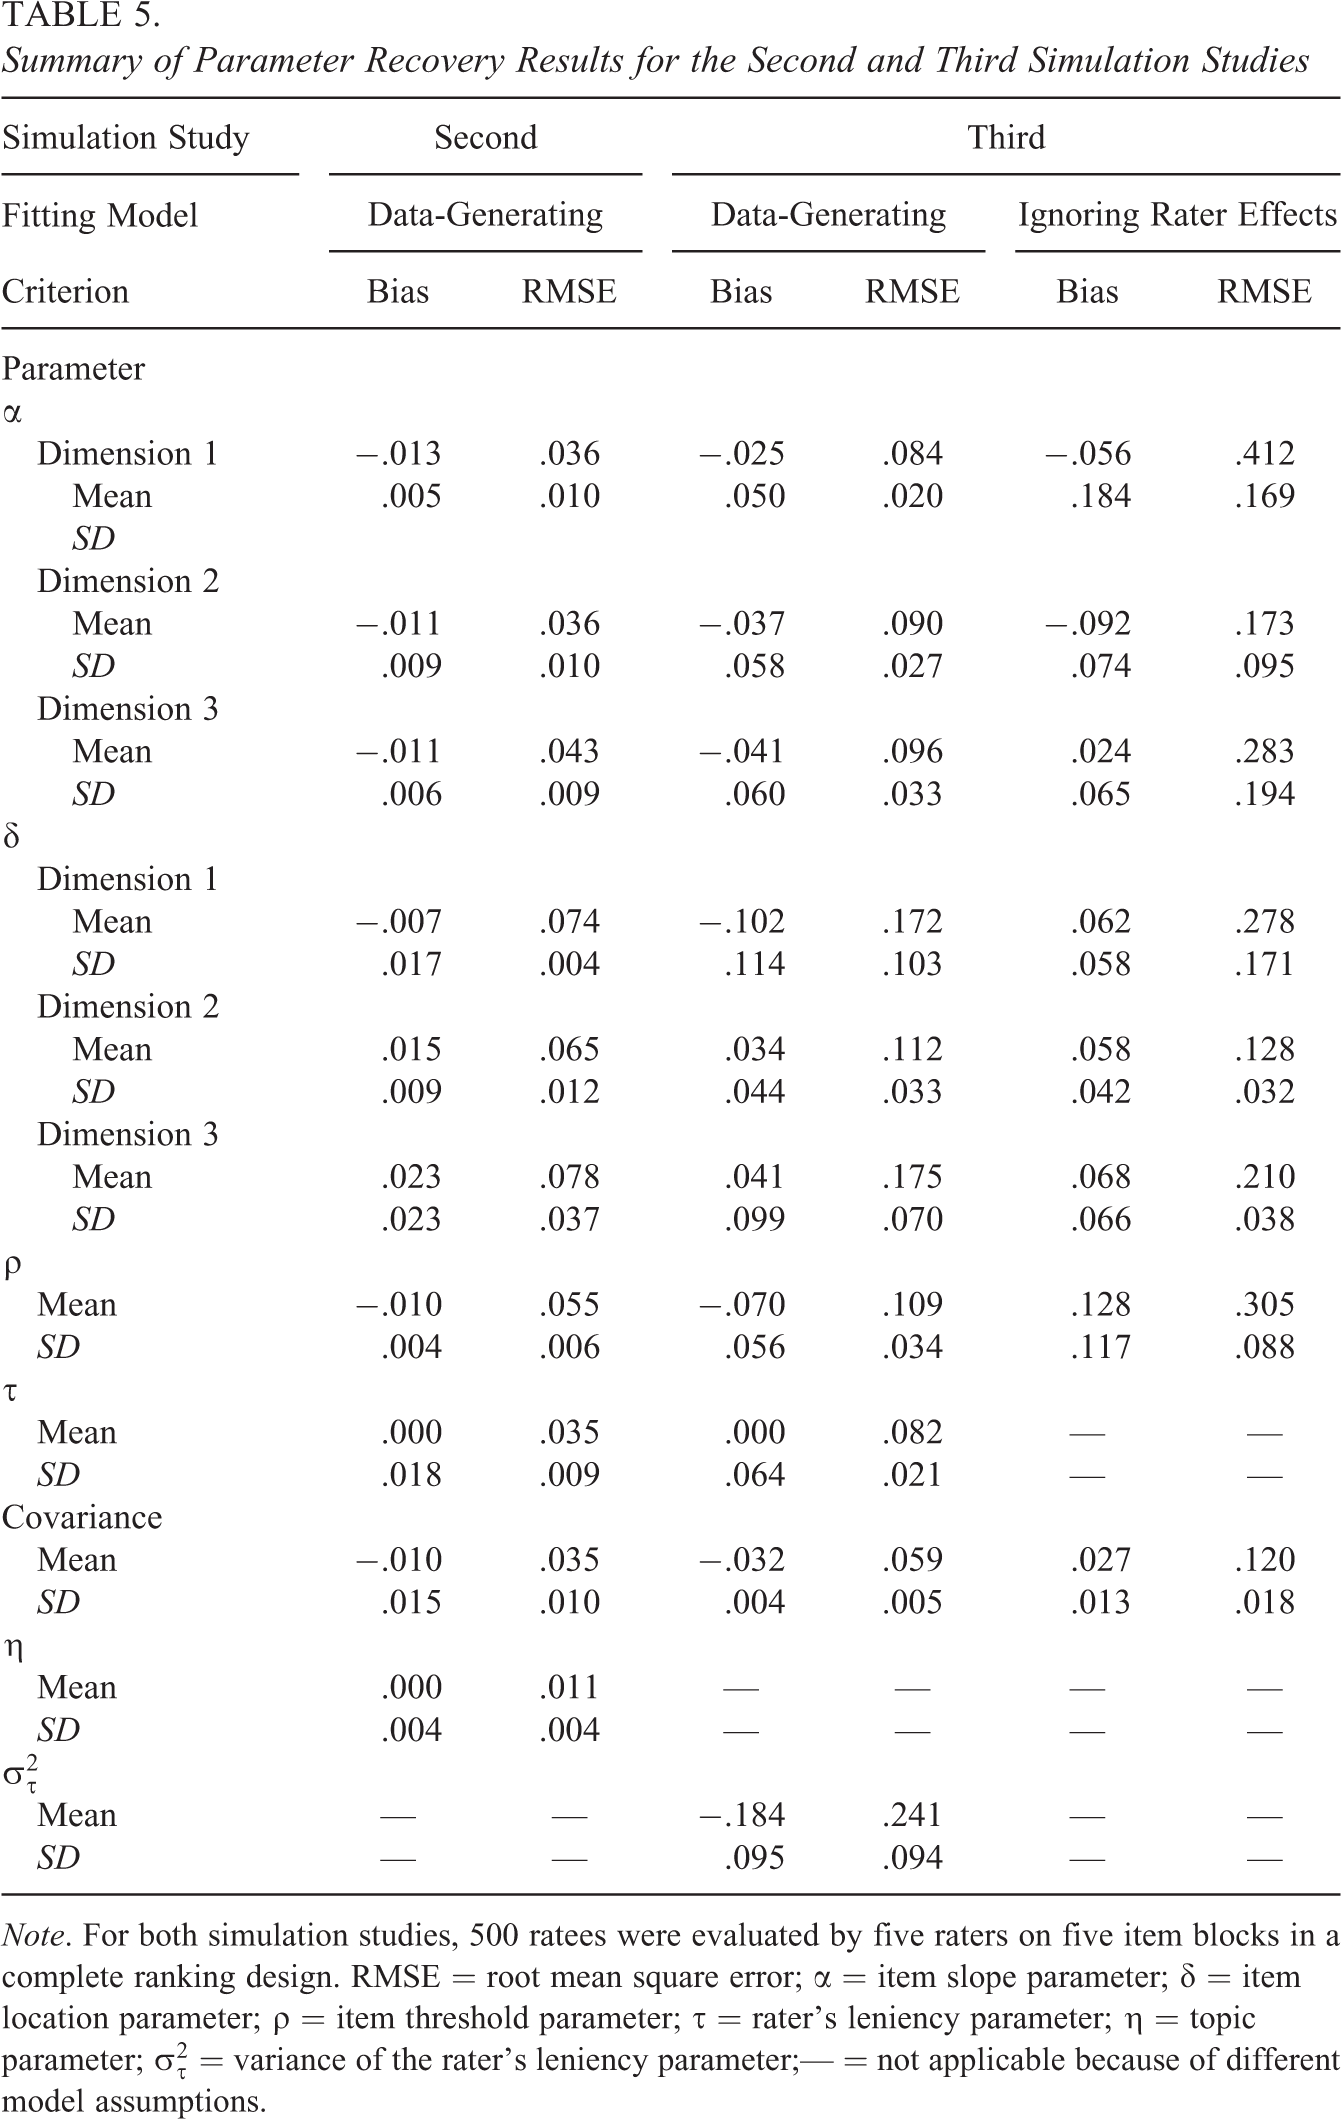
Note. For both simulation studies, 500 ratees were evaluated by five raters on five item blocks in a complete ranking design. RMSE = root mean square error; α = item slope parameter; δ = item location parameter; ρ = item threshold parameter; τ = rater’s leniency parameter; η = topic parameter;
Simulation 3
Method
Because the third simulation study considered variations in rater leniency across ratees, the leniency parameters were treated as random-effect parameters rather than fixed-effect parameters. Five raters were considered, with the variances of
Results
The right-hand side of Table 5 summarizes the parameter recovery results for the case in which the data were simulated in accordance with the 2P-FCRM-RL and were fit using both the data-generating model and the 2P-FCRM (i.e., the model ignoring rater effects) to assess the quality of parameter estimation in the more complicated extended model and to investigate the consequences of ignoring rater effects in the forced-choice ranking items for parameter estimation. As indicated by the larger bias and RMSE values obtained when fitting the data with the 2P-FCRM, model misspecification had the nontrivial effects of increasing bias and RMSE in parameter estimation. The same conclusion can be drawn for person parameter recovery, as the RMSE values for the three latent trait estimates were .420, .406, and .453 for the fit with the 2P-FCRM-RL and .539, .508, and .559 for the fit with the 2P-FCRM. When we further compare the results reported in Tables 3 and 5 that were obtained under the same simulation conditions, we find that adding additional random effects to the leniency parameters caused the quality of model parameter estimation to deteriorate, although the parameter recovery for the more complex model was still acceptable. In our modeling formulation, the raters’ leniency random effects were treated as random noise and assumed to be uncorrelated with each other and with the substantive latent trait. Because the orthogonal structure was imposed in the random-effect variable space, the estimation benefits obtained from multiple correlated latent variables were not accessible, and more uncorrelated random-effect variables would hinder the accuracy of parameter estimates (Wang & Wilson, 2005). As indicated by the consequences of ignoring rater effects on parameter estimation, different raters’ leniency levels and their variations among ratees should be considered when raters are evaluating ratees’ performance with respect to several criteria using forced-choice ranking items.
Empirical Demonstration
A real data analysis is presented here to illustrate the application of the proposed models based on different underlying process assumptions. In Taiwan, creativity is currently stressed as an important form of literacy in schooling environments. To assess the technological creativity of junior high school students, in accordance with Amabile’s theory of creativity assessment (Amabile, 1996), an open-ended task was formulated and evaluated by experts. Specifically, 384 students were recruited to design a cell phone that met junior high school students’ needs and showed personal creativity or elegance. The students were presented with several popular cell phones and provided with examples that were viewed as demonstrating high and low creativity based on three specified dimensions (described below). After receiving the instructions, the students were asked to draw a cell phone schematic and provide a verbal description of the phone’s functions. Three experienced raters independently evaluated these products (i.e., cell phone designs) on a website by ranking the students’ performance based on three dimensions: presentation, usefulness, and originality. Each dimension was evaluated based on multiple indicators, and the raters were asked to rank three indicators measuring different dimensions in each item block with respect to the products that the students had designed. The presentation dimension was assessed by two indicators corresponding to the verbal and visual presentations; usefulness was evaluated in terms of cost, function, and practicability; and originality was assessed in terms of appeal, design, labeling, and coordination. Each item block was formed by combining three indicators representing the different dimensions, and a total of 24 item blocks were presented to be ranked by the raters in evaluating the students’ technological creativity.
A variety of forced-choice ranking IRT models based on different model assumptions were fit to the responses evaluated by the raters. Three major questions were addressed in this empirical analysis: (a) Did the raters exhibit varying degrees of leniency? (b) Did the items have different discrimination parameters? and (c) If the raters exhibited varying degrees of leniency, should the variations of the leniency parameters across students be incorporated into the fitting model? Accordingly, six models were fit to the data as described below. When all the discrimination parameters were set to one, the three models of the 1P-FCRM (i.e., without raters’ leniency), 1P-FCRM-L (i.e., with raters’ leniency), and 1P-FCRM-RL (i.e., with randomness of raters’ leniency) were fit and compared. When all the discrimination parameters were freely estimated, the corresponding analysis models were the 2P-FCRM, 2P-FCRM-L, and 2P-FCRM-RL. The Bayesian deviance information criterion (DIC; Spiegelhalter et al., 2002) was used to determine which of the six models could provide the best model-data fit; the smaller the DIC value was, the better the model-data fit was considered.
Because a small sample size was used in this analysis, a common discrimination parameter across all items corresponding to the same dimension was adopted to reduce the computational burden, and the results should be interpreted with caution. Nevertheless, a comparison among the various fitting models with respect to person parameter estimation sheds light on how substantial the practical effects of the different approaches are in working with raters’ ranking data. The DIC values were 9,115.45, 10,683.10, 9,402.62, 9,753.43, 8,892.23, and 6,267.09 for the 1P-FCRM, 2P-FCRM, 1P-FCRM-L, 2P-FCRM-L, 1P-FCRM-RL, and 2P-FCRM-RL, respectively; therefore, the 2P-FCRM-RL was selected as the best fitting model because it had the smallest DIC value. To obtain evidence of the model-data fit of the 2P-FCRM-RL in an absolute sense, we applied the posterior predictive model checking method to the data within a Bayesian framework (Gelman et al., 1996) by assessing the plausibility of the replicated data against the observed data during numerous iterations based on the ranking pattern of each item block. The statistic of the Bayesian χ2 test (Jin & Wang, 2018; Sinharay et al., 2006) was used to evaluate the overall model-data fit, and the results indicated that the 2P-FCRM-RL provided a good fit to the data and was the final model of choice.
Furthermore, we chose the 2P-FCRM and 2P-FCRM-L for comparison with the 2P-FCRM-RL in terms of person parameter estimation because these three models estimate the discrimination parameters. Comparing the 2P-FCRM and 2P-FCRM-L to the best fitting 2P-FCRM-RL shows the consequences of estimating the person parameters using the two parsimonious models. Figure 2 shows a set of scatterplots of the
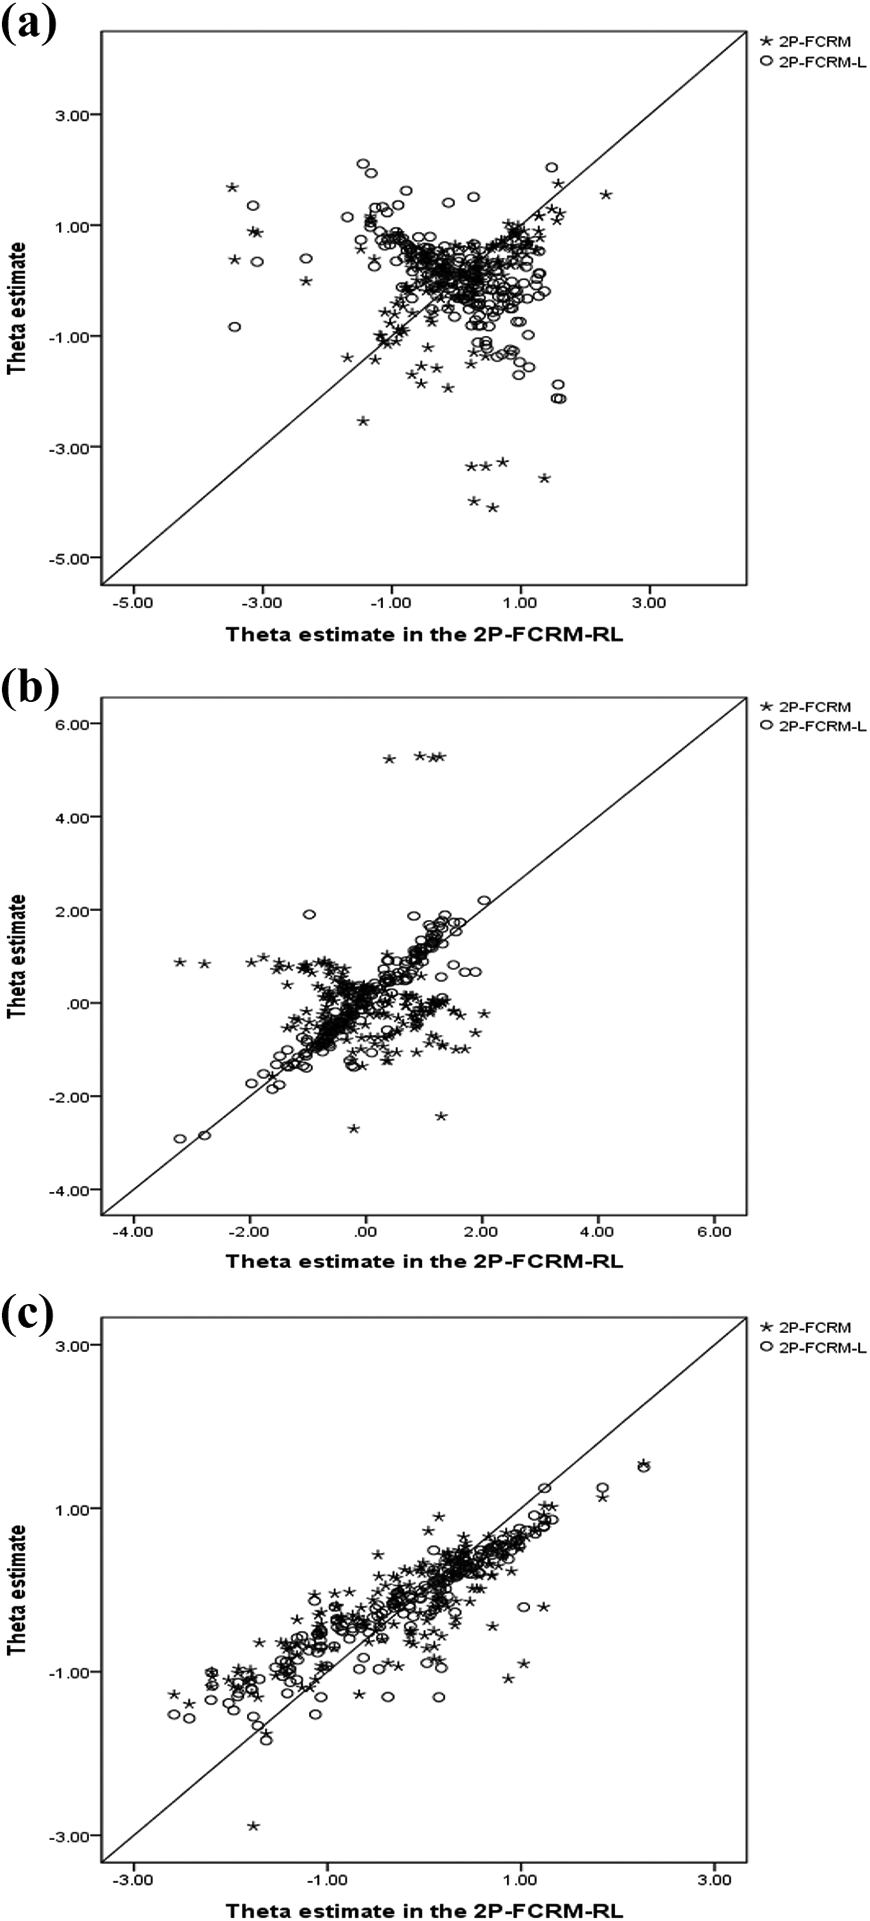
Relationships between the latent trait estimates calibrated using the two-parameter many-faceted forced-choice ranking model with random leniency, two-parameter forced-choice ranking model with raters' leniency, and two-parameter forced-choice ranking model for three dimensions. (A) Dimension 1: Presentation. (B) Dimension 2: Usefulness. (C) Dimension 3: Originality.
Conclusion
The evaluation of individuals’ performance as assessed by external raters is a commonly used approach for understanding the actual level at which a ratee performs in terms of various prespecified skills, attributes, or symptoms. Since individuals’ performance is assessed by human raters and subjective judgments are consequently inevitable, it is necessary to develop appropriate modeling methods for working with rater-mediated assessment data. Although many psychometric models and statistical post hoc corrections have been proposed in the literature to address rater errors, the methods proposed to control for the halo effect are controversial because the existing approaches have various apparent limitations. Acknowledging the possible interdependence among conceptually distinct traits when raters are issuing judgments across ratees on certain rating scales (Myford & Wolfe, 2003), we adopted forced-choice items rather than single-stimulus items to avoid the indistinguishability problem arising for judgments issued in the form of Likert-type questionnaires. An FCRM for raters’ ranking data and variants that incorporate a topic facet and the randomness of raters’ leniency were developed in this study to capture the nature of subjective human judgments and to control for the halo effect using a generalized HCM as the probability function to represent the relationship between item evaluation and the underlying cognitive process. The proposed models are highly flexible and general, allowing researchers to readily and easily develop customized models by modifying our models to fit the needs of various practical testing situations.
A series of simulations were conducted to evaluate the success of parameter recovery with the proposed FCRMs using Bayesian estimation by manipulating the number of ratees, the number of item blocks, and the completeness of the ranking design. The results indicate that better parameter recovery for the model structural parameters is associated with a larger number of item blocks, a larger sample size, and a complete ranking design, while better parameter recovery for the latent trait parameters of individuals is associated with a larger number of item blocks and a complete ranking design. When multiple tasks are evaluated, the results indicate well-recovered parameters and better parameter estimates than when only a single task is ranked under otherwise identical conditions. In the final simulation study, the interactions between ratees and raters were considered by treating the leniency parameters as random-effect parameters rather than fixed-effect parameters, and the results show that although the parameter recovery performance deteriorated slightly compared to that in the previous simulation studies, the more complicated model nevertheless provided acceptable parameter estimates. In addition, severely biased estimates were obtained when rater effects were present but were ignored by fitting the simulated data to the traditional FCRM (without rater effects), suggesting that raters’ impact should not be neglected.
A technological creativity assessment was presented as an empirical example to show how the proposed models can be applied to fit data. The data were collected before the use of smartphones became prevalent, and the recruited students were expected to exhibit their innovation as best as they could. Limited by the available research resources, the dataset was composed of ranking results for only 384 students evaluated by three experts in the form of forced-choice ranking items presented as 24 item blocks measuring three dimensions. To address several important concerns, we used various FCRMs to fit the data. The latent trait estimates extracted with the 2P-FCRM, 2P-FCRM-L, and 2P-FCRM-RL were compared to show the impact on ability estimation of using misleading models for fitting, with the 2P-FCRM-RL being the best fitting model. The results indicated that neglecting raters’ leniency levels and leniency variations had nontrivial impacts on person parameter estimation. As mentioned above, however, the small sample size used in this analysis may influence the stability and precision of parameter estimation, and the results should be interpreted cautiously.
Recalling anonymous reviewers’ comments, further consideration that a rater’s ranking pattern may not be ideally decomposed into multiple successive subranking events is warranted, and therefore, the assumption of the explosion rule should be examined explicitly and justifiably for our empirical data analysis. Indeed, the literature has indicated that some nuisance factors may be introduced to the rank-ordered choice process if the exploded logit model was applied to fit the data and would result in biased estimation (Chapman & Staelin, 1982; Fok et al., 2012). For example, an unexperienced person is capable of selecting the most preferred items but may fail to indicate the less preferred items, is likely to be annoyed with a larger number of ranking items, or may rank order their choice set by successively deleting inferior items from consideration, all of which will compromise the validity of the exploded logit model. Although several probabilistic ranking models have been proposed to deal with those unexpected choice behaviors (e.g., Fok et al., 2012; Hausman & Ruud, 1987), we decided not to consider the likelihoods resulting from the nuisances in our raters’ ranking data for the following reasons. First, the appropriate fit of the proposed model (i.e., the 2P-FCRM-RL) to the ranking data was assessed statistically and theoretically within a Bayesian framework (Sinharay et al., 2006), and a good model-data fit implied that the explosion rule was verified to dominate raters’ rank order process. Second, the rank ordering of a limited number of comparative items produced by raters (e.g., three items used in our empirical data) can be expected to mitigate rater burden and increase measurement efficiency, as suggested by previous studies (Crompvoets et al., 2020; Steedle & Ferrara, 2016). Third, because rater training is necessarily arranged prior to any formal ranking, it is justifiable to expect that trained raters are more likely to exhibit rational choice behavior (i.e., items are ranked from most to least representative of the target’s performance) than ordinary persons, and the explosion process can reasonably apply to the rank-ordered choice sets produced by human raters.
Although this study confirmed the efficiency and applicability of the proposed models in the simulation studies and empirical demonstration, an important question may arise regarding when to use the newly developed FCRMs to fit data in real rater-mediated assessments. From a methodological perspective, the nature of single-stimulus rating scales is definitely different from that of forced-choice ranking formats in terms of item construction, scoring, and interpretation. Performance assessments produced by external raters are dominated by Likert-type rating scales due to their popularity and accessibility (e.g., Wang & Engelhard, 2019). While raters’ rating data are collected and analyzed to inform decisions, researchers should be cautious in light of the detection of raters’ distortions in making judgments. Some rater errors can be addressed appropriately in the traditional IRT model framework; however, several rater effects, such as the halo effect and response style, have not been efficiently eliminated using single-stimulus formats (Murphy et al., 1993; Myford & Wolfe, 2003). If detection statistics flag raters as having halo bias (Myford & Wolfe, 2004), forced-choice ranking formats should be considered to replace single-stimulus formats and can be easily constructed by assembling multiple evaluation criteria (i.e., single-stimulus items) that measure distinct latent traits to form ranking blocks (as used in the forced-choice Big Five personality assessment; see Brown & Maydeu-Olivares, 2011). In addition, the WinBUGS codes are readily available in the Online Appendix, and readers can easily modify the codes to produce customized FCRMs for rater data analysis.
The proposed FCRMs assume that the probability of a particular ranking pattern can be partitioned into a sequence consisting of the independent probability of selecting the most preferred item from the diminishing set of alternative items. Within the context of the TIRT model, this assumption amounts to assuming a sequence of independent Thurstone’s Case V models. The actual TIRT model—employed, for instance, by Brown et al. (2017)—assumes that the probability of a particular ranking pattern depends instead on a set of interdependent response processes. The capture of ranking patterns by the TIRT model has been illustrated in previous studies (Maydeu-Olivares, 1999; Maydeu-Olivares & Böckenholt, 2005). Future studies are encouraged to compare the models introduced here in terms of model-data fit to alternative models, such as the TIRT model employed by Brown et al. (2017), to shed light on the nature of ranking pattern responses.
In this study, several commonly observed rater effects and rater biases have been considered to develop a new class of FCRMs. Other types of rater bias, however, such as logical errors (Linn & Gronlund, 2000), contrast errors (Guilford, 1954), raters’ attitudes (Murphy & DeShon, 2000), and order effects (Hopkins, 1998), have not been considered here and deserve further attention to develop more appropriate measurement models. In some cases, raters may exhibit differential leniency, thus influencing their ratings or rankings for a particular group of ratees (e.g., in terms of gender, age, or ethnicity), and differential rater functioning may arise (Myford & Wolfe, 2003; Murphy & DeShon, 2000). To address this concern, the current FCRMs can be extended by allowing the leniency parameter of a rater to be separately estimated for different groups. Furthermore, differential rater functioning may arise across ranking criteria/dimensions rather than across ratee groups. For example, a rater might be more severe in selecting the “emotionally controlled” dimension than the “adaptable” dimension in the case of the forced-choice items on the Occupational Personality Questionnaire (SHL, 2013). If a rater exhibits differential leniency levels across different dimensions, then distinct leniency parameters for different dimensions should be included in the FCRM. Finally, an alternative model for handling forced-choice ranking items is the generalized logit IRT (GLIRT) model in the framework of the Rasch model (Wang et al., 2016). The questions of how to apply the GLIRT model to analyze raters’ ranking data and how effective this model is compared to our proposed models would be interesting topics for future study.
Footnotes
Acknowledgments
The authors would like to thank three anonymous reviewers and the Editor for their helpful and constructive comments on earlier versions of this article.
Declaration of Conflicting Interests
The author(s) declared no potential conflicts of interest with respect to the research, authorship, and/or publication of this article.
Funding
The author(s) disclosed receipt of the following financial support for the research and/or authorship of this article: The first author was supported by the Ministry of Science and Technology, Taiwan (No. 108-2410-H-006-045), and the second author was supported by the Ministry of Science and Technology, Taiwan (No. 109-2410-H-845-015-MY3).
References
Supplementary Material
Please find the following supplemental material available below.
For Open Access articles published under a Creative Commons License, all supplemental material carries the same license as the article it is associated with.
For non-Open Access articles published, all supplemental material carries a non-exclusive license, and permission requests for re-use of supplemental material or any part of supplemental material shall be sent directly to the copyright owner as specified in the copyright notice associated with the article.