
Abstract
Two independent statistical tests of item compromise are presented, one based on the test takers’ responses and the other on their response times (RTs) on the same items. The tests can be used to monitor an item in real time during online continuous testing but are also applicable as part of post hoc forensic analysis. The two test statistics are simple intuitive quantities as the sum of the responses and RTs observed for the test takers on the item. Common features of the tests are ease of interpretation and computational simplicity. Both tests are uniformly most powerful under the assumption of known ability and speed parameters for the test takers. Examples of power functions for items with realistic parameter values suggest maximum power for 20–30 test takers with item preknowledge for the response-based test and 10–20 test takers for the RT-based test.
Keywords
Introduction
Attempts to cheat on tests have always existed, specifically for tests used for admission to educational programs or the licensing of candidates for professional practice. Unlike such tests as for individual counseling or diagnostic purposes, where accurate scoring typically is in the interest of all concerned, higher scores typically result in better educational or vocational opportunities. Some of the test takers may therefore feel tempted to try profiting from cheating.
The replacement of group-based, paper-and-pencil testing with online continuous testing with immediate scoring of the test takers has effectively ended traditional forms of cheating as attempts to copy answers from fellow test takers, collude with them through secret forms of communication, or bribing proctors to improve the answer sheet. However, precisely because of its continuous format, it has also led to a new type of cheating in the form of attempts to harvest test items and share them with future test takers, a possibility supported by the recent technological trend toward miniaturization of electronic recording devices and their integration in wearables. In fact, the practice has become so profitable that organized crime has entered the testing business operating through networks of henchmen and selling items through websites.
Testing programs have been keenly aware of this danger of item compromise and introduced a variety of counter measures, such as monitoring websites and social media for the presence of stolen items, practicing zero tolerance with heavy penalties for test takers caught stealing them, controlling the exposure rates of their items by rotating the item pools, or introducing randomized item-selection technique, as well as the use of forensic statistical analysis.
The idea of forensic analysis already has some tradition. As a matter of fact, a review of the existing literature shows quite a few different statistical methods introduced to detect items likely to be compromised. The first distinction it reveals is between methods designed to identify items that have been stolen and test takers who profited from knowing them. Although related, the two approaches differ in that the focus of the former is on patterns of information about items for a given test taker, whereas, conversely, the latter are primarily based on patterns across test takers for a given item. Another distinction is between the type of information that is used. Earlier methods were exclusively based on the responses produced by the test takers, but more recently, it has become clear that their response times (RTs) are an important additional source of information. Another relevant distinction is between the statistical nature of the methods, which has ranged from methods generally classified as belonging to the areas of statistical quality control, model fit analysis, change-point analysis, and residual analysis to statistical hypothesis testing. Also, several of these methods have been developed along the lines of frequentist statistics, while others follow a Bayesian approach. Finally, the methods may differ in the type of prior knowledge about the testing process they require. For instance, methods to check whether test takers had preknowledge of some of their items typically assume the set of items that were stolen from the pool to be already known.
One of the first proposals to detect items being compromised rather than test takers having profited from them was based on the cumulative sum technique from statistical quality control (Veerkamp & Glas, 2000). The method periodically re-estimates the difficulty parameter of an item and checks the cumulative changes in the estimates until it becomes too easy given the standard error of estimation. The version of the same method by van Krimpen-Stoop and Meijer (2001) can be used to detect test takers with preknowledge of an item. A related sequential procedure is change-point analysis. The first to use it was Zhang (2014) who used the marginal probability of success on the item under an item response theory (IRT) model as a statistic to detect the point of time, at which it begins to increase for an assumed population of test takers during sequential testing. Later versions of the same type of analysis have been proposed by Sinharay (2016, 2017a) and Zhang and Li (2016).
McLeod et al. (2003) were the first to use a Bayesian approach. Their method used a posterior log-odds ratio based on the response probabilities for a test taker being in the alternative hypothetical states of already knowing or not knowing the item. A later Bayesian method in the same vein was presented by Belov (2016) and Belov and Armstrong (2011), who used the posterior shift in the test taker’s ability parameter given the two subsets of secure and compromised items (for the prerequisite detection of compromised items, see Belov, 2014). X. Wang et al. (2017) also adopted the idea of comparing the test takers’ performances on suspected and secure items but used predictive distributions estimated from secure items to evaluate the observed responses on the suspected items.
The idea to use RTs rather than the responses on the test items was introduced in van der Linden and Guo (2008). Their method focused on plots of Bayesian residuals across the items for each of the test takers left after posterior prediction of their RTs; for an extensive empirical illustration of the method, both for adaptive and fixed-format testing, see Qian et al. (2016). Alternatively, a posterior expected likelihood-based person-fit statistic proposed by Marianti et al. (2014) can be used to identify test takers with aberrant RT patterns pointing at item preknowledge. Using a similar residual approach, but then from a frequentist perspective, X. Wang and Liu (2020) presented a standardized statistic with known asymptotic mean and variance to identify both items that are compromised and test takers with preknowledge of them.
An entirely different perspective has been offered by Segall (2002, 2004). His approach was not so much aimed at the detection of compromised items or test takers profiting from them but at estimating the gains in score distributions due to the presence of such items in an item pool for adaptive testing or, more effectively, minimizing such gains by adjusting the item-selection rules.
Sinharay (2017b) used the Neyman–Pearson framework of hypothesis testing to introduce a likelihood ratio and score test of item preknowledge. The tests assume the compromised items to be known. The hypotheses tested against each other were whether or not the test taker’s ability parameter in the three-parameter logistic (3PL) response model estimated from the subset of compromised items was higher than for the secure items. Recently, Sinharay and Johnson (2020) extended the likelihood-ratio test to a test of the joint hypotheses of both the test taker’s ability parameter in the response model and speed parameters in the lognormal RT model being equal or different for the two different subsets of items.
This article presents two independent statistical tests of item compromise, one based on the test takers’ responses and the other on their RTs. The tests thus share their use of both sources of information with Sinharay and Johnson but differ in several other aspects. For instance, they are tests of item compromise, not whether or not individual test takers have profited from knowing such items. Consequently, their focus is on the responses and RTs of the test takers for a given item rather than across items for a given test taker. The null and alternative hypotheses for the two new tests are formulated with the number of test takers with preknowledge of the item as unknown parameter. They are tested against each other using simple, intuitive statistics as the number of correct responses and the total time by the test takers on the item. As will be shown later, though computationally simple, the two tests demonstrate high power for items with parameter values typically met in the practice of educational testing. In fact, they can be shown to be uniformly most powerful (UMP) under the assumption of known ability and speed parameter. Due to these features, a natural application is in real-time monitoring of test items for possible compromise in a continuous online testing program. The application is possible for programs regardless of their testing format (adaptive, fixed format, linear on the fly, etc.); the only thing necessary is the collection of the responses and RTs for a window of test takers when the program is active. The choice of whether the window should be periodic or moving is to be based on practical considerations. It is also possible to use the tests as part of post hoc forensic analysis in a group-based, fixed-format testing program, but the application then misses the agility and immediate flagging of item compromise they offer in a continuous testing environment.
This article is organized as follows: First, the examples of the response and RT models used in the testing program are presented and the basic null and alternative hypotheses of an item being compromised are introduced. The hypotheses are then specified in terms of the model parameters and the two statistical tests are derived, first the test based on the test takers’ responses and then the one based on their RTs. Next, the examples of the power functions for the two tests for the case of known ability and speed parameters are presented for a realistic choice of values for the item parameters. We then discuss the impact of the necessity to estimate the ability and speed parameters in real-world applications. This article concludes with a brief discussion of a few remaining topics.
Models
To introduce the models for the response-based and RT-based tests, the following notation is used. During testing, each item is supposed to be checked for possible compromise using a window of
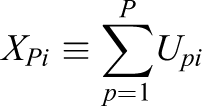
and
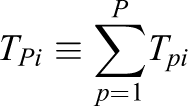
to denote the total number of correct responses by the P test takers and the total time they spent on the items, respectively.
For dichotomous items, the distribution of

where

with
The model for the RTs is the lognormal model, which postulates the distribution of the RTs

with
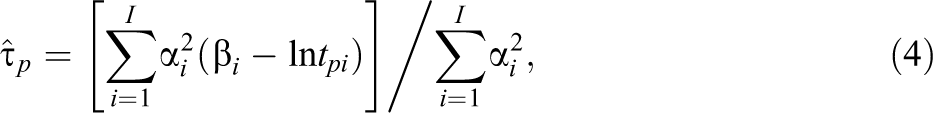
which can be interpreted as the precision-weighted average of the differences between the test taker’s logtimes and time intensities of the items. The asymptotic standard error of the MLEs is equal to
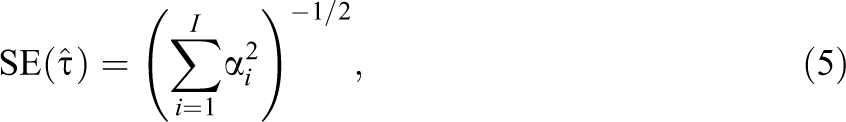
(van der Linden, 2016b, eqs. 16.13, 16.42). The consequences of using (4) to estimate the speed parameters of the test takers on the power of the RT-based test will be discussed after its presentation.
Basic Hypotheses
Let

and

The two hypotheses need to be specified further using the parameterizations of the response model in (1)–(2) and RT model in (3).
Response-Based Test
Hypotheses
Assuming the response model holds for all regular test takers, the basic null hypothesis should be specified as

However, when a test taker already knew the item, the model is no longer valid. It then seems safe to assume that a test taker motivated to get hold of an item also has made sure to know the response, which implies a probability of observing a success equal to one. But, just for the sake of generality, as the proposed tests remain valid for any increase of

Null and Alternative Distributions
As the test takers are assumed to work independently during testing, the probability of observing a response vector
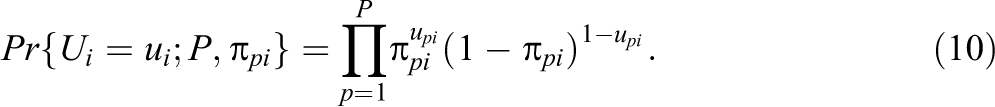
Hence, the pmf of the total number of correct responses XPi on the item is equal to
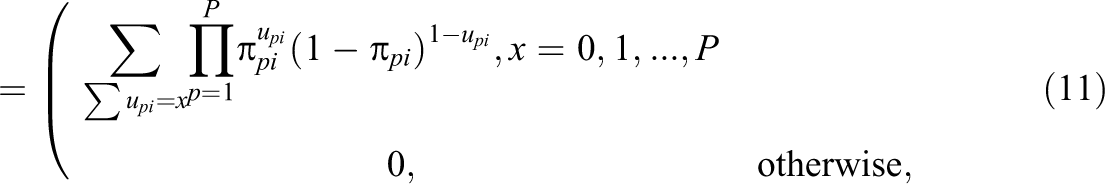
where
In order to emphasize an analogy with the RT-based test of item compromise below, it is important to note that the algorithm consists of a sequence of convolution operations applied to the pmfs for the items in (1). For the case of
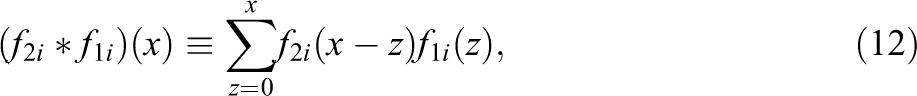
where the left-hand side is the pmf of the number of correct responses

For a review of these operations and their applications in test theory, see van der Linden (2016a).
The alternative distribution is also compound binomial but this time with the success probabilities in (9). Let

where
Probabilities under the alternative distribution can only be calculated if the identities of the test takers who already knew the item are known. However, the fact that the distribution is from the same family as the null distribution is enough to establish the statistical test of item compromise in the next section.
Statistical Test
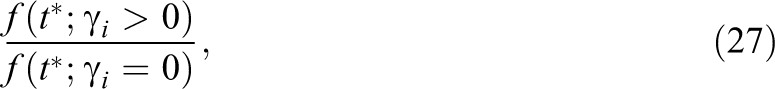
As shown by Romero et al. (2015), the family of compound binomial distributions has the property of a monotone likelihood ratio (MLR) in the number of successes x. Let
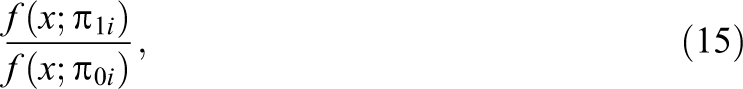
is a strictly increasing function of x. As follows from (9), the property immediately implies the MLR property for
as a function of x. We thus have a right-sided test of H 0 against H 1.
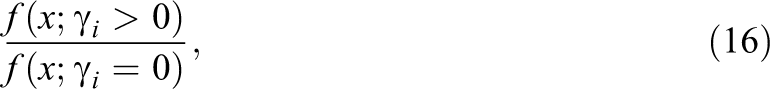
Let

Because of (16), according to the Neyman–Pearson lemma, a test of this type with known ability parameters
RT-Based Test
Hypotheses
The RT-based test starts from the same basic null and alternative hypotheses in (6)–(7), but this time they need to be translated into equivalent hypotheses about values for the parameters of the lognormal distributions of the RTs in (3) rather than the Bernoulli distributions in (1).
As the item is fixed but the test takers vary, an obvious choice is to focus on the test takers’ speed parameters. More importantly, the choice makes substantive sense too: Test takers who know the item in advance can be expected to respond faster than when they actually need to read, understand, and solve it in real time. Let


Null and Alternative Distributions
The null distribution now changes from one of the sums of discrete responses,

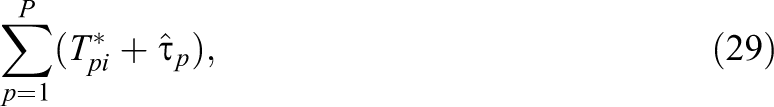
Repeated convolution of the result with the pdf of an additional test taker, similar to (13), gives us the distribution of
Let

and define
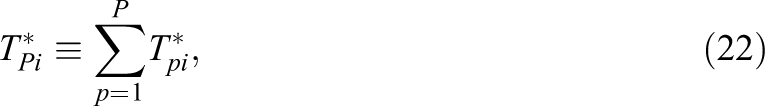
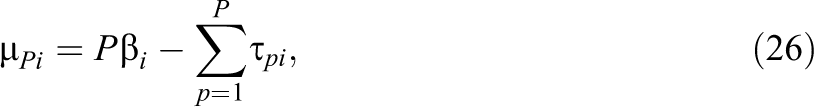
as their sum across all P test takers. For the parameterization in (3), the null distribution of
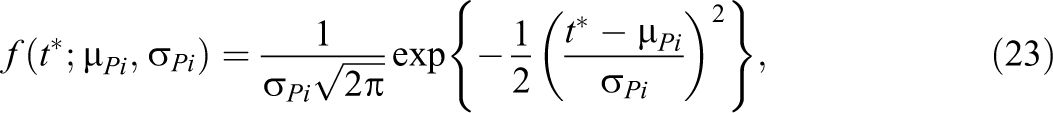
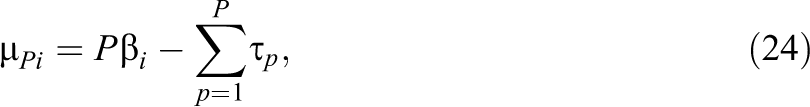
with mean and variance equal to
and

The alternative distribution is a normal with the same variance but a mean equal to
that is, with the sum of the actual speed parameters for the P test takers on the item. The sum is larger due to the increase of speed for each of the test takers with preknowledge.
Statistical Test
As P is known by design and item parameters,
as a function of
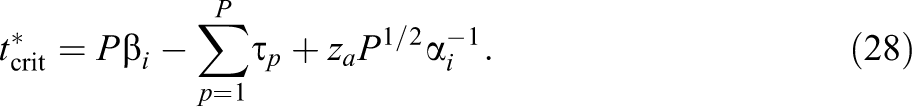
Observe the simplicity of the calculations required to apply the RT-based test during operational testing. The only data that need to be collected are the log-RTs of the test takers along with the estimates of their speed parameters. The item is then flagged for potential compromise when their sum
is smaller than the constant

Just as the response-based test, because of its MLR property, the test is also UMP for known speed parameters
Examples of Power Functions
Examples of the power functions for both types of tests are given. The examples are given for the case of known ability and speed parameters. The impact of estimation of these parameters is discussed immediately after their presentation.
As the response-based test in (17) is right sided, its power function is probability

for the family of compound binomial distributions as a function of
To calculate the functions, the following steps were taken: The response probabilities were calculated for the sample of
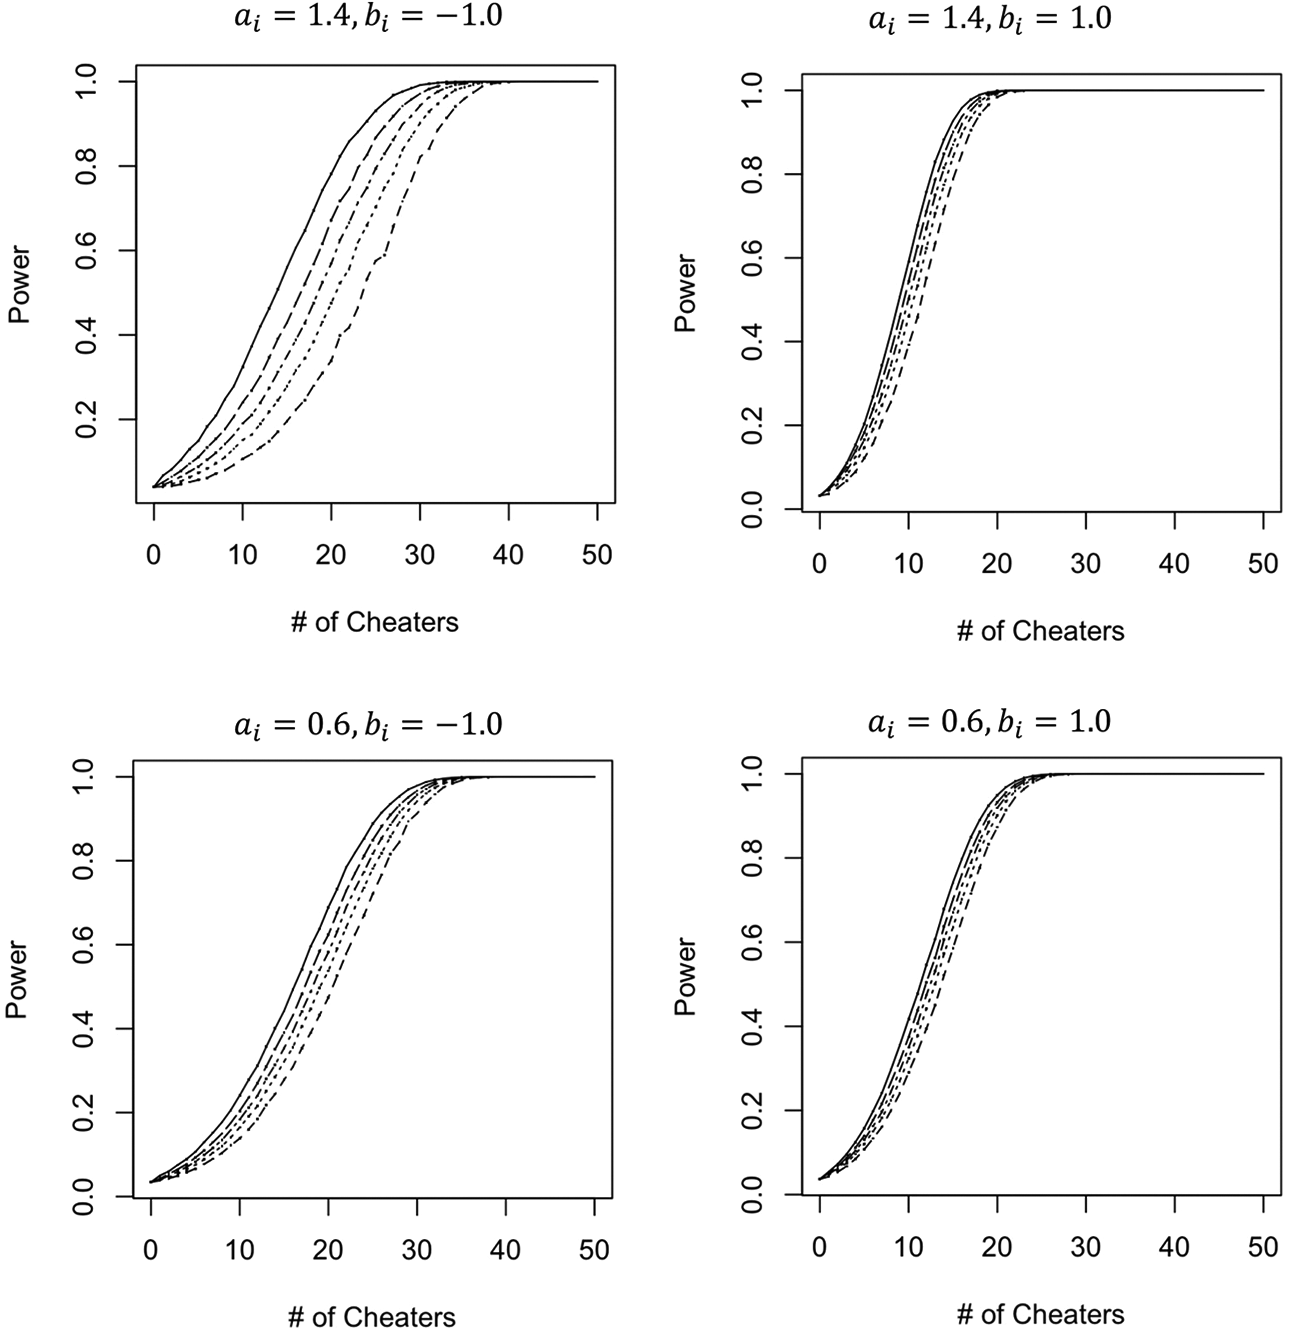
Quantiles of the power distributions of the response-based test of item compromise as function of the number of test takers with preknowledge of items with four different combinations of difficulty and discrimination parameters. Curves from the right to the left are for the 5th, 25th, 50th, 75th, and 95th quantiles, respectively.
The results point at a statistical test that detects item compromise with nearly perfect power when approximately
The RT-based test is left sided and its power is defined as

for the family of normal distributions in (23)–(26) as a function of
To illustrate the shape of the power functions, four items with common arbitrary time-intensity parameter
Figure 2 shows the average power functions for critical value
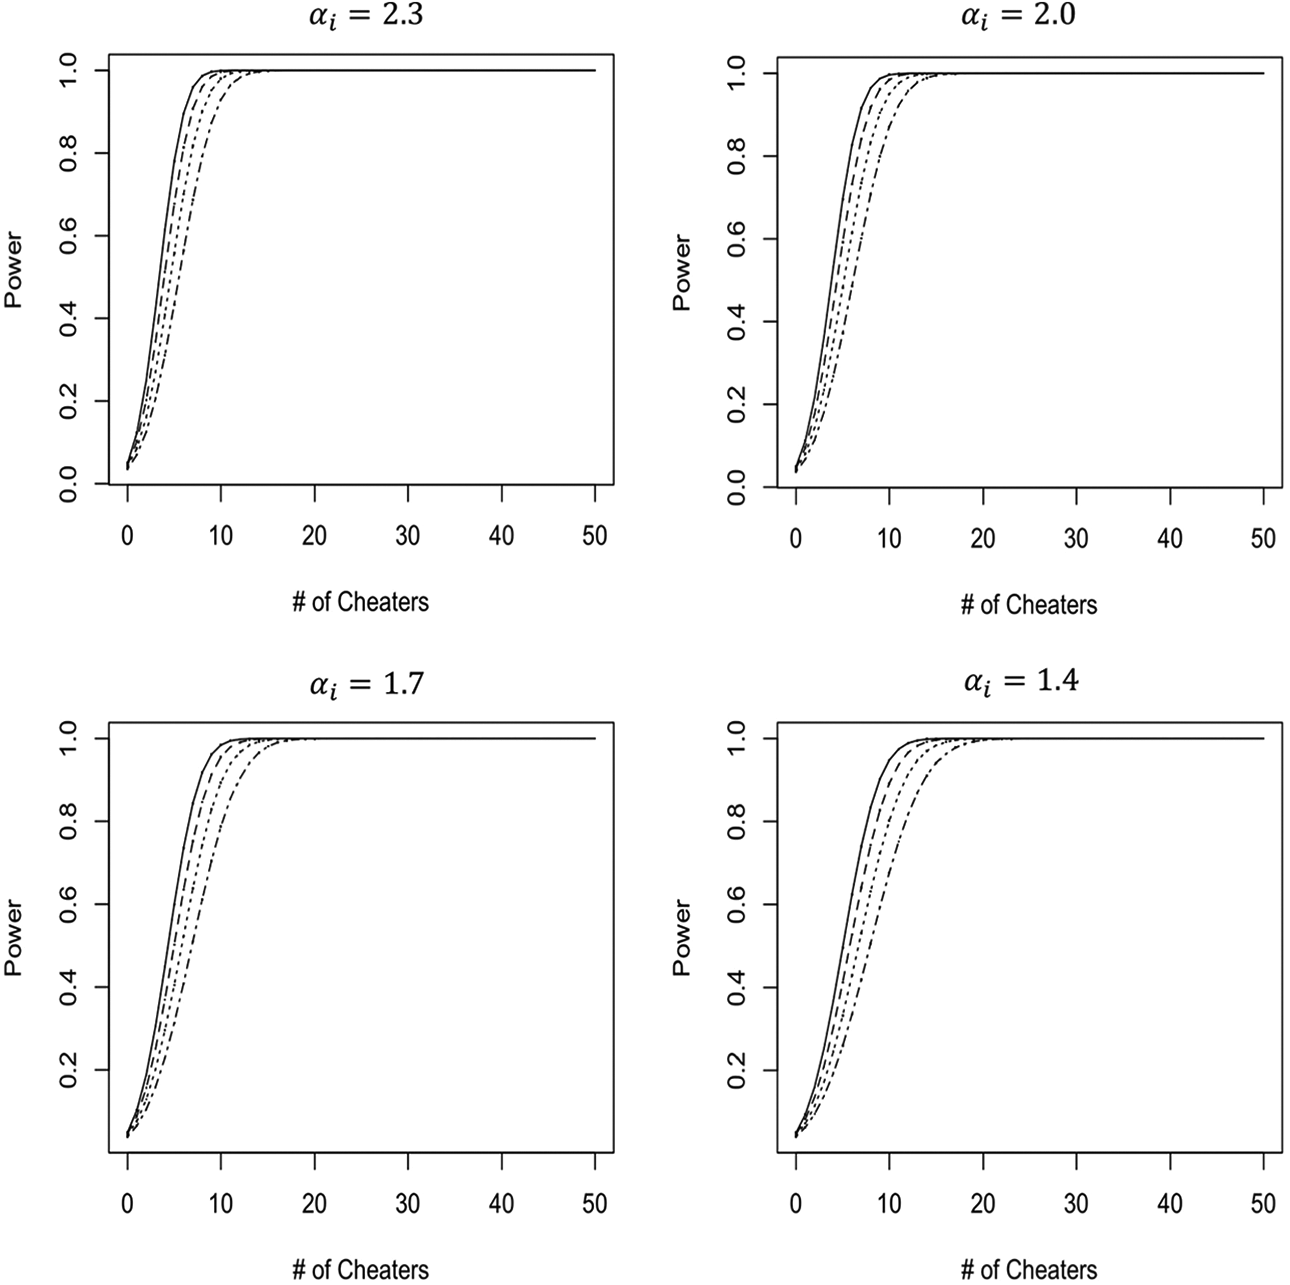
Average power functions of the response time–based test of item compromise for items with four different levels of discrimination, arbitrary time intensity, and four alternative increases of the test takers’ speed due to item preknowledge. Curves from the left to the right are for an increase of speed equal to
Estimation of Ability and Speed Parameters
When using the two proposed tests in real-world testing, the ability and speed parameters should be estimated from the test takers’ responses and RTs on the regular items in the test. A common solution in this kind of situation is use of the well-known leave-one-out method. The method should be used recursively with a first stage with each monitored item removed from estimation at a time and subsequent stages, where all items found to be suspicious are removed from the estimation until stability is obtained.
Speed parameter
Software for the estimation of the ability parameters from the test takers’ responses on calibrated items during operational testing is widely in use in the testing industry. More efficient estimation of both types of test taker parameters is even possible estimating them jointly using hierarchical modeling (van der Linden, 2007; C. Wang & Xu, 2015). Although the above argument should also hold for the response-based test, we refrain from speculation about the quantitative size of the impact of estimation of the ability parameters on its power because unlike the RT-based test, closed-form expressions as in (4) are not available for the response model in (2). The standard error of estimation does depend on the true value of the ability parameter, but, for a well-designed test, the ability and item parameters match and the error is minimal. It is recommended to evaluate the impact empirically when the item parameters and the expected range of ability parameters are known prior to the use of the test in operational testing.
It is important to note that loss of power due to parameter estimation does not necessarily imply loss of optimality for a statistical test relative to the class of tests requiring estimation of the same parameters. A necessary condition for maintaining optimality is estimation based on a sufficient statistic, a condition met for MLEs of the individual speed and ability parameters. The invariance property of MLE guarantees the same condition to be met for the sum of the speed parameters and the vector of success probabilities serving as parameters of interest in the two tests. However, observe that we are not faced with the standard situation of a statistical test of a hypothesis about an intentional parameter with a null distribution requiring the estimation of one or more nuisance parameters (as, for instance, when the variance of the distribution for the RT-based test would have been unknown). Also, the test statistics for the two proposed tests of item compromise and the speed and ability estimates are calculated from the responses and RTs collected from different sets of items. Having been unable to find theory about this specific case, the author refrains from conclusions about sufficient conditions for optimality of the two proposed tests.
Discussion
An issue still investigated is how to use the two proposed tests in combination. The standard assumption of conditional (or “local”) independence between responses and RTs on each item, which, under the null hypothesis of
The natural follow-up of a test of item compromise is an attempt to identify the test takers who actually profited from the compromised item. The options for doing so depend on the number of items monitored simultaneously. If an incidental item is monitored, one response and RT per test taker is available to check on their integrity. The only possible option then seems residual analysis, looking for test takers with a combination of low ability and speed producing a correct response in a short time on a more difficult, time-intensive item, as demonstrated in the empirical example in van der Linden and Guo (2008). The option is less effective for compromised items that are relatively easy and/or less time intensive though. Better practice seems to monitor all items in the pool simultaneously and follow-up with one of the statistical tests of item preknowledge for the identified set of compromised items reviewed in the introduction to this article, for example, the likelihood-ratio test by Sinharay and Johnson (2020).
The issue of power deserves not only statistical attention though. Ultimately, the combination of the choice of window size and significance level for a test of item compromise should depend on the evaluation of the relative consequences of a false positive and false negative decision to flag an item as suspicious. If a testing program has enough pretested items in stock to replace a suspicious item, a false negative decision will do much more harm to the program than replacing it too early. It could even be argued that, for such programs, the significance level should be set higher than the traditional choice of
Finally, it is important to remember that, no matter its power, a significant result for a statistical test only satisfies a necessary condition for the alternative hypothesis to be true. For example, higher actual speed on an item than expected for a test taker could also be the result of guessing on items located toward the end of speeded test. Lack of sufficient evidence is probably less of a concern to a testing program willing to accept a false positive decision as price for a conservative policy. However, it definitely should be a concern when follow-up statistical tests are used to check on test takers with preknowledge on items flagged as compromised. It is then always important to supplement the tests with evidence in the form of reports of observed irregular behavior during testing, detected visits to websites offering stolen items prior to the test, or membership of cliques of test takers with possible preknowledge of the same set of items (e.g., Belov & Wollack, 2021).
Supplemental Material
Supplemental Material, sj-lyx-1-jeb-10.3102_10769986221094789 - Two Statistical Tests for the Detection of Item Compromise
Supplemental Material, sj-lyx-1-jeb-10.3102_10769986221094789 for Two Statistical Tests for the Detection of Item Compromise by Wim J. van der Linden in Journal of Educational and Behavioral Statistics
Footnotes
Author’s Note
The opinions and conclusions contained in this article are those of the author and do not necessarily reflect the policy and position of the Law Schools Admission Council.
Declaration of Conflicting Interests
The author(s) declared no potential conflicts of interest with respect to the research, authorship, and/or publication of this article.
Funding
The author(s) disclosed receipt of the following financial support for the research and/or authorship of this article: This study received funding from the Law Schools Admission Council.
References
Supplementary Material
Please find the following supplemental material available below.
For Open Access articles published under a Creative Commons License, all supplemental material carries the same license as the article it is associated with.
For non-Open Access articles published, all supplemental material carries a non-exclusive license, and permission requests for re-use of supplemental material or any part of supplemental material shall be sent directly to the copyright owner as specified in the copyright notice associated with the article.