
Abstract
Interactive tasks designed to elicit real-life problem-solving behavior are rapidly becoming more widely used in educational assessment. Incorrect responses to such tasks can occur for a variety of different reasons such as low proficiency levels, low metacognitive strategies, or motivational issues. We demonstrate how behavioral patterns associated with incorrect responses can, in part, be understood, supporting insights into the different sources of failure on a task. To this end, we make use of sequence mining techniques that leverage the information contained in time-stamped action sequences commonly logged in assessments with interactive tasks for (a) investigating what distinguishes incorrect behavioral patterns from correct ones and (b) identifying subgroups of examinees with similar incorrect behavioral patterns. Analyzing a task from the Programme for the International Assessment of Adult Competencies 2012 assessment, we find incorrect behavioral patterns to be more heterogeneous than correct ones. We identify multiple subgroups of incorrect behavioral patterns, which point toward different levels of effort and lack of different subskills needed for solving the task. Albeit focusing on a single task, meaningful patterns of major differences in how examinees approach a given task that generalize across multiple tasks are uncovered. Implications for the construction and analysis of interactive tasks as well as the design of interventions for complex problem-solving skills are derived.
Keywords
Interactive tasks as implemented in the problem-solving in a technology-rich environment (PSTRE) domain in the Programme for the International Assessment of Adult Competencies (PIAAC, Organization for Economic Cooperation and Development [OECD], 2013) and the problem-solving domain in the Programme for International Student Assessment (OECD, 2014) aim at mirroring real-life problem-solving behavior (Goldhammer et al., 2013). Being computer-administered, assessments using interactive tasks support logging additional data on the type, order, and timing of the actions examinees executed in the form of time-stamped action sequences. These pose a rich source of information that may facilitate investigating how examinees approached a task and arrived at their given response. In this study, we focus on utilizing this information for gaining a better understanding of the behavioral patterns associated with incorrect responses. These can occur for a variety of different reasons, ranging from lack of different subskills and/or metacompetencies required to solve the task through misinterpreting instructions to examinees not exerting their best effort and interacting quickly and superficially with the task at hand.
Understanding behavioral patterns associated with incorrect responses comes with great potential for both the interpretation of results and the improvement of the construction of interactive tasks.
First, test administrators can gain a deeper understanding of the manifold sources of errors on interactive tasks and further differentiate between examinees who failed to solve a given task. For instance, common misconceptions can be detected. Likewise, groups of examinees can be identified that lack subskills or metacompetencies with respect to different aspects required to solve the task. Hence, a fine-grained understanding of incorrect behavioral patterns allows to gain more information on the skills that examinees have or lack than the mere fact whether examinees could solve a given task and/or the assessment of sum scores and proficiency estimates. Throughout various fields, this knowledge can then be put to action when giving feedback and may aid choosing interventions to improve skills (Stadler et al., 2019). In the context of large-scale assessments, policymakers can derive support programs for students or workforce interventions based on an improved understanding of the skills subpopulations are lacking. In learning and instruction (e.g., in the context of learning apps or technology-enhanced classrooms), knowledge on how learners failed on a task may assist in improving learning experiences by giving individualized feedback or administering exercises tailored to the improvement of specific skills.
Second, understanding incorrect responses supports distinguishing examinees showing good faith attempts to solving the task but lacking the skills for doing so and examinees being unmotivated to engage with the task and thus not giving their best effort (see, e.g., Wise, 2017, for methods to distinguish engaged and disengaged responses on classical test items, i.e., multiple-choice and simple constructed response items).
Third, understanding incorrect behavioral patterns potentially assists the identification of ambiguous wording in instructions or aspects of item features that are confusing for examinees. He and von Davier (2016), for instance, spotted an item structure issue in the Japanese version of one PIAAC PSTRE task where examinees showed an increase in repeated search actions and typing errors in a search engine. This issue was caused by a compulsory space set between words that is not commonly used in daily life in Japan. Such issues can be assumed to be revealed to a greater extent in incorrect rather than correct behavioral patterns. Hence, based on a better understanding of incorrect behavioral patterns, aspects of items that might elicit misinterpretation can be identified and improved.
Time-stamped action sequences provide information on the particular actions executed and the time required for their execution. In this study, we aim to leverage the rich information contained in time-stamped action sequences to add to the understanding of incorrect responses to interactive tasks. Analyzing data from a PIAAC PSTRE task, we focus on two different aspects of incorrect behavioral patterns. First, we aim at investigating what distinguishes incorrect behavioral patterns from correct ones. Second, we aim at identifying subgroups of examinees with similar incorrect behavioral patterns, thus disentangling different types of behavior associated with failure on the task. To address these research aims, we make use of complementing applications of different sequence mining techniques developed for the analysis of sequence data from interactive tasks.
Previous Research on Incorrect Responses to Interactive Tasks
Contrasting incorrect against correct behavioral patterns
Commonly, studies exploring how examinees approach interactive tasks have found action sequences and time spent on task of incorrect responses to display considerably larger variation than those of correct responses (He, Borgonovi, & Paccagnella, 2019, 2021; He, Liao, & Jiao, 2019; He & von Davier, 2016; Stadler et al., 2019; Tang et al., 2020a). These findings can be interpreted as an indicator of the greater variety of behavioral patterns associated with incorrect as compared to correct responses. These findings have emerged for different types of interactive tasks as well as for different methods employed for analyzing action sequence data.
Tang et al. (2020a) used an exploratory latent variable approach to analyze action sequences from interactive tasks. To that end, the authors constructed a distance measure describing the similarity of action sequences and extracted latent features from these via multidimensional scaling. Analyzing tasks from the PIAAC PSRTE domain, Tang et al. (2020a) found that, consistent across tasks, the first principal feature extracted could best be understood as capturing information on the length of action sequences. The authors interpreted this feature as an indicator of attentiveness, with the underlying rationale that attentive examinees try to “understand and complete the task by exploring the environment, thus taking more actions” (Tang et al., 2020a, p. 11), while inattentive examinees do not show meaningful interactions with the simulated environment or try to directly skip the task. Interestingly, attentiveness did not vary largely across examinees who solved the task but showed large variation across examinees who failed to do so. The authors interpreted these results as a manifestation of the manifold reasons potentially underlying incorrect responses, ranging from misunderstanding the task requirements through lack of skills to careless answering.
Focusing on a single task from the PIAAC PSTRE domain, He, Liao, and Jiao (2019) found that examinees who solved a task correctly did not differ substantially in their level of proficiency, regardless of problem-solving strategies applied. For examinees who did not solve the task, however, there were substantial differences in proficiency across different types of solution strategies. Examinees who executed more actions and spent longer time on the task were more likely to obtain a higher score. The authors concluded that examinees who put more effort (i.e., longer action sequences and time) into solving the task, even though they failed, were still more likely to display higher PSTRE skills.
For analyzing data from the PIAAC PSTRE domain, He and von Davier (2015, 2016) used n-grams to detect common patterns in successful and unsuccessful action sequences. They found action sequences associated with correct responses to be more consistent across countries than those associated with incorrect responses. A possible reason for the relatively low consistency rate in the incorrect group may be the diversity of mistakes that led to incorrect responses.
In-depth investigation of incorrect responses
Analyzing action sequences of complex problem-solving tasks from a Finnish educational study, Stadler et al. (2019) were able to demonstrate the vast potential of understanding incorrect behavioral patterns. In their analyses, Stadler et al. (2019) focused on a subsample of examinees employing the vary-one-thing-at-a-time (VOTAT) strategy, that is, separately varying input variables. VOTAT is commonly associated with successful task completion to complex dynamic control tasks (Greiff et al., 2015; Osman, 2010; Tschirgi, 1980). Stadler et al. (2019) found that examinees providing incorrect responses albeit applying this strategy oftentimes did not systematically assess results after varying an input variable. They concluded that these examinees “either lacked understanding of the VOTAT strategy or were not able to manage their use of the strategy” (Stadler et al., 2019, p. 7). A potential cause for that may be lack of “metastrategic competencies that enable a person to not only apply the correct strategy to solve a problem but to make use of the information gained in the process” (Stadler et al., 2019, p. 7). Hence, by combining in-depth analyses of incorrect action sequences with subject-matter knowledge on complex problem-solving processes, Stadler et al. (2019) were able to gain a fine-grained understanding of potential processes associated with incorrect responses on complex problem-solving tasks. Their study, however, is limited in that it only focused on a subsample of examinees who were proficient enough to apply the VOTAT strategy and, as such, had at least a basic intuition of how to approach the given complex problem-solving task. For examinees who did not apply the VOTAT strategy, incorrect responses can be assumed to be more heterogeneous since examinees presumably approached the tasks with more idiosyncratic strategies. Furthermore, the study only focused on action sequences but did not consider the associated timing data.
The Potential of Timing Data for Better Understanding Incorrect Responses
In passing, He, Borgonovi, and Paccagnella (2019) discussed the vast potential of considering timing data for disentangling different incorrect behavioral patterns for examinees who did not perform any actions on an interactive task. The authors delineated the potential of investigating the time interval between opening a task and proceeding to the next task to better understand such behavioral patterns. In this context, quickly proceeding to the next task may suggest low effort, while taking time to read instructions and evaluate the task without performing further actions may indicate that examinees lacked the understanding or skills needed to solve the task. Likewise, when examinees conducted only few actions using a relatively short time, this may indicate rather different ways of how examinees approached the task: When few, predominantly exploratory, unsystematic, or superficial actions were conducted in a short period of time, examinees may have approached the task without giving their best effort to solve it. In contrast, when examinees spent a longer period of time on the task performing the same actions, this may indicate that examinees tried to solve the task but lacked basic skills for doing so and, therefore, only slowly performed superficial and unsystematic exploration of the task environment. Following this line of reasoning, Sahin and Colvin (2020) suggested to combine information on the time spent on task with information on the number of performed actions to classify responses as rapid, disengaged responses. Building on work by Wise (2017), the authors suggested multiple possibilities for doing so, for instance, to flag all responses associated with times spent on task below a predefined threshold and with at most one performed action as rapid-disengaged. Note that these approaches focused on total time on task and left time taken for single actions unconsidered. Interactive tasks, however, do provide the opportunity to record time stamps for each performed action, documenting how much time an examinee took for each single action performed.
So far, information on action-level timing has predominantly been used to derive theory-based behavioral indicators and to employ these indicators for predicting success or failure on a task. Stelter et al. (2015) employed time spent on automatable subtasks (e.g., drag-and-drop events or setting a bookmark via the toolbar of a browser) as an indicator of the degree of automation of the procedural knowledge. The authors could show that shorter time spent on automatable subtasks was indeed associated with success on PIAAC PSTRE tasks, indicating higher levels of proficiency. Albert and Steinberg (2011) and Eichmann et al. (2019) used information on action-level timing to construct indicators of planning behavior. While Albert and Steinberg (2011) employed the time elapsed from beginning the task until performing the first action as an indicator of initial planning behavior, Eichmann et al. (2019) derived multiple behavioral indicators of planning behavior throughout the task: (a) the longest planning interval, given by the longest time interval elapsed between actions; (b) the time when (most of) the planning takes place, defined as the time elapsed until the longest planning interval occurred; and (c) the variation in planning time, given by the variance of times elapsed between any two successive actions. Both Albert and Steinberg (2011) and Eichmann et al. (2019) could show that planning time is beneficial for successful task completion.
These studies illustrate that even if the same actions are performed, differences in timing may be indicative of differences in how examinees approached the task. They further illustrate that long as compared to short action-level times may be seen as indicators of high proficiency in some contexts (e.g., when indicating planning time) and of low proficiency in others (e.g., when indicating the degree of automation of procedural knowledge or time required to get familiar with the task environment) and that, as such, behavioral indicators need to be derived with caution. However, given that time-stamped action sequence data are usually complex, reflecting the wide diversity of human behavior (Tang et al., 2020b), not for all types of tasks and/or performable actions theoretical presumptions may exist, limiting applicability of analyses that are based on theory-derived indicators.
Objective
Behavioral patterns associated with incorrect responses to interactive tasks have been shown to be heterogeneous, suggesting multiple sources of failure on a given task (He, Liao, & Jiao, 2019; Stadler et al., 2019; Tang et al., 2020a). In this study, combining complementing insights from different exploratory analyses, we aim at a more comprehensive understanding of incorrect behavioral patterns. We do so by addressing two research objectives. First, we aim at investigating in which way action sequences of incorrect responses differ from those of correct ones. Second, we focus on incorrect responses only and aim at finer-grained disentanglement of behavioral patterns resulting in incorrect responses. To that end, we make use of the rich information contained in time-stamped action sequences, allowing for a richer description of behavioral patterns in terms of both performed actions as well as the time elapsed in between.
Methodological Considerations
The collection of time-stamped action sequence data retrieved from interactive tasks can be perceived as a sequence database. These are defined to consist “of sequences of ordered elements or events, recorded with or without a concrete notion of time” (Han et al., 2006, p. 498). Sequential pattern (or sequence) mining is concerned with extracting meaningful information from such data by uncovering relationships between occurrences of sequential events, that is, investigating whether there exists any specific order of event occurrences (Mooney & Roddick, 2013). There are manifold techniques to extract information from sequence data (see Mooney & Roddick, 2013, for an introduction and overview). In recent years, these have been employed and adapted to uncover meaningful patterns in process data from interactive tasks (e.g., Eichmann et al., 2020; He & von Davier, 2015; Qiao & Jiao, 2018; Sukkarieh et al., 2012). Note that different approaches support the assessment of different aspects and patterns of (time-stamped) action sequences data. In what follows, we first describe the data and the data preprocessing procedure. We then describe the sequence mining techniques employed in the present study and delineate their utility for addressing our two research objectives—investigating what distinguishes incorrect from correct responses and disentangling different behavioral patterns associated with incorrect responses.
Data and Materials
The present study was implemented on an exemplarily chosen item from the PIAAC 2012 PSTRE domain. The PSTRE domain is aimed at measuring “abilities to solve problems for personal, work and civic purposes by setting up appropriate goals and plans, and accessing and making use of information through computers and computer networks” (OECD, 2013, p. 56). We analyzed action sequences and the associated times to actions for incorrect responses to item U01a. Item U01a locates at the first position of the first problem-solving cluster (PS1) and only has a single email environment involved. There are four cognitive dimensions of PSTRE that are assessed in PIAAC, including setting goals and monitoring progress, planning and self-organizing, acquiring and evaluating information, and using information (OECD, 2012, p. 49). The task in U01a is to sort invitees’ feedback (can or cannot come) to a party invitation into already existing folders. It was designed to mainly assess the subdimensions “acquiring and evaluating information” and “using information.” Figure 1 shows an example item with an email environment from the Education and Skills Online Assessment that shares the item interface with the PIAAC item U01a, but not the content. As shown in Figure 1, the item interface is divided into two sections—the item instruction and the interactive simulation, located on the left and right side, respectively. Within the interactive section, examinees can use the functions from the menu or toolbar and can also drag and drop emails into the corresponding folders right next to the emails. 1

An example item with an email environment from the Education and Skills Online Assessment which shares the item interface structure but not content with the Programme for the International Assessment of Adult Competencies item design of item U01a.
We focused on the U.S. sample, where, out of 1,330 examinees assessed, 385 examinees provided an incorrect response to item U01a, while the remaining 945 solved the task either partially or fully correct. Note that since examinees received partial credit when at least one (but not all) email was sorted correctly, partially correct responses are conceptually more similar to correct than to incorrect responses. This is also corroborated by findings in He, Borgonovi, and Paccagnella (2019), where similarities between individual action sequences and expert-defined sequences were computed per item. For item U11b, which parallels U01a in that it contains a comparable task within the same email environment, the average similarity to expert-defined sequences of action sequences that received partial credit was much closer to the average similarity of action sequences with full credit than to those with no credit. This suggests that partially and fully correct action sequences are more similar to each other and thus can be collapsed into one group. Following Ulitzsch et al. (2021a), actions that are not essential to successfully solve the task were recoded by aggregate-level categories (e.g., “responding to an email,” “seeking help,” “keystrokes,” “creating new folder,” “using the toolbar,” “opening folders”). In addition, email and folder identifiers were dropped. For instance, “dragging an email” was created as a single category without preserving information on the specific email being dragged. This resulted in 23 types of actions in total. An overview of performable actions, giving both absolute and relative frequencies of action sequences containing the action within incorrect and (partially) correct sequences (sequence frequencies) as well as raw frequencies of actions within each response group (action frequencies), is given in Table 1. In addition, we collapsed immediately adjacent identical actions into a single action and the associated times to action into a single time to action. For instance, if an examinee opened two folders adjacently without any further actions executed in between, this was considered as one action and the time to action associated with the next performed action was the time elapsed from opening the first folder until performing the next action not related to opening folders.
Description and Frequencies of Performable Actions by Response Group
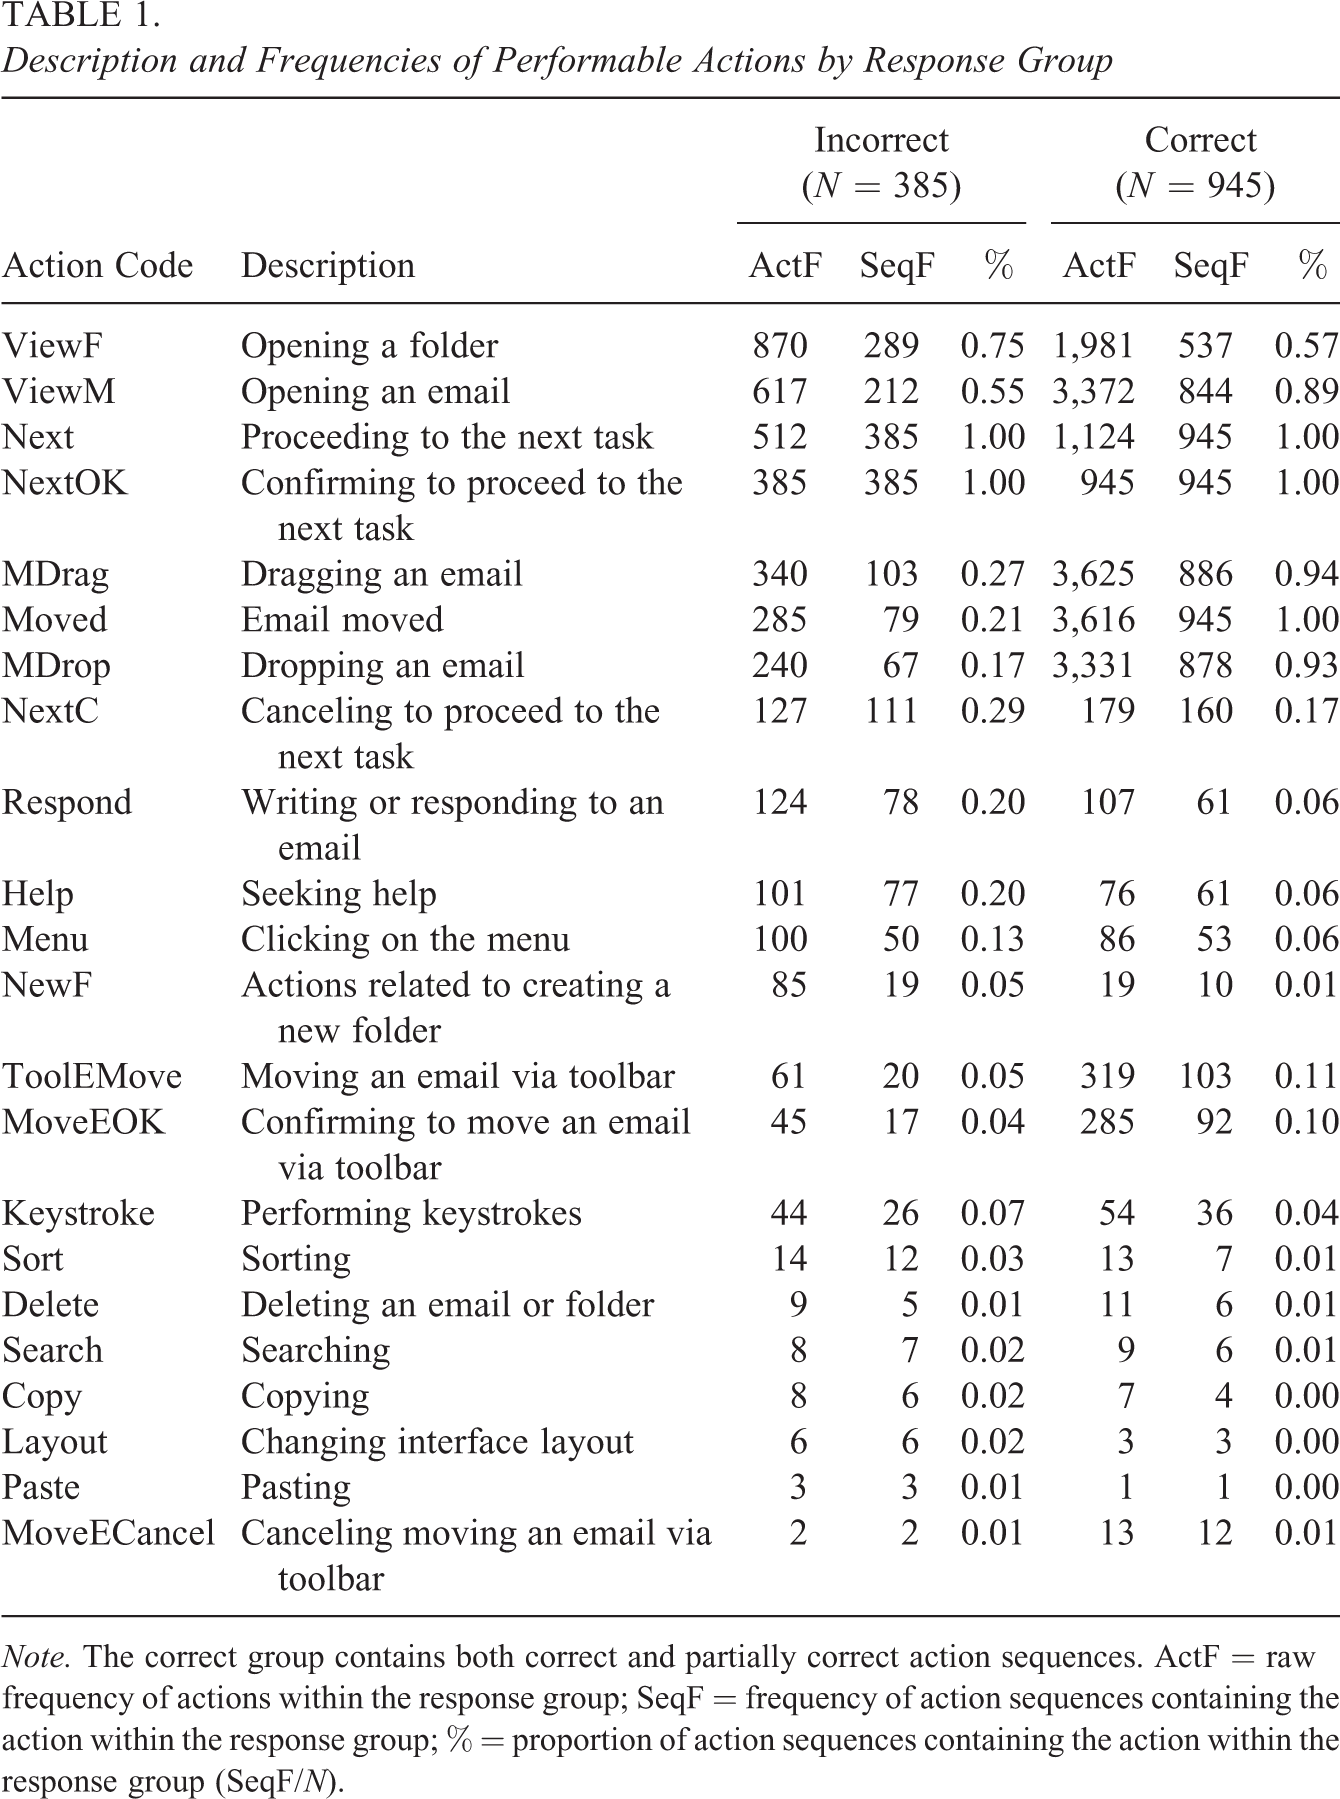
Note. The correct group contains both correct and partially correct action sequences. ActF = raw frequency of actions within the response group; SeqF = frequency of action sequences containing the action within the response group; % = proportion of action sequences containing the action within the response group (SeqF/N).
Analyses
Differences Between Incorrect and Correct Behavioral Patterns
For a first, general understanding of incorrect behavioral patterns, we contrasted median and middle 50% action sequence length and time spent on task as well as frequently encountered n-grams, that is, contiguous subsequences of size n, from action sequences associated with incorrect and (partially) correct response patterns. This supports investigating in terms of which features incorrect behavioral patterns differ from (partially) correct ones.
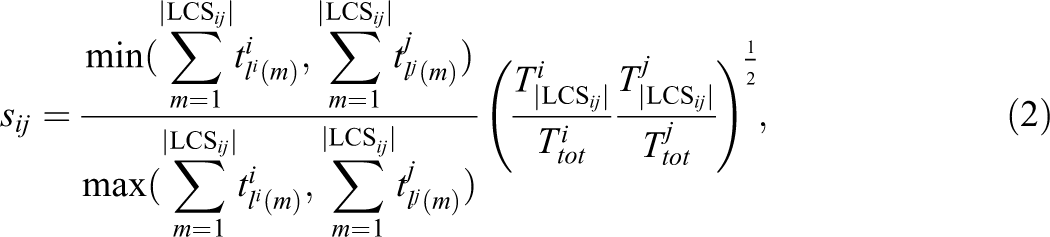
In line with He and von Davier (2016), we computed weighted frequencies of uni-, bi-, and trigrams, with weight

where
We used χ2 for robust feature identification, with the 2 × 2 contingency table being based on the occurrence and nonoccurrence of the respective n-gram within the group of correct and incorrect action sequences. Within each response group, occurrence is given by the weighted sum of n-gram g and nonoccurrence is given by the difference between the weighted sum of all n-grams and the weighted sum of n-gram g (see He & von Davier, 2016, for a more detailed description). Actions associated with higher χ2 values can be considered as more discriminative in classification (Manning & Schütze, 1999). Excluding χ2 values that were nonsignificant on the α = .05 level, we investigated uni-, bi-, and trigrams associated with the largest χ2 values. When doing so, we grouped n-grams by whether they were more typical for correct or incorrect responses. Given concerns of reliability, n-grams occurring in all action sequences or with an absolute frequency below 5 were not considered in the analyses. Analyses were performed in R version 3.6.3 (R Development Core Team, 2017), using the ngram package (Schmidt & Heckendorf, 2017).
Disentangling Behavioral Patterns Associated With Incorrect Responses
For disentangling incorrect behavioral patterns, we drew on an exploratory two-step approach that was proposed in Ulitzsch et al. (2021a). This hybrid method combines data mining techniques originally developed for the analysis of clickstream data (see Banerjee & Ghosh, 2001) with graph-modeled data clustering for identifying common and dominant behavioral patterns. In the first step, the similarity of time-stamped action sequences is determined. In the second step, weighted cluster edge deletion, a graph-based clustering technique (Böcker & Baumbach, 2013), is performed on the similarity measures to obtain homogeneous groups of similar behavioral patterns. This supports describing behavioral patterns in terms of both the types and order of performed actions as well as the time required for their execution.
Similarity of behavioral patterns
We denote examinee i’s u-length action sequence and the corresponding sequence of times to action with
The considered similarity measure is based on the overlap of action sequences
where
To illustrate the required data structure and similarity measure, we consider two examinees. Examinee 1 performed a keystroke 5 seconds after starting the task, then, 3 seconds later, opened an email, and finally, 1 second later, proceeded to the next task and after an additional second confirmed to proceed. His or her sequences of actions and times to action are given by
Identification of subgroups
Based on the similarity measures, an edge-weighted undirected graph is constructed. Each vertex corresponds to one of the examinees. The similarity measures
In the present context, each of the resulting cliques is considered as one subgroup of behavioral patterns associated with incorrect responses. Isolated vertices with no connection to all other vertices in the graph give unique, idiosyncratic behavioral patterns.
Cluster edge deletion is illustrated schematically in Figure 2. For illustrative purposes, we assume equal edge weights. The deleted edges form a minimum-weight set of edges that is required for transforming the depicted graph into a cluster graph. The edited graph consists of fully connected components that do not show any connections among each other. For more details refer to Ulitzsch et al. (2021a).
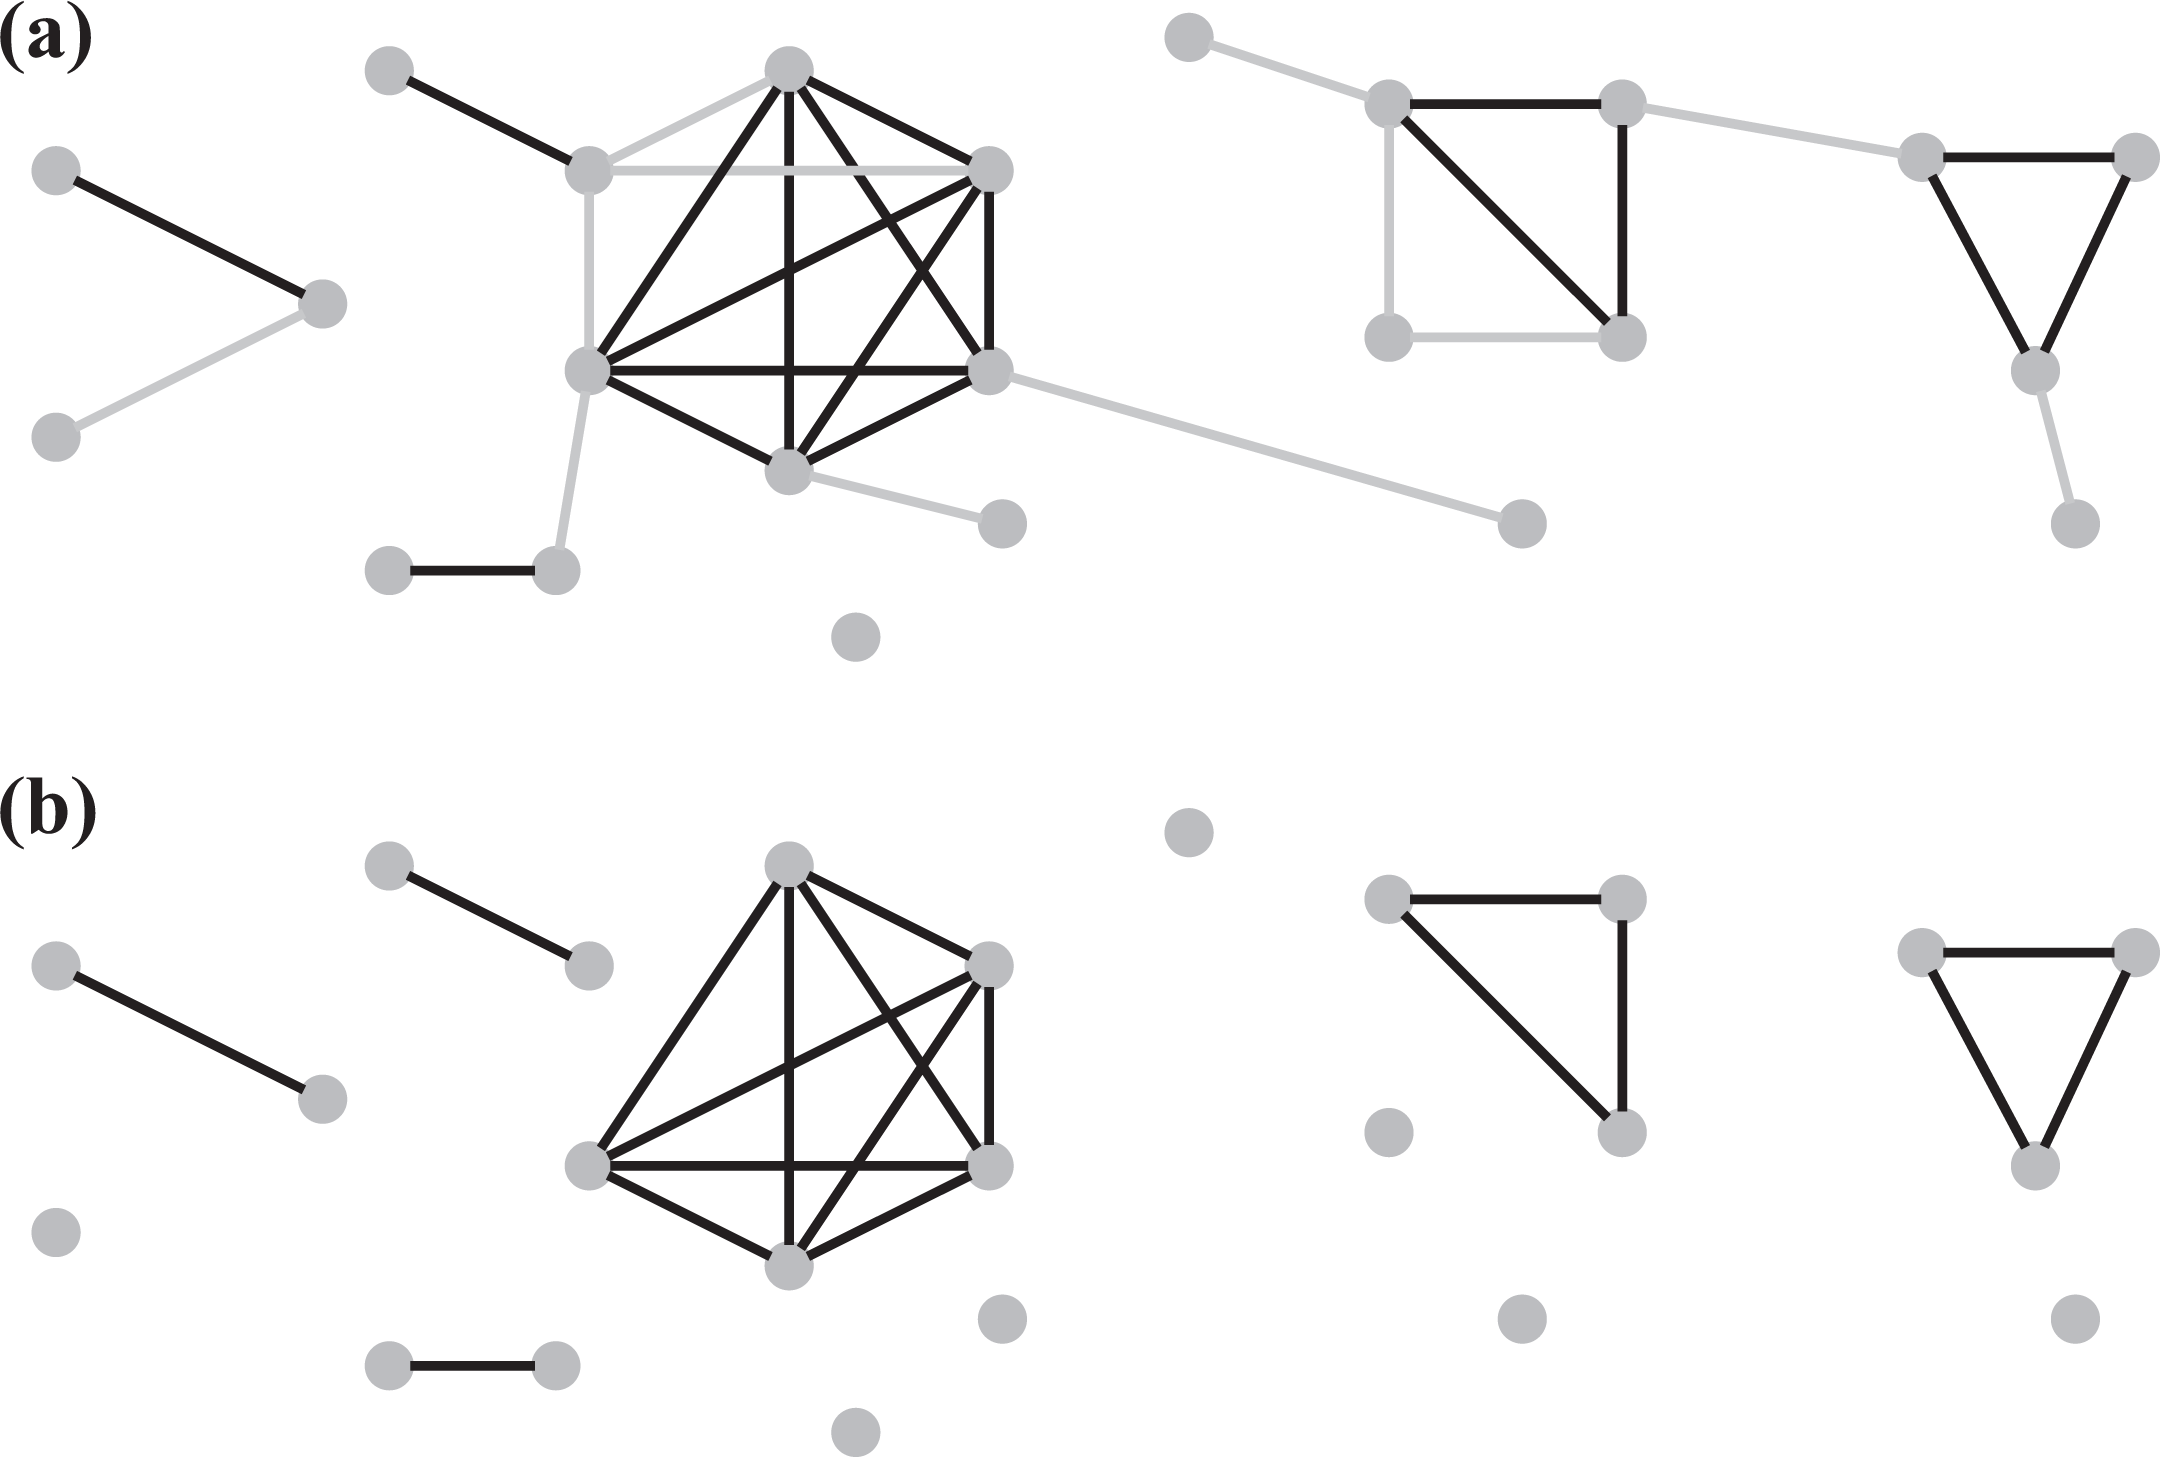
Cluster edge deletion instance before (a) and after editing (b); deleted edges in the input graph are marked in gray. For simplicity, equal edge weights are assumed. Example is adapted from Böcker and Baumbach (2013) and Ulitzsch et al. (2021a).
In common data structures of time-stamped action sequences from interactive tasks some actions like confirming an answer or proceeding to the next item are part of every sequence, such that all sequences are connected by a similarity measure greater than zero. Therefore, a threshold
Note that the first action (“Start”) was dropped since it is by definition associated with a time to action of zero for all examinees. To perform cluster edge deletion, we employed the integer linear programming formulation of the cluster edge deletion problem statement (see also Grötschel & Wakabayashi, 1989) provided in Ulitzsch et al. (2021a), using Gurobi (Gurobi Optimization, LLC, 2019) through Python (Version 3.8.1; Python Software Foundation, 2019).
Investigating dominant behavioral patterns
To describe dominant behavioral patterns, for reasons of brevity, we focused on cliques of at least size 7. 2 Note that within each clique, time-stamped action sequences may show different kind of overlap. That is, LCSs are not necessarily the same for all pairs of sequences within a clique. To describe the dominant behavioral pattern captured by each clique, we therefore focused on the LCS that was shared by most of the sequences within a clique, that is, that occurred most often. Along with the most common LCS, we assessed the proportion of sequences containing the respective sequence, its median time-related importance, and the median time spent on the most common LCS within each clique. We also investigated median action sequence length of sequences partitioned to each clique. We offer possible interpretations of the identified behavioral patterns and relate them to the subdimensions of the item. These interpretations, however, still need to be corroborated in future studies, as further elaborated in the discussion.
In addition, to further investigate characteristics of examinees employing the identified behavioral patterns, we investigated age and PSTRE plausible values within each behavioral pattern group. 3 Both have in previous studies (e.g., He, Borgonovi, & Paccagnella, 2019; Tang et al., 2020b) been shown to be related to differences in performed actions and time spent on task.
Investigating idiosyncratic patterns
To better understand idiosyncratic behavioral patterns, that is, time-stamped action sequences with little similarities to others, forming cliques of size 1, we compared action sequence length, time spent on task, and often-performed actions with those of sequences partitioned to cliques describing dominant behavioral patterns.
Investigating consistency across tasks
To further assist interpretation of dominant behavioral patterns and investigate whether the applied method is capable of identifying behavioral patterns that are consistent across multiple items, we assessed clique-level median time spent on task and number of performed actions across all seven items administered in PS1. Time spent on task and number of performed actions were standardized on the respective medians and the median absolute deviations (MAD) of all examinees who failed to solve item U01a.
Results
Differences Between Incorrect and Correct Behavioral Patterns
By and large, examinees with incorrect responses tended to perform fewer actions within a longer period of time. In the incorrect group, medians and 50% ranges of action sequence length and time spent on task were 11 [5, 22] and 105.10 [62.29, 168.18] seconds, respectively, compared to 23 [18, 32] and 97.36 [69.69, 139.69] seconds for examinees with (partially) correct responses.
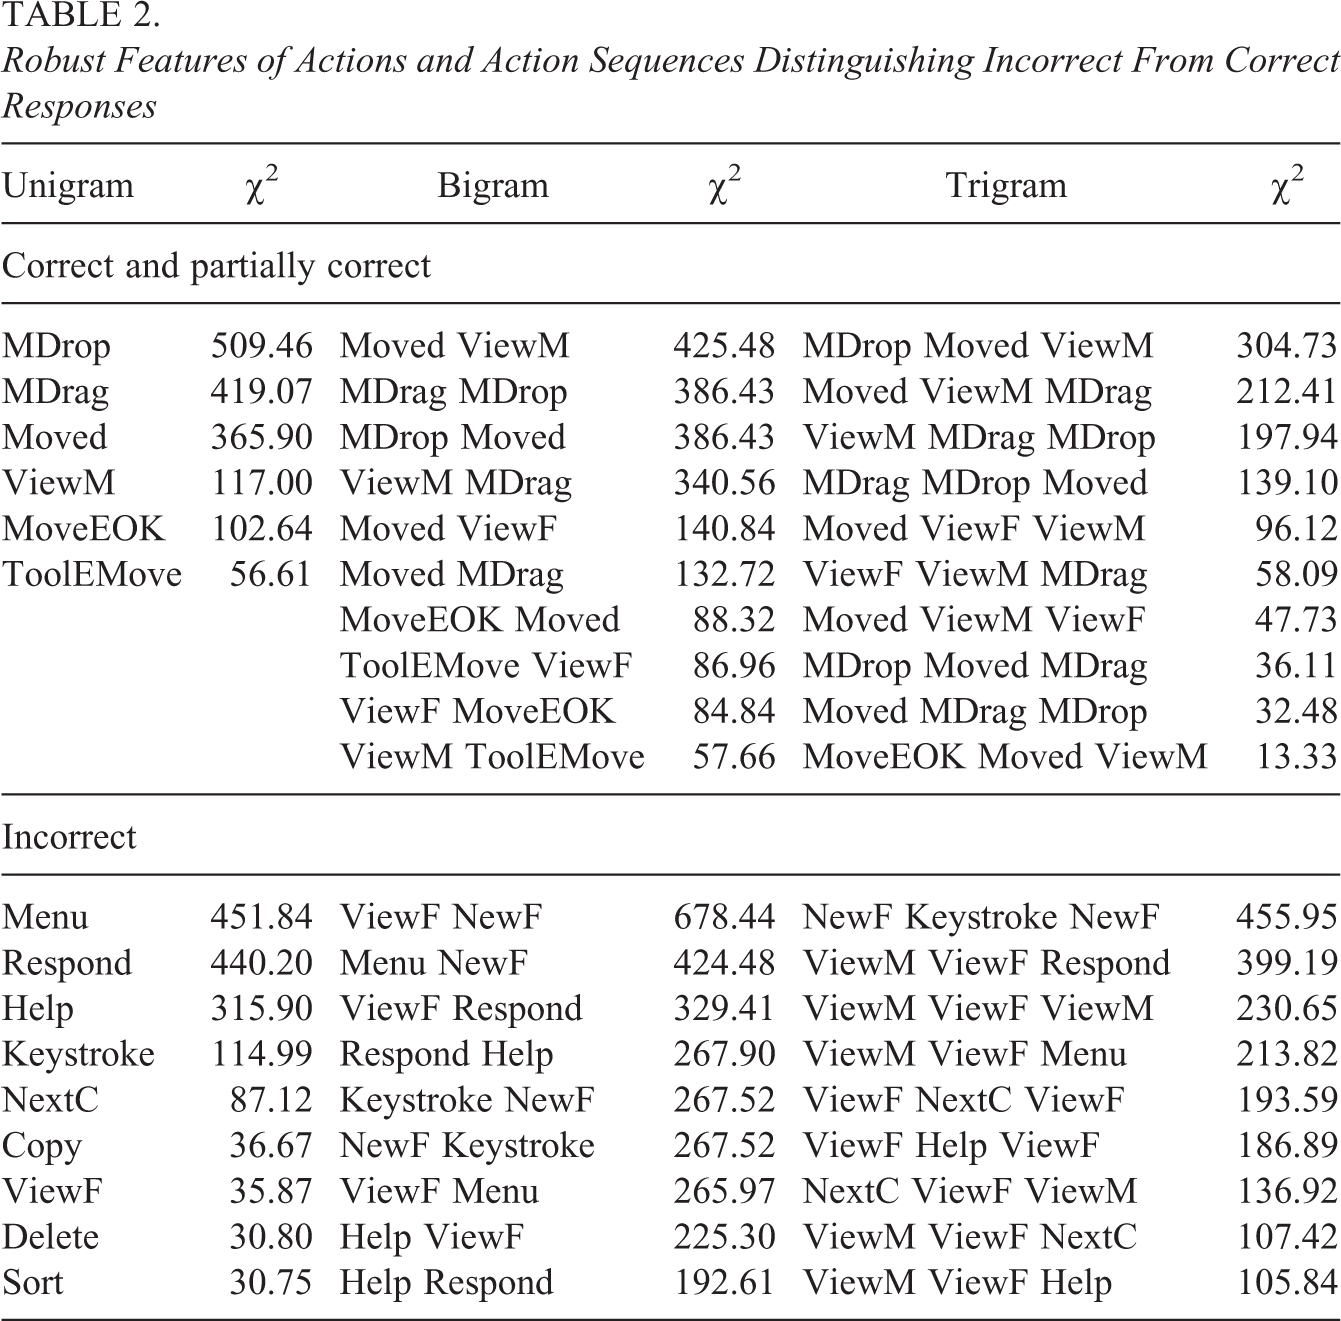
The most robust features distinguishing (partially) correct from incorrect action sequences are given in Table 2. Uni-, bi, and trigrams associated with correct responses were predominantly characterized by actions associated with moving emails. Uni-, bi, and trigrams associated with incorrect responses, in contrast, were more variable, ranging from exploration of the task environment such as opening different folders and emails, clicking on the menu, or sorting through task-irrelevant actions such as responding or creating new folders to seeking help. Two conclusions can be drawn from these analyses: First, the fact that features related to moving emails distinguish (partially) correct from incorrect responses indicates that examinees with incorrect responses did not merely move (the wrong) emails to (wrong) folders. Instead, behavioral patterns different from moving the wrong emails to wrong folders commonly seem to underlie incorrect responses. These remain to be investigated and understood in future research. Second, in line with previous studies (He, Borgonovi, & Paccagnella, 2019, 2021; He, Liao, & Jiao, 2019; Tang et al., 2020a), the fact that features typically encountered in incorrect action sequences tended to be rather heterogeneous indicates that different sources of failure, each describable by different features, tend to underlie incorrect responses.
Robust Features of Actions and Action Sequences Distinguishing Incorrect From Correct Responses
Disentangling Behavioral Patterns Associated With Incorrect Responses
Identification of subgroups
To get an initial understanding of the heterogeneity of incorrect behavioral patterns, we first investigated features of the input and output similarity graphs. The input and output graphs consisted of 6,332 and 1,763 edges, respectively. That is, cluster edge deletion led to deleting 72.16% of the edges of the input graph. This degree of modification of the input graph is in line with Ulitzsch et al. (2021a) who analyzed a data set with a comparable structure. Figure 3 displays the distribution of edge weights of the input and output graphs as well as of weights of edges removed in the cluster edge deletion procedure. As can be seen, with an increasing edge weight the proportion of edges remaining in the output graph significantly rose. For instance, 92.0% of edges with weights above .90 remained in the input graph. In comparison, 89.4% of edges with weights below .60 (but above the threshold of .50) were removed. Recall that higher similarities of sequences within the same clique (i.e., higher edge weights) correspond to more homogeneous cliques.
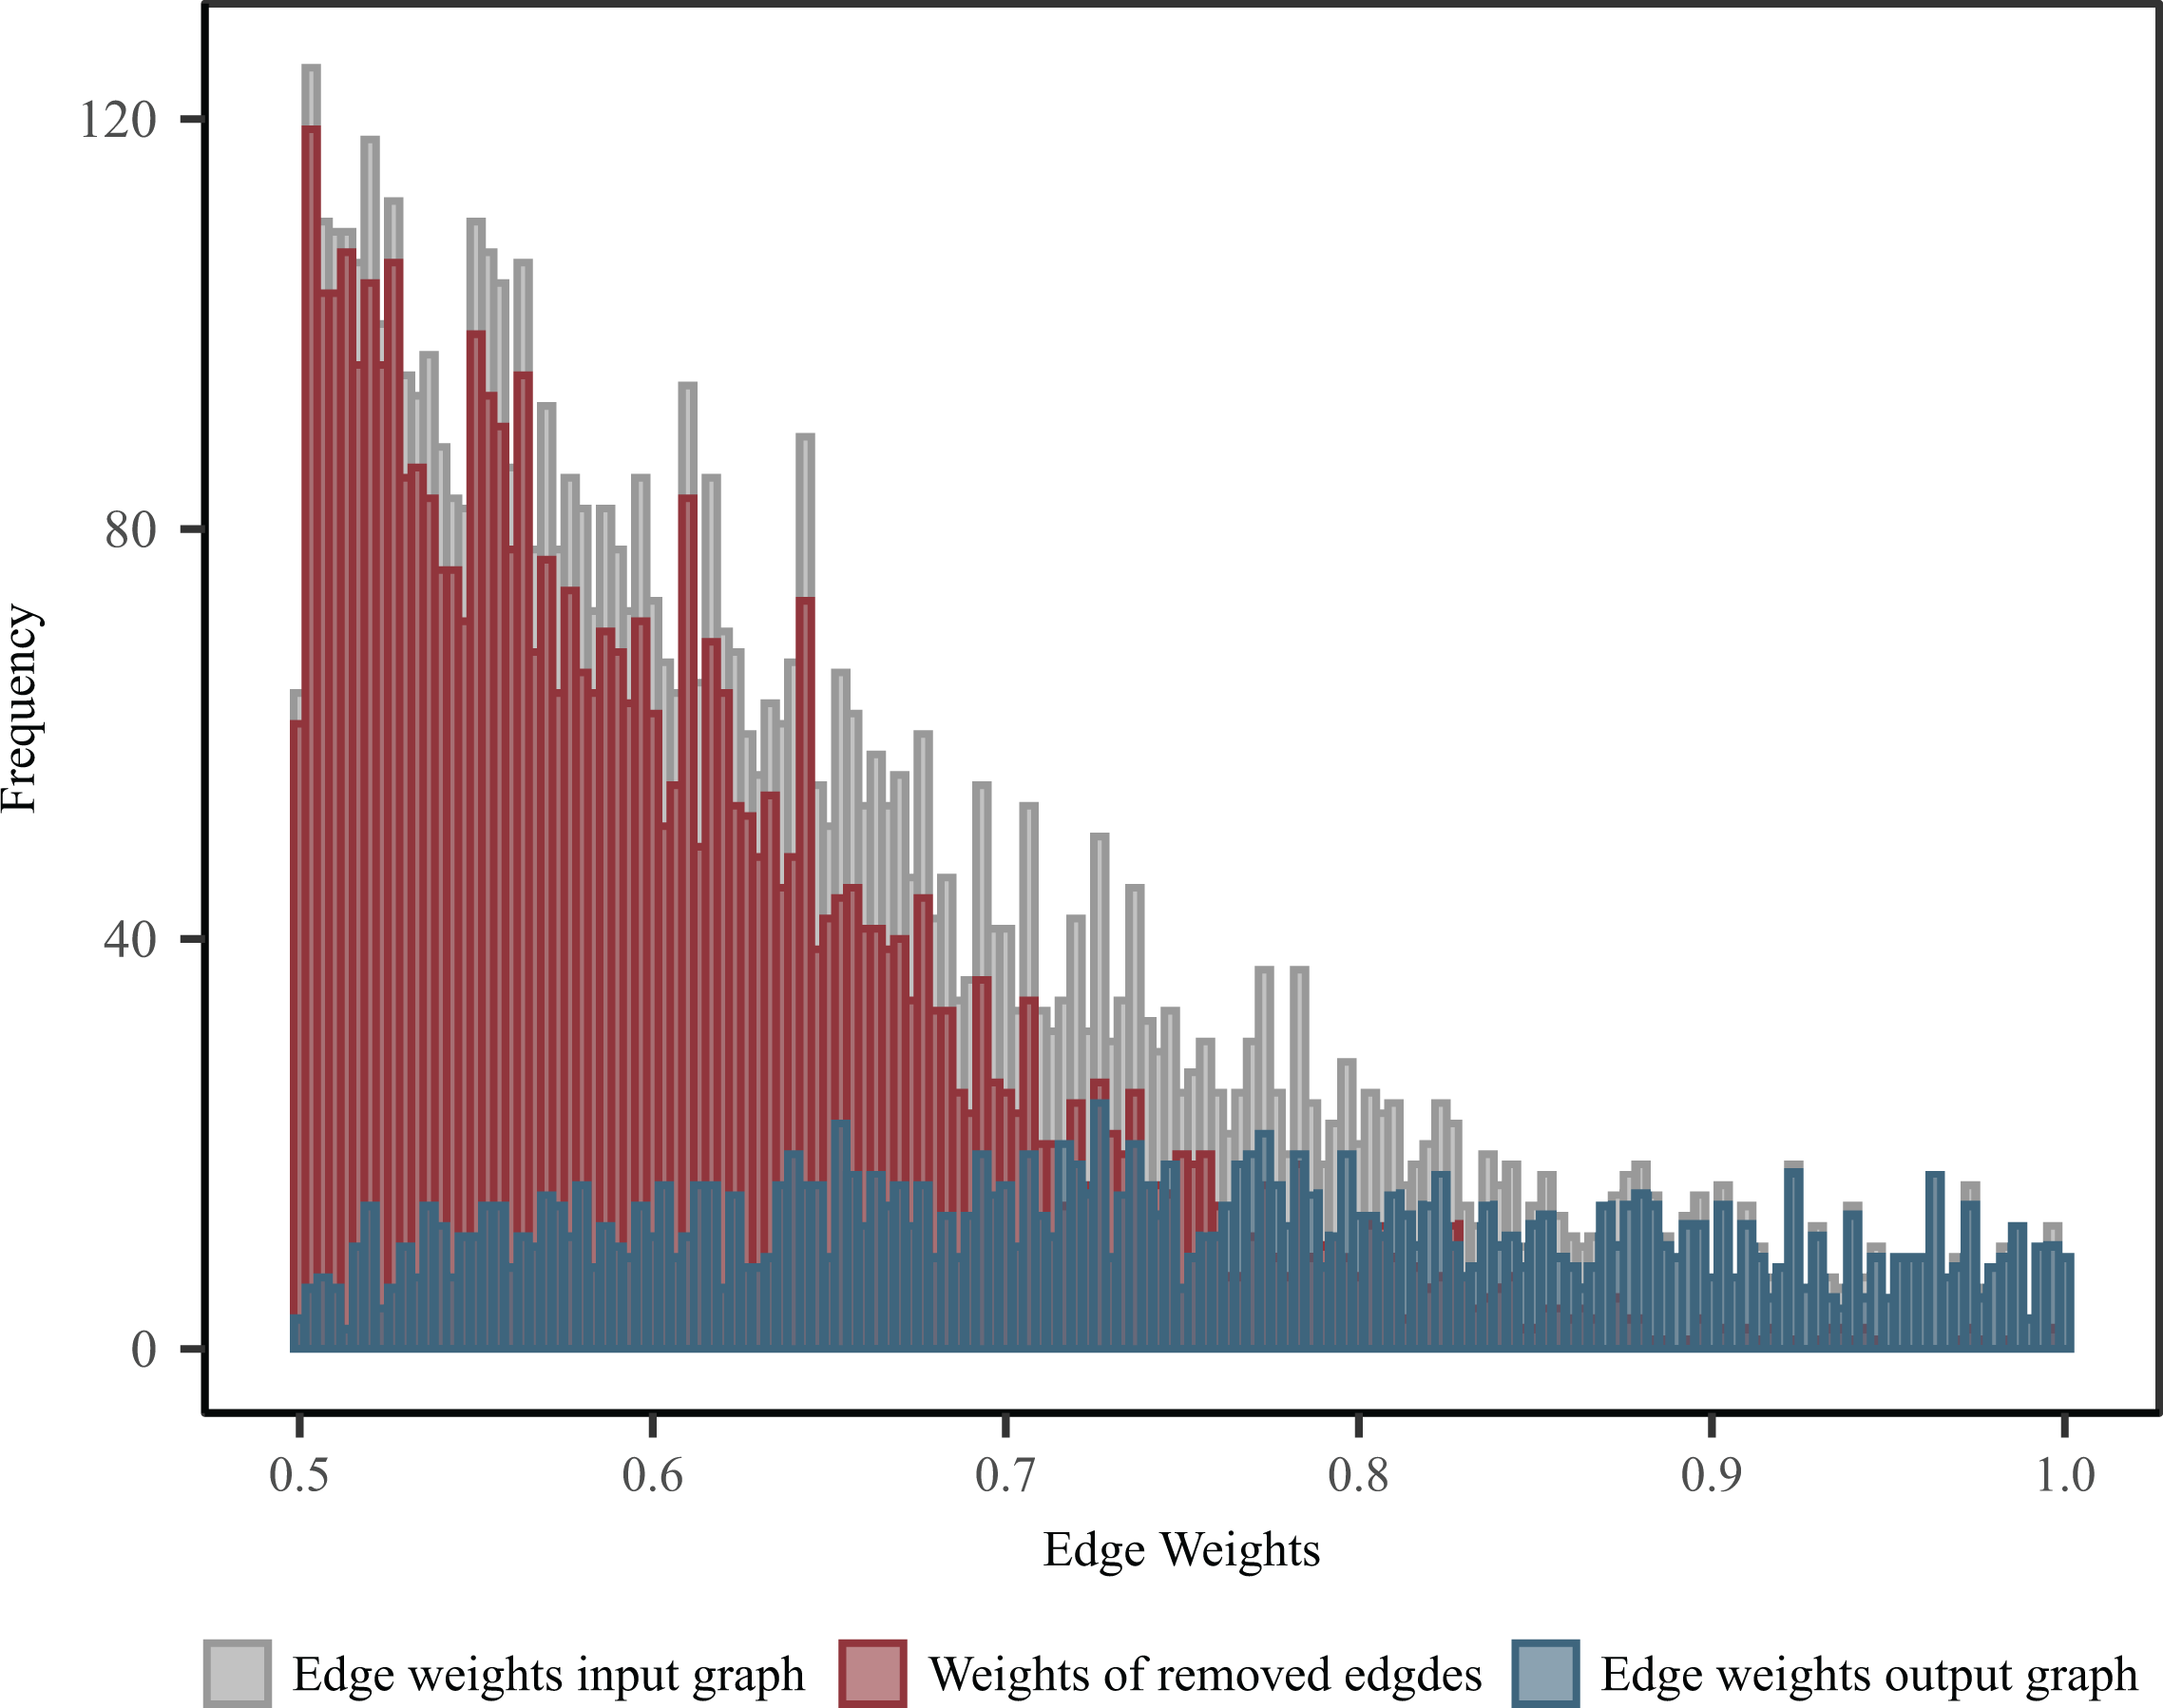
Distribution of edge weights of the input and output graphs as well as of weights of edges removed in the cluster edge deletion procedure.
The edited graph consisted of 95 cliques, that is, 95 incorrect behavioral patterns were identified. The distribution of clique size in the edited graph is given in Figure 4; 28 cliques were of size 1, that is, contained single sequences describing unique behavioral patterns. Of these, 10 were isolated prior to clustering, that is, did not show similarities above .50 to any other sequence in the data set.
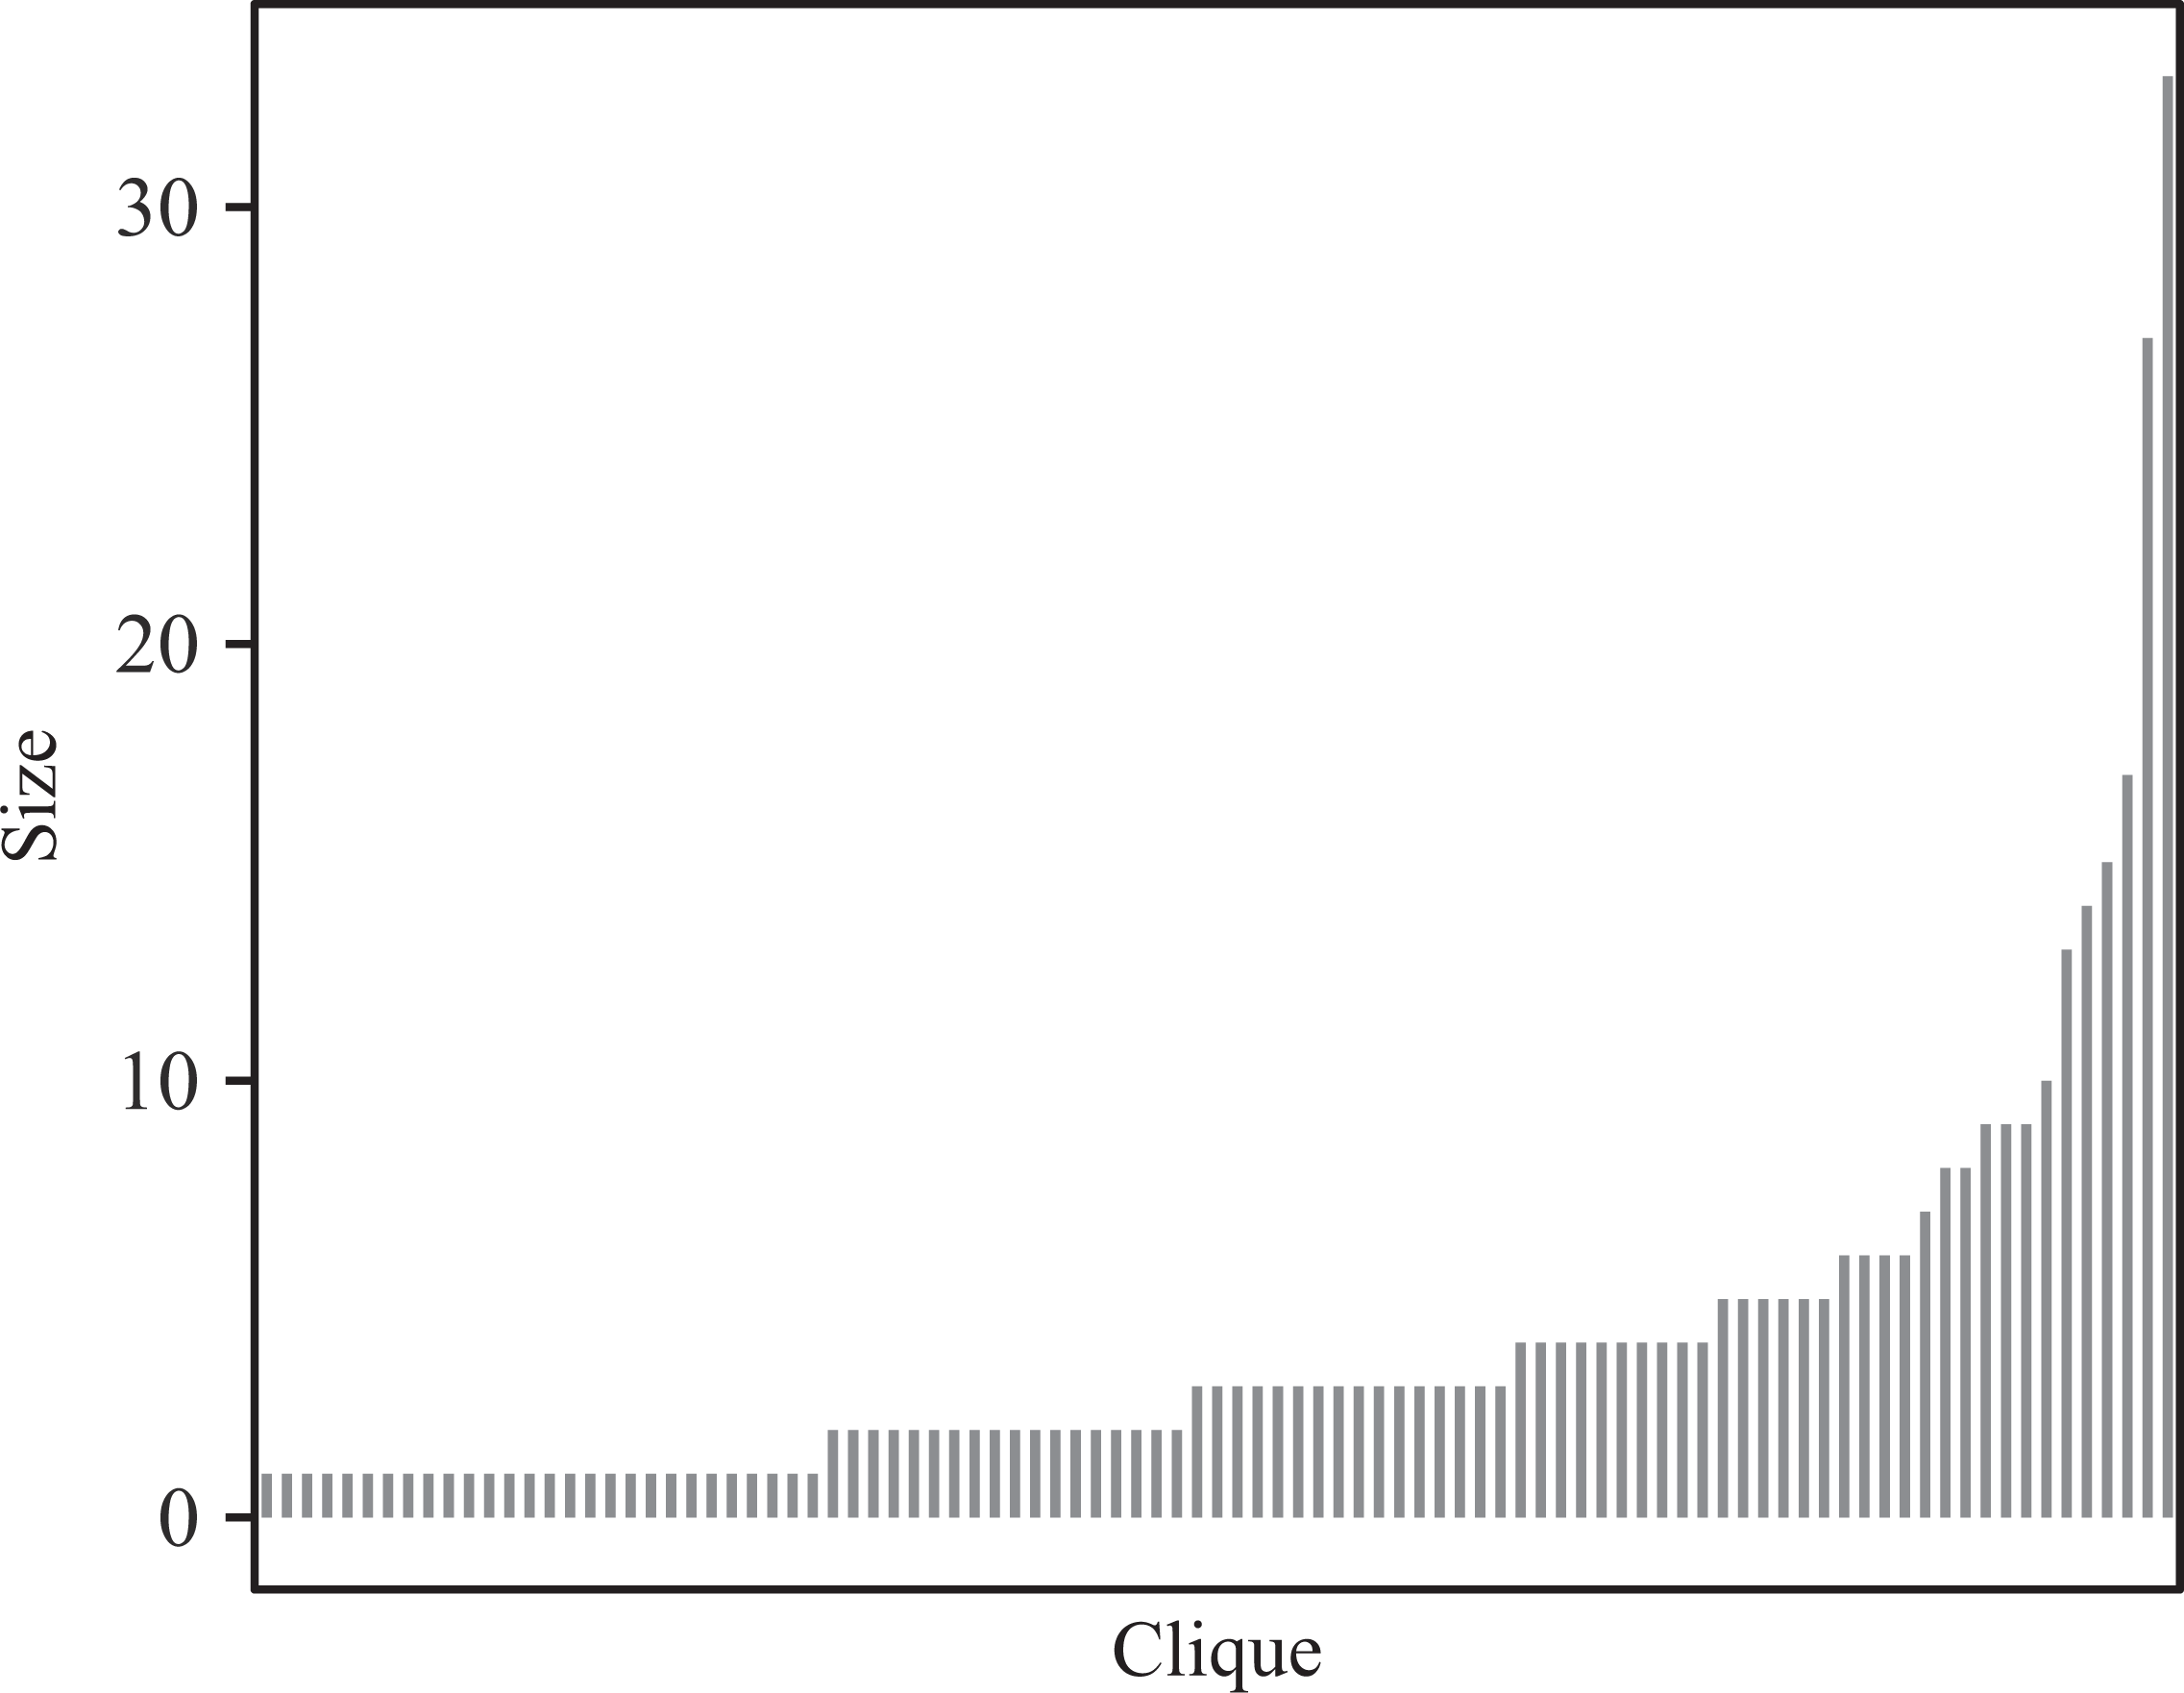
Distribution of clique size.
Investigating dominant behavioral patterns
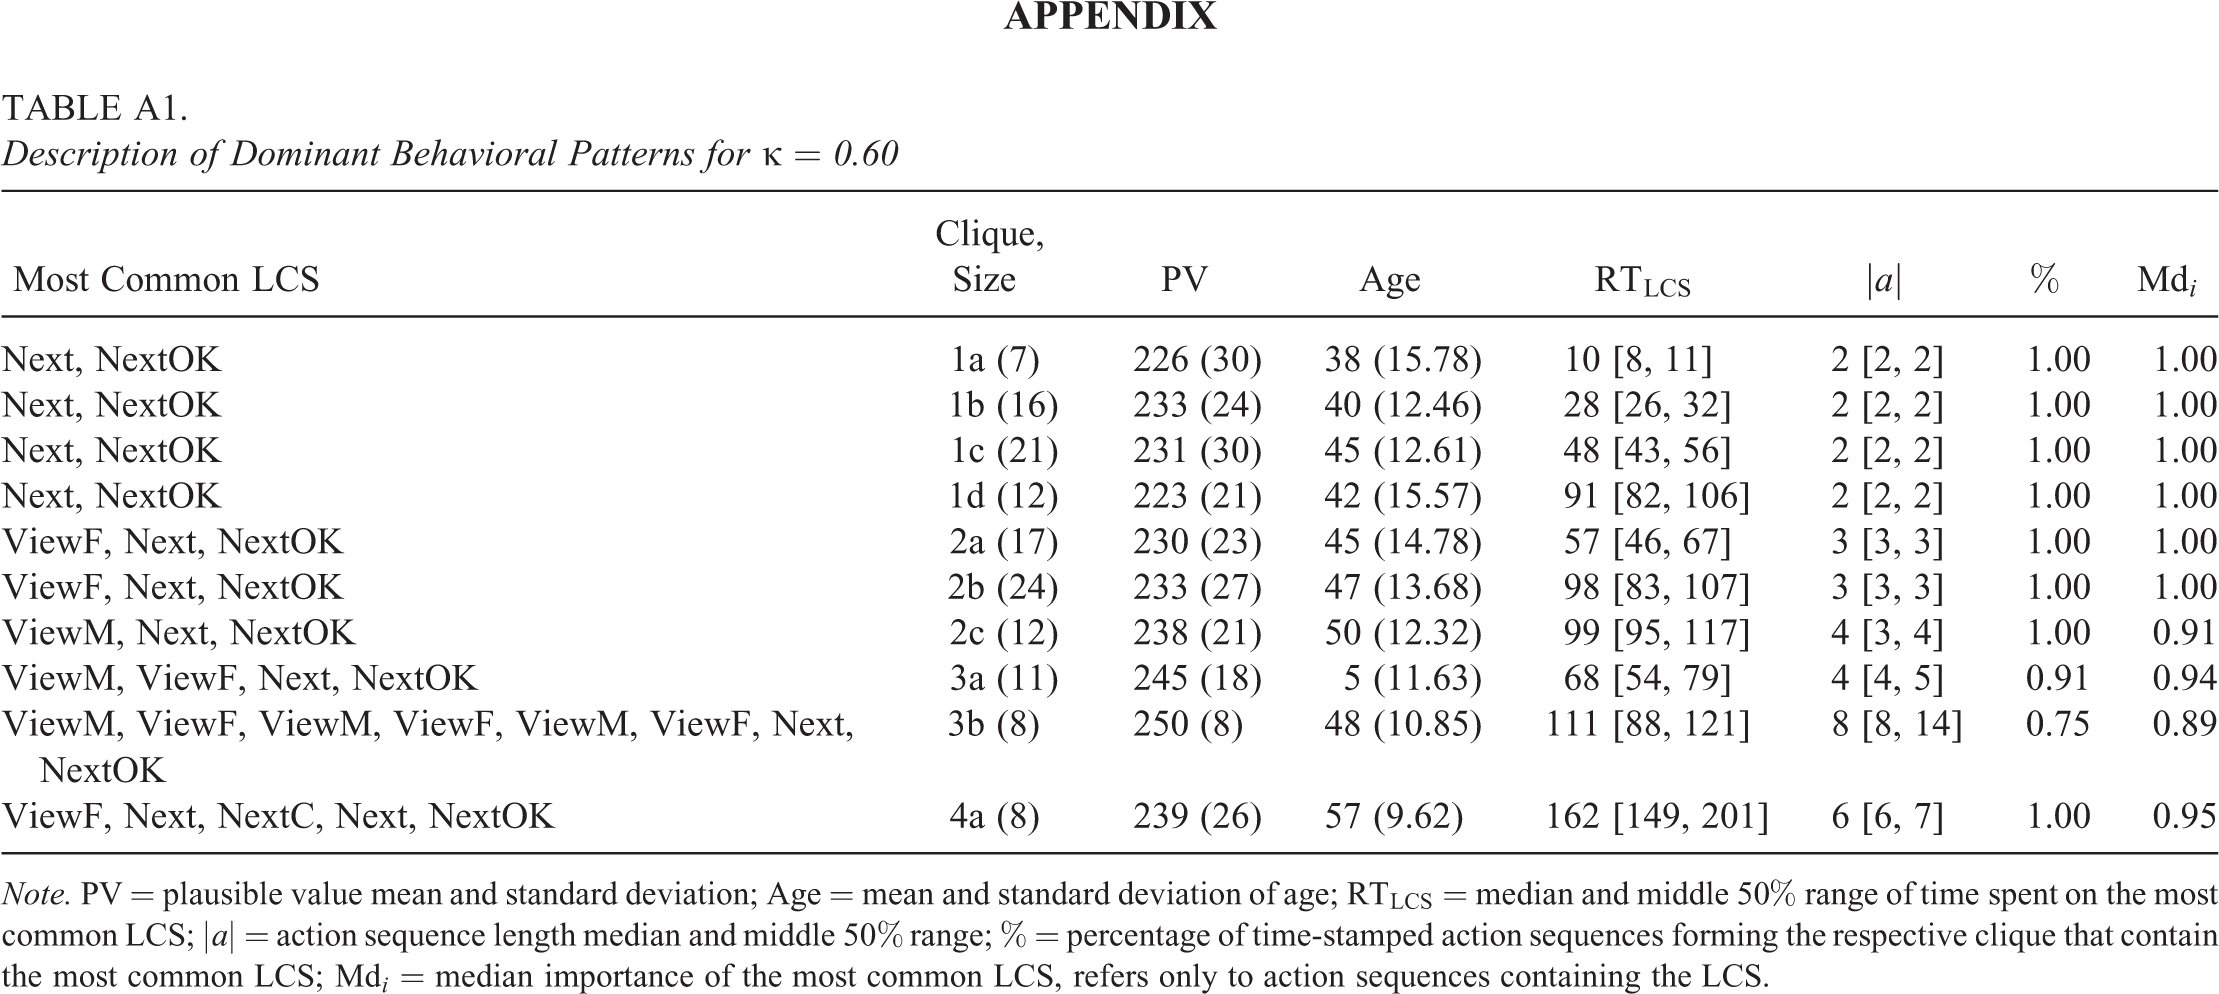
To describe dominant behavioral patterns, we focused on cliques of at least size 7. In total, 47% of the sequences were partitioned to these cliques. Table 3 gives an overview over these cliques. As becomes evident, the applied method was able to detect dominant incorrect behavioral patterns differing in terms of both commonly performed action sequences and the time required for their execution. In Table 3, cliques are ordered in terms of similarity of the most common LCS describing the cliques. Note that due to lack of strong theoretical presumptions on (incorrect) behavioral patterns on the given task, interpretations of most common LCSs as well as of the median time required for these subsequences are speculative.
Description of Dominant Behavioral Patterns
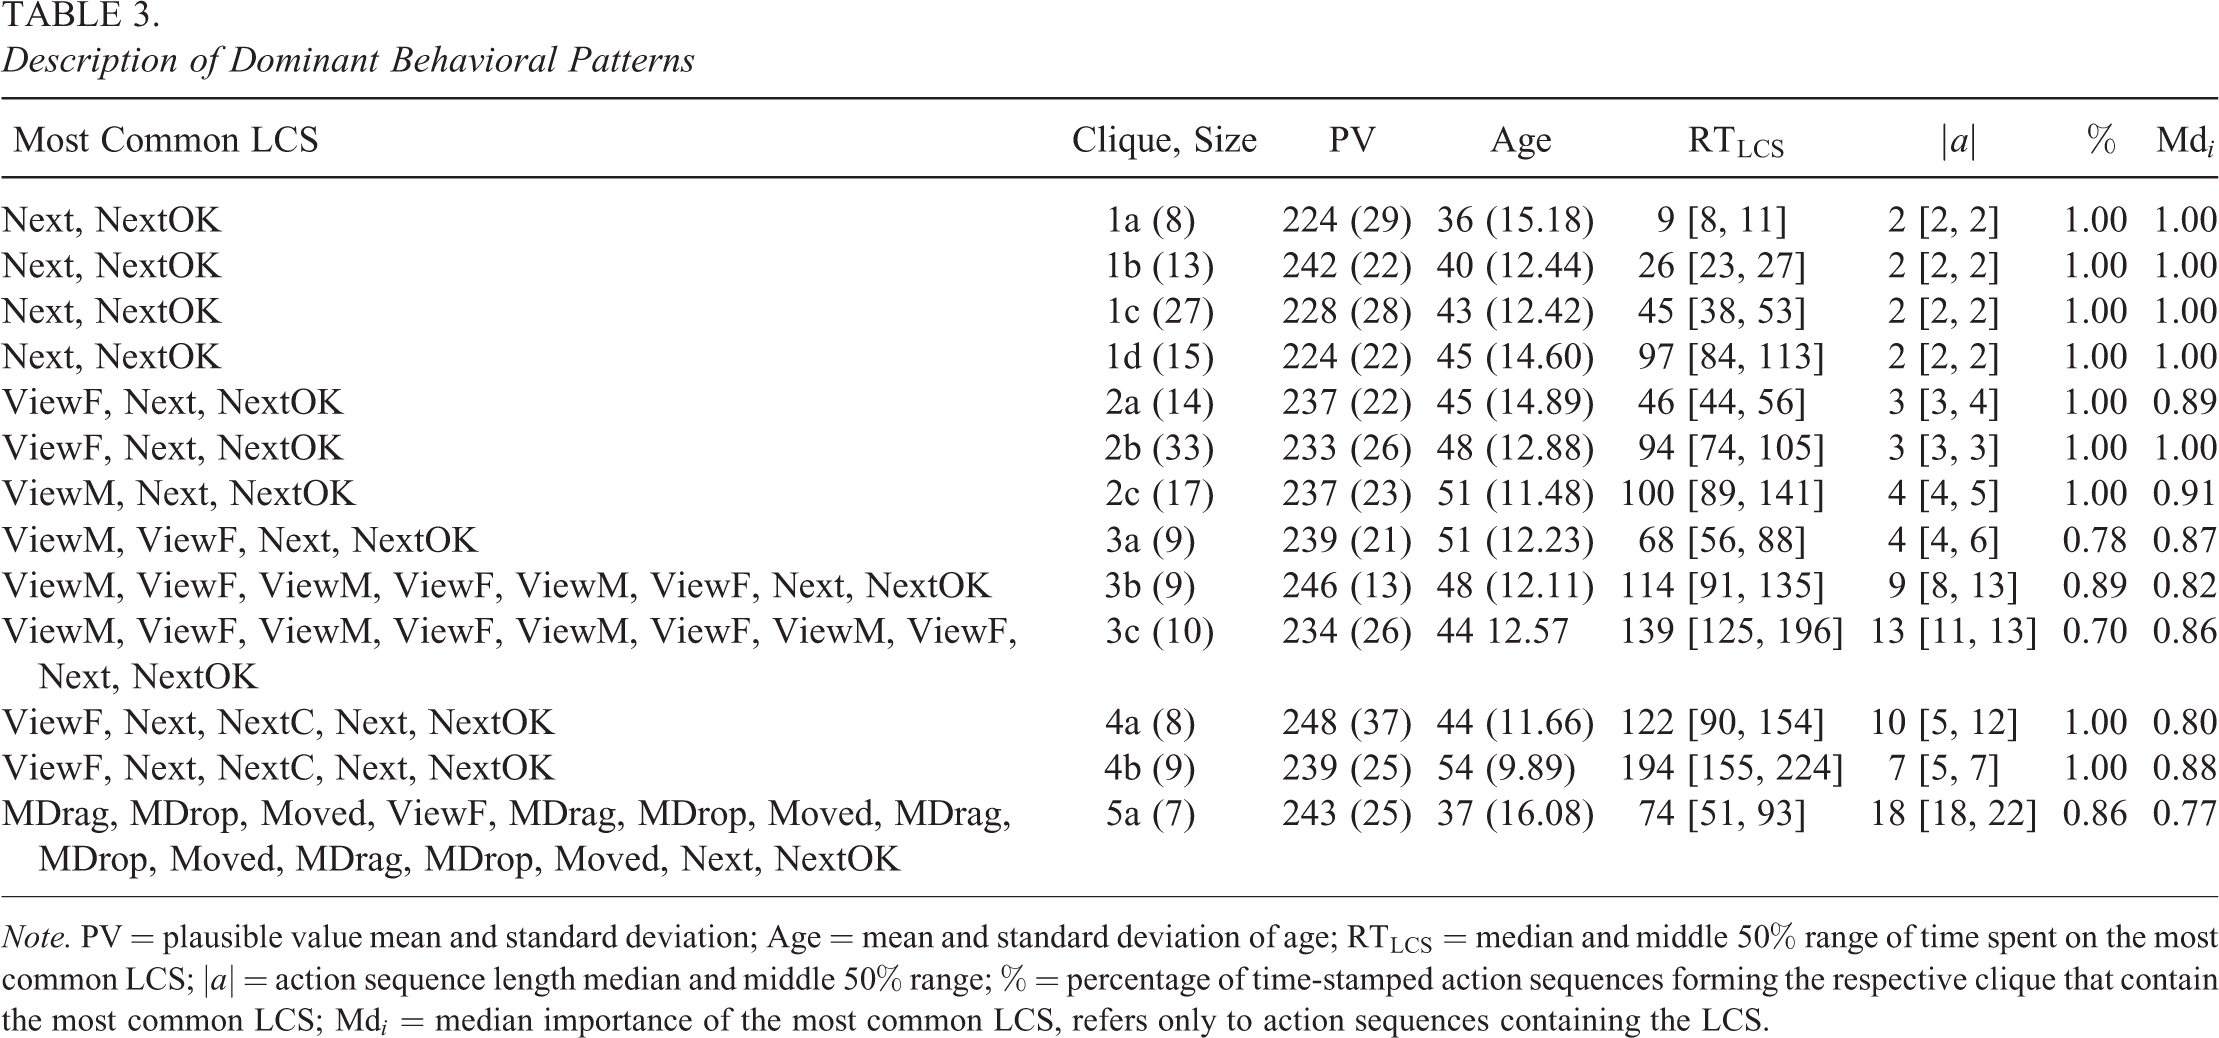
Note. PV = plausible value mean and standard deviation; Age = mean and standard deviation of age; RT
Examinees with sequences belonging to Cliques 1a, 1b, 1c, and 1d predominantly proceeded to the next item without performing any other actions. This becomes evident from the median importance of the LCS of 1 as well as from the median of action sequence length of 2, and the middle 50% range of [2, 2] for all four cliques. These four cliques, however, differed in the amount of time examinees spent on the most common LCS. This may be indicative of different meanings of this behavioral pattern. The amount of time spent until confirming to proceed to the next item by examinees whose sequences form Clique 1a is hardly enough time to carefully read, evaluate, and process the task. Hence, Clique 1a may capture a disengaged behavioral pattern, with examinees quickly proceeding to the next task without performing any further actions. This is different for examinees with sequences forming Clique 1d, who, on average, required approximately one and a half minutes for proceeding to the next item without performing any further actions. Hence, examinees forming Clique 1d spent enough time on the task to read the task and assess features displayed on the start page. One possible explanation for this pattern may be that these examinees were overtaxed by the task at hand, did not know what actions to perform, and thus, after looking at the item for some time, proceeded to the next one without performing any actions. This pattern may also indicate that examinees with sequences forming Clique 1d were not sufficiently skilled to access and evaluate information in the given email environment, which requires navigating through the environment and acquiring information by exploring folders and emails. Examinees from Cliques 1a and 1d showed the lowest plausible values out of the 13 largest cliques. Examinees from Cliques 1b and 1c spent more time on the item than examinees from Clique 1a but still less than examinees from Clique 1d—less than 1 minute. As such, interpretations concerning the reasons for proceeding to the next item without performing any actions becomes more ambiguous for these cliques. Both sources of failure, low motivation and lack of skill, may be possible in these cliques. Mean age for examinees partitioned to this class of cliques (1a–1d) increased with increasing time spent on the most common LCS, indicating that younger examinees might have proceeded to the next item without performing any further actions due to lack of motivation, while older examinees did so due to lack of skill.
A comparable distinction of captured behavioral patterns can be made for Cliques 2a, 2b, and 2c. Examinees with sequences partitioned to these cliques proceeded to the next task after some initial exploration of folders or emails. Again, the high median time-wise importance as well as the median and 50% range of action sequence lengths indicates that examinees hardly performed other actions than those in the most common LCS. Again, examinees from different cliques differed in the time spent on the most common LCS, with examinees from Clique 2a spending less than one minute exploring folders and then proceeding to the next item. Plausible explanations for this pattern may be, among others, that examinees were disengaged and only interacted perfunctorily with the item or that examinees did not understand the task and thus only quickly explored the environment. Examinees from Clique 2b and 2c took approximately twice the time for exploring folders (Clique 2b) or emails (Clique 2c) and then proceeding to the next item compared to examinees from Clique 2a. A possible interpretation of this pattern may be that examinees from Cliques 2b and 2c were self-motivated to solve the task at hand, took a longer time to explore the item, and then concluded that they were not able to solve the task and thus proceeded to the next item. They may have had very basic skills to access some of the environment’s information but may not have been able to organize this information to proceed with the task. Again, mean age within this class of cliques increased with increasing time spent on the most common LCS.
Examinees with sequences forming Cliques 3a, 3b, and 3c showed even more exploration behaviors. Examinees with sequences forming these cliques predominantly switched between exploring emails and folders before proceeding to the next item. They also performed few other actions, as indicated by somewhat lower median time-wise importance values. Type and number of performed actions differed across examinees, as reflected in greater variability of action sequence length in comparison to Cliques 1a to 2c. Again, examinees with sequences forming Cliques 3a, 3b, and 3c differed in how much time they took for switching between exploring emails and folders and then proceeding to the next item, with examinees from Cliques 3b and 3c requiring slightly less and slightly more than 2 minutes, respectively. The fact that examinees from Cliques 3b and 3c invested such a long period of time may indicate that they were motivated to invest time and effort into solving the task. Their exploration behavior may further indicate that they may have had the skills to access the environment’s information but, as examinees from Cliques 2b and 2c, may not have been able to organize this information and put it into action.
The most dominant feature describing Cliques 4a and 4c is that, after some initial exploration behavior, examinees canceled proceeding to the next item. Before and between canceling proceeding to next item and confirming to proceed some examinees also performed other actions such as exploring folders, opening emails, or seeking help, however, differed in the type of actions performed, as indicated by the median time-wise importance values. The lower median time-wise importance indicates that examinees from Clique 4b tended to perform more other actions than examinees from Clique 4a. This is also reflected in a higher variability of action sequence length. Note that examinees were informed that they cannot come back to an item once they have proceeded to the next one. A possible interpretation of this hesitant behavior may be that examinees from Cliques 4a and 4b were willing to retry solving the item.
Finally, Clique 5a is the only clique among the 13 largest ones with the behavioral pattern being characterized by moving emails—since responses were scored as wrong, examinees moved the wrong emails to the wrong folders. Examinees from this clique may have possessed skills to access the environment’s information and also showed behavior that indicates that they aimed at selecting and organizing this information to sort emails. However, the fact that they moved the wrong emails to the wrong folders may indicate that examinees were not able to select and organize the acquired information correctly.
By and large, mean plausible values increased across these five classes of cliques, which are roughly ordered by length of the most common LCS. Median importance of the most common LCS was above .80 in all cliques, such that the length of the most common LCS is a good proxy for the length of action sequences. Hence, the higher plausible values may indicate that examinees displayed more effort to solve item U01a (as well as the subsequent ones) and/or had higher proficiency to solve the tasks displayed in PS1.
Note that Ulitzsch et al. (2021a) demonstrated the approach’s ability to yield comparable conclusions concerning dominant behavioral patterns when applied to multiple small subsamples. Due the small sample size, however, differences in plausible values and age need to be interpreted with caution.
To illustrate the impact of the threshold
Investigating idiosyncratic patterns
We investigated cliques of size 1 to understand idiosyncratic behavioral patterns, that is, those with low similarity to others. As was to be expected, sequences forming cliques of size 1 were more unique than sequences forming cliques of at least size 7. On the one hand, examinees in cliques of size 1 showed more actions necessary to solve the task. For instance, 54% of examinees in cliques of size 1 moved emails, as compared to 8% of examinees in cliques of at least size 7. These examinees may have had similar behavioral patterns as those partitioned to Clique 5a, requiring, however, a different amount of time. On the other hand, 36% of sequences forming cliques of size 1 contained actions related to responding to or writing an email, as compared to only 6% of sequences forming cliques of size 7. Recall that the task asks examinees to sort emails into already existing folders, such that actions related to responding to or writing an email are not necessary for solving the task. Their execution indicates lack of understanding of the task at hand. In addition, examinees in cliques of size 1 sought out more help than those in cliques of at least size 7 (36% as compared to 7%). In comparison to examinees with sequences forming cliques of size 7, examinees with sequences forming cliques of size 1 spent a considerably longer amount of time on the task (200.82 [20.79, 998.57] as opposed to 78.89 [46.08, 110.76] seconds) and performed more actions (16 [11, 25] as opposed to 3 [2, 6]). The high variability in length of action sequences and times spent on task further underlines the idiosyncraticity of sequences partitioned into cliques of size 1.
Investigating consistency across tasks
To investigate whether we were able to uncover behavioral patterns that generalize across multiple tasks, within each of the 13 largest cliques, we assessed trajectories of behavioral indicators across multiple tasks. Figure 5 gives standardized trajectories of median and middle 50% ranges of time spent on task as well as of the number of performed actions. As shown in Figure 5, examinees partitioned to the 13 largest cliques behaved consistently in terms of time spent on task and number of performed actions across all items administered in PS1. Since for partitioning examinees to cliques we focused only on data from the first item, the fact that there are systematic and consistent differences across the whole PSTRE task block between the identified cliques illustrates that the applied method is capable of uncovering meaningful patterns that, in terms of time and actions performed, generalize across tasks. 4 Examinees from Cliques 1a to 1d, for instance, generally performed slightly fewer actions in comparison to examinees who failed to provide a correct response to Item U01a. However, while time spent on task by examinees from Clique 1d did not considerably differ from the median of all examinees failing to solve Item U01a, examinees from Cliques 1a to 1c consistently spent considerably less time on all items administered. This may be seen as further support of the interpretation that examinees from Cliques 1a to 1c were disengaged and quickly proceeded through the assessment, performing only few actions, while those from Clique 1d spent enough time on the tasks to evaluate them but still did not perform many actions, presumably due to being overtaxed by the tasks. Likewise, in support of the interpretation of the dominant behavioral pattern on item U01a captured by Cliques 3c, 4a, and 4b, examinees from these cliques tended to spend above median time on all tasks administered and performed an above median number of actions, providing further evidence that these examinees invested time and effort into solving the administered task.
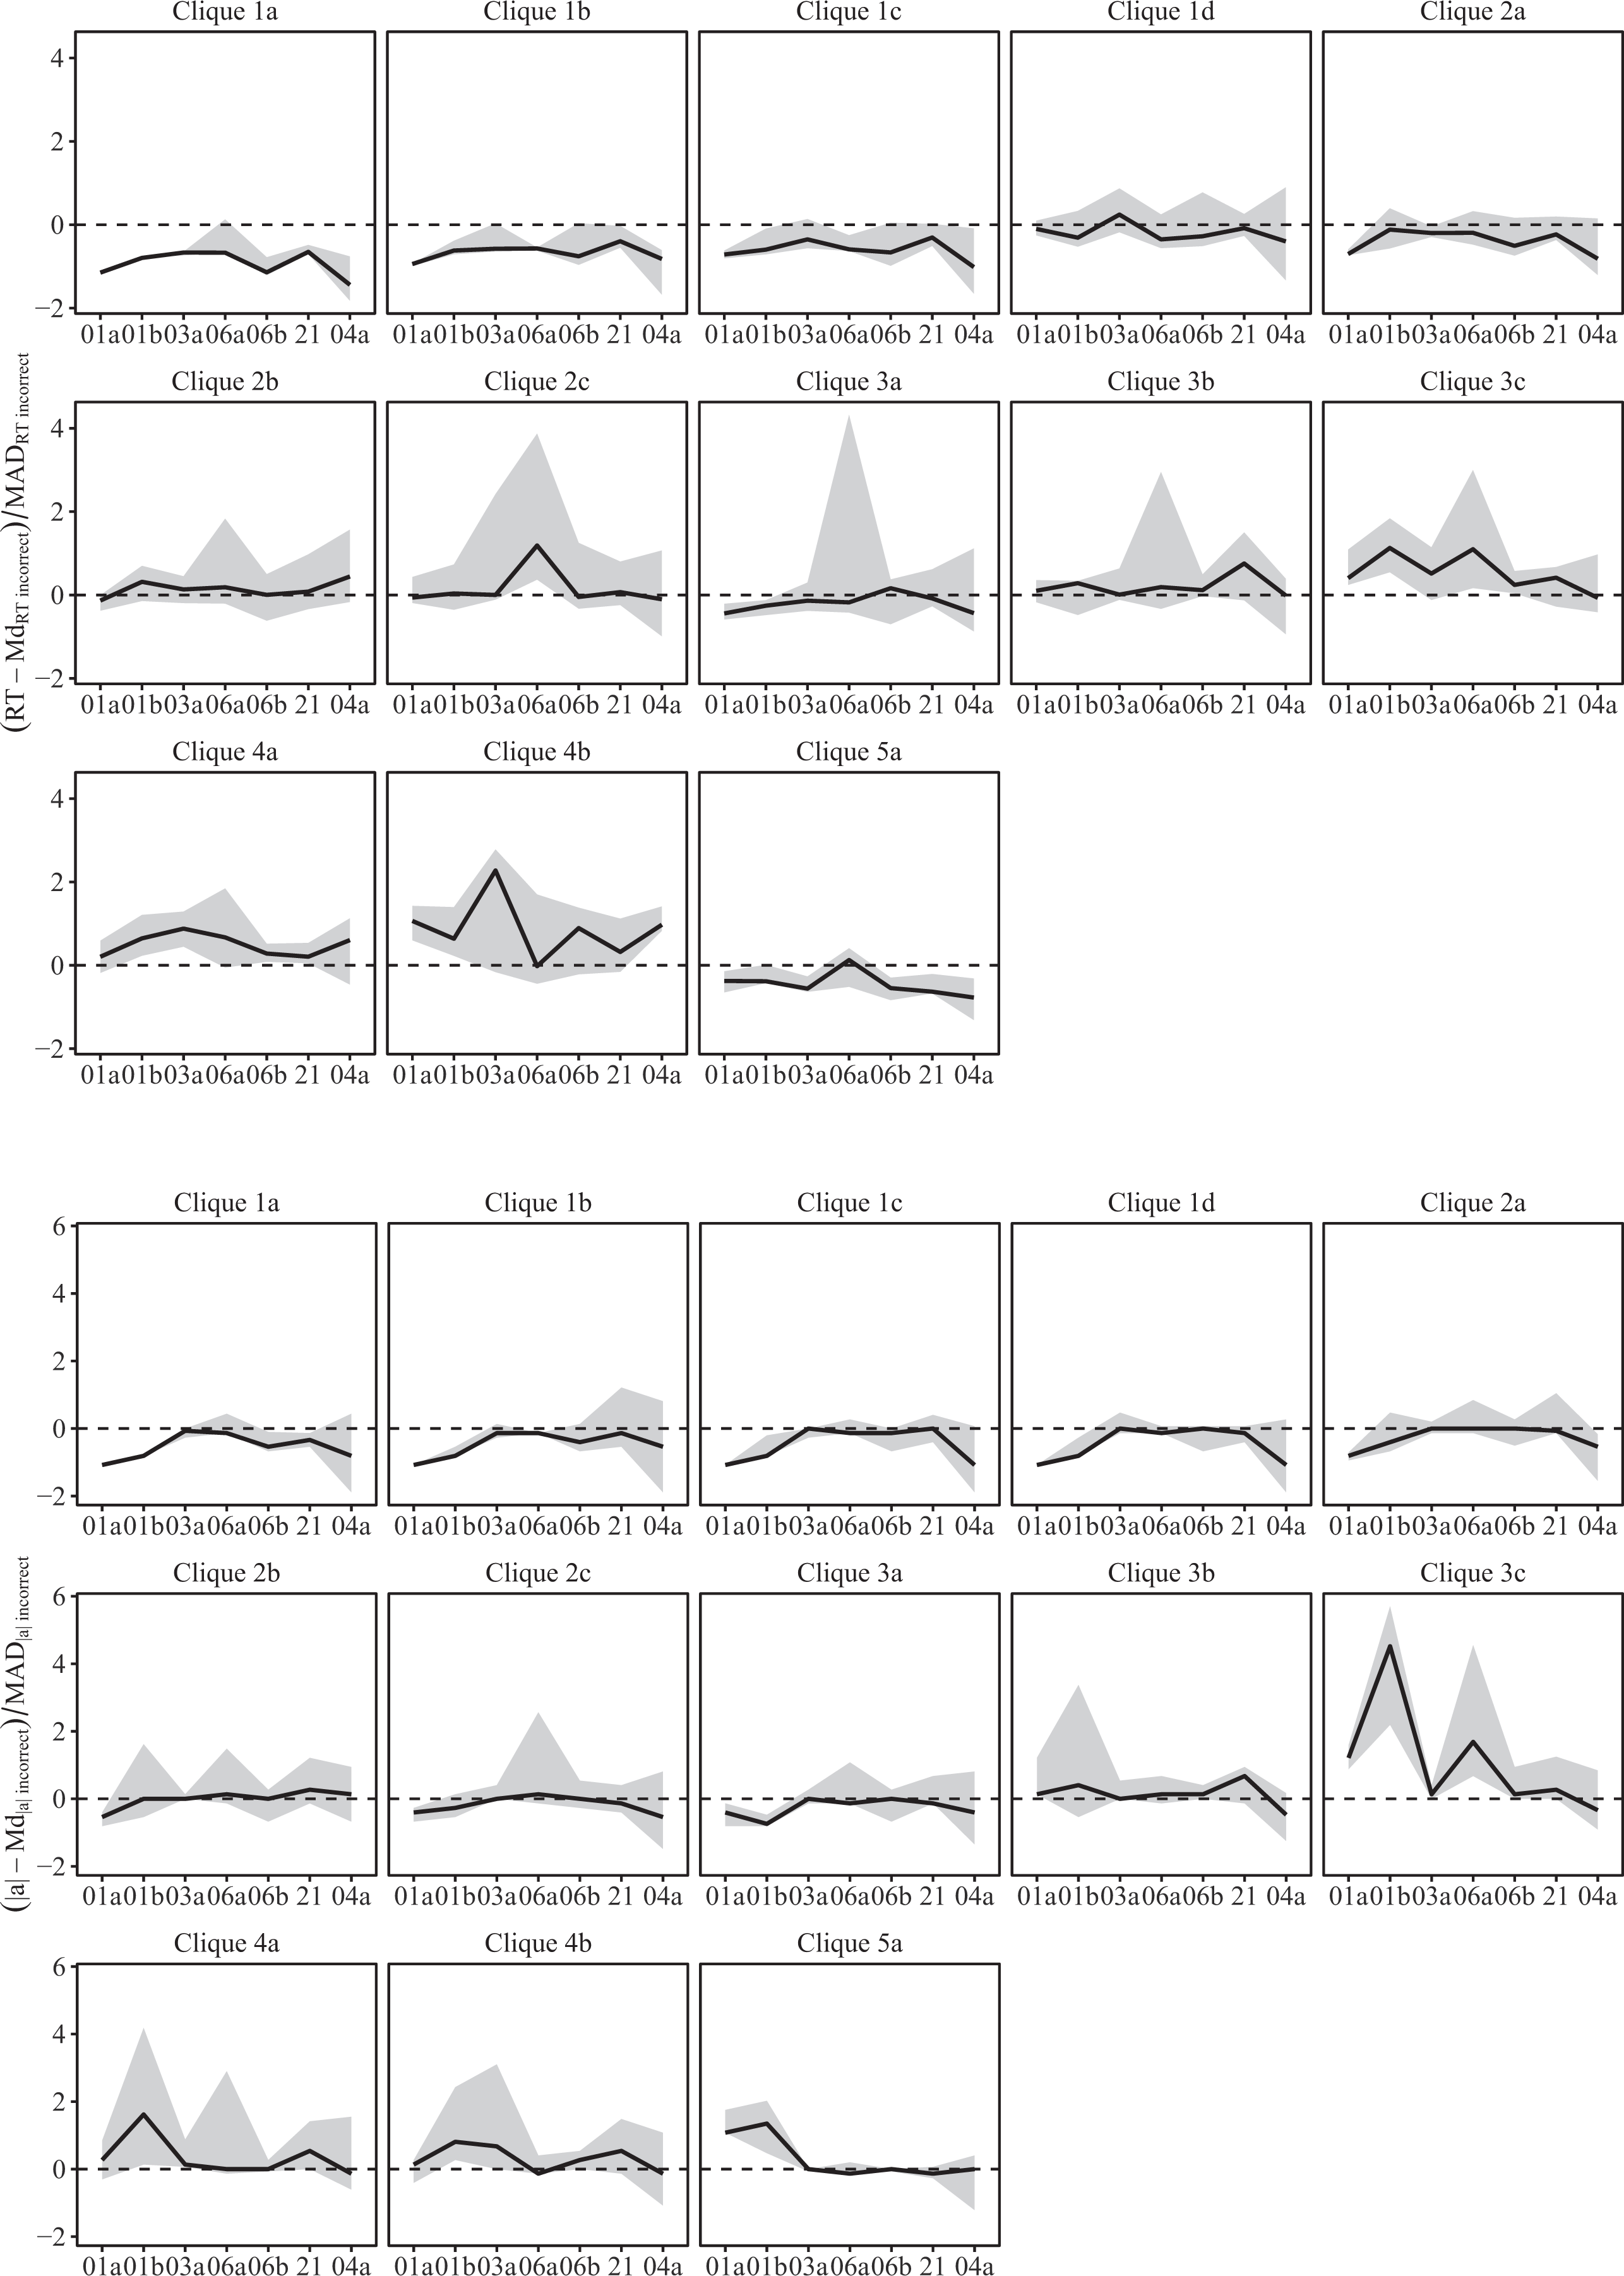
Centered trajectories of median and middle 50% ranges of time spent on task in seconds (upper panel) and number of performed actions (lower panel) across all items of PS1 of the PIAAC PSTRE domain for the 13 most dominant incorrect behavioral pattern groups on Item U01a. The items shown on the horizontal axis are ordered by item positions.
Nevertheless, these interpretations remain speculative and need to be corroborated in future studies. As outlined above, depending on the specific action, time spent on single actions may be indicative of rather different ways of how examinees approached the task. This may also hold for the task as a whole.
Discussion
In the present study, we aimed at a better understanding of sources of failure on interactive tasks by making use of time-stamped action sequences. We combined insights from the application of two sequence mining techniques for time-stamped action sequence data from interactive tasks—n-gram analyses and graph-based data clustering—to (a) investigate in which aspects incorrect behavioral patterns differ from correct ones and to (b) disentangle and describe incorrect behavioral response patterns. In doing so, we showcased the utility of sequence mining techniques for uncovering the vast potential of time-stamped action sequence data for investigating behavioral patterns associated with failure on a given task and provided further evidence that the application of these techniques supports extracting meaningful information from complex data.
By and large, incorrect behavioral patterns were found to differ from correct ones by being characterized by fewer actions executed in a longer period of time as well as more variable behavioral patterns. In in-depth analyses of incorrect sequences, we found that the majority of the most common behavioral patterns (i.e., cliques of at least size 7) was not characterized by effective actions such as moving (the wrong kind of) emails to (wrong) folders. This indicates that examinees with these behavioral patterns lacked motivation, understanding of the task and/or subskills required to properly acquire information from the email environment and/or to utilize this information for successful task completion.
Considering the whole of information contained in time-stamped action sequences, we were able to describe dominant behavioral patterns in terms of both performed actions and the time required for their execution. So far, timing has been neglected in exploratory studies on behavioral patterns, such that considering these supported investigating novel aspects of sources of failure on a task. First, we could identify patterns that might be interpreted as disengaged behavior. Examinees with such patterns either rapidly proceeded to the next item or spent only a short amount of time on the item performing few actions, thus giving rise to interpretation that examinees interacted with the item only perfunctorily. This interpretation is in line with and refines previous research arguing that examinees approaching an interactive task in a disengaged manner perform only few actions within a short amount of time (Sahin & Colvin, 2020). Second, another behavioral pattern was characterized by performing no actions but requiring a long time until proceeding to the next item. This pattern could be interpreted as being overtaxed by the task at hand and/or not able to acquire information from the task environment and not knowing what types of actions to perform. This further underlines that the same actions executed in a different amount of time can point toward very different underlying processes. Third, we could identify incorrect behavioral patterns characterized by showing longer exploration behavior, however, conducting no or only few key actions necessary to solve the task. Such patterns might point toward being overtaxed by the task and lack of strategy on how to solve it. The fact that examinees with such behavioral patterns showed exploration behavior might indicate that they (a) were motivated to solve the task and (b) had an at least basic understanding of how to interact with the email environment, that is, they were sufficiently skilled to access the environment’s information, however, could not make use of this information to solve the task. Fourth, we could identify incorrect behavioral patterns characterized by hesitation to confirm proceeding to the next item. There are many possible explanations for this pattern. One possible explanation can be derived from the fact that examinees were informed that it is not possible to come back to an item once they have proceeded to the next one and that examinees from these cliques typically spent a long time on the most common LCS. Hence, this pattern could indicate persistence, resulting in being motivated to solve the task and thus going back to retry.
Assessing trajectories of time spent on task and number of performed actions across multiple tasks, we illustrated that even though the method by Ulitzsch et al. (2021) was applied only to a single task, it is capable of uncovering meaningful patterns of major differences in how examinees approached a given task that generalize across multiple tasks. So far, analyses of trajectories across multiple tasks are possible if theory-derived behavioral indicators already exist (Mustafić et al., 2019). In the case of interactive tasks such as in PIAAC, such theories do not, yet, exist for all actions and their respective timing. As the possible actions differ across different tasks (e.g., moving emails vs. bookmarking websites) and computational burden is high, further research is necessary to extend the approaches used in the present study to multiple tasks. In the present study, we illustrated how researchers may investigate generalizability of behavioral patterns across tasks to some extent when using exploratory methods for analyzing single tasks.
The identified dominant behavioral patterns were associated with different age levels and average proficiency estimates. This indicates that examinees of different age and with different proficiencies differed in the way in which they failed to provide a correct response on the assessed task. It further underlines the potential of understanding incorrect behavioral patterns for differentiating between examinees that failed to solve a given item.
As was to be expected, there were different idiosyncratic behavioral patterns showing that examinees strongly varied in how they approached the task. While some conducted actions necessary to solve the task, indicating a basic understanding of the task requirements and environment, others conducted actions that were not necessary for solving the task, indicating lack of understanding of the task requirements.
Limitations and Future Research
By drawing on time-stamped action sequences, we were able to identify different types of behavior resulting in incorrect responses. Due to the lack of further theoretical presumptions, however, interpretation still must remain speculative. Hence, further studies are needed to assist interpretation of dominant incorrect behavioral patterns. Such studies could be of both theoretical and empirical nature. For instance, for further in-depth investigations of behavioral patterns, interpretations could be corroborated by think aloud protocols (see Maddox et al., 2018, for an example using PIAAC data) or postassessment interviews with participants with typical behavioral patterns from each group of common behavioral patterns. Note that in the context of classical test items (i.e., items with a multiple-choice or simple constructed response format), validated behavioral indicators of disengaged rapid guessing (see Ulitzsch et al., 2020; Wise, 2017, for methods; and Ulitzsch et al., 2021b, for a recent validation study) exist. To corroborate the interpretation of found behavioral patterns as indicating disengagement, these validated behavioral indicators derived from assessments with classical items may be related to behavioral patterns presumably indicating disengagement on an interactive task. Such a procedure would be built on the assumption that examinees who show disengaged test-taking behavior in assessments with classical items are also more likely to be disengaged on interactive tasks. Furthermore, results of the present exploratory study may inform the refinement of cognitive theories that explain incorrect behavioral patterns. In future studies, these theories can be explicitly tested by (a) designing items in a way that allow for identifying predicted patterns and (b) manipulating or assessing external variables that help assessing the validity of the interpretation of the behavioral pattern.
There is a rapidly growing body of theories on features of successful behavioral patterns on interactive test items that have been corroborated by and may also facilitate the analysis of time-stamped action sequences (e.g., Greiff et al., 2015, 2016). A common example of such theories is the VOTAT strategy in problem-solving (Greiff et al., 2015; Han, He, & von Davier, 2019; Stadler et al., 2019). With further theoretical advances, we also expect theories to cover the specific characteristics of incorrect response behavior on interactive tasks. To corroborate theories on incorrect response behavior, expert-defined incorrect and correct behavioral patterns may be compared to observed ones (as in He, Borgonovi, & Paccagnella, 2019, 2021). One of the main challenges, however, is the integration of timing information into such comparisons.
Further, theoretical considerations on how examinees succeed and fail on a given task may also be used in task construction, such that process data may be indicative of theoretical differences in response behavior. Analyzing time-stamped action sequences from such tasks may provide a way to evaluate to which degree the applied methods extract meaningful common behavioral patterns. Likewise, results from studies on incorrect behavioral patterns on interactive tasks can be used to refine theories on incorrect response behavior on interactive tasks.
It should be noted that we broke down behavioral patterns with a rather high level of detailedness. As pointed out by Ulitzsch et al. (2021a), results of the applied method are highly contingent on the chosen similarity measure, the aggregation of action categories, as well as settings for the threshold
For demonstrating how incorrect behavioral patterns can, in parts, be disentangled, we focused on a single item. We found support of behavioral consistency of examinees partitioned to the same clique across multiple items in a row. More detailed explorations are recommended for future studies. An important next step is to assess (a) whether the identified groups of behavioral patterns can be replicated across different items as well as (b) whether examinees show behavioral patterns that are consistent across items.
In the long term, a better understanding of incorrect behavioral patterns on interactive tasks as gained by exploratory studies may support the development of less heuristic, model-based approaches that model incorrect behavioral patterns based on subject matter theory. Likewise, once behavioral patterns in general are better understood, methods can be developed that incorporate information on observed behavioral patterns into item response models for proficiency estimation. This would support further differentiating between examinees.
Conclusion
Understanding incorrect behavioral patterns on interactive tasks allows moving from assessing that examinees did not solve a given task to in which way they failed to solve it. This finer grained understanding may heavily facilitate the analysis of assessments with interactive items as well as the derivation of interventions from assessment results. First, the assessment of incorrect behavioral patterns allows to further differentiate between examinees with low proficiency by understanding which subskills or metacompetencies they are lacking. As such, applied incorrect behavioral patterns may explicitly be used in the definition and reporting of proficiency levels. With further methodological advances, this information might even be considered in proficiency estimation by integrating indicators of the different skills needed to solve an item and different ways of possible wrong solution strategies with item response models. Second, we were able to identify disengaged responses. Distinguishing between engaged and disengaged responses comes with great potential for retrieving more accurate proficiency estimates, for instance, by filtering out and ignoring responses from cliques with potentially disengaged behavioral patterns in the estimation of proficiency (e.g., Wise, 2017) or by considering these responses with more sophisticated model-based approaches (e.g., Liu et al., 2019). Third, better understanding dominant incorrect behavioral patterns and further differentiating between examinees with low proficiency can assist identifying examinees’ needs for development and designing interventions for improving complex or collaborative problem-solving skills. For instance, as pointed out by Stadler et al. (2019), so far, interventions aimed at increasing complex problem-solving performance have relied on repeatedly confronting problem solvers with problems of a similar nature (e.g., Kretzschmar & Süß, 2015). Instead, Stadler et al. (2019) recommended to target interventions at specific subskills or metacompetencies to solve the task at hand. Understanding what distinguishes incorrect from correct behavioral patterns may facilitate identifying these subskills and metacompetencies. In addition, there might be strong heterogeneity in the subskills and metacompetencies that examinees are lacking, rendering it necessary to also tailor interventions for different subpopulations of examinees.
In the present study, we illustrated how sequence mining techniques may support a deeper understanding of incorrect behavioral patterns. Note that the employed methods are neither restricted to application to incorrect responses nor to time-stamped action sequences from complex problem-solving tasks but might be employed to understand behavioral patterns in various psychological assessment and digital learning settings with interactive modes such as collaborative, game- and simulation-based tasks, scenario-based environments, or learning apps. As such, the present study may serve as a blueprint for researchers seeking a better understanding of behavioral patterns in various types of interactive tasks. It should further be noted that the development of approaches for analyzing (time-stamped) action sequence data is a rapidly growing stream of research (see Chen et al., 2019; Qiao & Jiao, 2018; Tang et al., 2020a, 2020b; Xu et al., 2018, for recent examples), equipping researchers with a versatile tool box for investigating behavioral patterns. Each approach supports investigating different aspects of behavioral patterns but may neglect others (e.g., to date, the majority of developed approaches neglects time). As showcased in the present study, combining insights gained from the application of different approaches may yield complementing insights into different aspects of behavioral patterns and is therefore strongly advised.
Footnotes
Appendix
Description of Dominant Behavioral Patterns for κ = 0.60
| Most Common LCS | Clique, Size | PV | Age | RT |
|
% |
|
|---|---|---|---|---|---|---|---|
| Next, NextOK | 1a (7) | 226 (30) | 38 (15.78) | 10 [8, 11] | 2 [2, 2] | 1.00 | 1.00 |
| Next, NextOK | 1b (16) | 233 (24) | 40 (12.46) | 28 [26, 32] | 2 [2, 2] | 1.00 | 1.00 |
| Next, NextOK | 1c (21) | 231 (30) | 45 (12.61) | 48 [43, 56] | 2 [2, 2] | 1.00 | 1.00 |
| Next, NextOK | 1d (12) | 223 (21) | 42 (15.57) | 91 [82, 106] | 2 [2, 2] | 1.00 | 1.00 |
| ViewF, Next, NextOK | 2a (17) | 230 (23) | 45 (14.78) | 57 [46, 67] | 3 [3, 3] | 1.00 | 1.00 |
| ViewF, Next, NextOK | 2b (24) | 233 (27) | 47 (13.68) | 98 [83, 107] | 3 [3, 3] | 1.00 | 1.00 |
| ViewM, Next, NextOK | 2c (12) | 238 (21) | 50 (12.32) | 99 [95, 117] | 4 [3, 4] | 1.00 | 0.91 |
| ViewM, ViewF, Next, NextOK | 3a (11) | 245 (18) | 5 (11.63) | 68 [54, 79] | 4 [4, 5] | 0.91 | 0.94 |
| ViewM, ViewF, ViewM, ViewF, ViewM, ViewF, Next, NextOK | 3b (8) | 250 (8) | 48 (10.85) | 111 [88, 121] | 8 [8, 14] | 0.75 | 0.89 |
| ViewF, Next, NextC, Next, NextOK | 4a (8) | 239 (26) | 57 (9.62) | 162 [149, 201] | 6 [6, 7] | 1.00 | 0.95 |
Note. PV = plausible value mean and standard deviation; Age = mean and standard deviation of age; RT