
Abstract
Standard item response theory (IRT) models have been extended with testlet effects to account for the nesting of items; these are well known as (Bayesian) testlet models or random effect models for testlets. The testlet modeling framework has several disadvantages. A sufficient number of testlet items are needed to estimate testlet effects, and a sufficient number of individuals are needed to estimate testlet variance. The prior for the testlet variance parameter can only represent a positive association among testlet items. The inclusion of testlet parameters significantly increases the number of model parameters, which can lead to computational problems. To avoid these problems, a Bayesian covariance structure model (BCSM) for testlets is proposed, where standard IRT models are extended with a covariance structure model to account for dependences among testlet items. In the BCSM, the dependence among testlet items is modeled without using testlet effects. This approach does not imply any sample size restrictions and is very efficient in terms of the number of parameters needed to describe testlet dependences. The BCSM is compared to the well-known Bayesian random effects model for testlets using a simulation study. Specifically for testlets with a few items, a small number of test takers, or weak associations among testlet items, the BCSM shows more accurate estimation results than the random effects model.
Keywords
Introduction
Many tests have sections consisting of sets of items that are related to a common stimulus (e.g., reading passage, data display). Each set of items is referred to as a testlet, and it is well known that the relationship between the items and the common stimulus can lead to positive dependence among the item responses of an individual (Wainer et al., 2007). Given the test taker’s ability level, the item responses within each testlet are positively correlated, which leads to a violation of the local independence assumption of item response theory (IRT) models. This positive dependence structure cannot be ignored. When item responses are incorrectly assumed to be (conditionally) independent, the precision of the ability estimates will be overestimated and the ability and item parameter estimates will contain bias (Wainer et al., 2000). Conversely, when item responses are incorrectly assumed to be dependent, the precision of the ability estimates can be underestimated and item parameter estimates can contain bias. In general, meaningful statistical inferences with an IRT model require careful handling of the dependence structure. This has led to much discussion in the literature on reliable methods to evaluate the assumption of local independence in IRT models.
In the previous research, it has been shown that when tests are constructed with testlet items, the items appear to be dependent even after conditioning on the latent variable (Bradlow et al., 1999; Li et al., 2006; Sireci et al., 1991; Thissen et al., 1989; Wainer & Kiely, 1987; X. Wang et al., 2002). The item responses tend to be more related to each other than can be explained by the (unidimensional) latent variable. The level of dependence among the testlet items depends on the level of the testlet variance (i.e., the variance of the testlet effects; see below). Items can be assumed to be locally independent when the testlet variance is equal to 0. The greater the variance, the larger the dependence among the items.
A popular model for testlets is the Bayesian random effects model (Bradlow et al., 1999; Wainer et al., 2000), referred to as a testlet response theory (TRT) model. This modeling approach includes a random effect to capture the dependence among item responses within a testlet. This random effect approach has several limitations. Testlet designs are easily incorporated in a test, but the random effect models for testlets (e.g., Bradlow et al., 1999) are subject to strict sample size restrictions. Each testlet needs to consist of a sufficient number of items, and the testlet needs to be administered to a sufficient number of test takers. This limits the applicability of testlet designs in practice. When the design is incomplete, for instance, due to the adaptive nature of the test, these sample size restrictions can become a problem. The assumption of local independence is a pressing issue that needs to be addressed in smaller scale applications.
For the TRT model, the number of testlet parameters can easily become overwhelming. A testlet parameter is introduced to address the dependence for each combination of testlet and test taker. When the test contains many testlets and is administered to a large number of test takers, a huge number of parameters are needed to model the testlet dependence structure. This is a very inefficient parameterization since the strength of dependence depends only on the testlet variance parameter, which is assumed to be the same across individuals. In the proposed model, each testlet dependence can be modeled with a single covariance parameter without the need to include a testlet effect for each test taker. In practice, interest usually is not focused on the test taker’s testlet effects. Testlet effects are only used to model the dependence structure. However, they can seriously complicate the computational burden and imply restrictions on the sample size. They also complicate the interpretation of estimated item parameters since their scale depends on the testlet effect parameters and the trait parameter.
Another issue with the TRT model is the prior distribution for the testlet variance. The testlet variance parameter determines the strength between testlet items and is restricted to be positive. A noninformative prior for the variance parameter is a topic of much discussion. When the testlet variance is close to 0, the inverse-gamma prior can introduce a bias by overstating the level of dependence of the testlet items. Furthermore, the inverse-gamma prior is unable to include the point of no testlet variance, representing the state of an independent set of items. This makes it difficult to verify whether a set of items is nested within a testlet. The prior information for the level of dependence excludes the option that the items do not correlate. Furthermore, a testlet variance of 0 is of specific interest, but this point lies on the boundary of the parameter space. Classical test procedures such as the likelihood ratio test can break down and have complex sampling distributions, which complicates the computation of critical values, when the true parameter value is on the boundary.
A Bayesian covariance structure model (BCSM; Klotzke & Fox, 2019a, 2019b) for testlets is proposed to address the shortcomings of the TRT model. The BCSM also modifies the standard IRT models to accommodate the clustering of items: The covariance structure of the errors is modeled to handle the greater dependence of items within testlets. In this additional covariance structure, dependences between clusters of items are modeled. This parameterization is very efficient, since a common covariance can be assumed between responses to items in a testlet across test takers. Therefore, the number of additional model parameters for the BCSM is equal to the number of testlets, when assuming testlet-specific dependences. The prior information for the level of dependence can also include no dependence between items in a testlet. Furthermore, testlet effects do not have to be estimated, since they are not needed to model the dependences. For the BCSM, sample size restrictions can be relaxed in comparison to the TRT model, which makes the BCSM more suitable for small sample sizes, incomplete designs, and extensive testlet structures with many testlets, each containing just a few items.
In the remainder, the TRT model is described as a modification of standard IRT models for binary and polytomous data. Then, the BCSM for testlets is presented, where covariance structure models are discussed as extensions of IRT models. The computational method to estimate the parameters is based on Markov chain Monte Carlo (MCMC), which is briefly described. Then, simulation results for several test designs are presented, which include a comparison between the TRT model and the BCSM for testlets. In the final section, conclusions and model generalizations are discussed.
Testlet Response Theory
TRT models were introduced as a model-based approach to handle violations of local independence, since sets of items are related to a single stimulus (Bradlow et al., 1999; Wainer et al., 2000; W. C. Wang & Wilson, 2005). In TRT, a standard unidimensional IRT model is extended to include testlet parameters to account for within-testlet dependence. TRT models can be viewed as a confirmatory multidimensional IRT model in which all item responses are influenced by a common latent trait, and item responses within a testlet are further explained by a testlet parameter.
In this research, the considered data structure consists of N examinees
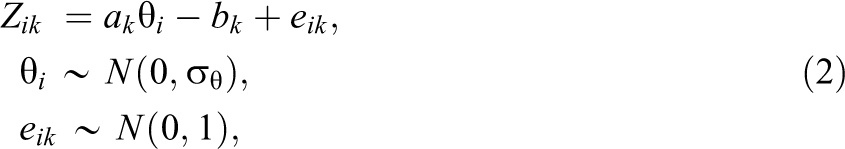
A Probit version of the two-parameter TRT model is considered, where the probability of a correct response of test taker i to item

where
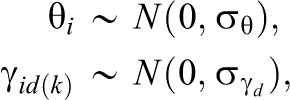
The model specification is completed with a prior specification for the parameters. Normal distributions are assumed for the item parameters, where the priors are given by
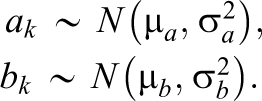
Inverse-gamma priors are specified for the variance parameters
The testlet effects are zero-centered to identify the model and to interpret the testlet effects as deviations from the standard linear predictor in the two-parameter IRT model. Furthermore, the mean and variance of the ability distribution are set to 0 and 1, respectively, to identify the model.
The BCSM for Testlets
The BCSM modifies the standard IRT models by including a covariance structure model for the extra dependence of items within a testlet. When representing the two-parameter IRT model in a latent variable form, where latent responses
where
When sets of items are nested in testlets, the errors are assumed to be dependent within each testlet. Consider the responses to items in testlet d of individual
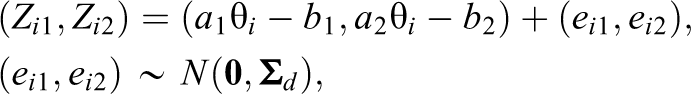
and
The covariance structure
In this research, the dependence structure of the BCSM does not include the item discrimination parameters. In the TRT model in Equation (1), the discrimination parameters also influence the dependence structure through multiplication with the testlet effects. In the BCSM, a homogeneous association among items in a testlet is assumed. The inclusion of discrimination parameters is described in the discussion, which is a topic of further research.
The BCSM for testlets can be represented as a multivariate distribution for the responses to items in a testlet
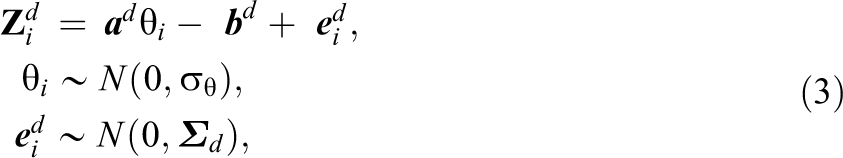
where
The main difference between the TRT model (Equation [1]) and the BCSM (Equation [3]) is that the TRT model has a testlet effect parameter to model the dependence structure, where the BCSM describes the extra dependence with a covariance matrix. The BCSM does not include any testlet parameters, which leads to a serious reduction in the number of model parameters. The BCSM is much more efficient in describing the dependence structure. Furthermore,
The extension to polytomous response data is straightforward. In the latent response formulation, the latent responses are assumed to be truncated multivariate normally distributed. For an observed response in category
Bayesian Inference
An MCMC method is used to draw samples from the posterior distributions of the model parameters to make inferences about the unknown model parameters. For the binary TRT model, this method is described in Bradlow et al. (1999). The authors implemented a Gibbs sampler to draw parameter values from their conditional distributions. X. Wang et al. (2002) proposed Metropolis–Hastings steps to make draws from the conditional distributions for parameters of the polytomous TRT model for ordinal data. The R package sirt (Robitzsch, 2019) contains MCMC algorithms for binary and polytomous TRT models.
For the BCSM, an MCMC algorithm is proposed (a full description can be found in the Appendix). The novel steps of the algorithm are explained in more detail. This includes the conditional distribution of the parameter
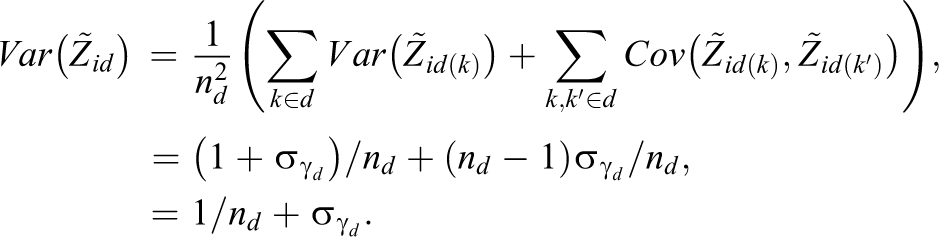
The posterior distribution of
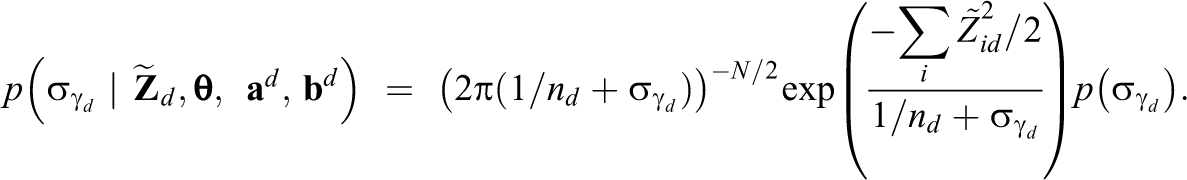
A conjugate prior for
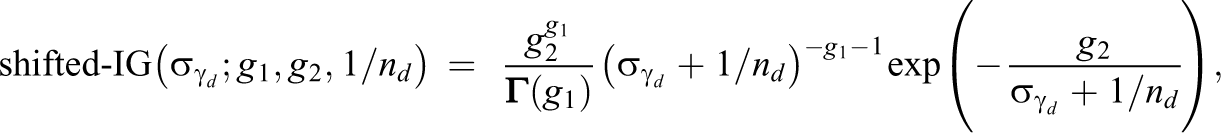
where g
1 is the shape parameter, g
2 is the scale parameter, and
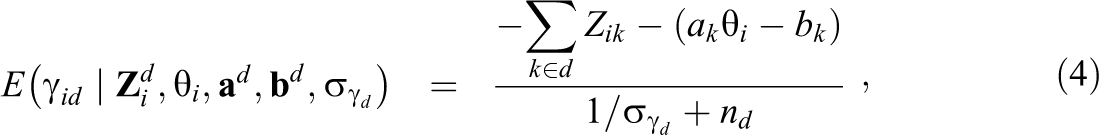
The conditional distributions of the remaining parameters for the binary BCSM are described in the Appendix. For polytomous data, the conditional distributions of the BCSM parameters follow in a similar way. Although the testlet effects are not included in the BCSM, testlet effects can still be estimated under the BCSM by extracting them from the residuals.
This is only possible when the covariance parameter is positive, and a testlet effect can describe the positive associations among the testlet residuals. In that case, we use the model description of the TRT model,
and variance
The BCSM is identified by restricting the mean and variance of the (primary) latent variable
Simulation Study: TRT Versus BCSM
The performance of the TRT model for testlets was examined in a simulation study and compared to the performance of the BCSM model using MCMC for parameter estimation. The first purpose of the simulation study was to compare the BCSM to a current standard approach in the test industry, specifically the TRT model. In this comparison, the testlet variance was also restricted to be small in order to examine the influence of the prior information under both models. The second purpose was to confirm that accurate parameter estimates can be obtained for the BCSM under a wide variation of experimental factors. Three factors were varied across the simulation conditions: (a) the number of examinees, (b) the number of items per testlet, and (c) the testlet variance. The parameter values were set to realistic values and defined similarly to the ones used by X. Wang et al. (2002).
In this comparison, data were simulated under the TRT model. A population distribution was defined for the model parameters in order to generate data under the TRT model. The simulated data sets mimic real-world applications, assuming the TRT model structure is true for a real population. In this simulation study, binary responses were simulated, where a 1 indicates success and a 0 indicates no success. The data sets were used to estimate the parameters for both models. The following population distributions were asserted for the generation of data sets:
Since the data were generated under the TRT model, it was expected that estimation results would be similar for moderate-to-large sample sizes. For small sample sizes, it was expected that the estimated testlet variance parameters under the TRT model would show bias, which was also observed by Jiao et al. (2013). The prior for the testlet variance can lead to an overestimation when the testlet effect is small.
The TRT model is only statistically equivalent to the BCSM for a fixed positive (co)variance parameter
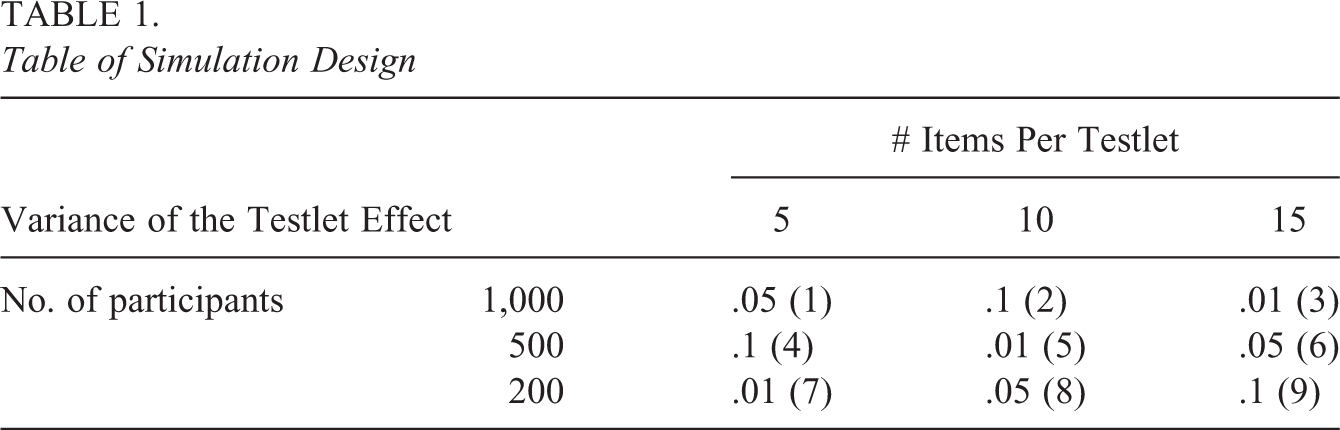
Each condition was replicated 1,000 times. The number of items was set to
Table of Simulation Design
MCMC procedures were used to estimate the model parameters of the TRT model and the BCSM. When convergence was reached, additional samples from the posterior distribution were drawn to make inferences. The advantage of this is that further inferences, like computing the mean of the posterior distribution of a parameter, can be easily made. In this study, the first 1,000 iterations were discarded as the burn-in, and another 9,000 iterations were made to the model parameters. The Heidelberger and Welch’s convergence diagnostic (Plummer et al., 2006) was used to evaluate the convergence of the MCMC chains. The average lag-50 autocorrelation and the effective sample size were computed to compare the estimation performance of both MCMC algorithms. For M-independent MCMC draws, the central limits theorem states that the bound on the estimation error is proportional to
The estimated model parameters were compared to the true simulated values. The posterior means were used as parameter estimates. Three criteria were used to assess the quality of the parameter estimates. The bias, root mean squared error (RMSE), and coverage rate were computed for each parameter. For instance, for the item difficulty parameter
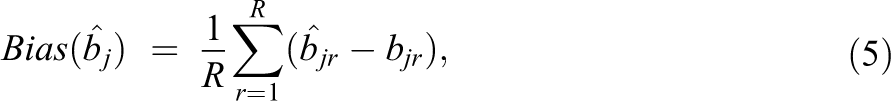
where
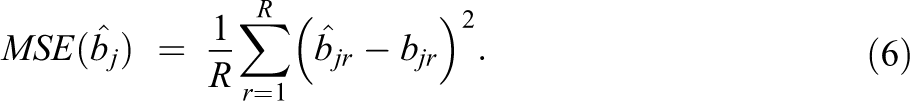
The bias and RMSE were calculated for different model parameters obtained under the two models. Where applicable, the results were averaged across the test items and participants in order to make the comparison more straightforward.
A 95% highest posterior density (HPD) interval was used to compute the coverage rates. The coverage rate gives an indication of the number of times that the true value lies within the 95% HPD interval. The data were simulated under the TRT model, so for the TRT model, the coverage rates were designed to be 95%. When the coverage rate is lower, the true parameter value is less often recovered than would be expected according to the 95% HPD interval. A low coverage rate indicates a problem with the model’s functioning. The coverage rate under the BCSM was expected to be higher than 95%, since data were simulated under the TRT model. Under the BCSM, the 95% HPD intervals are wider, since the testlet correlations are not restricted to be positive. As the data were generated under the TRT model, the coverage rates under the BCSM were therefore not expected to match up exactly.
Results
The MCMC algorithm for the BCSM model performed good. Several problems were found with the estimation performance of the MCMC algorithm for the TRT model. For moderate-to-large sample sizes and a testlet variance of .1, the MCMC samples under the TRT showed reasonable stable behavior and better convergence. For smaller testlet variances, the chains under the TRT model showed much higher autocorrelations and less smooth transitions through the parameter space than the chains under the BCSM (Figure 1). For the TRT model, the subplots show the trace plots of the sampled testlet variances for N = 200 and N = 1,000. For N = 200, the chain shows high correlation between sampled values. When values close to 0 were sampled, the chain showed difficulties in moving away from the state of no testlet variance. This can be seen around iteration numbers 4,000 and 8,000. The MCMC chain shows problems in moving away from the state of no testlet variance. For N = 1,000 and a higher true testlet variance, this problem did not occur. However, the trace plots still show highly correlated values. For the BCSM, the behavior of the MCMC chain is much better. For small sample sizes, the chain did not got stuck at 0 since negative testlet covariances were allowed. Without this lower bound at 0, the movement of the chain through the entire parameter space was improved, leading to more informative MCMC samples (less correlated samples) from the posterior distribution. When increasing the sample size to N = 1,000, the behavior of the chain under the BCSM remained almost similar to the one for N = 200.
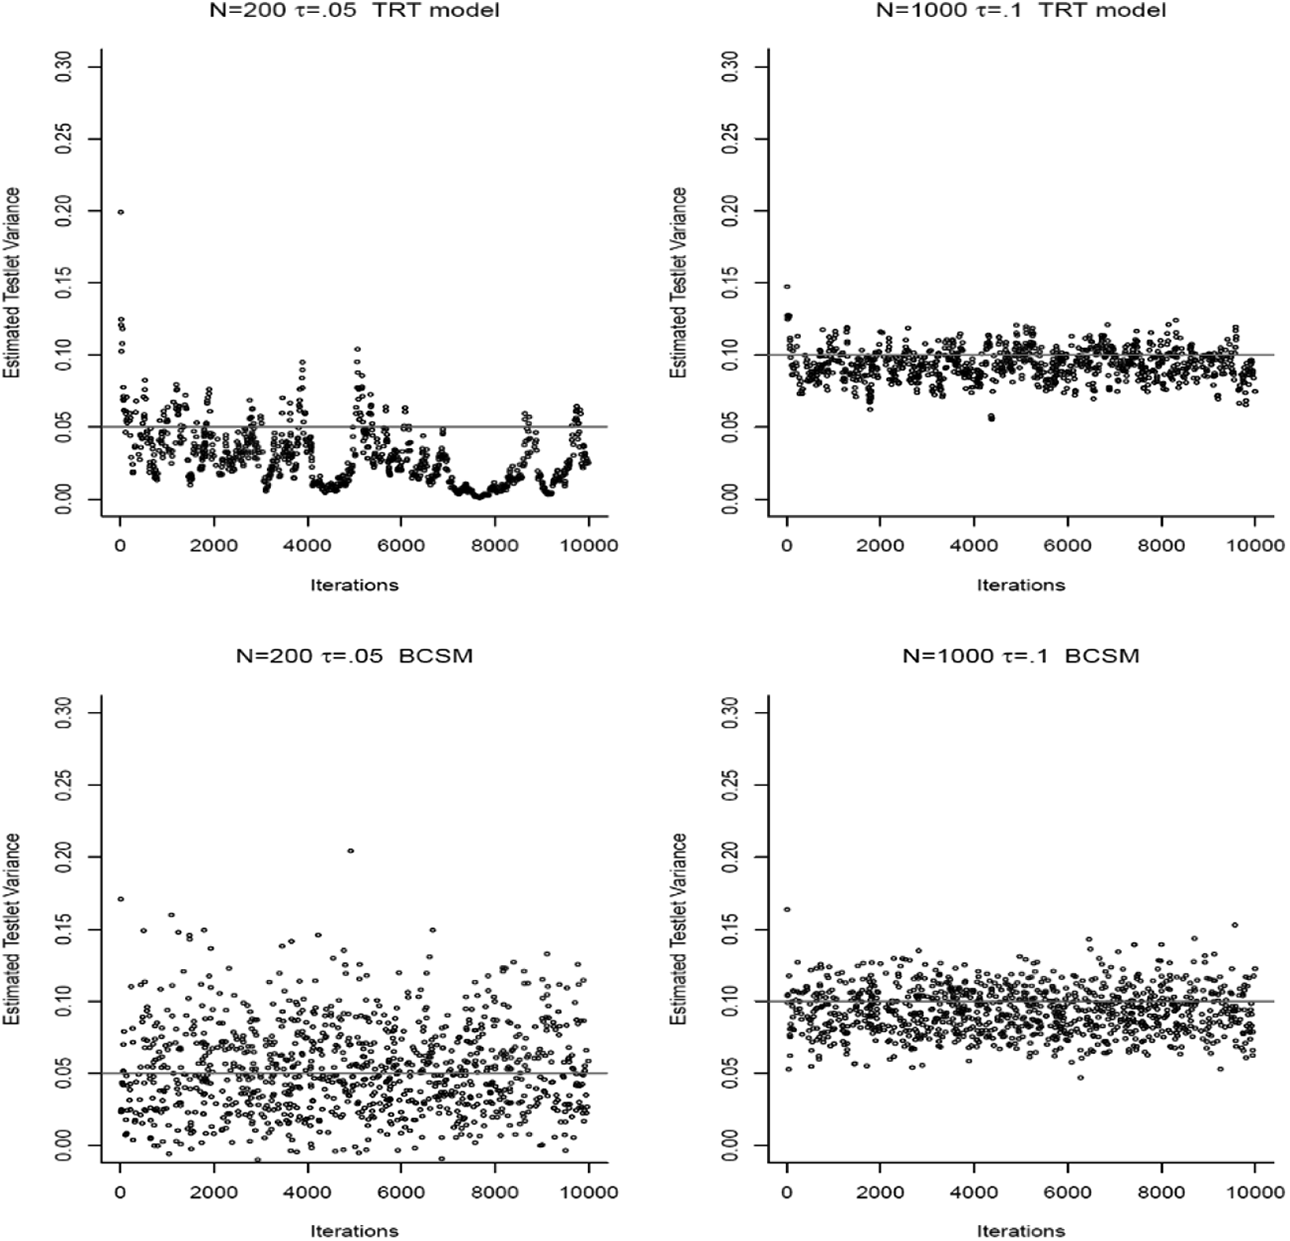
Trace plots of Markov chain Monte Carlo chains for small and moderate sample sizes under the testlet response theory (TRT) model and the Bayesian covariance structure model (BCSM).
For each condition, the average effective sample size and lag-50 autocorrelation were computed for the testlet variance across replications under each model. For the TRT model, it can be seen in Table 2 that for 9,000 MCMC iterations, the
The (MCMC) Effective Sample Size (Meff) and Lag-50 Autocorrelation Averaged Across Replications Per Condition and Model
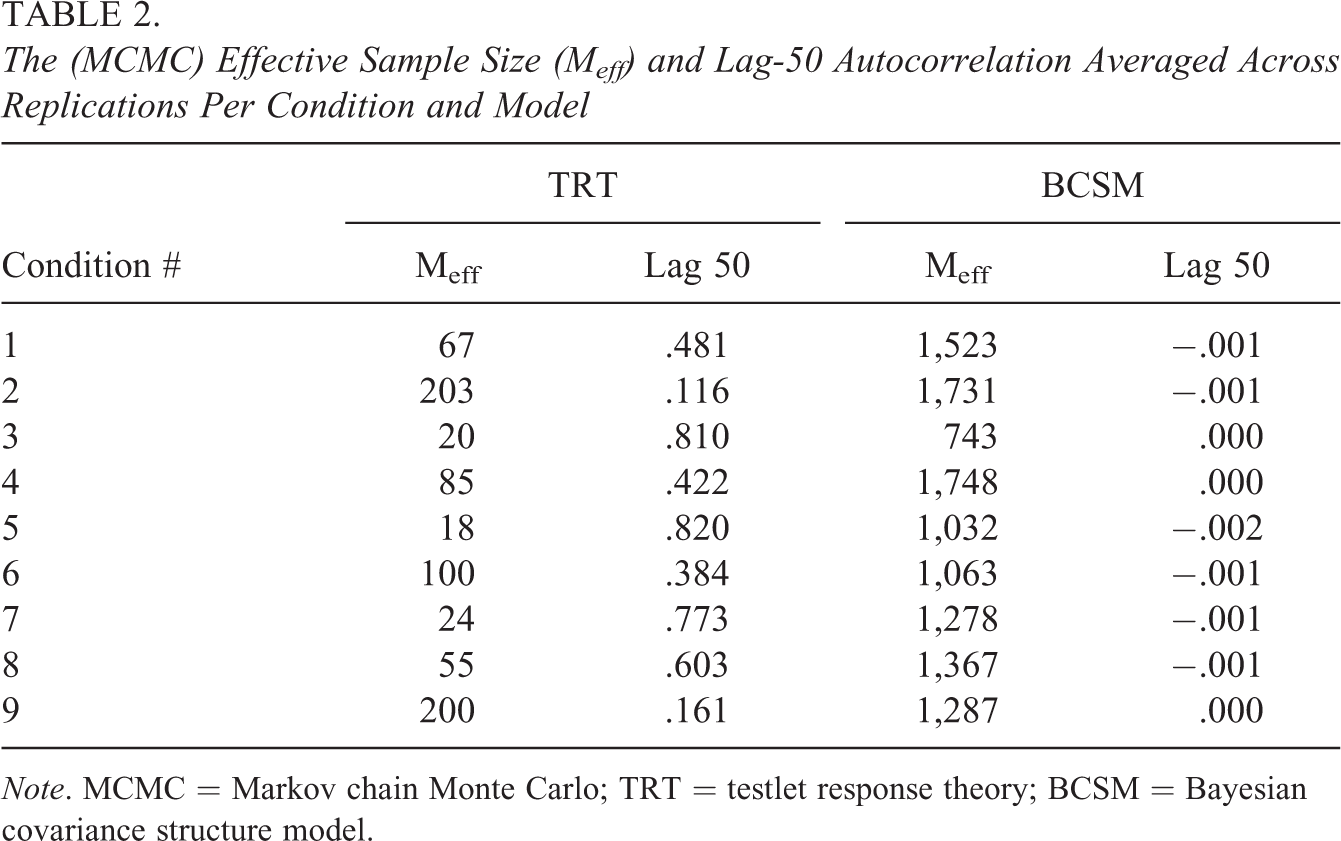
Note. MCMC = Markov chain Monte Carlo; TRT = testlet response theory; BCSM = Bayesian covariance structure model.
For the nine conditions, the estimates for the discrimination, difficulty, and ability parameters were obtained. The true parameters for
The estimated testlet variance parameters under both models are shown in Table 3. We see that under the TRT model, the true testlet variance was generally underestimated. The posterior mean was used as an estimator, but the estimation results did not differ much from those using the posterior mode as an estimator. A vague inverse-gamma prior for the variance parameter was used, with the shape and scale parameter equal to .01. For a true testlet variance value of .01, the testlet variance was sometimes not detected under the TRT model. Specifically in Condition 7, a testlet variance was not detected in many of the replications (95% coverage rate equaled .13) and the estimated testlet variance was around .0038 under the TRT model. For this condition, it was investigated whether the testlet variance estimates improved under the TRT model, when using an inverse-gamma prior with a shape and scale value equal to 1. This prior gave more support to higher testlet variances. The estimated testlet variance for 1,000 replications equaled .052, which is more than 13 times greater than the estimate with the vague prior with shape and scale parameters equal to .01 and 5 times greater than the true value of .01. The RMSE of the estimated testlet variance was .051, and the coverage rate was equal to 0. In conclusion, the prior can be adjusted to cover higher testlet variances, but this easily leads to overestimating the true value. These estimation problems did not occur under the BCSM, where a vague prior was used for all conditions, and all testlet variances were accurately estimated.
Estimated Testlet Variances of the TRT Model and the BCSM Across 1,000 Data Replications
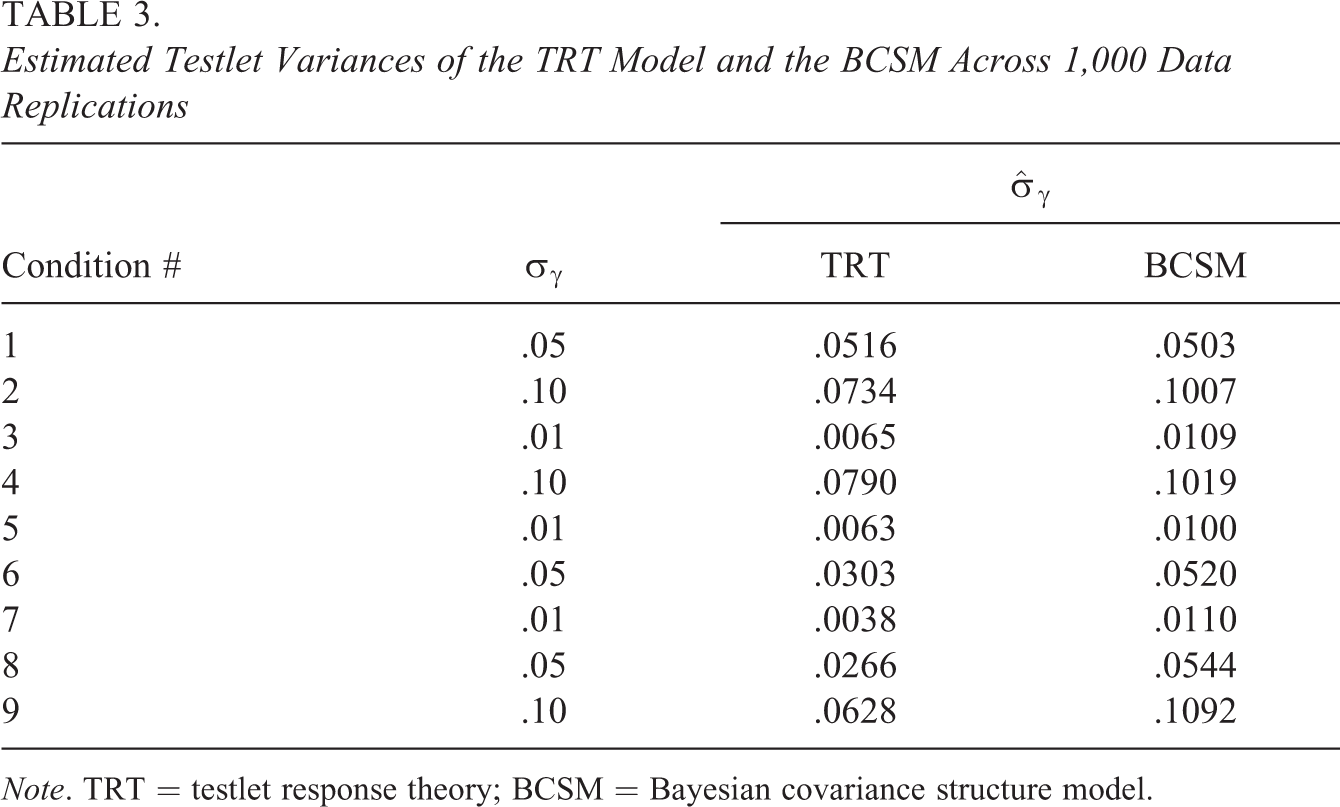
Note. TRT = testlet response theory; BCSM = Bayesian covariance structure model.
In Table 4, the RMSEs of the testlet variances and testlet effects under both models are presented. The estimated differences in RMSE of the testlet variance parameters were very small, and the RMSEs were overall very small. Estimation of the RMSE and bias was based on mean parameter estimates. It was expected that under the TRT model, a skewed posterior distribution of the testlet variance parameter would lead to an overestimation of the true parameter value. Significant overestimation of the true value due to skewed posteriors was not detected. Estimates of testlet effects under the BCSM were comparable to those under the TRT model when they were transformed to a common scale with mean 0 and an equal testlet variance. Estimated testlet effects under the BCSM were less shrunken toward the prior mean. This led to a greater number of outliers and more variance in estimated testlet effects.
RMSEs of True Parameters and Estimated Posterior Mean for the Testlet Variance and Testlet Effects
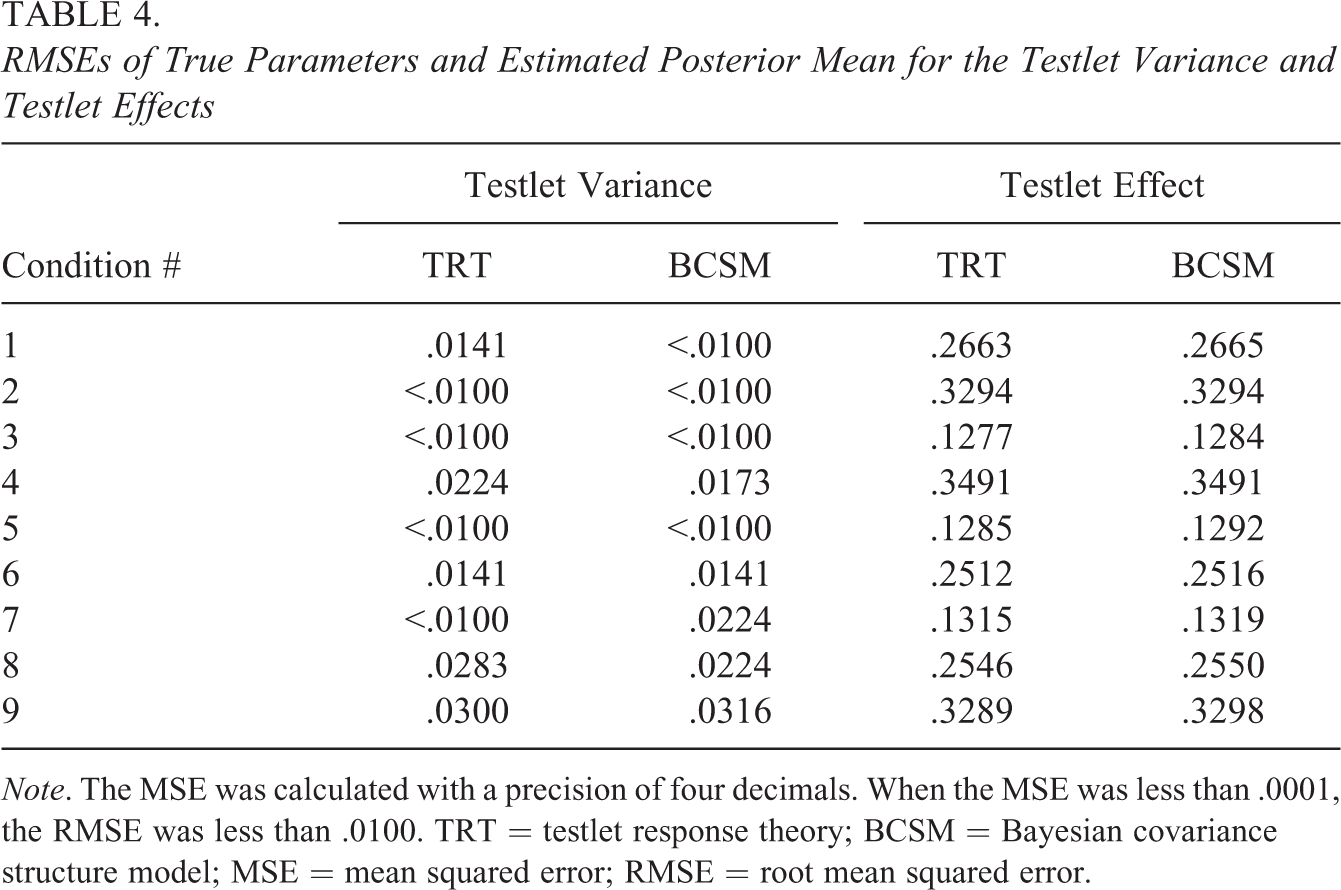
Note. The MSE was calculated with a precision of four decimals. When the MSE was less than .0001, the RMSE was less than .0100. TRT = testlet response theory; BCSM = Bayesian covariance structure model; MSE = mean squared error; RMSE = root mean squared error.
The 95% coverage rates are presented in Table 5. A remarkable finding was that the coverage rates for the TRT model were not satisfactory for most conditions (i.e., they were generally too low). In Condition 2, for a large sample size with higher testlet effects, the coverage rate was close to the target 95%, with a coverage of 93%. In many replications, the true value was not captured by the 95% HPD interval. For small sample sizes and small testlet effects, the coverage rates were particularly low under the TRT model.
The 95% Coverage Rates for the Testlet Variance Under the TRT Model and the BCSM
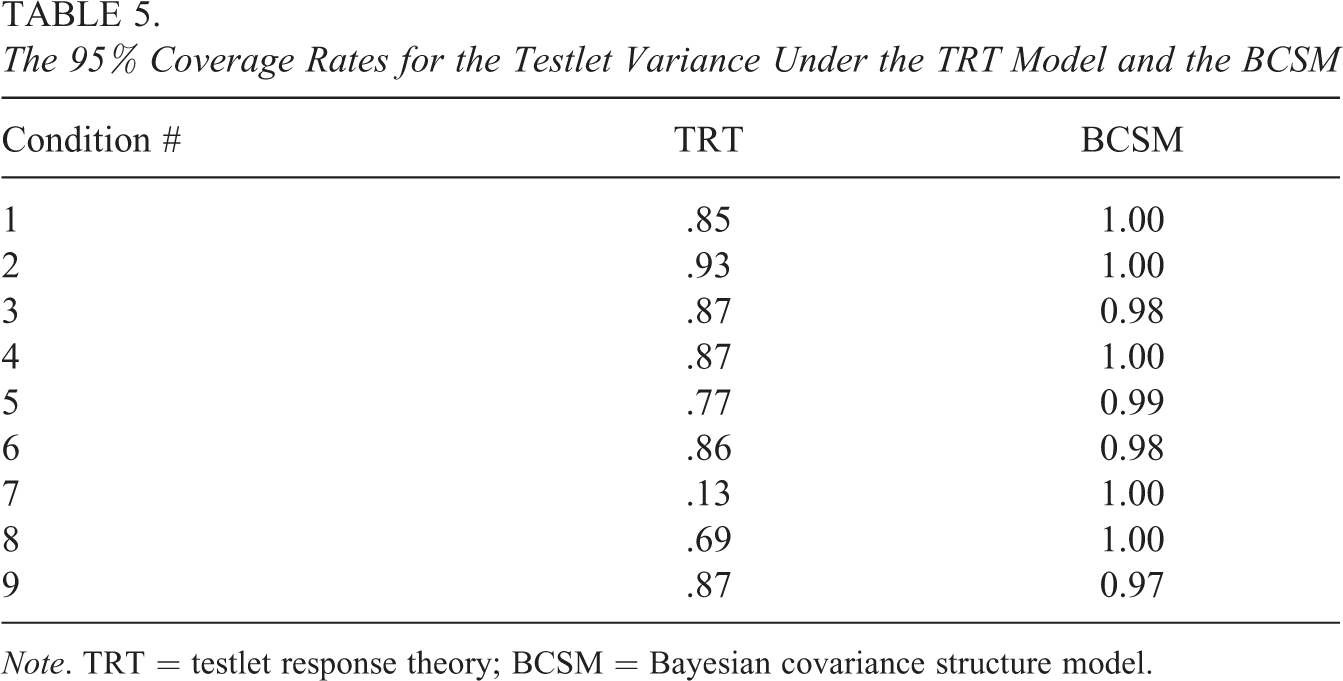
Note. TRT = testlet response theory; BCSM = Bayesian covariance structure model.
Coverage rates for the BCSM were too high, as expected, and most often were 100%; parameter space for the testlet covariance parameter was also wider under the BCSM than under the TRT model. This leads to a wider posterior distribution of the testlet covariance parameter. As a result, the 95% HPD intervals are wider and the coverage rates higher under the BCSM than under the TRT model. Under the BCSM, the coverage rates were comparable across conditions and did not show a relationship with sample size. In Conditions 6 and 9, the coverage rates under the BCSM were slightly smaller (98% and 97%, respectively).
Figure 2 shows the estimated posterior densities of the testlet variance parameter using an informative and a vague prior under the TRT model, given sampled values in Condition 7 (200 test takers and 5 items per testlet), where the true variance is .01. When using a vague prior, the posterior distribution is highly peaked at 0. In that case, the MCMC chain is stuck at 0 as shown in the upper subplot of Figure 1. When increasing the prior information about the testlet variance (i.e., shape and scale parameter of the inverse-gamma is equal to 1), the posterior distribution covers testlet variances above the true value. The 95% HPD interval is equal to
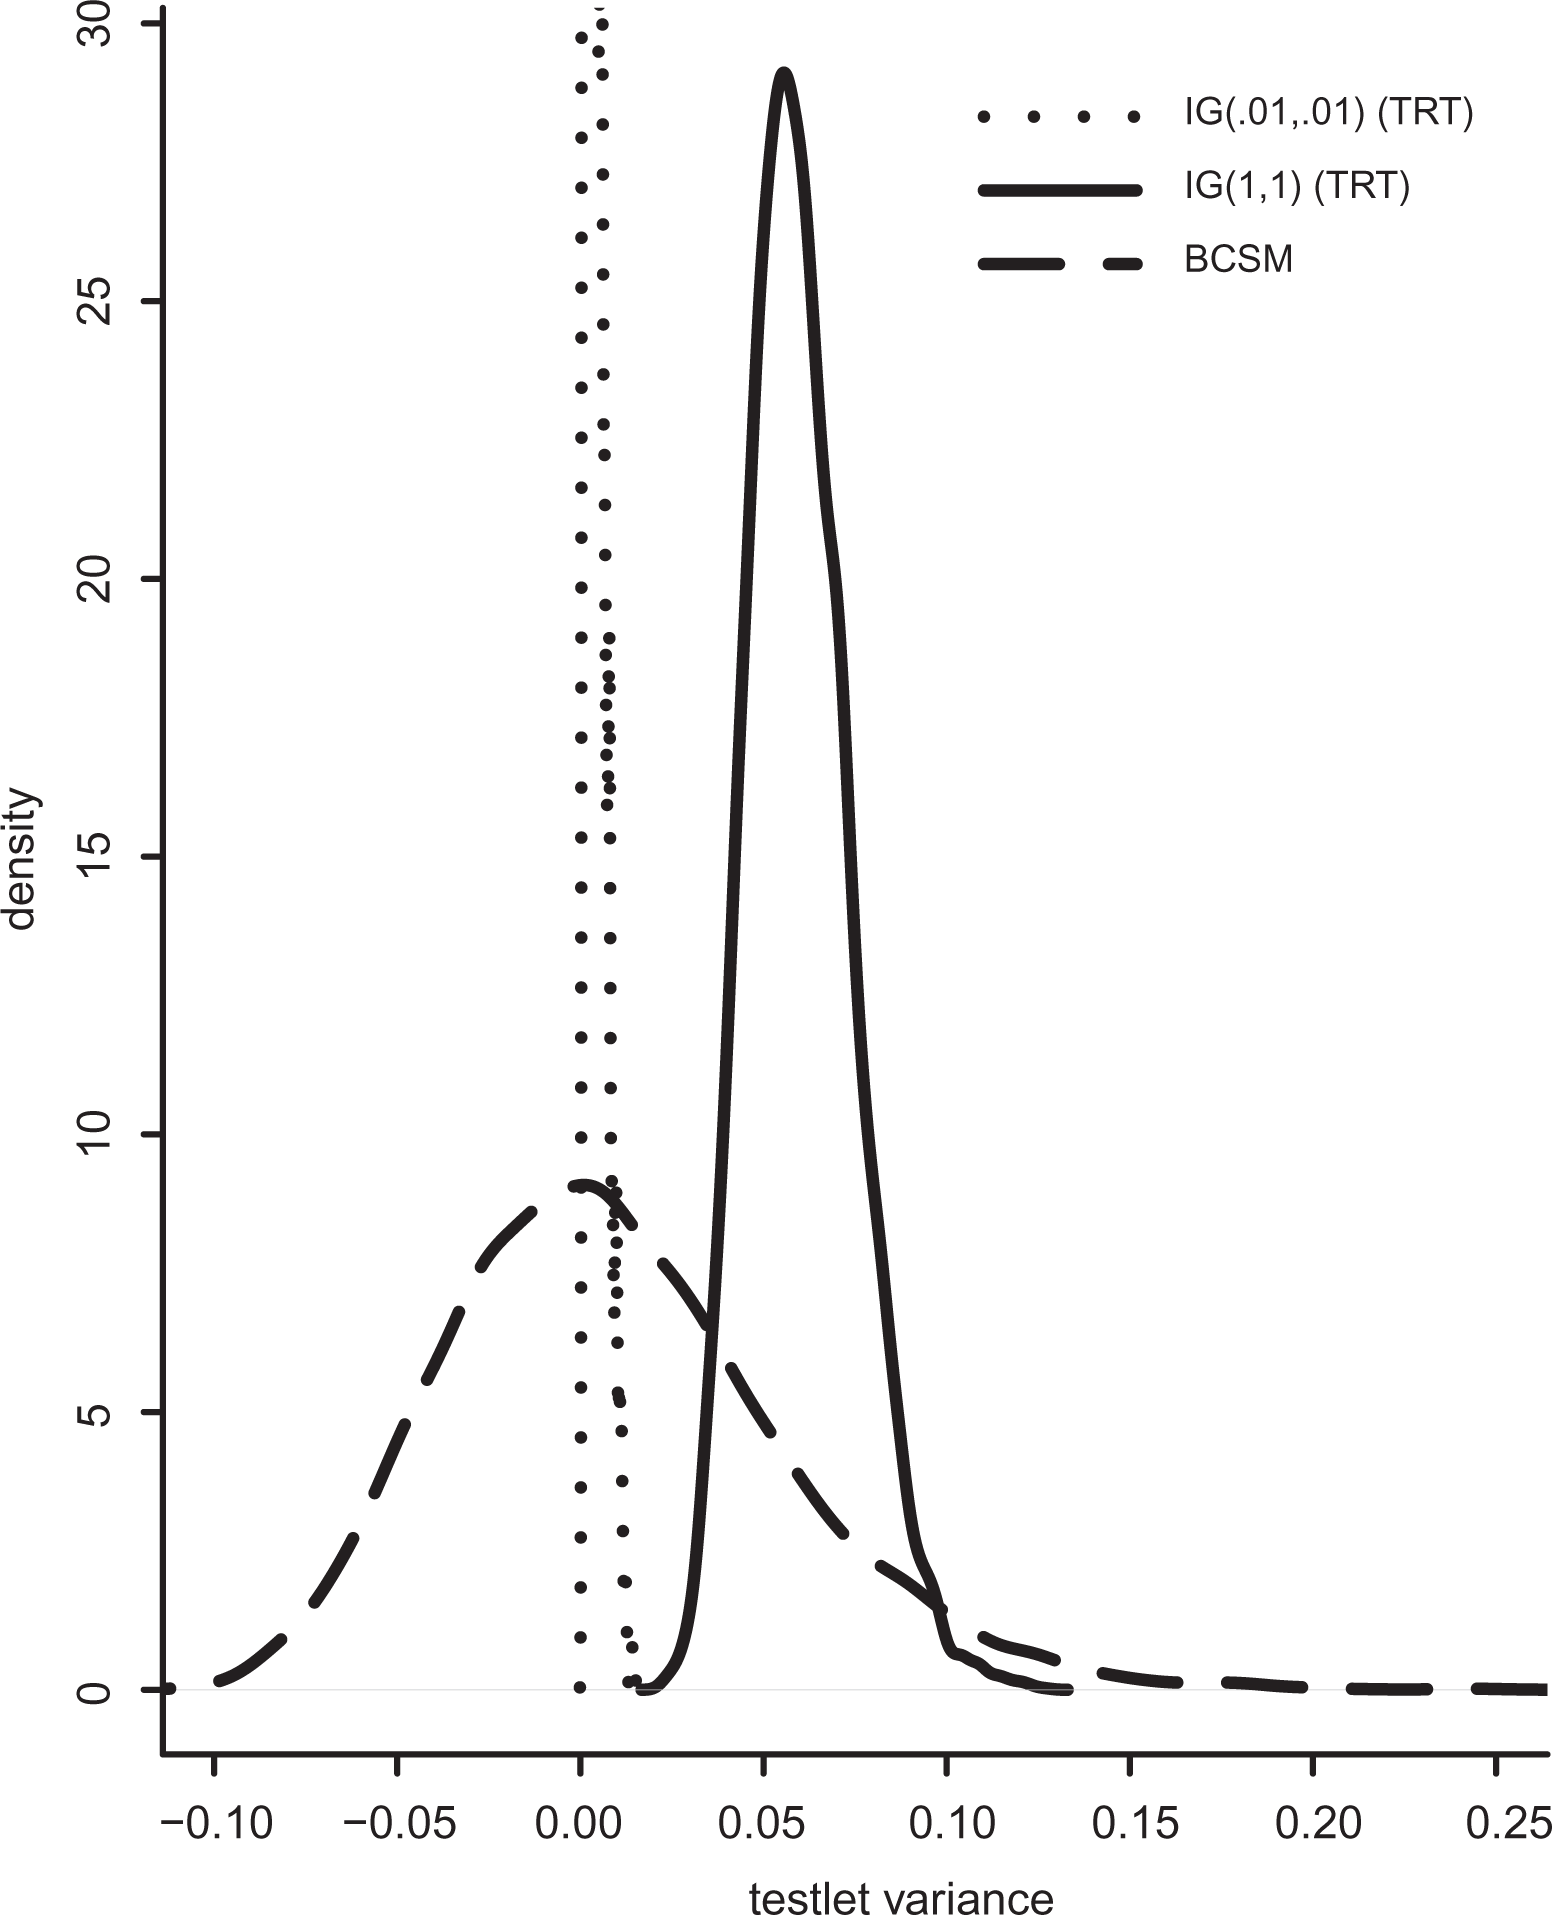
Posterior density of the testlet (co)variance under the Bayesian covariance structure model (BCSM) and the testlet response theory (TRT) model.
Polytomous Response Data
For the BCSM for polytomous data, the data were generated under the BCSM. The testlet covariance was varied across testlets and ranged from −.05 to .50. The TRT model cannot handle a negative covariance among items in a testlet. In practice, negative associations among testlet responses can occur when the testlet leads to a stimulation of the success probability for some items but not for others in the same testlet. For instance, when a testlet consists of innovative items, directional local dependence and multidimensionality can lead to opposite stimulation of the success probabilities of the testlet items, which leads to a negative association.
Therefore, in this simulation study, the BCSM was not compared to the TRT model. Data were generated according to a BCSM for ordinal data, with three response categories, for a 10- and 20-item test. The number of test takers was equal to 1,000. The number of testlet items and the testlet variance was varied (Table 6). For the 10-item test, three testlets had 2, 3, and 5 items, respectively. For the 20-item test, three testlets had 4 items and one testlet had 8 items. In Table 6, the specific conditions are given under the label number of items, number of testlet items, and the testlet covariance parameter
BCSM for Polytomous Data: Estimated Testlet Variance and 95% Coverage Probabilities
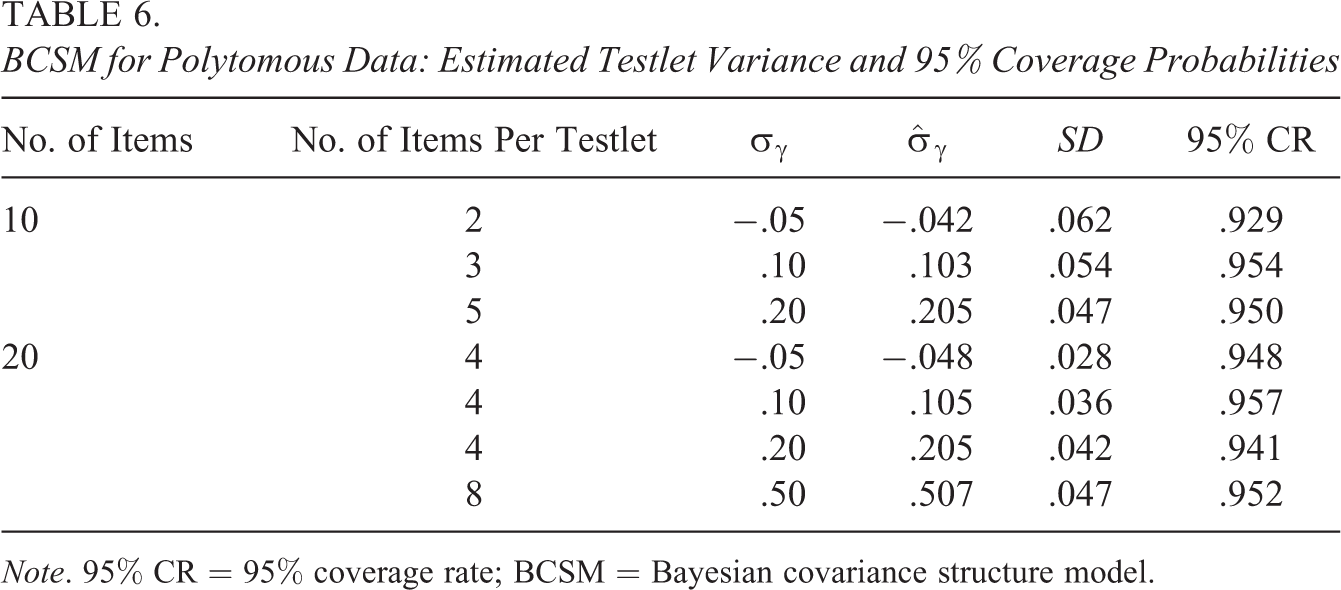
Note. 95% CR = 95% coverage rate; BCSM = Bayesian covariance structure model.
The following population distributions were asserted for the generation of the data sets:
The posterior mean estimates of the testlet variances are given in Table 6, which are the average posterior means across replications. It can be seen that the estimated testlet variances are close to the true values even for very small testlet variances. For the testlet with 2 items, the estimated negative covariance is slightly above the true value and the estimated coverage rate is around 93%. For a 2-item testlet, it is more difficult to recover the negative correlation. It can be seen that the recovery is improved when the number of testlet items is increased to 4. For the 2-item testlet, the posterior standard deviation of the covariance parameter is relatively high but is reduced by a factor of two when the number of testlet items is increased from 2 to 4. The posterior standard deviation increases as values of the testlet covariance increase. In Table 5, the coverage probabilities under the BCSM were higher than the nominal level since the data were generated under the TRT model. In this simulation study, the coverage probabilities are good and correspond closely to the nominal coverage probability. The other BCSM estimates (i.e., ability, discriminations, thresholds) were also close to their true values, and the corresponding coverage probabilities also matched the nominal level.
Discussion
The BCSM for testlets is a new modeling framework in which testlet dependences are modeled through an additional covariance structure. The BCSM has several advantages over TRT models. Under the BCSM, testlet effects do not have to be estimated, which leads to a serious reduction in the number of model parameters. In TRT models, for every combination of testlet and test taker, a (random effect) parameter is introduced, which complicates estimation of the model parameters and comparison across different TRT models. Testlet effects also place restrictions on sample size: Each testlet needs to consist of a sufficient number of items to estimate the testlet effect. It was shown that for small sample sizes, it was difficult to specify the prior for the testlet variance. It was also shown that for the BCSM, accurate estimates were obtained for small sample sizes, small numbers of test takers (N = 200), and small numbers of items per testlet (2 items per testlet), without needing an informative prior.
Under the BCSM, testlet dependence is modeled with a covariance parameter. This avoids issues related to lower bound problems at 0 when estimating model parameters. Testlet dependences are also allowed to be negative. The BCSM for polytomous testlet data also showed accurate estimation results. Furthermore, testlet effects can still be estimated under the BCSM through a post hoc sampling approach. The issues in obtaining reliable posterior estimates under the TRT model were not clearly visible in terms of bias and RMSE of the ability and item parameters. Nevertheless, differences were notable in terms of the coverage rates and estimated testlet variances.
There have been various suggestions on how to handle testlet effects. Thissen et al. (1989) suggested treating testlets as polytomous items and applying polytomous IRT models. However, this approach uses the same discrimination parameter for all items within a testlet and a total score for each testlet (Zenisky et al., 2002). These issues will possibly cause a loss of measurement information by having fewer parameters, and different scoring patterns for each testlet will be ignored. W. C. Wang and Wilson (2005) remarked that in a polytomous item approach, the number of response patterns of items within a testlet is modeled, and the testlet parameter is treated as fixed effects. For a testlet with 10 dichotomous items, this leads to
In this research, the dependence structure of the BCSM did not include item discrimination parameters. The testlet effect parameter in the TRT model in Equation (1) is multiplied by a discrimination parameter. Then, the error term is
The TRT model is a restricted bifactor model, where the discrimination parameters of the secondary factors are restricted to be proportional to the discriminations of the primary factor within each testlet (e.g., Rijmen, 2010). Although the bifactor model is more flexible in describing the dependence structure of the testlet errors, the model has the same disadvantages as the TRT model. When assuming normally distributed factor variables, the model is identified by restricting the mean and variance of each factor to 0 and 1, respectively. Then, the linear function of the factor variables in the bifactor model for an observations to item k in testlet d is represented by
The BCSM differs from the well-known Gaussian copula, since it uses a structured covariance matrix to model the dependence structure. This structured covariance matrix follows from the joint conditional modeling approach of the marginal distributions. This dependence structure implied by the conditional model is integrated in the covariance structure of the BCSM and provides a clear interpretation of the parameters of the dependence structure. In copula modeling, the copula function determines the type of dependence and it operates directly on the marginals. For instance, in the Gaussian copula, marginal cumulative distributions functions are coupled using the multivariate normal cumulative distribution function with an unrestricted correlation matrix. This often leads to more complex dependence structures intertwining the factor and residual dependence.
Under the presented BCSM testlet model, and contrary to Gaussian copula models, closed-form expressions for the conditional posterior distributions of all model parameters are available. This allows to directly sample the parameters through an efficient Gibbs sampling algorithm. Therefore, the BCSM does not require the numerical evaluation of integrals and offers an uncomplicated way to make inferences about the item parameters, person parameters, and the dependence structure.
The copula model preserves the marginal cumulative distributions in the construction of a multivariate distribution, which makes the modeling framework more flexible to define a multivariate distribution for any set of marginal cumulative distributions. However, estimating a fully parametric Gaussian copula model for categorical data is challenging and computationally expensive as it requires the evaluation of multivariate normal integrals in high dimensions (Pitt et al., 2006). A semiparametric approach, on the other hand, neglects the information in the data about item and person parameters and is therefore of limited utility in educational measurement applications (Hoff, 2007). The Gaussian copula is usually avoided for categorical data since it requires intensive computation to evaluate the multivariate normal distribution (Braeken et al., 2013).
The MCMC algorithms for the TRT models and the BCSM were programmed in R. The computation time to complete 10,000 MCMC iterations was less than 5 minutes. This appears to be much faster than the computation times reported by Jiao et al. (2013), who reported a computation time of 6 hours to estimate the one-parameter TRT model using WinBugs (version 1.4.3). The MCMC estimation method was not computer intensive for the BCSM, and the efficient parameterization of the BCSM makes it possible to fit the model on large-scale tests with large sample sizes.
The BCSM for testlets improves the flexibility of modeling dependences among items within a testlet. This approach can be further explored by considering more complex designs. For instance, additional dependences in the test data can also occur due to different response modes (e.g., different blocks of items require different types of responding), different test domains, or differential item functioning (Paek & Fukuhara, 2015). Future research will focus on developing BCSMs to simultaneously model various types of clustered items, where testlets represent just one way of clustering the items in a test.
Footnotes
Appendix
To implement the MCMC algorithm, samples need to be drawn from the conditional distributions of the parameters
Consider the BCSM model (Equation [3]), where the augmented data are multivariate normally distributed
where
For the responses to items in testlet
The parameter
The item difficulty parameters can be sampled from a normal distribution given the latent response data. The item difficulty parameters are assumed to be normally distributed with mean
and variance
The ability parameter is sampled from a normal distribution. The latent response data
and variance
The discrimination parameters are also sampled from a normal distribution. The prior distribution of the discrimination parameters is assumed to be normal with mean
and variance
respectively.
Declaration of Conflicting Interests
The author(s) declared no potential conflicts of interest with respect to the research, authorship, and/or publication of this article.
Funding
The author(s) received no financial support for the research, authorship, and/or publication of this article.