
Abstract
Using administrative data of center-based child care providers in North Carolina from 2005 to 2018, we provide the first direct evidence on the effects of competition on provider quality and student outcomes in the context of early care and education, taking advantage of quality measures from the state’s Quality Rating and Improvement System (QRIS). We found that competition was associated with higher quality ratings and a higher probability to achieve a five-star rating—the highest tier in the QRIS. More competition increased providers’ probability to improve their rating and reduced the time to improve. Compared to public schools, private providers were responsive to competition. However, we did not find any effects of competition on district-level student third-grade academic performance.
In the past few decades, early care and education (ECE) has been increasingly used as a policy lever to foster human capital and reduce achievement gaps. Funding for state pre-kindergarten (pre-K) programs has increased from 2.4 billion dollars in 2002 to 8.15 billion dollars in 2018, serving almost one-third of all the children enrolled in center care (Friedman-Krauss et al., 2018). As a result, ECE provision has considerably expanded (Bassok et al., 2014; Bassok, Miller, et al., 2016).
While the increase in supply provides more choices and broader access, it also increases the level of competition in the ECE market and brings about wide variations in quality (Bassok et al., 2014; Bassok, Fitzpatrick, et al., 2016; Bassok, Miller, et al., 2016). Friedman (1955, 1962) argued that the efficiency of economic activities is enhanced by competition in unfettered markets, where providers are free to compete, and consumers can freely make decisions based on their rational choices. In the case of education, competition has long been theorized as a strong market force to improve educational outcomes and has been the main theoretical underpinning for school choice programs. The introduction of competitor schools can serve as an incentive to incumbents to improve quality and productivity because they are forced to compete with the new entrants for students (Friedman, 1962; Hoxby, 2003; MacLeod & Urquiola, 2013; Manski, 1992). Hoxby (2003) argued that competition could eventually raise the productivity of all schools and become “a rising tide that lifted all boats.”
Following this rationale, increased competition in the ECE market, either through the establishment of new ECE programs or through nearby centers implementing quality improvements, would incentivize all providers to improve their quality, thus producing better child outcomes. However, despite the large literature on K–12 school competition (see Urquiola, 2016; Zimmer et al., 2021 for reviews), only one study thus far (i.e., Henry & Gordon, 2006) has examined the effects of competition in the ECE market on student outcomes, and no study has directly examined the relationship between competition, program quality, and student outcomes in the contemporary ECE landscape.
It is critical to understand the influence of competition in this context because, in contrast to the well-established K–12 system, the delivery of high-quality ECE relies on market-based, mixed-delivery systems with myriad, relatively small, third-party providers. In addition to public schools, a wide array of private providers (i.e., for- and non-profits, religious organizations, and community-based organizations) participate in the market and serve a substantial share of the children (Barnett et al., 2009). Because the ECE market is typically more competitive than the K–12 market, ECE providers may be more sensitive to competition than K–12 schools and thus more likely to respond to market-based policies to improve quality and student outcomes.
Using 14 years of administrative data (2005–2018) of all center-based providers in a large and diverse state, North Carolina (NC), this study attempts to estimate the effects of competition on ECE quality and third-grade academic achievement. To identify minimally biased competitive effects, we employ a two-way fixed effects model (school district and year fixed effects) controlling for an extensive set of time-varying provider and district characteristics. District and year fixed effects control for time-invariant differences and common time trends across districts, while time-varying provider (e.g., total enrollment for 3- and 4-year-olds, whether receiving child care subsidy) and district covariates (e.g., population density, female labor force participation, and unemployment rate) further reduce the confounding effects of time-varying characteristics on provider quality. We supplement our main analysis with alternative model specifications as robustness checks (i.e., provider fixed effects and district-specific trends). In doing so, we make three contributions to the literature and policy. First, we extend the literature by providing an up-to-date evaluation of competition in the contemporary ECE context, which provides a useful case study for the theory of competition but is understudied in the current literature. Second, we take advantage of the Quality Rating and Improvement System (QRIS) rating as a direct measure of quality and are able to isolate the association between competition and center quality as a key mechanism to improve student outcomes. Third, this study is one of the first studies to use multiple measures of competition and quality to capture the multidimensionality of competition and quality. In addition to using the competition measures in prior studies (i.e., a modified Herfindahl index, the number of providers per square mile, the number of different types of providers; Egalite & Mills, 2021; Figlio & Hart, 2014), we create a composite (i.e., the mean standardized values of the three above measures) to accommodate the possibility that competition may take effect in the combination of all the possible channels (Zimmer et al., 2021). The different measures can also cross-validate the robustness of each individual measure. The results in this study should be considered correlational rather than causal because our empirical strategy does not eliminate all potential confounders. Below, we use correlational language when describing the relationship between competition, quality, and student outcomes to be accurate. However, we acknowledge that we attempt to test causal hypotheses that underpin the design of this study and provide a careful discussion of potential caveats when interpreting the results in the Limitations section.
Our research questions are:
Is competition associated with the quality of child care centers in the school district?
Do the relationships between competition and quality differ across public schools and private providers?
Does competition predict students’ third-grade Reading Language Arts (RLA) and math achievements, and do the relationships differ by student racial/ethnic groups and socioeconomic status (SES)?
Background
Effects of Competition on Quality and Student Outcomes
There is a large literature on the effects of competition on student outcomes in K–12 schools. This literature focuses on the competitive effects from private schools (including Catholic schools and voucher programs) to public schools (e.g., Belfield & Levin, 2002; Chakrabarti, 2008, 2013a, 2013b; Dee, 1998; Egalite & Mills, 2021; Figlio & Hart, 2014; Figlio & Rouse, 2006; Hoxby, 1994, 2003; Sander, 1999; West & Woessmann, 2010). Most studies found small to moderate effects on student test scores (e.g., Chakrabarti, 2013a; Figlio & Hart, 2014; Hoxby, 2003; Rouse et al., 2013), while others found null effects (e.g., Chakrabarti, 2008). There is a broader international literature documenting the effects of competition from large-scale voucher programs in countries such as Chile and Sweden (e.g., Böhlmark & Lindahl, 2015; Hsieh & Urquiola, 2006). These international studies found similarly mixed effects of private school competition, although most studies did identify positive impacts (Urquiola, 2016).
Another strand of this literature examines the competitive effects within public schools (i.e., competition from charter schools to traditional public schools). The results from this literature are also mixed. While some studies found positive effects of competition from charter schools on public school students’ performance (Booker et al., 2008; Cordes, 2018; Hoxby, 2000, 2003; Sass, 2006; Winters, 2012), many others revealed null and negative effects (Bettinger, 2005; Bifulco & Ladd, 2006; Zimmer & Buddin, 2009; Zimmer et al., 2009).
However, despite this sizable literature, it is unclear to what extent the estimated effects are attributable to improvements in school quality (Urquiola, 2016). In the theory of competition, researchers are often most interested in the “incentivizing effects” of competition (i.e., schools react to competition by improving their quality, which leads to improvements in student outcomes; Chubb & Moe, 1988, 1990; Friedman, 1955, 1962; Manski, 1992). However, when using student outcomes as a proxy for school quality, competition may also affect students by disproportionately drawing students with higher or lower abilities from one type of school to another (e.g., the cream-skimming effect; Altonji et al., 2015). Or, students may perform differently by having different groups of peers (Epple & Romano, 1998; Urquiola, 2016). As a result, most of the studies using student outcomes estimated the aggregate effects of competition (i.e., the effects of competition on school quality combined with effects of compositional changes and peer effects; Urquiola, 2016).
Overall, the current K–12 literature does not provide a clear, conclusive answer to whether competition substantially and reliably improves student outcomes or school quality (Epple et al., 2017; Urquiola, 2016; Zimmer et al., 2021). After reviewing this literature, Urquiola (2016) and Zimmer et al. (2021) suggested that choice schools need to have a substantial market share for the effects of competition to occur, which is not the case for most school choice programs in the United States.
Competition in Early Childhood Education
Early childhood education provides a useful case study for the effects of competition. Unlike the public schools, and because of the U.S.’s policy heritage, ECE provision and funding has always been market based (Karch, 2013; Rose, 2010). Small third-party providers constitute a large market share, with public schools increasingly participating in the market in recent years. There are myriad government interventions in ECE; for example, child care subsidies for low-income families, the federal Head Start program providing grants to communities to offer direct services, and state pre-kindergarten (pre-K) programs that subsidize or cover the costs of care primarily for 4-year-old children. However, the majority of ECE costs are borne by families of young children themselves, many of which are at the lower end of their lifelong earning potential and thus are price sensitive (Hofferth & Wissoker, 1992). As with many market-based family services, parents find and select an ECE provider based on convenience, affordability, cultural preferences, and often through “word-of-mouth” referrals (Chaudry et al., 2011; Kim & Fram, 2009; Loeb et al., 2004). The forces of competition imposed on incumbent providers, either from increased competitor quality or from new providers joining the market, would increase the counterfactual services available, thus motivating firms to edge out competitors with quality improvements. In this context, the theory of competition would be quite salient for the quality and cost of child care.
For example, in NC, 65% of the providers are privately owned and operated. The share of public school providers rose from 6% in 2005 to 21% in 2018 (author’s calculation based on NC administrative data in 2005 and 2018). The federal Head Start program and local religious organizations constitute the other 14% of the supply. Most pre-K programs in other states are similar in terms of the overall provider composition (Friedman-Krauss et al., 2021). Moreover, parents can send their 4-year-olds to any child care centers of their choice. Families typically do not need to reside in a certain school district to apply for a child care slot in the private centers or public schools in that district. The ECE market is, therefore, more competitive than the K–12 market, and providers may be more likely to respond to competition. In the case of ECE, understanding the effects of competition on all “schools” would be a more policy-relevant question given that the delivery of high-quality care and education relies on mixed-delivery, market-based systems.
However, the effects of competition are barely understood in this context. To the best of our knowledge, Henry and Gordon (2006) are the only scholars who have examined the effects of competition on student outcomes in ECE. Using data from a sample of Georgia’s state pre-K participants in the 1996 to 1997 school year, the authors found modest positive effects of pre-K competition on third-grade math and reading test scores (Effect Size = 0.14) but null effects on retention and teacher-rated school readiness. The authors used a single measure of competition at the county level, the Herfindahl Index, and both Ordinary Least Squares and Instrumental Variables to identify the effects. Similar to most K–12 studies, Henry and Gordon (2006) measured the aggregate effects of competition and did not examine the effects of competition specifically on quality.
Furthermore, the ECE landscape has changed drastically since Henry and Gordon (2006)’s study, with 55% of the 3- and 4-year-olds currently receiving formal center care and 90% of the states having established their pre-K programs (Chaudry & Datta, 2017). This drastic increase in the supply of preschool funding and the low relative cost of caring for preschool-aged children relative to infants and toddlers have further increased the competitive forces on providers to secure preschool enrollments, given the expanded choice set for families in selecting ECE providers. 1 This is important because child care providers, like public schools, do not get reimbursed and lose per-pupil expenditures for publicly subsidized ECE slots (e.g., NC Pre-K), which go unfilled. In turn, providers compete for both private-pay and subsidy-eligible families with preschool-aged children to select their site as their choice for the state-funded care.
Additionally, states have increasingly used the QRISs to improve child care quality. The theory behind the QRISs is that by providing clear information about quality to the market, parents will be more likely to choose child care based on quality, and providers will be incentivized to improve quality to build a reputation and attract customers (Bassok et al., 2019). For new and existing providers, QRIS ratings communicate the range of quality currently available in their market and may further incentivize them to achieve an equivalent or higher rating than incumbents. Therefore, understanding whether providers are responsive to market competition bears significance for deciphering the conditions and theories that support the implementation of QRISs. New evidence is needed to inform market-based policies that seek to improve child care quality and student performance.
The ECE Context in NC
NC is recognized for their high-quality NC Pre-K program serving at-risk 4-year-old children in the year prior to their kindergarten entry (previously known as More at Four). The program was initiated in selected counties in 2001 and became available in all counties by 2004, which has greatly expanded the child care supply in the state. After that, the program continued to expand but at a lower scale. NC Pre-K is administered by the Department of Health and Human Services and funded through state general appropriations, the North Carolina Education Lottery, federal funds, and some local contributions. Four-year-old children are eligible to receive pre-K funding—essentially in the form of a voucher that covers the cost of a full school day—if their family income at or below 75% of the State Median Income. Children can also be eligible based on other designated risk factors such as an identified disability or developmental delay, English learner status, or a parent serving in the military (Friedman-Krauss et al., 2021). Eligible children can apply to all NC Pre-K sites, regardless of their residence location. The system is fully funded and the state serves approximately 30% of eligible 4-year-olds.
NC Pre-K classrooms are offered statewide in a variety of settings including Head Start programs, private non- and for-profit childcare centers, and public schools. This mixed-delivery design of the program was strategic, in funding existing ECE providers to improve quality and serve more low-income children. In the fiscal year 2019 to 2020, the NC Pre-K served 31,059 children in 2,163 NC Pre-K classrooms, reaching 51% of eligible children and 25% of all 4-year-olds across the state (Friedman-Krauss et al., 2021; North Carolina Department of Health and Human Services [NC DHHS], 2020). Forty-eight percent of the children are served through public schools, 38% through private centers, and 14% through Head Start. This provision meant that state funding supported eligible “slots” rather than classrooms, that many state-funded children attended the same pre-K classrooms as non-NC Pre-K-funded children, paid for by the families, and funded children went on to attend the same elementary-school classrooms as nonfunded children. Spending per child enrolled in state pre-K from local, state, federal, and Temporary Assistance for Needy Families (TANF) contributions totaled to $10,122. NC ranked 26th among all the states in terms of access for 4-year-olds and 6th in terms of all reported spending (NC DHHS, 2020). 2
NC Pre-K sites are expected to meet a variety of program standards. For example, there must be a 1:9 staff-child ratio for 4-year-olds and a maximum class size of 18 children. All lead teachers must hold a bachelor’s degree and meet additional licensing requirements by the State Board of Education. Minimum hours of operation are 6.5 hr per day for 10 months (36 weeks) a year. Additional standards are enforced around assistant teachers, curriculum, screening and assessment, and provision of other program services (NC DHHS, 2020). The NC Pre-K meets 8 of the 10 quality benchmark standards defined by the National Institute of Early Education Research (Friedman-Krauss et al., 2021).
The Star Rated License (SRL) system is NC’s statewide QRIS. The SRL system started in 1999 as a pilot program and launched in 2000 with the goal to (a) raise the quality of child care, (b) create a licensing system that differentiated the level of quality among providers and incentivized volunteer providers to improve quality, and (c) inform parents better about the quality of care. The quality rating ranges from one to five stars, with higher star ratings indicating better quality. Providers with a higher quality rating can receive financial rewards such as reimbursement and subsidies (Zellman & Perlman, 2008). NC adopts the SRL system for center and family child care providers but uses different quality standards. For the purpose of this study, we focus on the quality standards for center-based child care providers. We provide details about the specific components and quality standards used to assign QRIS ratings in the Outcome Variables section below.
A crucial feature of the NC QRIS is that although participation is voluntary, all nonreligious licensed programs automatically receive a one-star rating for meeting the minimum licensing requirements, resulting in a high participation rate of 88% across the years in this study. Religious providers are not required to acquire a star rating but have the option to participate (North Carolina Division of Child Development and Early Education [NCDCDEE], n.d.). Among the 6,810 (12%) center-based providers who did not have a QRIS rating, 68% were religious organizations, and the remaining 32% were private providers with temporary licenses. This high participation rate allows us to comprehensively capture the quality of most providers in a market area.
Method
Data
This study combines data from multiple sources. The primary data source is the administrative data of all providers in NC in each September from 2005 to 2018. The data are publicly available and updated monthly on the NCDCDEE website. The data include information on providers’ licensing, enrollment (by age), program type (e.g., public school, Head Start, community organization), quality rating, capacity, and number of employees. Student third-grade achievement data come from the Stanford Education Data Archive (SEDA) from 2011 to 2018. The SEDA data constructed comparable student achievement data using the EDFacts data system housed by the U.S. Department of Education. The data were constructed in a series of nine steps: (a) creating the crosswalk; (b) data cleaning; (c) estimating and linking cutscores; (d) selecting data for mean estimation; (e) estimating means; (f) creating additional reporting scales; (g) calculating achievement gaps; (h) pooling mean and gap estimates; and (i) suppressing data for release (Fahle et al., 2021).
We use two sets of school district characteristics as covariates. The first set is the control variables in models predicting quality outcomes. The second set is used to analyze student outcomes as additional control variables in the years students reached third grade. The first set of district characteristics are from the American Community Survey Education Demographic and Geographic Estimates (ACS-ED) and the Common Core of Data (CCD) from 2009 to 2018. The ACS-ED is an annual, nationwide survey that includes demographic and socioeconomic characteristics for states, counties, and school districts available from 2009 onward. The annual data are based on the five-year estimates collected in the ACS and thus are naturally imperfect with regard to measuring covariates at any given year. However, these are the best available data and have been widely used in policy studies to track yearly changes in geographic characteristics (Bedard & Dhuey, 2012; Dhuey et al., 2019). Following Dhuey et al. (2019), we interpolate the control variables in years 2005 to 2008. The CCD is an annual survey of all public schools in the United States and includes descriptive information on schools and districts from 1990. The second set of district control variables comes directly from the SEDA from 2011 to 2018, which also uses ACS-ED and CCD.
Because we are primarily interested in the competitive dynamics in center- and school-based settings, we first restrict the sample to center- and school-based providers across the public and private sectors (N = 67,523). Our sample includes existing and new providers from 2005 to 2018. We then exclude providers who only serve infants and toddlers (N = 995) and school-aged children (5–12-year-olds; N = 9,839). 3 Because the quality of non-QRIS participants could not be reliably estimated, we also exclude providers with a temporary license (N = 8,165) and other types of providers who did not have a QRIS rating (primarily religious organizations) (N = 528) in the analysis but include them in the calculation of the competition measures. We exclude non-QRIS participants because we cannot reliably determine the quality of these providers. Web searches of randomly sampled nonrated providers and review of their websites indicated that their quality tends to vary, but not systematically so (i.e., based on their curricula, size, teachers’ education, etc.).
Another concern is that the providers with and without a quality rating may select differentially into school districts. We test this possibility by regressing whether a provider had a rating on the provider characteristics and find no clear evidence of selection into QRIS by the observed provider and school district characteristics (Supplemental Appendix A; i.e., none of the community characteristics predicted participation with either nonsignificant or close-to-zero coefficients). We have also included these providers and assigned them a quality rating of 0 in a robustness check and found similar results. See details of the robustness checks in the Results section. Our final analytic sample consists of 47,996 observations of center-based providers who had a QRIS rating in NC from 2005 to 2018.
Measures
Competition
There is no consensus in the literature regarding how to define the market when measuring competition. Markets defined in the prior literature include a 5-mile radius (Figlio & Hart, 2014), school districts (Hoxby, 2000), counties (Henry & Gordon, 2006), and a 30-mile radius (Bassok, 2012). We define the market at the school district level but have also used county as the level of the local market, and found similar results. This is likely due to the substantial overlap between county and school district boundaries in NC.
We use four main measures of competition to capture different dimensions, following prior literature (Figlio & Hart, 2014; Henry & Gordon, 2006; Hoxby, 2000). Different measures of competition serve as a robustness check for each other and capture the multidimensionality of competition (Figlio & Hart, 2014; Zimmer et al., 2021). Pairwise correlations of each of our competition measures range widely, from .22 to .90, suggesting that the measures are capturing different components of the market (Supplemental Appendix B).
Competition Index
Adapting the indices used in Henry and Gordon (2006) and Hoxby (2000), we create a district-level competition index based on the Herfindahl index. The Herfindahl index is a widely used measure of competition in the economics literature (Belfield & Levin, 2002). We calculate the Herfindahl index using each provider i’s market share (i.e., licensed capacity for 3- and 4-year-old children based on the capacity of the entire district), squared and summed across all the providers in the school district d. 4 The formula is as follows:


The competition index is derived by deducting the Herfindahl index of each school district from 1 (
Density
The density measure is the number of providers in the school district per square mile.
Diversity
The diversity measure is the number of different types of providers in the school district. There are four types of providers: public schools, for- and non-profit private providers, Head Start, and religious organizations. Research suggests that different types of providers tend to have different goals, emphasis, relative strengths, and varying quality (Bassok, Fitzpatrick, et al., 2016). The diversity measure captures the level of competition by the variety of services providers a school district can offer to meet children and families’ diverse needs.
Composition Composite Score
We create a competition composite score using the standardized competition index, diversity, and density measures. The composite score captures the multidimensionality of competition, reduces the risk of multiple hypothesis testing, and increases the power of the analyses. We follow Kling et al. (2007) and Deming (2009) and take the mean of the standardized values of the three above measures to obtain the competition composite, where each of the component measures is equally weighted.
Alternative Competition Measures for Robustness
Because competition may take various forms, we additionally use three competition measures to test the robustness of our four main measures. First, we compute a fractionalization index of provider type (i.e., the probability that two randomly drawn providers have the same type) and use it to predict our quality measures. The provider type fractionalization index is an alternative measure for diversity and uses the share of each type of providers (i.e., public schools, for- and non-profit private providers, Head Start, and religious organizations) to show the concentration of different types of providers in a school district. It is calculated in a similar manner with the Herfindahl index (Montalvo & Reynal-Querol, 2014).
Also, because averaging across measures can mask important power in some competition metrics versus others, we also test two additional versions of the competition composite score that employ principal component analyses (PCA). Specifically, we compute a PCA-weighted composite score using the competition index, density, and diversity; and another PCA-weighted composite score using the competition index, density, and the fractionalization index. The PCA-weighted measures assign weights to each of the component measures based on the variance explained. We present results from these measures in the Robustness section below.
Outcome Variables
QRIS Rating
The QRIS rating is the star rating of each provider. The ratings range from 1 to 5 at one-point intervals, with higher star ratings indicating better quality. NC uses the SRL system to assess and assign QRIS ratings to providers. The star level is awarded based on a 15-point rating scale (one star = 1–3 points, two stars = 4–6 points, three stars = 7–9 points, four stars = 10–12 points, and five stars = 13–15 points) (NCDCDEE, n.d.). Programs are rated using two major standards, “program standards” and “staff education standards” (seven points each), plus a quality point for meeting at least one of the additional quality standards. The “staff education standards” score is determined by the education and experience of administrators, teachers, and other staff. The “program standards” score is determined by group size, health and safety, curriculum, classroom environment, and student-teacher interactions. This score is heavily impacted by the score on the Environmental Rating Scales (ERS), which is a widely used classroom observation tool to measure classroom structural and process quality (NCDCDEE, n.d.). Once evaluated, ratings are valid for 3 years and can be reassessed if requested, or there is a reason to believe that there is a change in quality level (Zellman & Perlman, 2008). Providers can earn an additional quality point from meeting higher educational standards such as a smaller group size or higher teacher education than the minimum requirements. (Detailed component scores of ratings were not publicly available.)
Whether a Five-Star Provider
Whether a five-star provider is a dummy variable indicating whether the provider has a five-star rating in a given year—the highest level of quality in the NC QRIS.
Number of Years to Improve QRIS Rating
Among the providers who improved their rating over the years, we calculate the number of years they took to improve their rating. Nearly 70% of all the unique providers in our sample increased their QRIS rating. 5
Student Third-Grade Outcomes
We use the average results of the state assessments of third-grade students’ RLA and math achievements at the school district level, provided directly in the SEDA. We also use the average RLA and math achievements by student race/ethnicity (i.e., Black, Hispanic, White) and SES (i.e., whether economically disadvantaged or not) to explore the heterogeneous effects. 6
Covariates
We control for an extensive set of time-varying school district and provider characteristics that are highly likely to affect the ECE supply and providers’ quality.
District Characteristics
District characteristics include population per square mile, female labor force participation rate, unemployment rate, average travel time to work, percent of households receiving Supplemental Nutrition Assistance Program (SNAP), per capita income (in 2018 dollars), percent of the population who are Black, percent of the population who are Hispanic, percent of the population with a bachelor’s degree or higher, median house value, K–12 per-pupil expenditure, and K–12 student-teacher ratio.
Provider Characteristics
We also control for provider characteristics, including the total enrollment of 3- and 4-year-olds, whether receiving child care subsidy reimbursements, and number of employees. For the analyses of student outcomes, we additionally control for district characteristics in the years when students reach third grade, which include urbanicity, percent of Hispanic students in third grade, percent of Black students in third grade, percent of White students in third grade, percent of students receiving free and reduced-priced lunch, percent of economically disadvantaged students in the grade, percent of English Language Learners (ELLs) in the district, percent of special education students in the district, number of students in third grade, and an SES composite. 7
Summary Statistics
Table 1 presents the descriptive statistics of the competition and quality measures, along with provider and school district characteristics in 2005 and 2018. The level of competition in NC was generally high and increased slightly from 2005 to 2018. The competition index is close to one, suggesting a highly competitive market. On average, each school district had one provider per five square miles (0.21 per square) and almost four types of providers in the districts. The average quality of providers also improved from 2005 to 2018. For example, the average QRIS rating increased from 3.43 to 4.28, while the percentage of providers with a five-star rating grew from 16% in 2005 to 54% in 2018. More than half of the providers in the 2005 and 2018 sample improved their QRIS rating from 2005 to 2018; it took them an average of almost 3 years to improve. Notably, the percentage of public school providers increased considerably from 6% in 2005 to 21% in 2018. Descriptive statistics of QRIS ratings by provider type shown in Supplemental Appendix D reveal that public school providers have very high ratings, with greater than 80% of provider-year observations at five-stars. Private providers are more evenly distributed across a three-, four-, or five-star rating.
Descriptive Statistics of Competition, Provider Quality, and School District Characteristics in 2005 and 2018
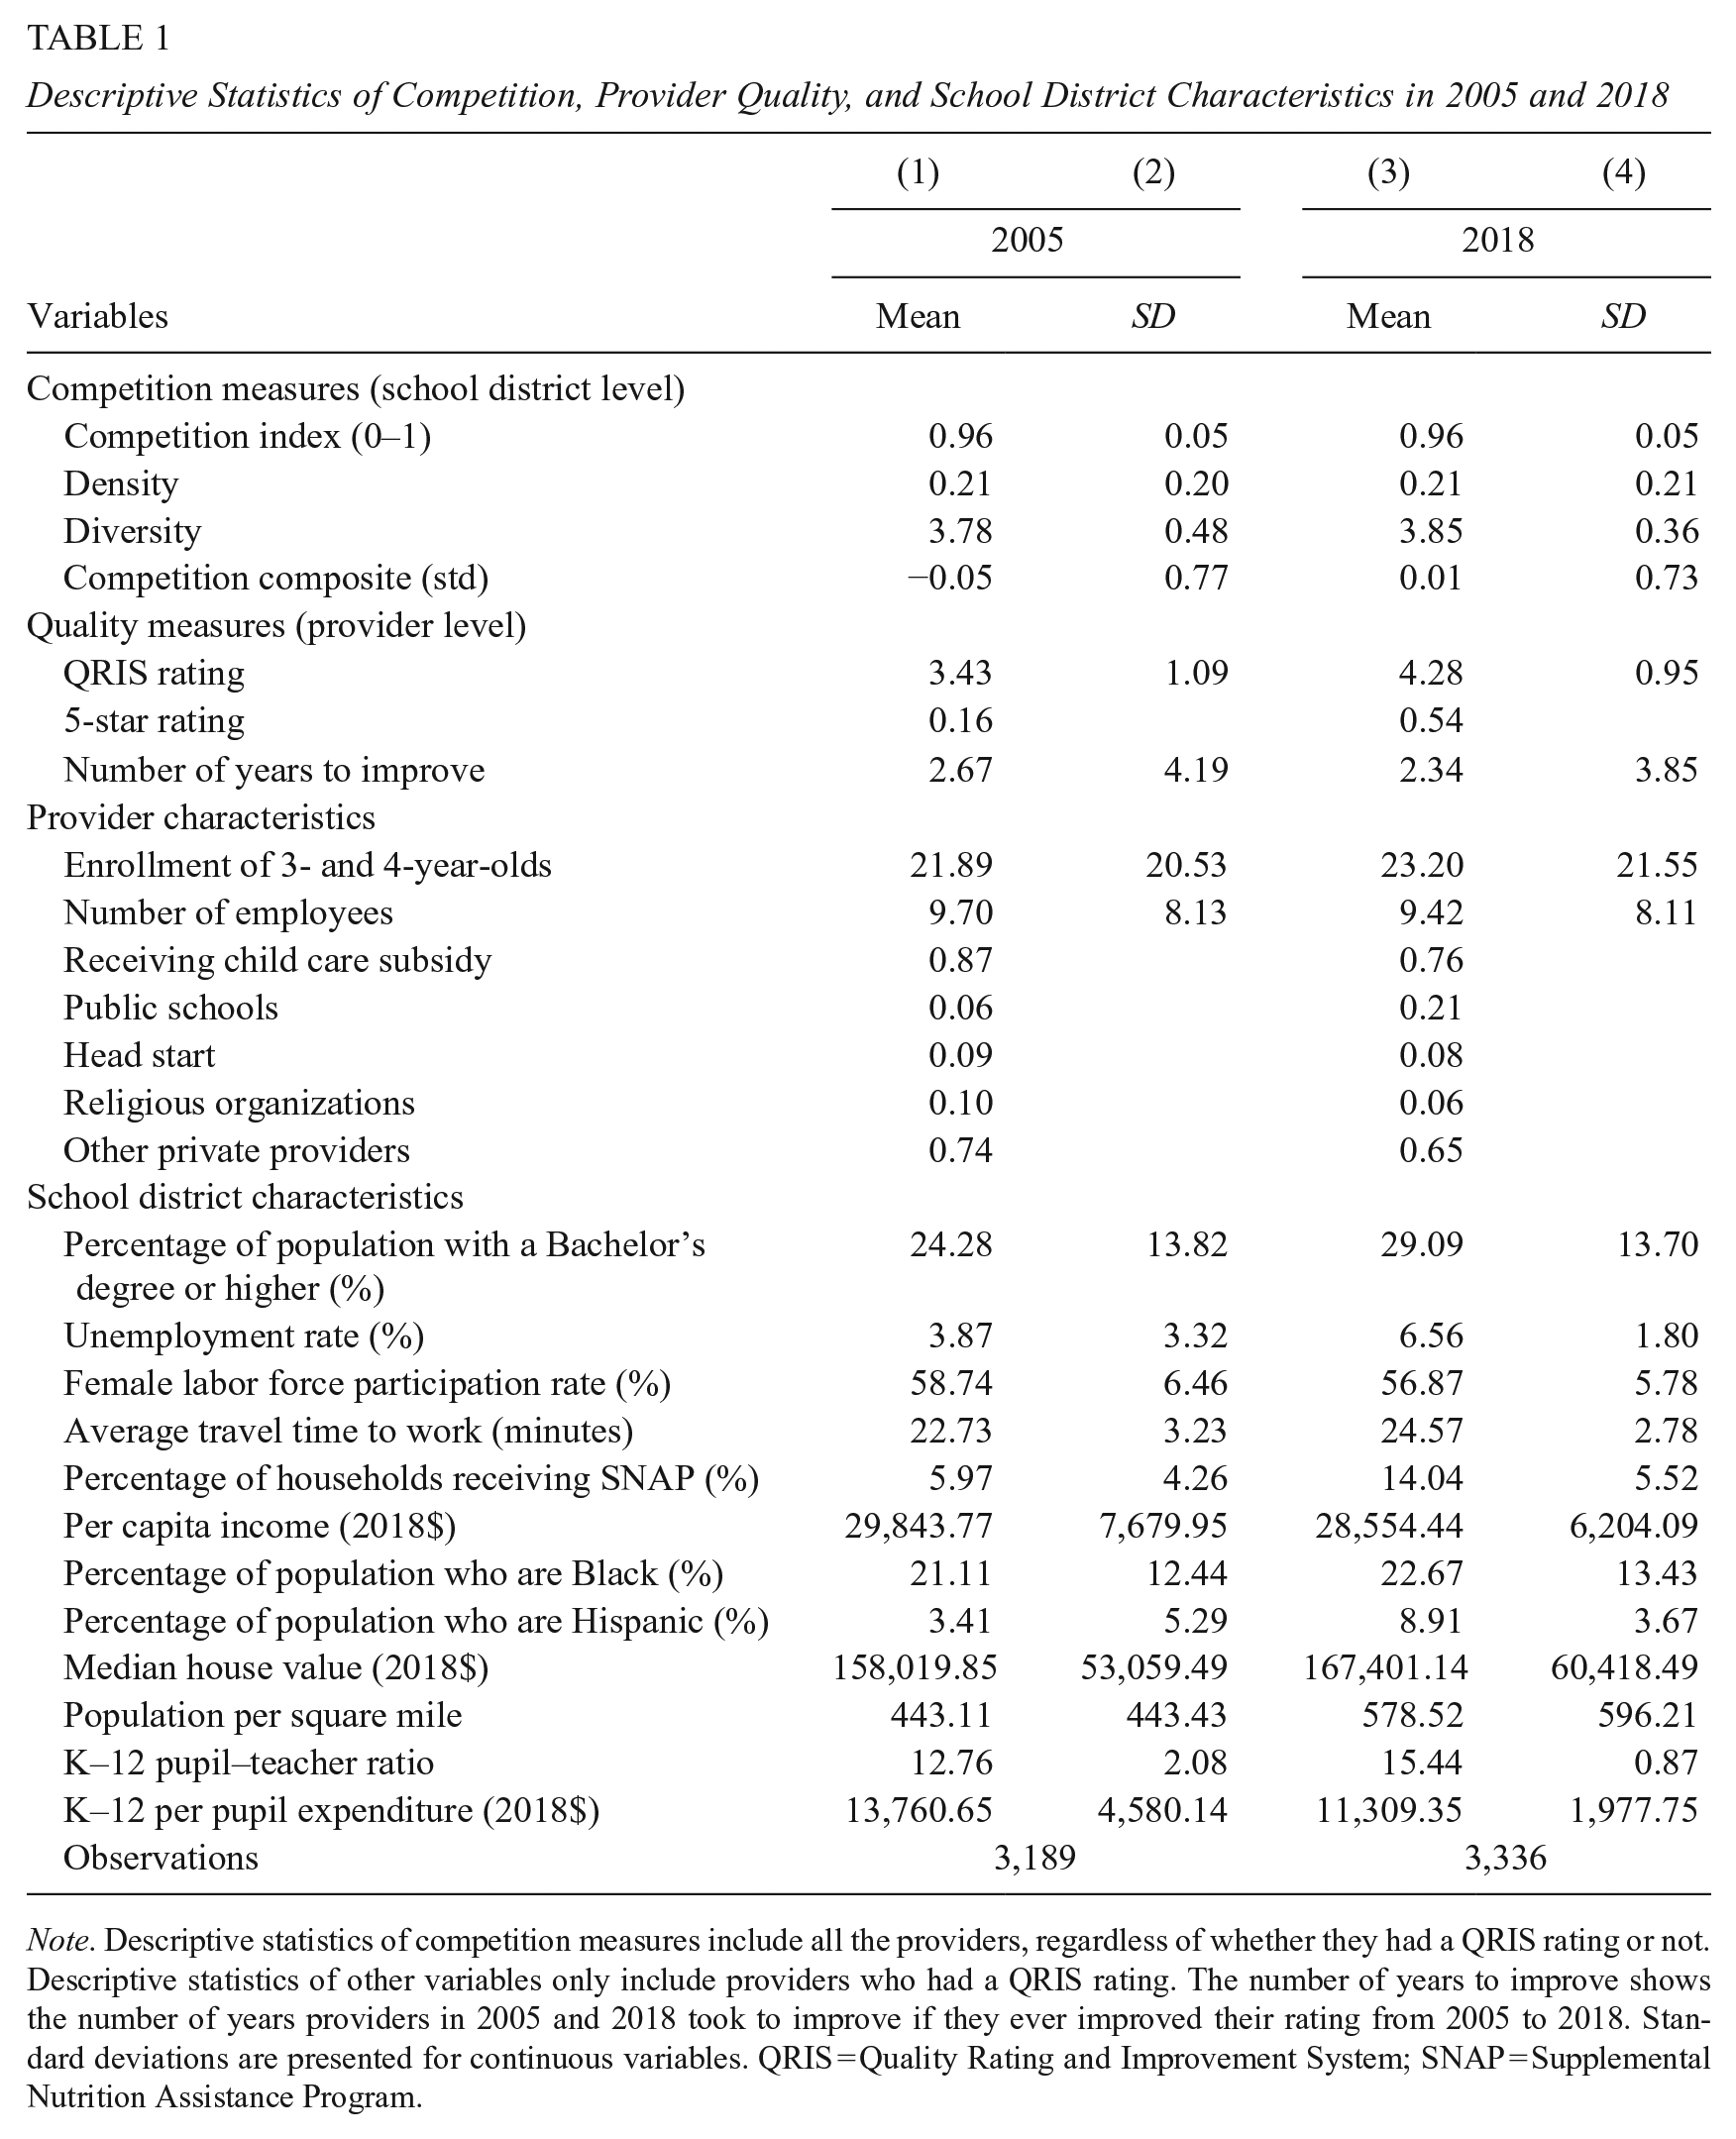
Note. Descriptive statistics of competition measures include all the providers, regardless of whether they had a QRIS rating or not. Descriptive statistics of other variables only include providers who had a QRIS rating. The number of years to improve shows the number of years providers in 2005 and 2018 took to improve if they ever improved their rating from 2005 to 2018. Standard deviations are presented for continuous variables. QRIS = Quality Rating and Improvement System; SNAP = Supplemental Nutrition Assistance Program.
Figure 1 presents the variation of competition measures at the school district and year level. The competition index, density, and competition composite have substantial variation across school districts and years, except for the diversity measure, which is discrete with only four possible values. We still include it in the analyses to capture the different dimensions of competition. Figure 2 further displays the distribution of competition and provider quality measures from 2005 to 2018. Overall, there was an increasing trend in provider quality, while the levels of competition fluctuated across the years, providing sufficient variation for us to detect the effects of competition.
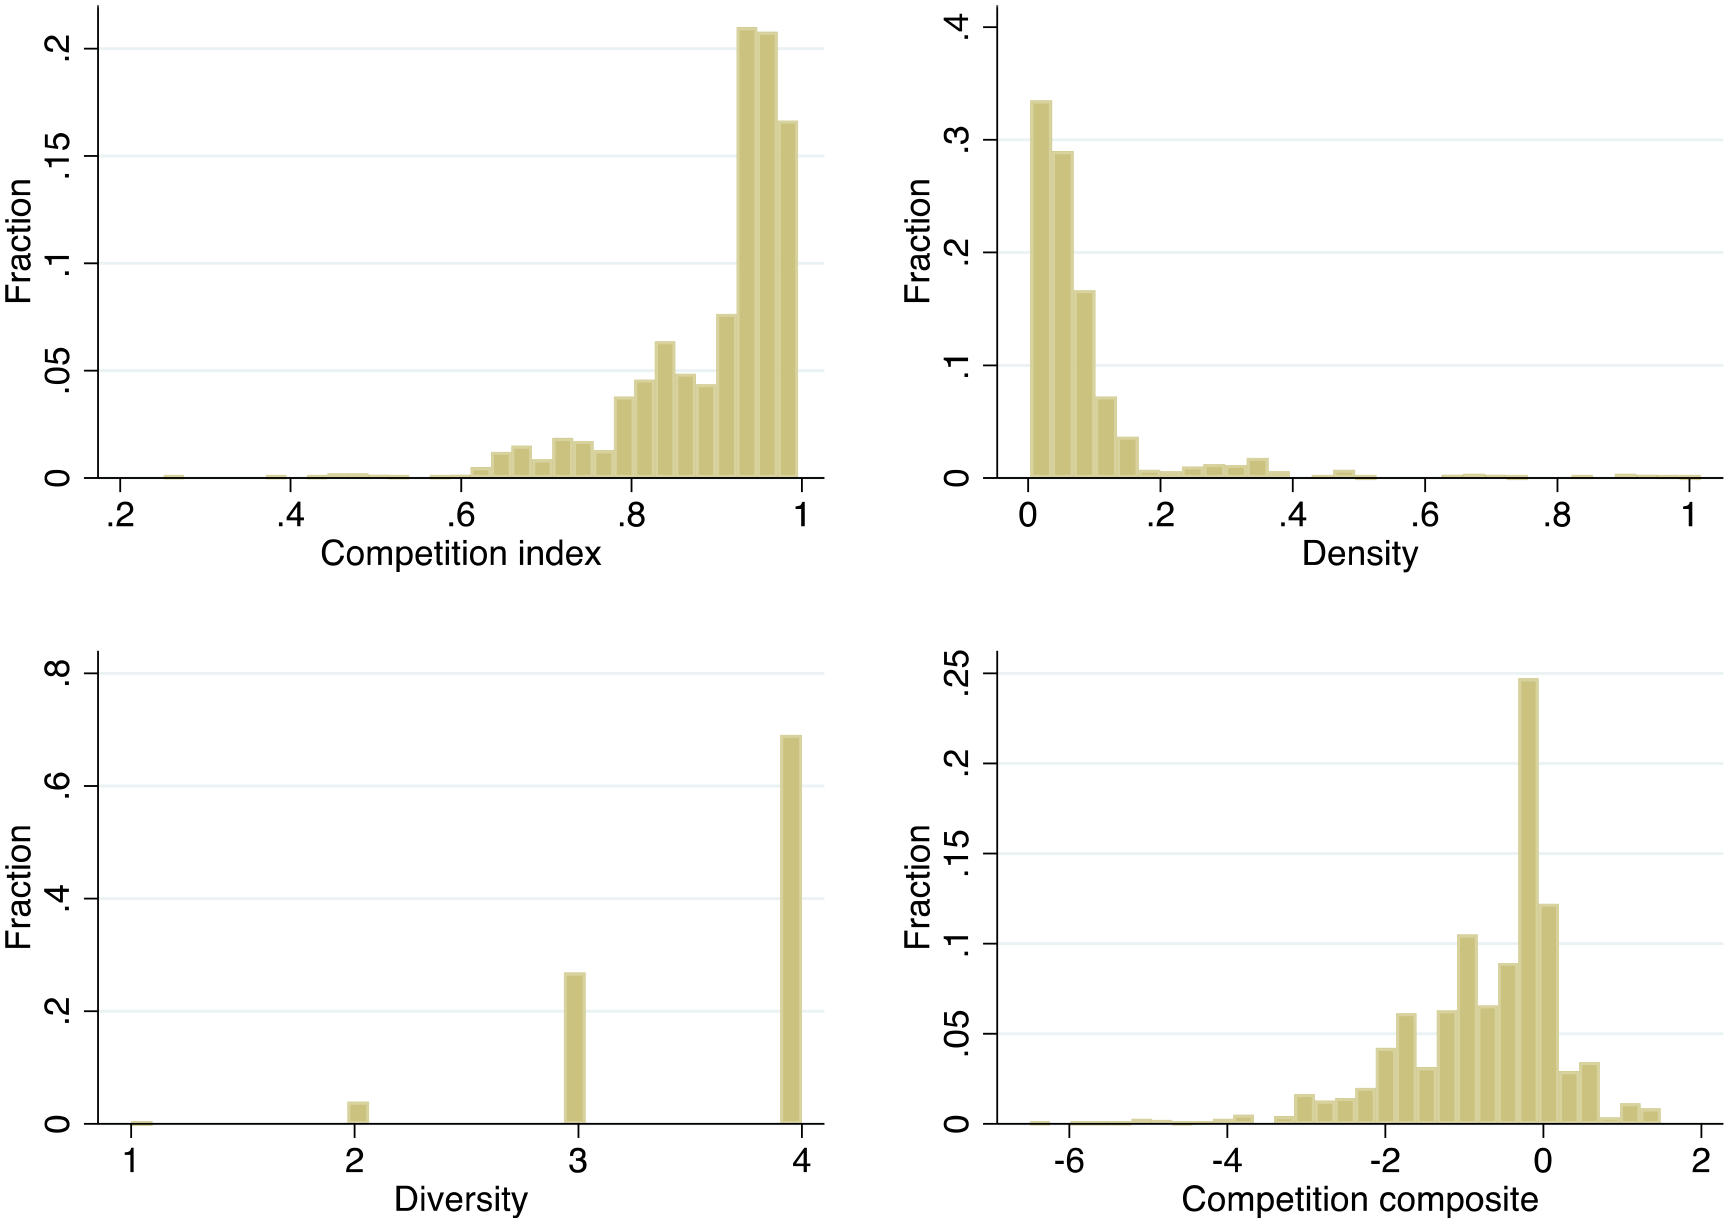
Variation of competition measures (school district and year level).
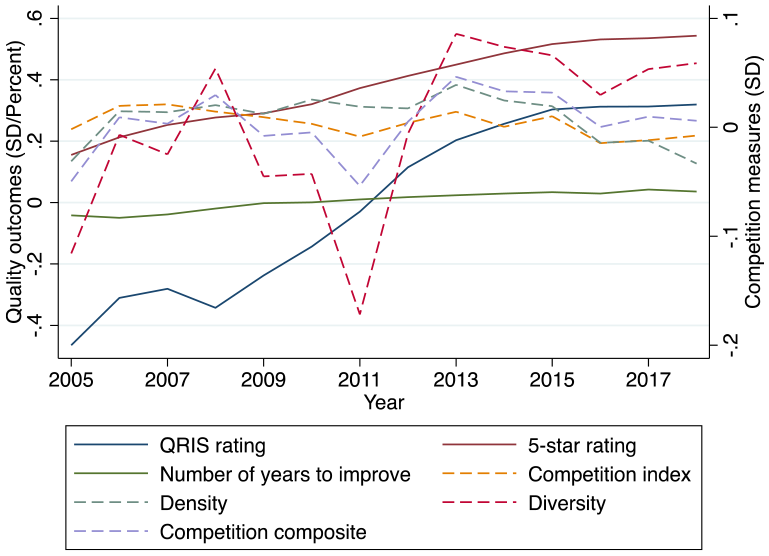
Distribution of competition and quality measures, 2005 to 2018.
Table 2 displays the descriptive statistics for the lagged student third-grade outcomes and related school district characteristics in 2011 and 2018, when most students in the school district reached the end of third grade after attending preschool at age 3 in the years of 2005 to 2012. The average third-grade RLA and math scores are 0.01 and 0.1 in 2005 and 0.07 and 0.01 in 2018, respectively. Black and Hispanic students performed much lower than White students. Economically disadvantaged students also lagged behind noneconomically disadvantaged students.
Descriptive Statistics of Third-Grade Student Outcomes and School District Characteristics in 2011 and 2018
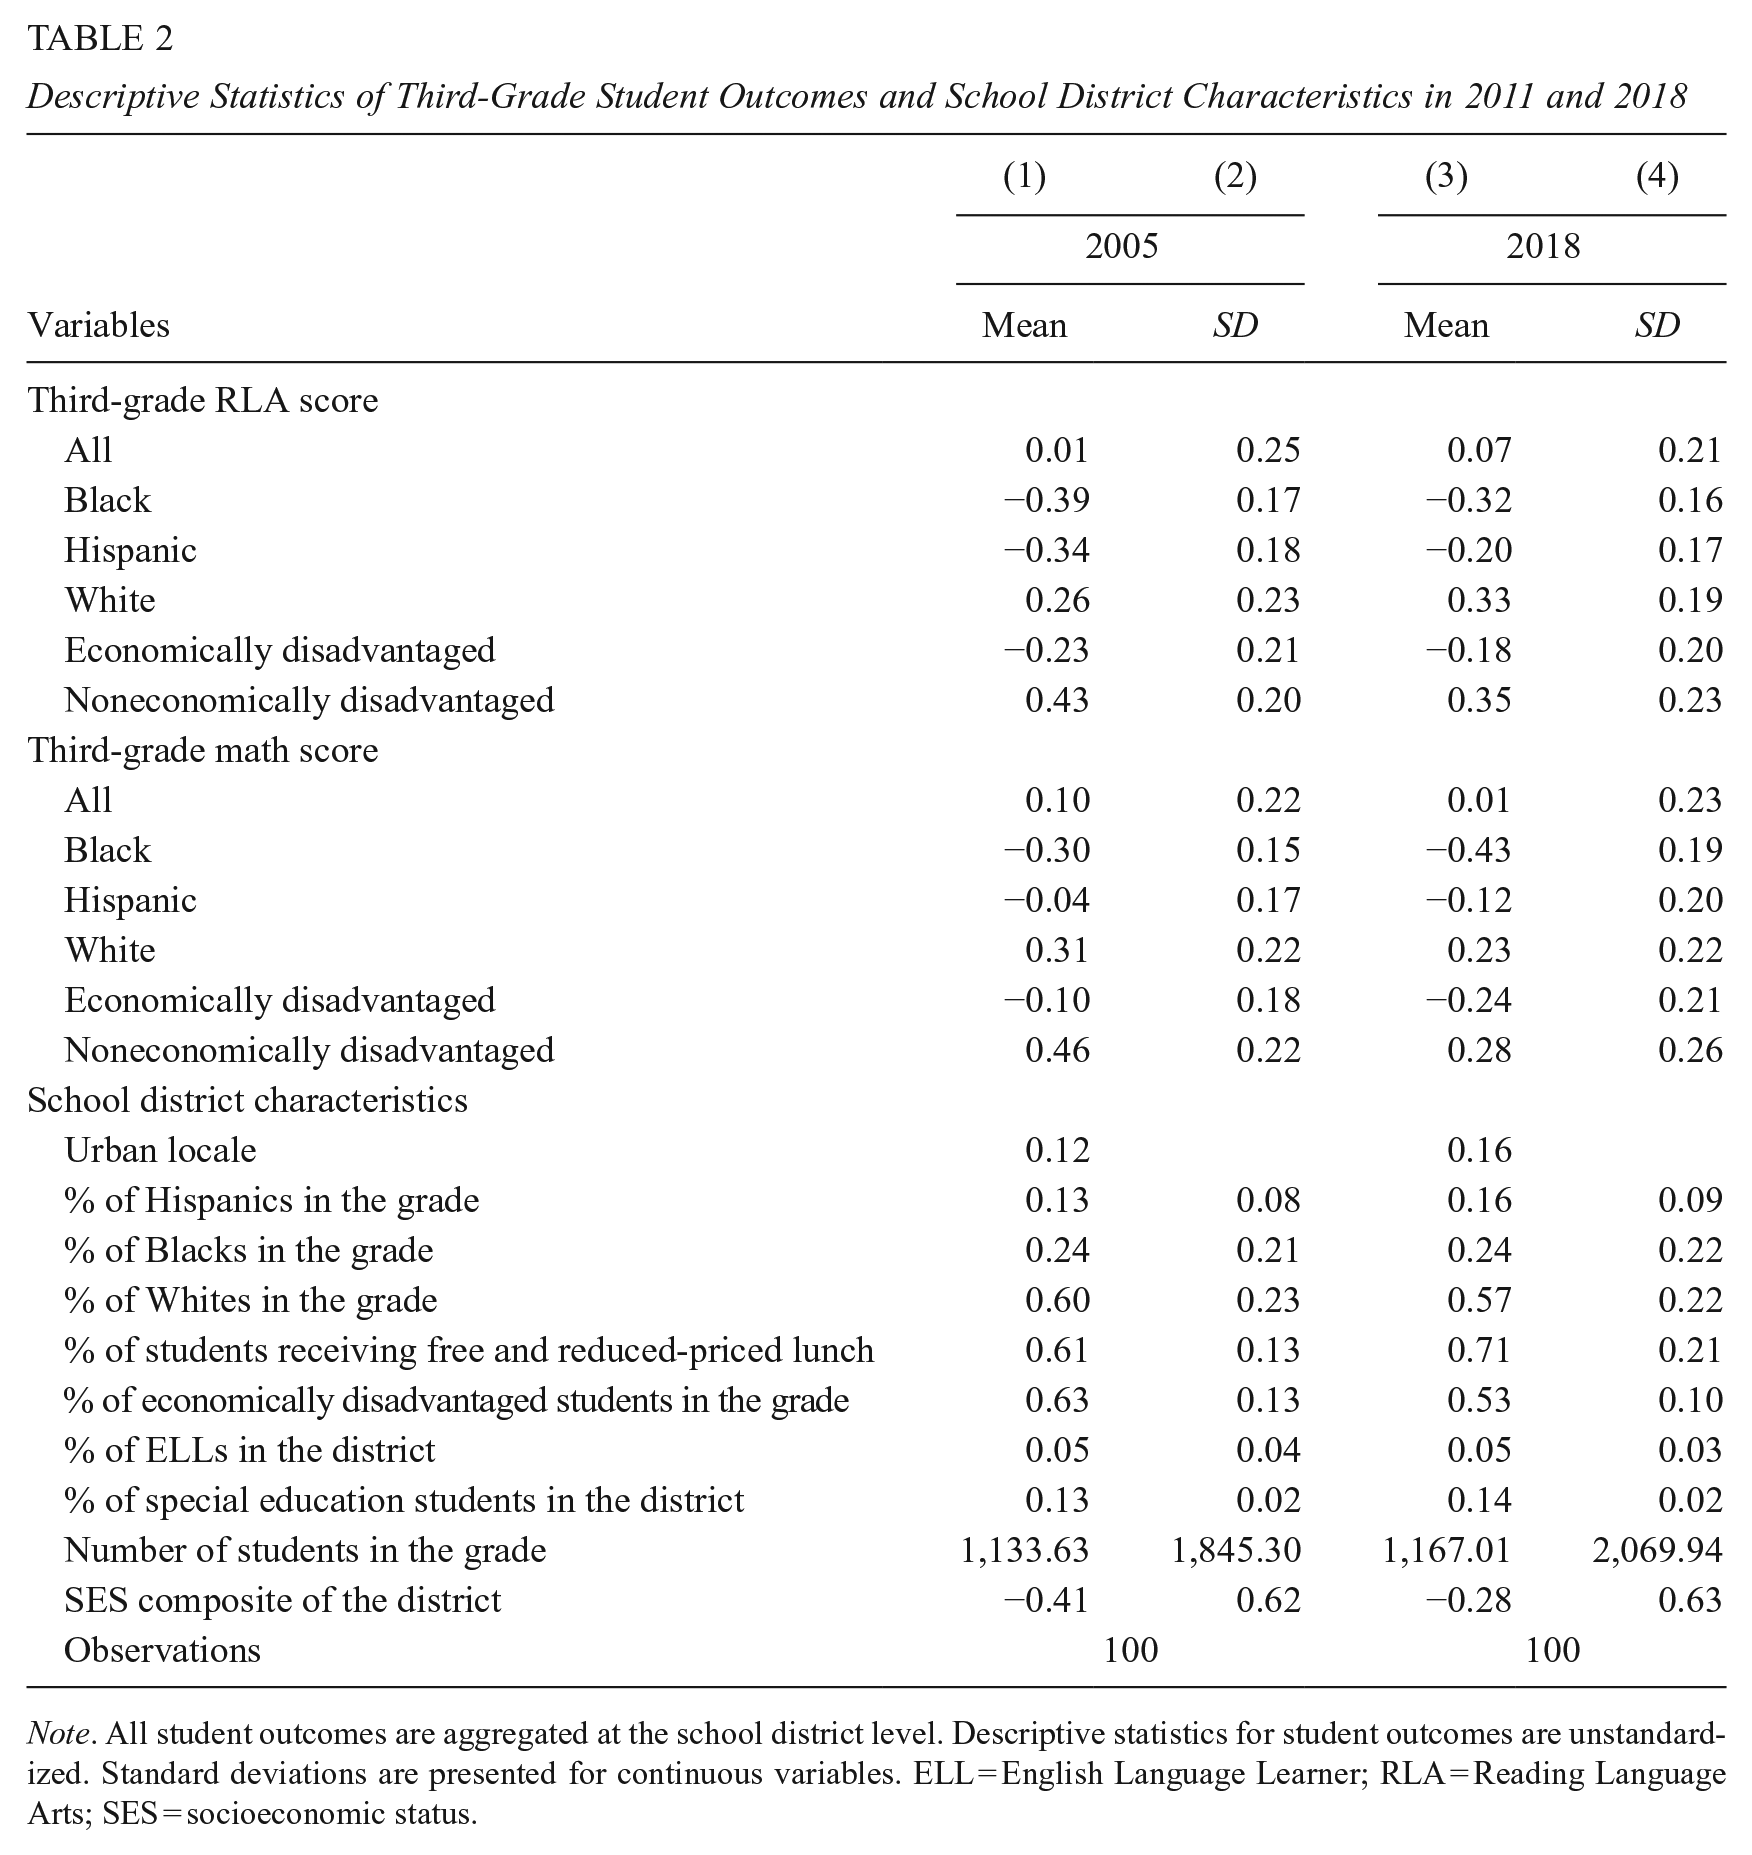
Note. All student outcomes are aggregated at the school district level. Descriptive statistics for student outcomes are unstandardized. Standard deviations are presented for continuous variables. ELL = English Language Learner; RLA = Reading Language Arts; SES = socioeconomic status.
Empirical Strategy
The level of competition in a school district is endogenous to other school district characteristics that simultaneously influence quality and student outcomes. For example, more providers may open in school districts with generous local funding, which also contributes to the quality and student achievement. Also, private providers may be more likely to open in lower performing school districts where the public school option is less satisfactory and parents are more likely to opt into private options (Urquiola, 2016). Another potential confounder is the concentration of highly motivated parents in certain districts. These parents could raise the demand for high-quality child care and are willing to pay higher prices, attracting more providers to the market and leading to higher competition and quality. Highly motivated parents might also invest more in their child’s education, leading to better student outcomes.
To address the endogeneity of competition, we use district and year fixed effects models, exploiting the within-district and year variations in competition to identify the relationship between competition, quality, and student outcomes. The district fixed effects eliminate time-invariant observed and unobserved district characteristics that correlate with competition, quality, and student outcomes. For example, highly motivated parents are likely to select into school districts when choosing where to live (Hayes & Taylor, 1996). The district fixed effects thus effectively reduce the bias caused by the unobserved demand for high-quality child care driven by these highly motivated parents. The year fixed effects account for the common time trends that affected all school districts. We further control for an extensive set of time-varying district and provider characteristics that are strong confounder candidates in prior literature such as population density, per capita income, and average travel time to work (e.g., Henry & Gordon, 2006). To assess the validity of this design, we conduct a balance check of provider and district characteristics, in which we use the full set of provider and district covariates to predict the four measures of competition controlling for district and year fixed effects. We find that providers receiving child care subsidy reimbursements were slightly less likely to locate in high-competition districts, and districts with higher K–12 pupil–teacher ratios are slightly more likely to have higher competition (Supplemental Appendix E). However, the effects are fairly small, and we control for these variables in the analyses. Although it is unlikely that other omitted variables will considerably bias the estimates, findings in this study should not be considered causal. 8
We use two models for the quality and student outcomes. The model for quality outcomes is specified as follows:

where
The model for student outcomes is specified as follows:

where
Results
Quality Outcomes
Table 3 presents the association between competition and providers’ quality outcomes. Each coefficient represents a different regression using each competition measure predicting each of the three quality outcomes. All models include district and year fixed effects, and we show results both with and without controlling for the full set of time-varying provider and district characteristics listed in Table 1.
Associations Between Competition and Quality Outcomes
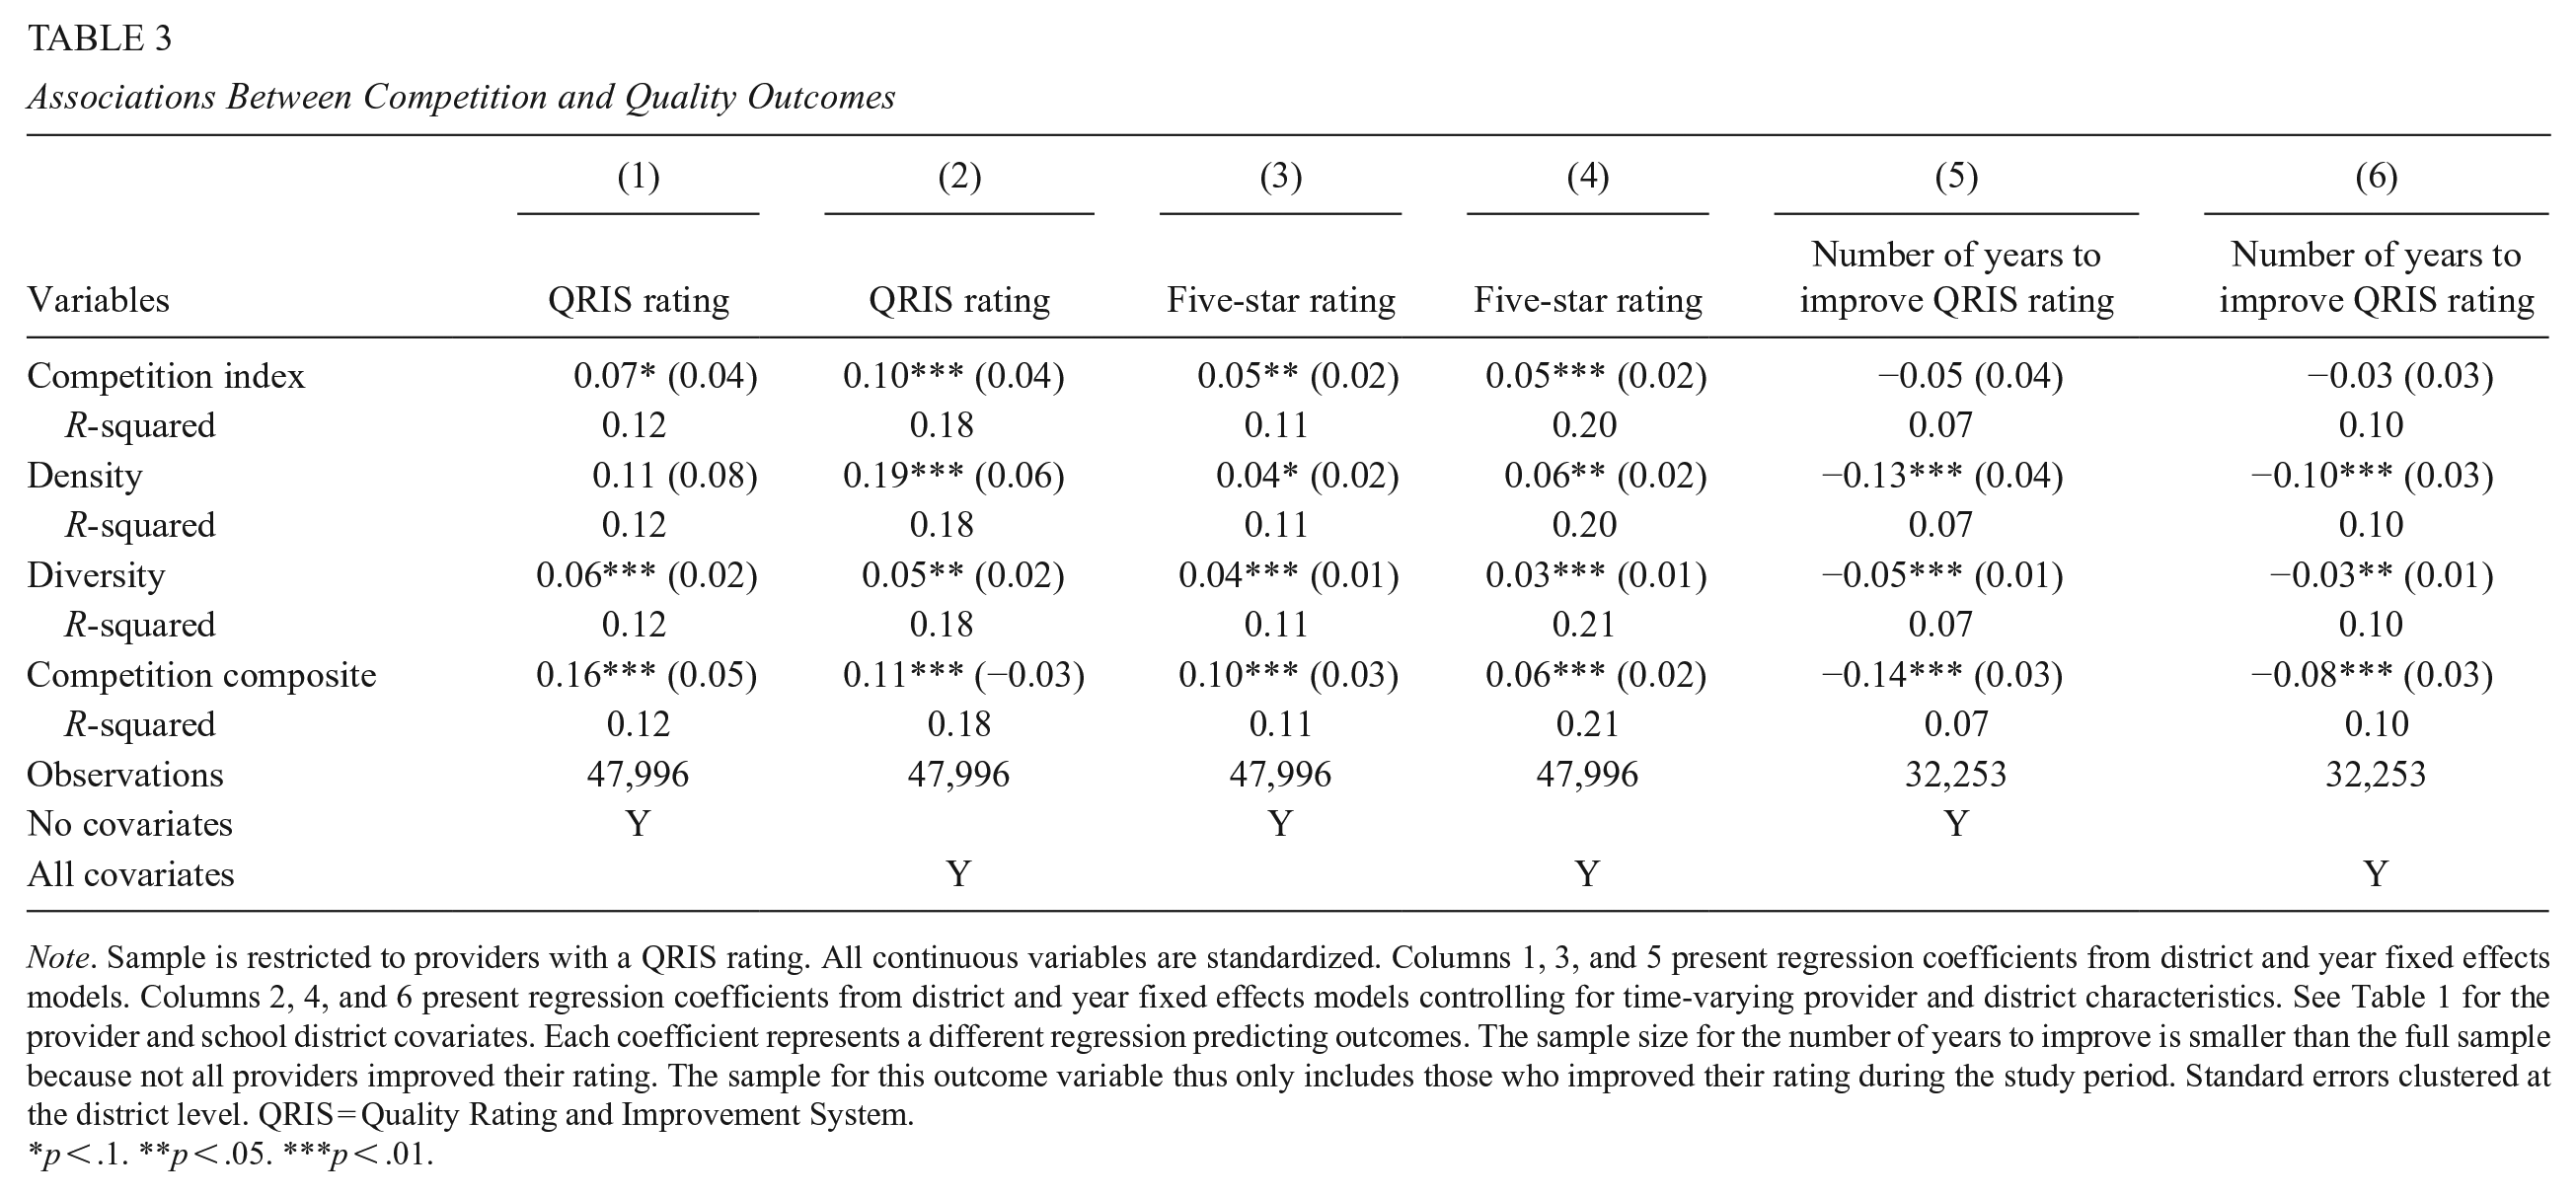
Note. Sample is restricted to providers with a QRIS rating. All continuous variables are standardized. Columns 1, 3, and 5 present regression coefficients from district and year fixed effects models. Columns 2, 4, and 6 present regression coefficients from district and year fixed effects models controlling for time-varying provider and district characteristics. See Table 1 for the provider and school district covariates. Each coefficient represents a different regression predicting outcomes. The sample size for the number of years to improve is smaller than the full sample because not all providers improved their rating. The sample for this outcome variable thus only includes those who improved their rating during the study period. Standard errors clustered at the district level. QRIS = Quality Rating and Improvement System.
p < .1. **p < .05. ***p < .01.
We find that all competition measures consistently and significantly predict improvements in QRIS rating and providers’ probability of obtaining a five-star rating. Specifically, a 1 standard deviation (SD) increase in the competition index is associated with a 0.10 SD increase in the QRIS rating (1 SD = 1.08 points). A 1 SD increase in density (0.21 providers per square mile) is associated with a 0.19 SD increase in QRIS rating. Therefore, adding one provider per square mile in the school district increases the QRIS rating by ~0.21 points. A 1 SD increase in diversity (0.42 types of providers) is associated with a 0.05 SD increase in the QRIS rating. Therefore, adding one provider of a different type in the district is associated with a 0.12-point increase in the QRIS rating. Lastly, a 1 SD increase in the competition composite, which is the mean of the standardized values of the three measures above, is associated with a 0.11 SD increase in the QRIS rating (about 0.1 point). All competition measures similarly increase providers’ probability of obtaining a five-star rating by 3% to 6%.
We also find evidence suggesting that higher levels of competition expedited providers’ processes to improve their quality. Three out of the four competition measures are negatively associated with the number of years to improve the QRIS rating (1 SD = .99 years). The effect sizes vary from 0.03 to 0.10, suggesting that a 1 SD increase in competition is associated with reduced time to improve that ranges from 2 to 5 months.
Robustness
We test the robustness of these findings using various alternative model specifications. We estimated models that included provider fixed effects, district-specific time trends, and providers who did not have a QRIS rating but were assigned a zero in this variable (Supplemental Appendix F). The magnitudes of the coefficients are similar across model specifications, yet the estimates are less precise due to the inflation of standard errors in these more restricted models. The competition composite has the most power among all the competition measures and remains significant in most cases.
Also, in Supplemental Appendix G, results from a set of logistic regressions and ordered logistic regressions predicting the ordered and dichotomous quality measures reveal similar findings with our linear regression models (i.e., each competition measure retains the same respective rank order in terms of coefficient size).
Because our main estimates rely on the assumption that competition in year y influences quality in year y, we wanted to test whether competitive effects carried-over from previous years. Shown in Supplemental Appendix H are models that include the average competition measures from the past 2 years, which are very similar to our main findings (results from the three-year average measure was very similar to the 2-year).
Supplemental Appendix I presents associations between competition and quality measures using the three alternative competition measures (i.e., the provider type fractionalization index and two PCA-weighted composite scores). The results are highly consistent with our four main competition measures, suggesting that our findings are robust to a variety of competition measures.
Heterogeneity
Next, we examine the differential effects of competition by private providers and public schools. Following Henry and Gordon (2006), we define private providers as those who are not public schools. Table 4 shows that higher levels of competition are significantly associated with quality improvements among private providers. Ten out of the 12 coefficients using different measures of competition predicting the quality outcomes are statistically significant. The results on public schools indicate that public schools are less responsive to higher levels of competition than private providers. In fact, public schools in more competitive school districts have lower QRIS ratings, are less likely to obtain a five-star rating, and take longer to improve their quality rating. However, these results are not statistically significant with large standard errors. We tested whether this was due to multicollinearity in our covariates using a post-estimation correlation matrix after predicting the QRIS rating, and found that no correlation was higher than 0.4 in absolute magnitude (Supplemental Appendix J). We thus suspect that the large standard errors may be due to the limited sample size of public schools.
Associations Between Competition and Quality Outcomes by Provider Type
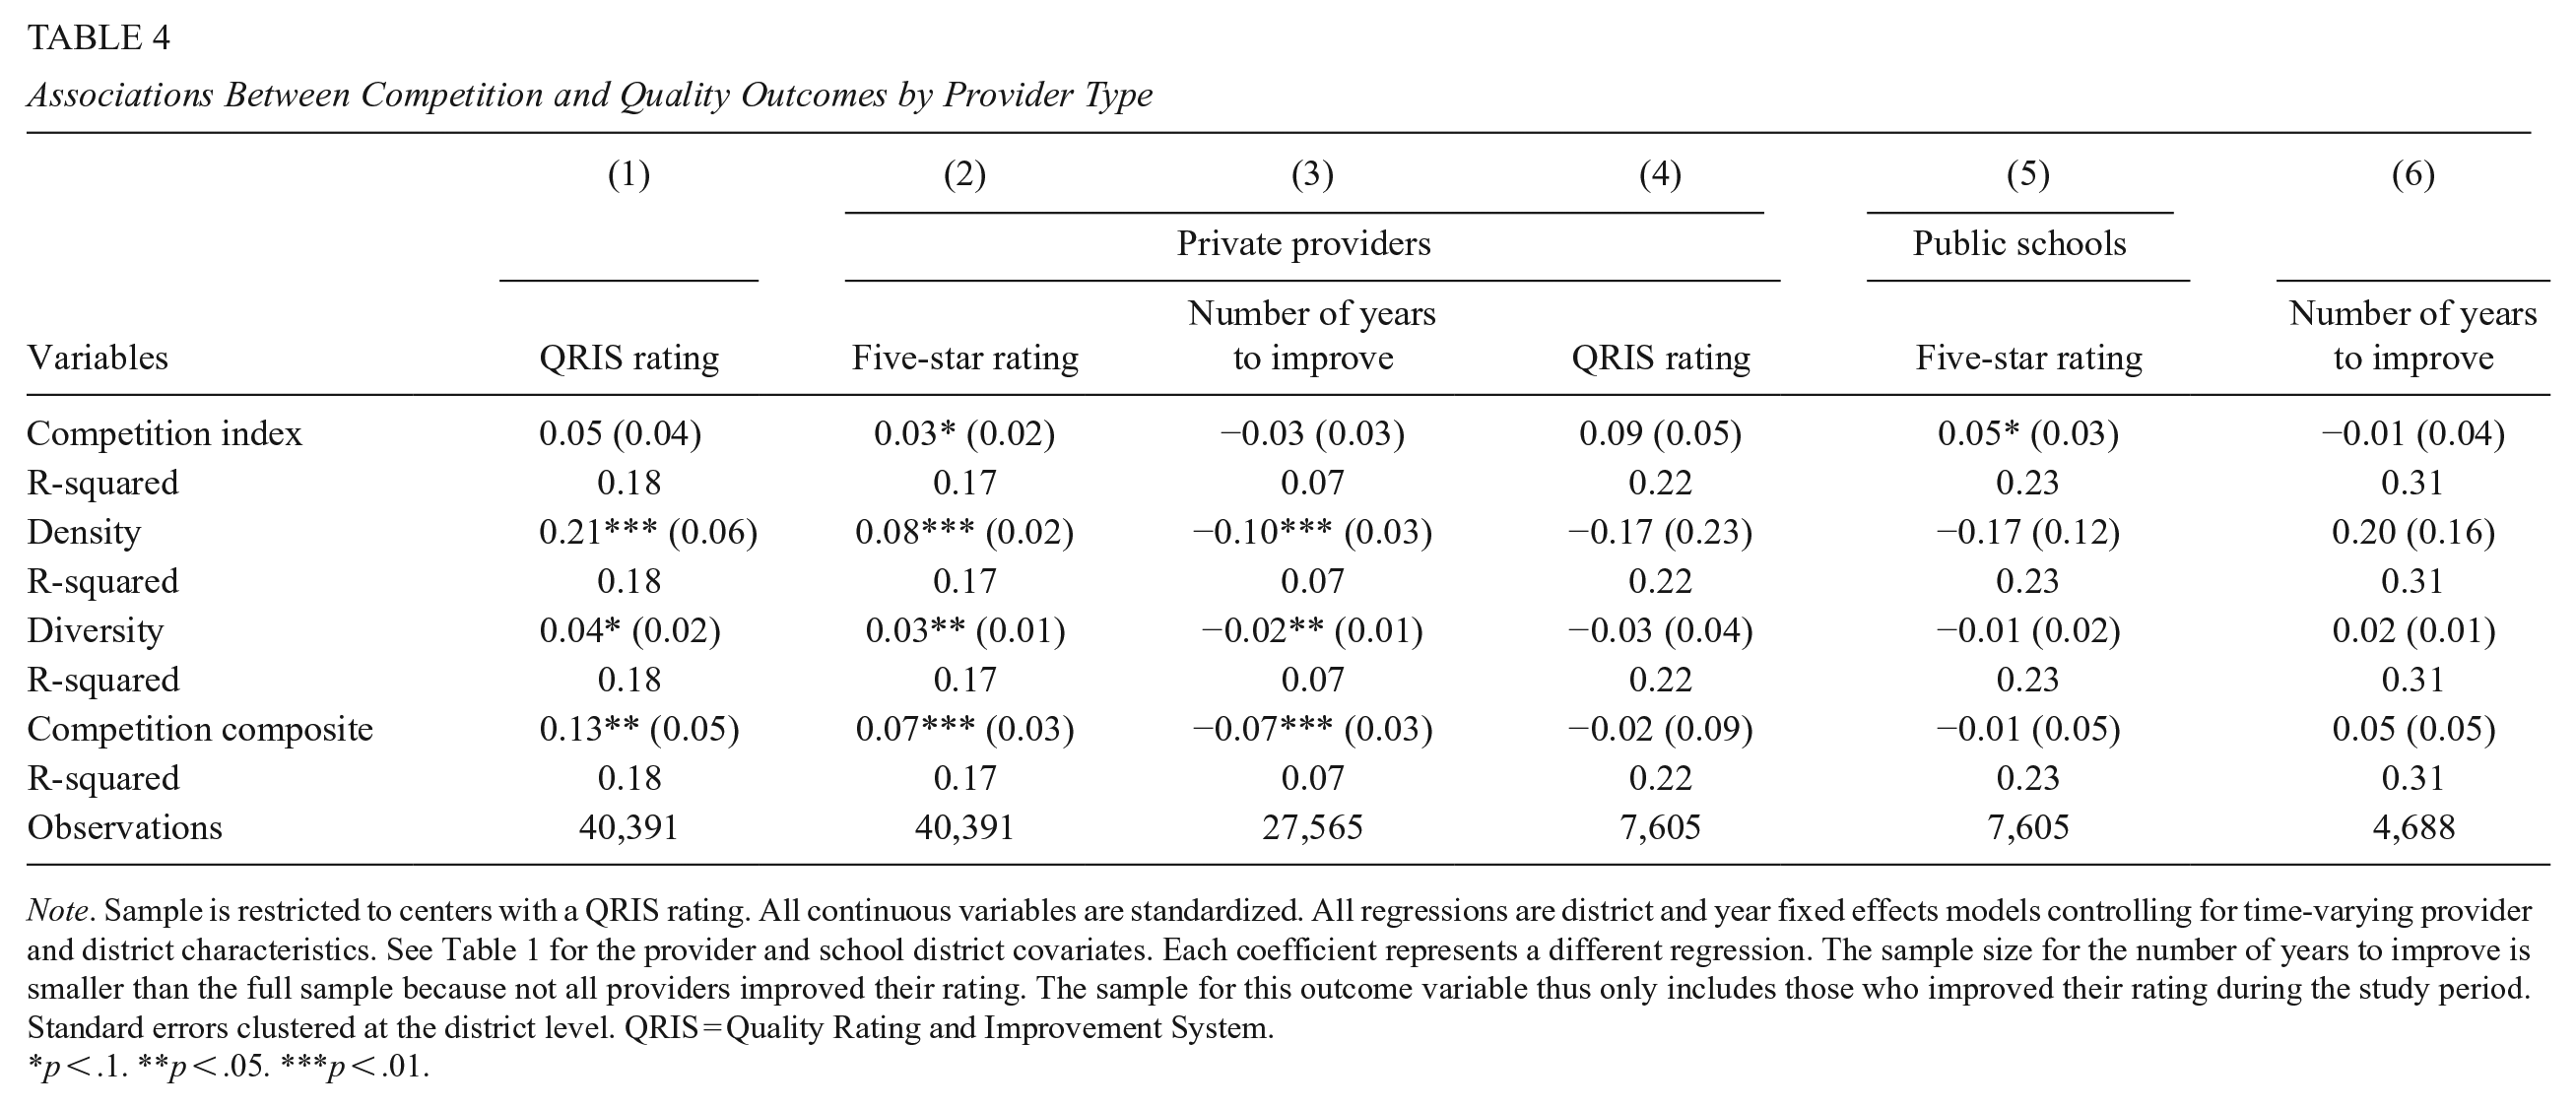
Note. Sample is restricted to centers with a QRIS rating. All continuous variables are standardized. All regressions are district and year fixed effects models controlling for time-varying provider and district characteristics. See Table 1 for the provider and school district covariates. Each coefficient represents a different regression. The sample size for the number of years to improve is smaller than the full sample because not all providers improved their rating. The sample for this outcome variable thus only includes those who improved their rating during the study period. Standard errors clustered at the district level. QRIS = Quality Rating and Improvement System.
p < .1. **p < .05. ***p < .01.
We also examine the heterogeneous effects of competition by school district SES, urbanicity, and provider initial QRIS rating (i.e., the first QRIS rating) to understand whether these specific school district and provider characteristics might drive the observed associations. Results in Supplemental Appendix K show that the positive effects of competition are concentrated in high-SES districts. The coefficients on the low-SES districts are similar in size but nonsignificant. Urban districts benefit significantly from competition; rural districts appear to benefit as well but the estimates on rural districts are less robust. All providers, regardless of their initial rating, benefit from higher levels of competition. Particularly, competition significantly improves the probability of achieving a five-star rating among providers with an initial one- to two-star rating. Providers with an initial three- to four-star rating are more likely to improve their rating and reduce their time to improve when facing more competition.
Student Outcomes
The relationship between competition and student third-grade outcomes is presented in Table 5. We first test our hypothesis on all students’ district-level RLA and math scores, and then by racial and socioeconomic subgroups. Overall, we do not find any consistent, clear patterns across the measures of competition and student third-grade outcomes. We discuss the possible explanations in the discussion section below.
Associations Between Competition During Preschool and Third-Grade Student Outcomes
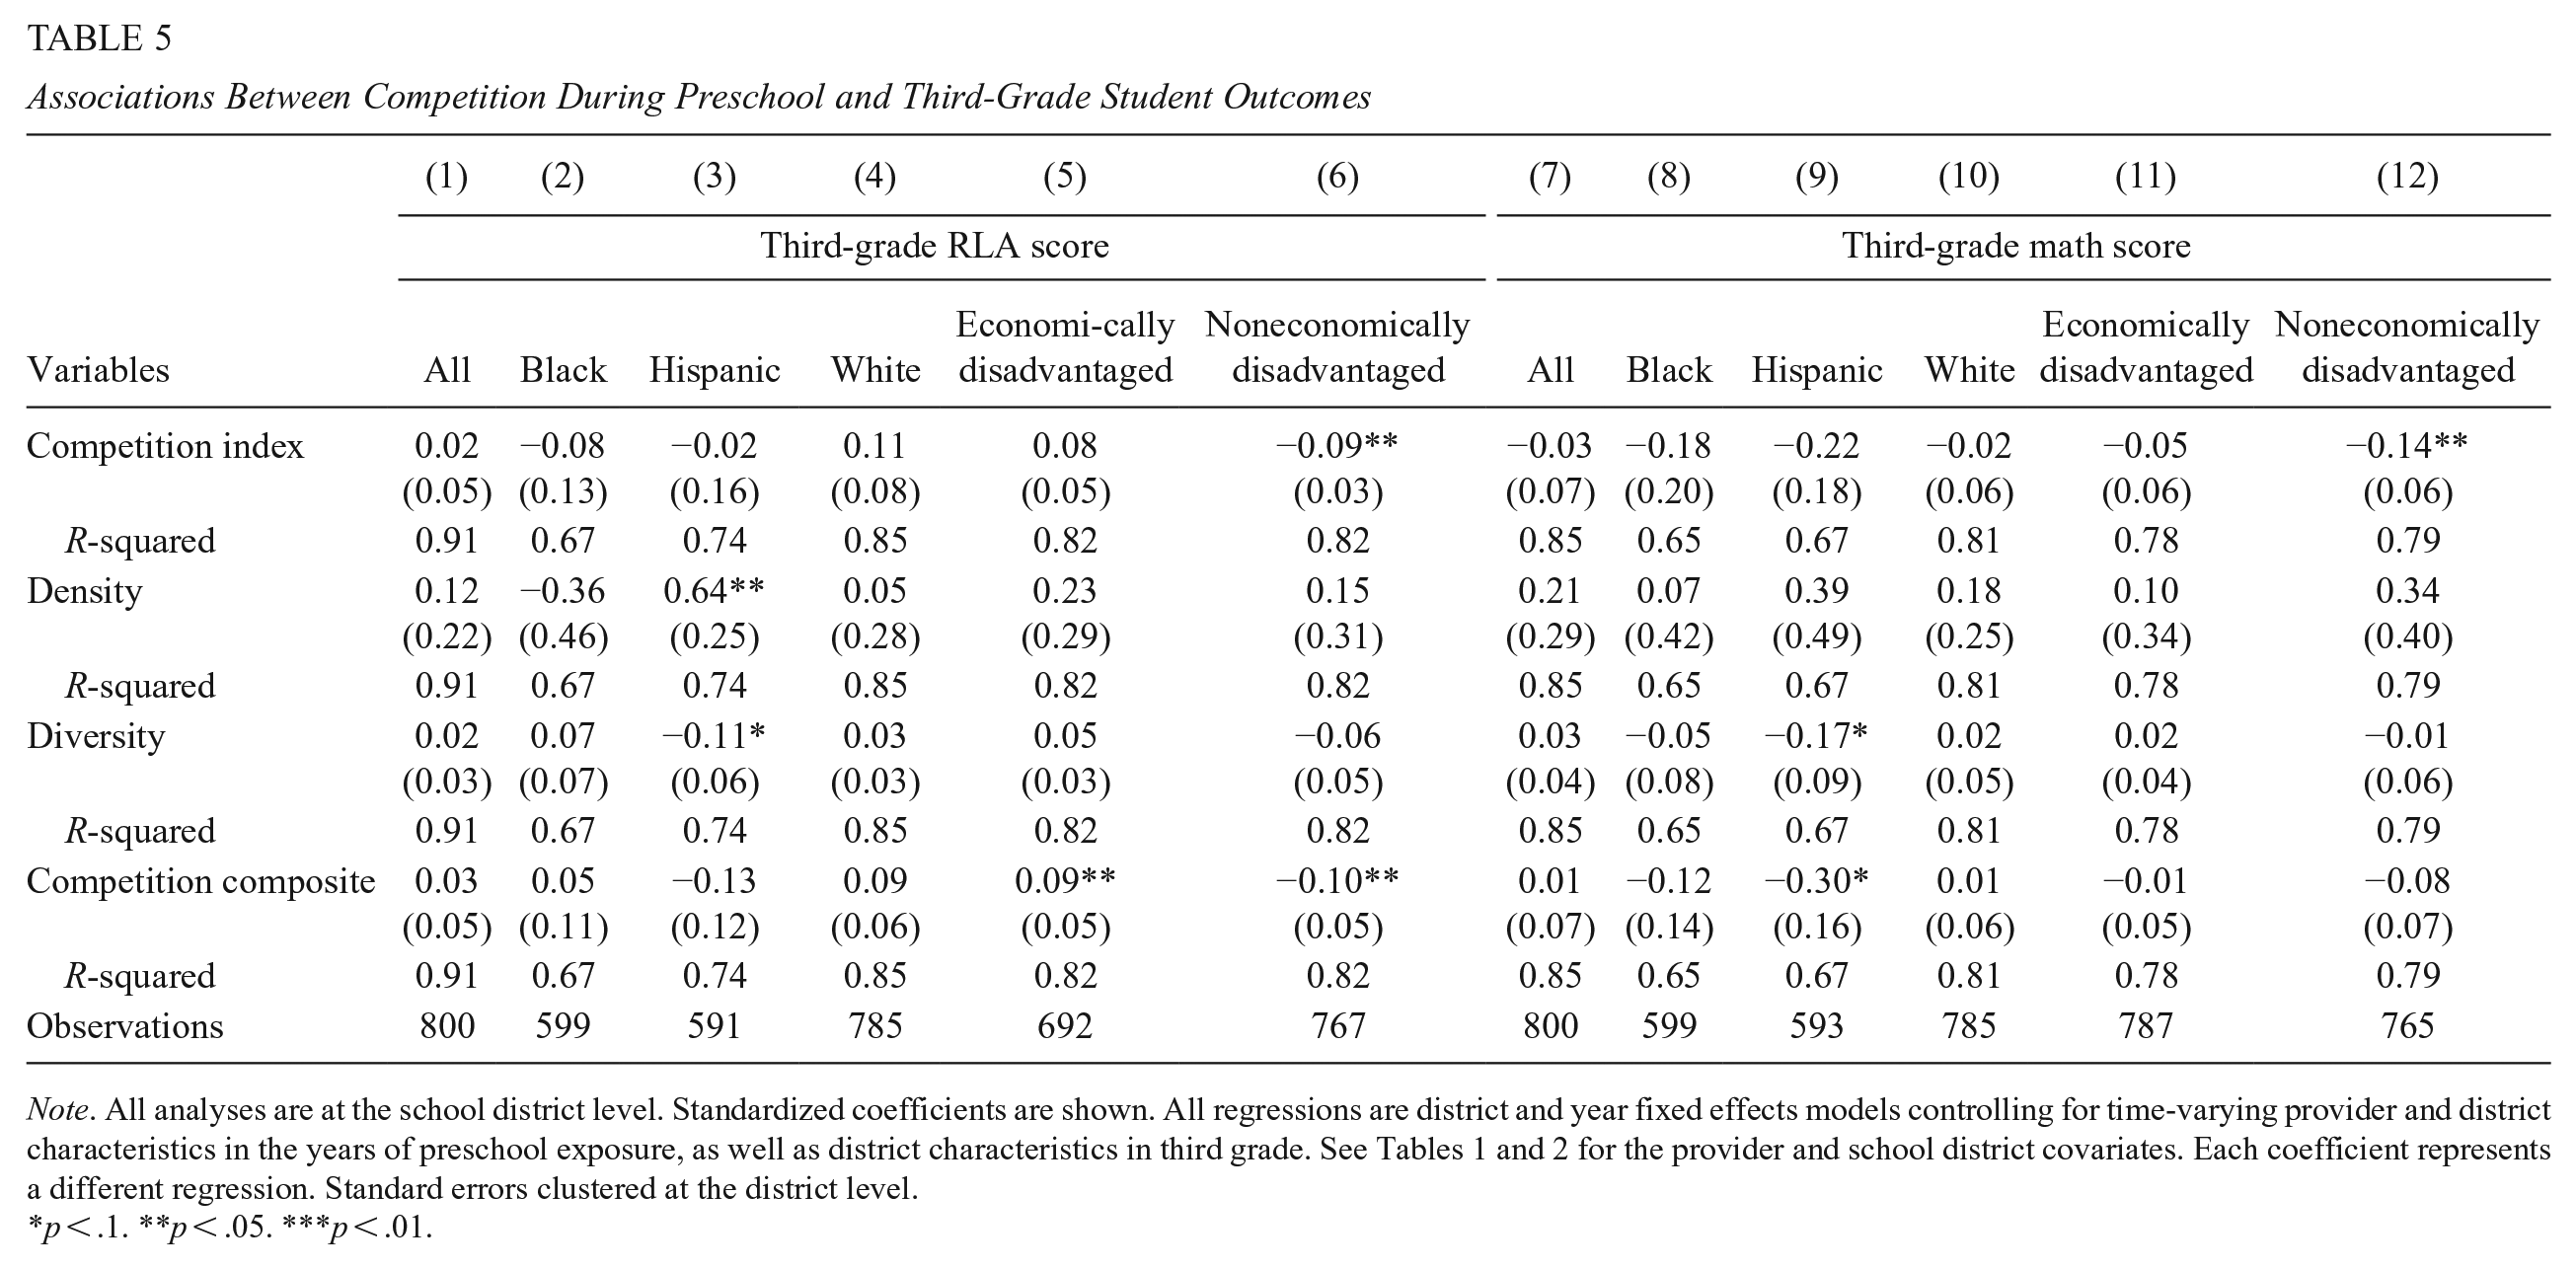
Note. All analyses are at the school district level. Standardized coefficients are shown. All regressions are district and year fixed effects models controlling for time-varying provider and district characteristics in the years of preschool exposure, as well as district characteristics in third grade. See Tables 1 and 2 for the provider and school district covariates. Each coefficient represents a different regression. Standard errors clustered at the district level.
p < .1. **p < .05. ***p < .01.
Discussion
This study is a comprehensive examination of the relationship between competition and provider quality and medium-term student outcomes in the contemporary context of ECE using detailed administrative data of all child care providers in NC from 2005 to 2018. In doing so, this study is the first to directly test the relationship between competition and child care quality using the QRIS ratings of almost all providers in the state. We use multiple competition and quality measures with district and year fixed effects models controlling for provider and school district characteristics. The results, which are fairly robust to various model specifications, reveal that higher levels of competition are associated with quality improvements among child care providers. Specifically, we find that competition improves providers’ quality ratings and their probability of obtaining a five-star rating. It also reduces the amount of time providers took to improve.
These findings support the theory of competition by showing that providers in the ECE market are responsive to the competitive pressure and improve their quality accordingly. This study adds to studies using data from other states, which have shown that the mixed-delivery, market-based, and publicly subsidized ECE systems tend to produce more desirable outcomes (in terms of access) than direct government provision (Bassok et al., 2014; Bassok, Miller, et al., 2016; Levin & Schwartz, 2007). This finding also joins the few existing studies in K–12, such as Figlio and Hart (2014), that identified the positive effects of competition on school quality. However, it should be noted that the K–12 studies generally evaluate the competitive effects of private schools on public school performance; this study focuses on competition in the entire market with respect to overall child care quality. The effect sizes in this study are generally larger than those found in the K–12 setting, which is likely because the ECE market is more competitive and consists of a mix of mostly private and relatively small providers.
Among all the competition measures, density (i.e., the number of providers per square mile in the district) has the largest coefficients on quality, both in effect sizes and in practical terms. One explanation is that providers respond to competition based on their perceptions of competition. Related research in the K–12 setting suggests that schools tend to react to their perceptions of competition rather than the actual competition (Jabbar, 2015a, 2015b). It is plausible that providers are more aware of the number of providers in their vicinity rather than their capacity or type. They are thus more likely to perceive the number of providers as a “real” threat and respond more actively to this form of competition.
We further find that private providers were significantly affected by the competitive pressure and took actions to improve their quality. Henry and Gordon (2006) found the same pattern when using student outcomes to measure the aggregate effects of competition. It should be noted that, in the ECE context, public schools’ increasing participation in the market were relatively recent—public schools are thus usually considered as “new entrants” who put pressure on existing providers (Cobb, 2009). Compared to private providers, public schools usually have higher levels of teacher education and facility requirements that place public school programs to achieve high-quality ratings upon market entry and exert competitive pressure to nearby private providers. Therefore, it is reasonable to suspect that private providers were more responsive to competition in this context. This finding may also reflect the fact that private providers had more room to improve. Eighty-one percent of the public school observations in our sample had a five-star rating, whereas only 30% of private provider observations had five stars.
The estimates on public schools are less precise and mostly nonsignificant due to limited sample size and, therefore, do not allow us to draw strong conclusions about their responsiveness to competition. However, we do find suggestive evidence indicating that public schools are less responsive to competitive pressure. For public schools, higher levels of competition were negatively associated with quality outcomes, although the coefficients were not statistically significant.
However, the improvements in quality do not translate to district-level student outcomes in third grade. Contrary to Henry and Gordon (2006), who found positive effects of preschool competition on student third-grade reading and math outcomes in Georgia, we find null effects of competition on district-level student outcomes in reading and math. Note that although we are able to estimate the direct relationship between competition and quality using QRIS rating, our estimates of student outcomes could still pick up the combined effects of all mechanisms influencing student outcomes through competition including peer effects and compositional changes. We propose several explanations for this. First, Henry and Gordon’s (2006) sample only included individual records of students who attended Georgia’s state pre-K program. We use district-level records that include students who did not go to preschool and thus were not exposed to preschool competition. The K–12 studies that found positive effects of competition on student outcomes also tend to use student-level data. Individual data may be better equipped to detect any effects competition has on student outcomes. Indeed, we found that private providers were more responsive to competition, but with aggregated data are not able to test the possibility of differential effects on later achievement outcomes by preschool provider type. Another explanation is the potential fadeout of competitive forces. A common phenomenon in ECE interventions is the fadeout of treatment effects—the ECE gains in the first few of years of participation tend to disappear when children reach later grades (Bailey et al., 2017, 2020). It is possible that the effects of competition on student outcomes during ECE have faded out when students get to third grade.
This study also reveals some heterogeneity in the associations between competition and quality. Specifically, we find that the association between of competition and quality was stronger in high-SES districts. This may be due to the fact that providers in higher income communities likely rely more on private payments from families for a greater proportion of their child care slots where fewer families in that community qualify for either NC Pre-K or child care subsidies. At the same time, high-SES parents also have stronger purchasing power and may be willing to pay more for higher quality. Providers in these districts are thus more sensitive to competition because they are more incentivized to show that their product is worth the money to attract and retain both full-paying customers and lower income families, whether searching for a NC Pre-K slot or other forms of subsidized care. Another possible explanation is that providers in high-SES districts are more likely to perceive the addition of child care slots in new or existing centers as real competition due to the limited unmet child care needs in these districts. It is reasonable to assume that there are at least some unmet needs, considering that in 2019 to 2020, NC Pre-K only reached 51% of eligible children, who are more likely to concentrate in low-SES areas. Providers in low-SES districts are, therefore, less likely to respond to competition if new child care slots are mostly used to fulfill unmet needs. Additionally, a back-of-the-envelope calculation suggests that in more competitive contexts, operationalized in several ways, provider quality was higher and more likely to improve (Supplemental Appendix L). This includes both high-SES and more urban districts, where there was greater competition on average, and for all providers regardless of their initial quality rating. Importantly, this comports with the theory of competition by raising community-level quality and “lifting all boats.” Admittedly, we cannot give a definitive interpretation of the heterogeneity patterns identified; however, we do reveal that there are noticeable variations of competition in different contexts. More future research focusing specifically on this topic can be explored.
Policy Implications
This study shows that competition in the ECE market has the potential to raise overall child care quality. Policies, such as the QRISs and child care subsidies, that utilize the market to improve quality and student outcomes could work. Our quality measures, derived from QRIS, could also be more amenable to scalable policies than other mechanisms that influence student outcomes such as peer composition. More causal research on these specific policies is needed in the future. For example, Bassok et al. (2019) found that providers who received a lower initial QRIS rating made larger improvements in quality over a 5-year period than those receiving a higher initial QRIS rating. The effects of a lower rating were most salient among providers who faced higher levels of competition (defined as the number of centers nearby), suggesting that competition could be an essential condition that moderates whether QRISs effectively incentivize providers to improve quality.
The responsiveness of private providers to competition (i.e., nonpublic schools) has important implications for using market-based policies to improve quality. Unlike the K–12 system, the private sector plays a key role in the child care supply. The quality improvement of private providers therefore contributes to the overall improvement of child care quality.
However, it is too early to draw conclusive claims about the positive effects of competition on child care quality or student outcomes. On the one hand, more causal research is needed to study the effects of competition on quality and student outcomes in different ECE contexts (e.g., different states and cities that implement diverse strategies to subsidize or provide child care). On the other hand, based on the extensive yet inconclusive literature in K–12, it is unlikely that competition alone is the “silver bullet” to improve school performance and student outcomes. Equity is another potential concern of market competition. Particularly, in this study, we find that the quality improvement was largely concentrated in relatively high-SES districts. It is critical to consider how to ensure that the benefits of competition, if proven with ample empirical evidence, are equally distributed and can even be utilized to address the existing SES gaps.
Limitations
This study has several limitations. First, although the district and year fixed effects design rules out many of the time-varying and invariant confounders, and the results are fairly robust to a variety of specifications, we cannot rule out the existence of unobserved school district characteristics and parental demand that might bias the results. The results only reveal association rather than causation. Second, the catchment area of a child care provider may be smaller than a school district. Although there is no direct evidence on how far parents are willing to go when searching for child care, results from the National Survey of Early Care and Education (2016) suggested that most parents chose center-based child care arrangements within 5 miles from their homes. We are unable to use a smaller geographic level because of the lack of providers’ location data.
Another set of limitations comes from our student outcome data, which are aggregated at the district level and only include public school students. Therefore, our results on student outcomes may not fully capture the competitive effects on students who were enrolled in preschool. Because the SEDA data only capture the achievement of public school students, we cannot capture the outcomes of students who participated in ECE and then went to private schools. They also do not allow us to differentiate the outcomes of students by preschool provider type.
Yet, our null findings on student outcomes may reflect the reality that a QRIS rating has limited predictive reliability for student outcomes. Current studies have only identified very modest links between the quality rating and student outcomes, with effect sizes ranging between 0.01 and 0.2 SD (Hestenes et al., 2015; Sabol et al., 2013; Sabol & Pianta, 2015; Watts et al., 2021). There are also challenges in measuring ECE quality to consistently and strongly predict child outcomes (Burchinal, 2018). These relatively small associations in the extant literature and our composite effects of quality magnitudes of just below 0.1 may suggest that our study is not well-powered enough to detect realistic-sized impacts on elementary test score outcomes. Even with detailed, child-level achievement data, only 25% of 4-year-olds enroll in NC’s Pre-K program; even if more private-pay families enroll in preschool, there may still be a relatively smaller fraction of children who will have been exposed to changes in local child care competition.
We also cannot rule out the possibility that competitive forces could affect cross-district quality in ways that our district-level measures are not able to capture. Families living near district boundaries could attend preschool in one district but go to school in another district. This extra-district presence of providers could impact actual competition but would not be picked up by our measure. Nor can we rule out the possibility that providers or certain types of providers may be systematically manipulating their quality rating without actually improving overall quality due to the lack of detailed component ratings of their QRIS rating. Another limitation comes from the coarseness of our time-varying district-level characteristics. Unfortunately, the ACS-ED district estimates are the only longitudinal data available. The coarseness of our district-level covariates may not fully account for the compositional changes of people within the district, which may affect quality.
Nevertheless, this study takes an important first step to understand the role of market competition in the contemporary ECE context. This study has implications for understanding the effectiveness of market-based policies and how to create the conditions that facilitate their success. Future studies could use detailed provider location data and individual-level data of student outcomes to further investigate the effects of competition in ECE.
Supplemental Material
sj-pdf-1-epa-10.3102_01623737241252413 – Supplemental material for A Rising Tide That Lifts All Boats? Effects of Competition on Child Care Quality and Medium-Term Student Outcomes
Supplemental material, sj-pdf-1-epa-10.3102_01623737241252413 for A Rising Tide That Lifts All Boats? Effects of Competition on Child Care Quality and Medium-Term Student Outcomes by Qing Zhang and Jade Marcus Jenkins in Educational Evaluation and Policy Analysis
Footnotes
Declaration of Conflicting Interests
The author(s) declared no potential conflicts of interest with respect to the research, authorship, and/or publication of this article.
Funding
The author(s) disclosed receipt of the following financial support for the research, authorship, and/or publication of this article: This research was supported by a grant from the American Educational Research Association, which receives funds for its “AERA-NSF Grants Program” from the National Science Foundation under NSF award NSF-DRL #1749275. This research was also supported by a grant from the National Institute of Child Health and Human Development under award number 1R01HD095930-01A1. Opinions reflect those of the authors and do not necessarily reflect those AERA, NSF, or NICHD.
Supplemental Material
Supplemental material for this article is available online.
Notes
Authors
QING ZHANG, PhD, is a Researcher at the University of California, Irvine’s School of Education. Her research focuses on program and policy evaluation.
JADE MARCUS JENKINS, PhD, is an Associate Professor at the University of California, Irvine’s School of Education. Her research focuses on early childhood policy.
References
Supplementary Material
Please find the following supplemental material available below.
For Open Access articles published under a Creative Commons License, all supplemental material carries the same license as the article it is associated with.
For non-Open Access articles published, all supplemental material carries a non-exclusive license, and permission requests for re-use of supplemental material or any part of supplemental material shall be sent directly to the copyright owner as specified in the copyright notice associated with the article.