
Abstract
Youth voter turnout remains stubbornly low and unresponsive to civic education. Rigorous evaluations of the effects of adopting civics tests for high school graduation by some states on youth voter turnout remain limited. We estimate the impact of a recent, state-mandated civics test policy—the Civics Education Initiative (CEI)—on youth voter turnout by exploiting spatial and temporal variation in the adoption of CEI across states. Using nationally representative data from the 1996 to 2020 Current Population Survey and a difference-in-differences analysis, we find that CEI does not significantly affect youth voter turnout. Our null results, largely insensitive to a variety of alternative specifications and robustness checks, provide evidence regarding the lack of efficacy of civics test policies when it comes to youth voter participation.
Keywords
Introduction
A
Scholars, educators, and policymakers often recommend civic education as a solution to low youth voter turnout (Battistoni, 2013; Campbell et al., 2012; National Council for the Social Studies, 2005). They often argue that civic education prepares students to become responsible and participatory citizens by teaching them civic knowledge (e.g., voting processes and electoral systems), values, and skills (National Council for the Social Studies, 2013). A growing body of research has evaluated that claim by examining the effect (or lack thereof) of civic education in schools on voter turnout. However, causal evaluations of civic education on youth voter turnout have been precluded by uneven access to and enrollment in advanced placement (AP) courses and advanced civics coursework across the country (Xu et al., 2021), along with significant selection bias involved in the enrollment in such courses. Furthermore, little attention has been paid to understanding the effects of state-mandated civics test policies required for high school graduation in some states on voter turnout. Indeed, we are aware of only one study that has evaluated the effect of varied state-level civics test policies. However, even that study primarily evaluated the effect on students’ civic knowledge (Campbell & Niemi, 2016). Also, that study was conducted before some states adopted a revised civic-test policy requirement, which we evaluate in this study. That study and most other prior work find a lack of significant effects of civic education on civic engagement outcomes such as voter turnout (Holbein & Hillygus, 2020; Weinschenk & Dawes, 2022).
In this article, we estimate the causal effect of a state-mandated civics test requirement for high school graduation on American youth voter turnout leveraging variation in the adoption of the Civics Education Initiative (CEI) policy across states and time. CEI is the most standardized civics test policy, requiring high school students to take, and in some cases pass, a civics test as a condition for graduati-on (Civics Education Initiative, 2017). As of 2022, 18 states have implemented a version of CEI. Essentially, CEI aims to ensure that all high school students have the “bare minimum of [political] knowledge” necessary to become active and engaged citizens (Hess et al., 2015, p. 174). Since CEI was introduced, scholars have criticized its narrow focus on political knowledge and questioned its effectiveness (Brezicha & Mitra, 2019; Hess et al., 2015; Kahne, 2015; Levine, 2015). CEI, however, has not been empirically evaluated at all, let alone using rigorous quasi-experimental techniques. We therefore have limited knowledge of whether and how such state-mandated civics test policies affect political outcomes, including voter participation.
To fill this knowledge gap, this study estimates the causal effect of CEI on young voter turnout, using national, repeated cross-sectional data on self-reported voting behaviors of 18- to 24-year-old U.S. citizens from the 1996 to 2020 Current Population Survey (CPS) and difference-in-differences (DD) and event study approaches. We also examine the heterogeneous effects of CEI on voter turnout by age, sex, race/ethnicity, and immigrant status. Consistent with prior research (Holbein & Hillygus, 2020; Weinschenk & Dawes, 2022), we find no significant impact of state-mandated CEI on youth voter turnout. Concerningly, we found a marginal, negative impact of CEI policy on Black youth voter turnout (b = −0.097, p < .10) although we interpret this result with caution given the low sample size. Our null results are robust to several alternative specifications and robustness checks—including placebo checks, triple-difference (DDD) analysis, and alternative comparison groups—which continue to raise skepticism regarding the efficacy of state-mandated civic education policies.
It may be unsurprising that requiring the civics test for high school graduation failed to move the needle on youth voter participation in the presidential election at a time of historic uncertainty. The United States and the world were actively grappling with the pandemic, the far-reaching consequences of persistent structural racism, and high political polarization. Future research should examine the effect of CEI on civic knowledge and other forms of civic engagement. However, if the goal was to improve youth voter participation in a consequential election—a distal, but arguably the most important, civic engagement outcome—CEI does not seem to have succeeded, at least in the short term. It is important to note that these null results reflect only a short-term effect of CEI on voting, given that we examined the effect on just one presidential and midterm election post-CEI. Future research should continue to monitor the effects of CEI on voting in the long term.
When it comes to improving youth voter turnout, then, more direct interventions, including voting information interventions (Bennion & Nickerson, 2016; Bergan et al., 2022; Gill et al., 2018) and electoral-level policy interventions, such as preregistration (Holbein & Hillygus, 2016), same day registration (Grumbach & Hill, 2022), and online registration (Yu, 2019), might be far more effective. On the other hand, broader curriculum targeting adolescents’ noncognitive skills—such as grit and task perseverance, which helps youth convert political motivation into actual participation (Holbein & Hillygus, 2020), or other key psychosocial skills promoted by some high-achieving charter schools (Cohodes & Feigenbaum, 2021; McEachin et al., 2020)—is also beginning to show promise. Future research should focus on identifying the mechanisms and components of such broad-based curricular components to promote civic engagement holistically among young citizens instead of narrowing the focus of civic education to basic rote memorization of political and civic knowledge.
Policy Background: The CEI
One recent state-level civic education policy effort to address the low youth voter turnout is the Civics Education Initiative (CEI). CEI, an advocacy campaign led by the Joe Foss Institute between September 2015 and September 2017, lobbied for state adoption of a mandatory civics test requirement for high school graduation (Civics Education Initiative, 2017). In terms of the civics test format, CEI recommended to use 100 questions about basic federal historical and civic facts, drawn from the United States Citizenship and Immigration Services naturalization civics test (U.S. Citizenship and Immigration Service, 2022). This policy aimed to ensure that high school students graduate with the foundational civic knowledge necessary to become informed and engaged citizens. As a consequence of the advocacy campaign, Arizona adopted CEI in 2015, followed by 17 states, all of which adopted a form of CEI between 2015 and 2018 (Brennan & Railey, 2017; Brezicha & Mitra, 2019).
Leveraging the variation in CEI adoption across states over time, we classified states into two groups: states that have implemented CEI policy (i.e., treatment group) and states that have not implemented CEI policy at the time of the presidential election of 2020 (i.e., comparison group). Even though CEI aimed to make the civics test a high school graduation requirement, several states relaxed the graduation requirement. In other words, these states did not make high school graduation conditional on passing the test (Brennan & Railey, 2017). Based on this variation in policy implementation, we classified “treatment” states into two subcategories: states with a strong civics test requirement and states with a weak civics test requirement.
We reviewed websites and policy documents and also contacted several state departments of education to assess the links between the adoption and implementation of CEI. Unfortunately, states do not collect data related to the administration of the civics tests as of 2022. Therefore, we only have anecdotal evidence regarding the implementation fidelity of CEI. We observed that the guidance on the administration of the civics test exam and the associated reporting system varies across treatment states. That said, the civics test examination is primarily administered at the school or district level in most states.
Some treatment states provided detailed guidance and sample tests that each school/district could use or adapt from. For example, the Kentucky Department of Education (2021a, 2021b) provided a Web platform with a multiple-choice version of the civics test as well as a civics test manual for the administration, implementation, scoring, and recording of results on the civics test.
Next, whether students take and pass the exam is overseen by a state-level system in some states. For example, in Arkansas, even though designated teachers administer the exam, the CEI coordinator in each high school registers students and uploads their information to the state system (Program Advisor for Social Studies at the Arkansas Department of Education, personal communication, October 7, 2022). Similarly, in Nevada, the website and associated manual on the civics exam states,
Results from the civics exam will be uploaded to the Assessment tab in Infinite Campus under the test name, “Civics-High School Graduation.” This action also updates the High School Graduation Assessment section on the transcript. And schools will use results reported in Infinite Campus to validate transcripts and diploma status. (Washoe County School District, 2020)
On the other extreme, some states seem to barely pay attention to CEI implementation. In Minnesota, for example, schools or districts determine the administration of the exam and the logistics for recording the results, which are not reported to the Minnesota Department of Education (2023). Given such variation in implementation, our intent-to-treat (ITT) analysis based on policy adoption is likely the most conservative, but appropriate, approach to use.
Table 1 shows the list of states in the treatment and comparison groups, respectively, along with the exact years of policy adoption and implementation. As can be seen from Table 1, all treatment states passed the law between 2015 and 2017 (Brennan & Railey, 2017). In all, we have 15 treatment states (referred to as “omnibus” treatment hereafter) and 34 comparison states in our analytical sample.
Timing of the Civics Education Initiative by Treatment Status
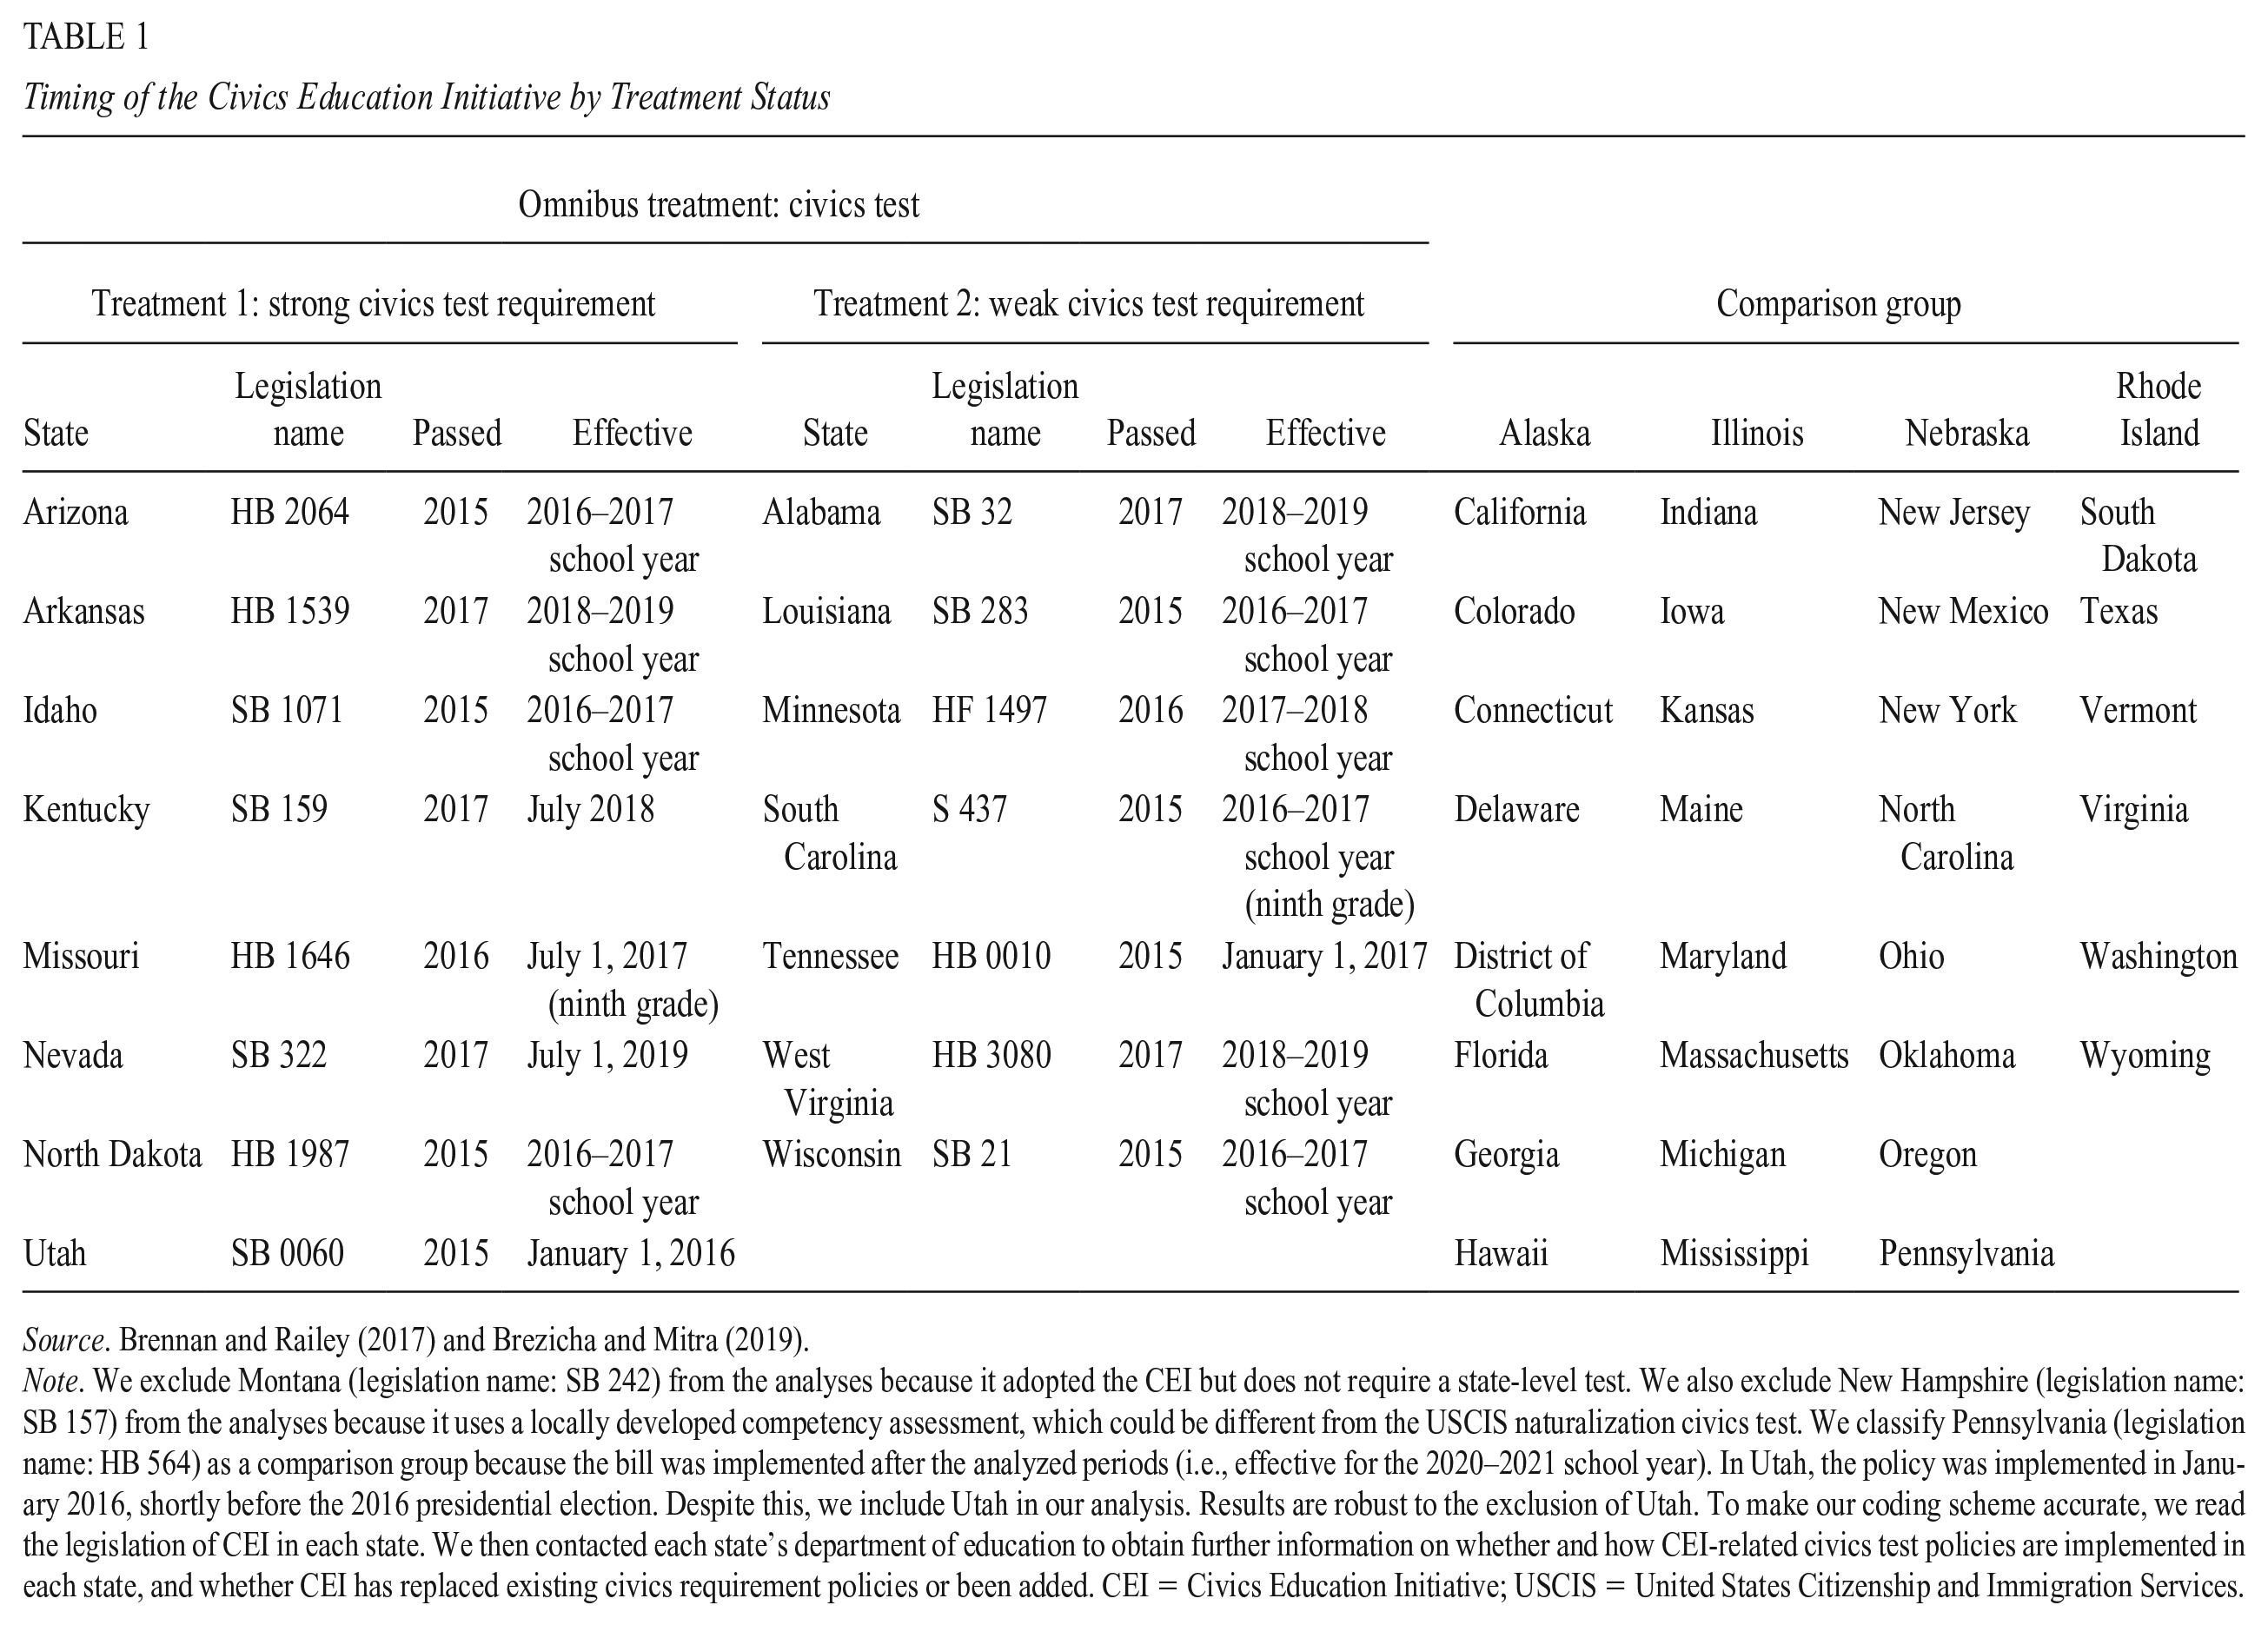
Source. Brennan and Railey (2017) and Brezicha and Mitra (2019).
Note. We exclude Montana (legislation name: SB 242) from the analyses because it adopted the CEI but does not require a state-level test. We also exclude New Hampshire (legislation name: SB 157) from the analyses because it uses a locally developed competency assessment, which could be different from the USCIS naturalization civics test. We classify Pennsylvania (legislation name: HB 564) as a comparison group because the bill was implemented after the analyzed periods (i.e., effective for the 2020–2021 school year). In Utah, the policy was implemented in January 2016, shortly before the 2016 presidential election. Despite this, we include Utah in our analysis. Results are robust to the exclusion of Utah. To make our coding scheme accurate, we read the legislation of CEI in each state. We then contacted each state’s department of education to obtain further information on whether and how CEI-related civics test policies are implemented in each state, and whether CEI has replaced existing civics requirement policies or been added. CEI = Civics Education Initiative; USCIS = United States Citizenship and Immigration Services.
It is also important to place CEI within the context of other civic education policies in schools in the United States. Prior to the widespread adoption of CEI, several states had civics coursework completion and assessment requirements (Campbell & Niemi, 2016). Similarly, as described earlier, the rates of AP U.S. History and Government (the most relevant civics coursework analyzed by past studies) course availability, enrollments, and passing vary considerably across states (Holbein & Hillygus, 2020). Although several states that adopted CEI between 2015 and 2017 had historically lower rates of civic education prior to CEI, our treatment effects might be underestimated if comparison states had historically higher civics course participation even though they did not adopt the new civics test requirement. For example, Virginia showed the highest rates of advanced civics coursework participation, with close to 9% of high school students enrolling in AP U.S. History or Government courses in 2015 despite not adopting CEI. For our core analysis, we focus singularly on the variation in CEI adoption across states. However, in robustness checks, we try to disentangle these confounding effects by using alternative comparison groups. In other words, we compare states that adopted CEI with states that did not have high civics course participation. Our baseline results are robust to these alternative comparison groups. We return to this point in our discussion.
Civic Education and Voter Turnout
Civic education is often viewed as an effective remedy for low youth voter turnout by scholars, educators, and policymakers alike (Battistoni, 2013; Campbell et al., 2012; National Council for the Social Studies, 2005). Specifically, civic education is expected to prepare students to be responsible and participatory citizens by teaching them political knowledge, values, and skills (National Council for the Social Studies, 2013). Despite this expectation, few studies empirically evaluate the effect of civic education on voter participation, especially compared to the number of studies on other civic engagement outcomes, such as political knowledge and interest (see Holbein & Hillygus, 2020, for a good overview of the efficacy of civic education in schools). In addition, most observational studies suffer from selection bias; that is, people who are more civically engaged and thus more likely to vote are also more likely to enroll in civics courses. To overcome this key limitation, scholars have recently begun employing more rigorous quasi-experimental research designs, including family-fixed effects and difference in differences. For example, Weinschenk and Dawes (2022) compared voter turnout among siblings who were differentially exposed to civic education but had common, shared family backgrounds using family-fixed effects. Furthermore, Holbein and Hillygus (2020, Chapter 5) estimated the causal effect of civic education on youth voter turnout using state-level variation in AP civic-related course enrollments (e.g., course enrollments in AP U.S. History or AP Government) using a difference in differences design. Concerningly, all of these rigorous studies found no effect of civic education on youth voter turnout.
While there has been a growing body of research on the effect of taking civics courses (Bell et al., 2022; Holbein & Hillygus, 2020; Weinschenk & Dawes, 2022), the effect of civics test policies on youth voter turnout remains largely unexplored. Campbell (2014) and Campbell and Niemi (2016) are notable exceptions that explore the effect of state-level, high-stakes civics exams on civic knowledge and voter turnout. Using National Assessment of Educational Progress data and ordinary least squares regression, Campbell and Niemi (2016) found that students who had taken civics tests showed higher political knowledge than those who did not. They also showed that this association was especially prominent among Latinx students. However, Campbell (2014) did not find any significant relationship between these state-level civic assessment policies and voter turnout. 1 In sum, despite the growing body of literature and ongoing public debate (Vara, 2015), we know little about the causal impact of the civics test policy on youth turnout. This study aims to fill this gap by leveraging variation in a recent state-level civics test policy, CEI.
Among various forms of civic engagement, such as volunteering, organizing, and community-based participation to improve civic life broadly, we focus on voter turnout in this article. Supporters of CEI highlighted voter turnout as a potential outcome that CEI aimed to improve (Civics Education Initiative, 2017), so it is important to evaluate the effect of CEI on this outcome of interest. In addition, because voter turnout is measured consistently across a long time period and is available from national datasets such as CPS, this analysis on a consequential civic engagement outcome is possible.
That said, voting participation does not capture all forms of civic engagement. Voting is not the only civic engagement outcome that matters to society nor is it the exclusive focus of CEI. Indeed, CEI policy documents emphasize that these policies aim to foster “active and engaged citizens,” which requires more than voting participation. In addition, CEI advocates emphasize that civic knowledge is the first stage for active civic engagement. Thus, CEI’s impact on other civic outcomes, such as civic knowledge and volunteering, should be examined as well to better understand the overall effectiveness of the policy.
How Would CEI Affect Young Voter Turnout?
In the resource model framework, one of the most prominent theories of voter participation, individuals’ political participation is influenced by their political resources, including time, money, and cognitive abilities, including verbal skills and political knowledge (Brady et al., 1995; Burns et al., 2001; Verba et al., 1993, 1995). These resources are hypothesized to promote political participation by lowering the costs of participation. In terms of youth voter participation, verbal skills and political knowledge, which are mostly acquired in school, have been considered to be the most crucial political resources (Brady et al., 1995). This framework suggests that political knowledge gained through preparation for and participation in civics tests may boost voter participation by reducing the informational cost of voting. As a result of CEI, which requires students to pass the test on 100 basic civics-related facts, students may gain political knowledge of how the U.S. government and politics work (Hess et al., 2015). And this political knowledge, in turn, may translate to higher voter participation, as envisaged by the CEI advocates (Civics Education Initiative, 2017).
On the other hand, “political knowledge” is a fairly broad construct. Some types of political knowledge, such as factual knowledge about political institutions, structures, and history, may not be relevant to voting at all. Some scholars have argued that the knowledge needed to vote might be more specific than general political knowledge (Boudreau, 2009; Cramer & Toff, 2017; Lupia, 2016). Empirical research also shows that an understanding of current political and social debates as well as the mechanics of voting could more effectively reduce the cost of voting than more general political knowledge. Indeed, knowledge required for the civics test, including “the name of the territory the United States purchased in 1803” and “the name of the longest rivers in the United States,” may not be necessary for voting (Hess et al., 2015; Kahne, 2015; Levine, 2015; U.S. Citizenship and Immigration Service, 2022). In other words, the political knowledge gained through preparing for and taking the civics test may not necessarily reduce the informational cost of voting because such knowledge is not useful in voting contexts. In addition, considering the failure of traditional civic education, which also often emphasizes mastering facts about government and politics, in increasing voter turnout (Holbein & Hillygus, 2020; Weinschenk & Dawes, 2022), this knowledge-focused policy may not be sufficient to improve youth turnout. Accordingly, there might be a null relationship between CEI and voter turnout.
A third possibility is that the implementation of CEI may negatively impact young voter turnout by limiting students’ opportunities to develop political skills and attitudes that assist them in overcoming barriers to voting. In illustrating the limitation of memorizing facts, recent scholarship underscores the importance of practical experience and skills in becoming an empowered, active, and engaged citizen (Brezicha & Mitra, 2019; Holbein & Hillygus, 2020; Mitra & Serriere, 2012; Westheimer & Kahne, 2004). For example, Holbein and Hillygus (2020) showed that noncognitive skills, including perseverance, determination, and self-control, are crucial for youth in following through on their intention to vote. Similarly, Cohodes and Feigenbaum (2021) showed that the gains in voter turnout among girls who attended high-performing charter schools in Boston were largely through the development of psychosocial skills. In light of the prior research emphasizing political skills, scholars and educators have cautioned that civics tests may narrow the content of civic education and turn it into a memory exercise (Brezicha & Mitra, 2019; Levine, 2015; Mitra & Serriere, 2012). Indeed, Kahne and his colleagues (2000) found that when schools administer civic assessments, civic learning becomes confined to measured content. Teachers have also expressed that it is difficult to conduct engaging activities such as a mock election when they have standardized tests (Holbein & Hillygus, 2020). In sum, the civics test might encroach upon students’ time for practical skills that meaningfully increase voter turnout.
Considering the debate surrounding the civics test policy, one would expect vibrant literature evaluating its effectiveness. However, research on the policy is surprisingly scarce, and as a result, we know little about the impact of the civics test policy on youth turnout. This study makes a significant contribution to the literature on civic education policy by estimating the causal effect of state-level civics test policy on youth voter turnout for the first time.
Data and Method
Data
We use pooled cross-sectional data from the 1996 to 2020 Current Population Survey (CPS) Voting and Registration Supplement (Flood et al., 2022). The CPS is a large nationally representative survey interviewing approximately 54,000 households monthly and providing extensive information on individuals’ employment situation and demographic characteristics. The CPS Voting and Registration Supplement is a supplement to the monthly CPS conducted every 2 years in November after elections. This survey covers both registered and nonregistered individuals who are eligible to vote (i.e., U.S. citizens who are 18 years old or older) and is a key source of national information on civic engagement, including self-reported voter turnout, in the United States.
The CPS and Voting and Registration Supplement together contain information on voting participation, age, and residence. More importantly, it includes data on youth voter turnout before and after states adapted CEI. We use age-specific voter turnout data from the 2020 presidential election, a survey conducted after the adoption of CEI, as well as six other prior presidential elections from 1996 to 2016 to evaluate the efficacy of state-mandated CEI. In all, we use seven waves of CPS, each conducted after the presidential elections, to construct our analytical sample (1996, 2000, 2004, 2008, 2012, 2016, and 2020). 2 Since some demographic variables (e.g., nativity and citizenship variables) are not available in the years before 1994, waves before 1994 are excluded from the analysis. In addition, we limit the analytical sample to young U.S. citizens (18–22 years old) to capture the population who were most likely to be exposed to CEI. There is no clear age threshold that is appropriate for the analysis since the age of voters exposed to the policy varies by state. For example, in Arizona, where the policy was implemented in the 2016–2017 school year, voters aged 18 to 22 years in 2020 were exposed to treatment. However, in Arkansas, where the policy was implemented in the 2018–2019 school year, only people aged 18 to 20 years in 2020 were likely exposed. To maximize statistical power, we restricted our analytical sample to include 18- to 22-year olds for our core results. 3
Measures
Voter Turnout
The outcome variable is self-reported voting of young people aged 18 to 22 years in presidential elections from 1996 to 2020 (voted = 1, not voted = 0). 4
Treatment
As described earlier, our key treatment variable indicates whether the respondent’s state had adopted CEI or not in each wave between 1996 and 2020. We also distinguish between states that adopted a strong civics test requirement—high school graduation is conditional on passing the civics test—and states that adopted a weak civics test requirement—graduation is not conditional on passage—with separate indicators.
Demographics
We include demographic characteristics such as sex, race/ethnicity, educational attainment, family income, immigrant background, marital status, metropolis residence, and employment status.
Time-Varying State Variables
Finally, we also include state-level time-varying covariates that may have differentially impacted voter turnout across states. These covariates include the proportion of people who are White, Black, Hispanic, married, separated/divorced/widowed, unemployed, graduated high school, registered for the election, metropolis residence, and have immigrant backgrounds, as well as the median household income and Democratic-to-Republican vote share ratio. 5
The final analytic sample size is approximately 5,000 respondents across seven periods and a total of 36,627 respondent-wave observations. To be specific, the final sample size is 36,627 for the omnibus treatment group, 32,452 for the strong civics test treatment group, and 31,897 for the weak civics test treatment group.
Analytic Plan
We implement difference in differences and event study analyses leveraging the variation in state-mandated adoption of CEI across states in the country.
First, in our core analysis, we use a two-way fixed effects model with the following specification:
where Yist is whether the individual i in state s reported voting (1 = Yes, 0 = No) at each period t. The civics_test_policy
st
is a binary variable equal to 1 if an individual i lives in state s that adopted the policy during period t, and 0 otherwise. Therefore, β1 represents the effect of civics test policy implementation. γs is a set of state-fixed effects, and λt is a set of fixed effects for the period.
In alternative specifications, we also add ϕ t , a linear time index to control for a general linear trend in voter turnout across both treatment and comparison states, and γsϕ t , a set of interactions between states and the linear time index to capture the state-specific linear trends. In other words, each state is allowed to have a unique trajectory in voter turnout, which relaxes the parallel trends assumption (Wing et al., 2018).
Even though there is temporal variation in CEI adoption, we do not have the staggered treatment adoption issues highlighted in the recent DD literature (Goodman-Bacon, 2021; Roth et al., 2023) because of the way we have constructed our analytical sample. We use waves of CPS collected 4 years apart, after each presidential election. All states adopted the policy after the 2016 election and before the 2020 election, so there is just one posttreatment period in our data.
Second, we conduct an event study analysis (Angrist & Pischke, 2009) to identify the effect of CEI and examine parallel pretrends assumption—in the absence of the civics test policy, the voter turnout rates in treatment states and comparison states would have evolved in the same manner as they did in the prepolicy period. Specifically, we include a set of indicator variables (leads and lags),
This study examines the trends in voter turnout 4, 8, 12, 16, 20, and 24 years before CEI policy adoption as well as, up to 4 years after policy adoption.
6
We later present event study graphs that visualize estimates of
For all models, we cluster the standard errors at the state level to account for the nested characteristics of data and level of treatment (i.e., citizens within states) as well as heteroscedasticity. Also, to generalize the result from the sample to the target population, we use the basic CPS weight variable which was created by the census survey team to adjust the potential bias from unequal selection probability and nonresponse (Flood et al., 2022).
Results
Descriptive Statistics
First, we present descriptive statistics of the key measures from our analytical sample separated by treatment status in Table 2.
Descriptive Statistics by Treatment Status (Age 18–22 Years)
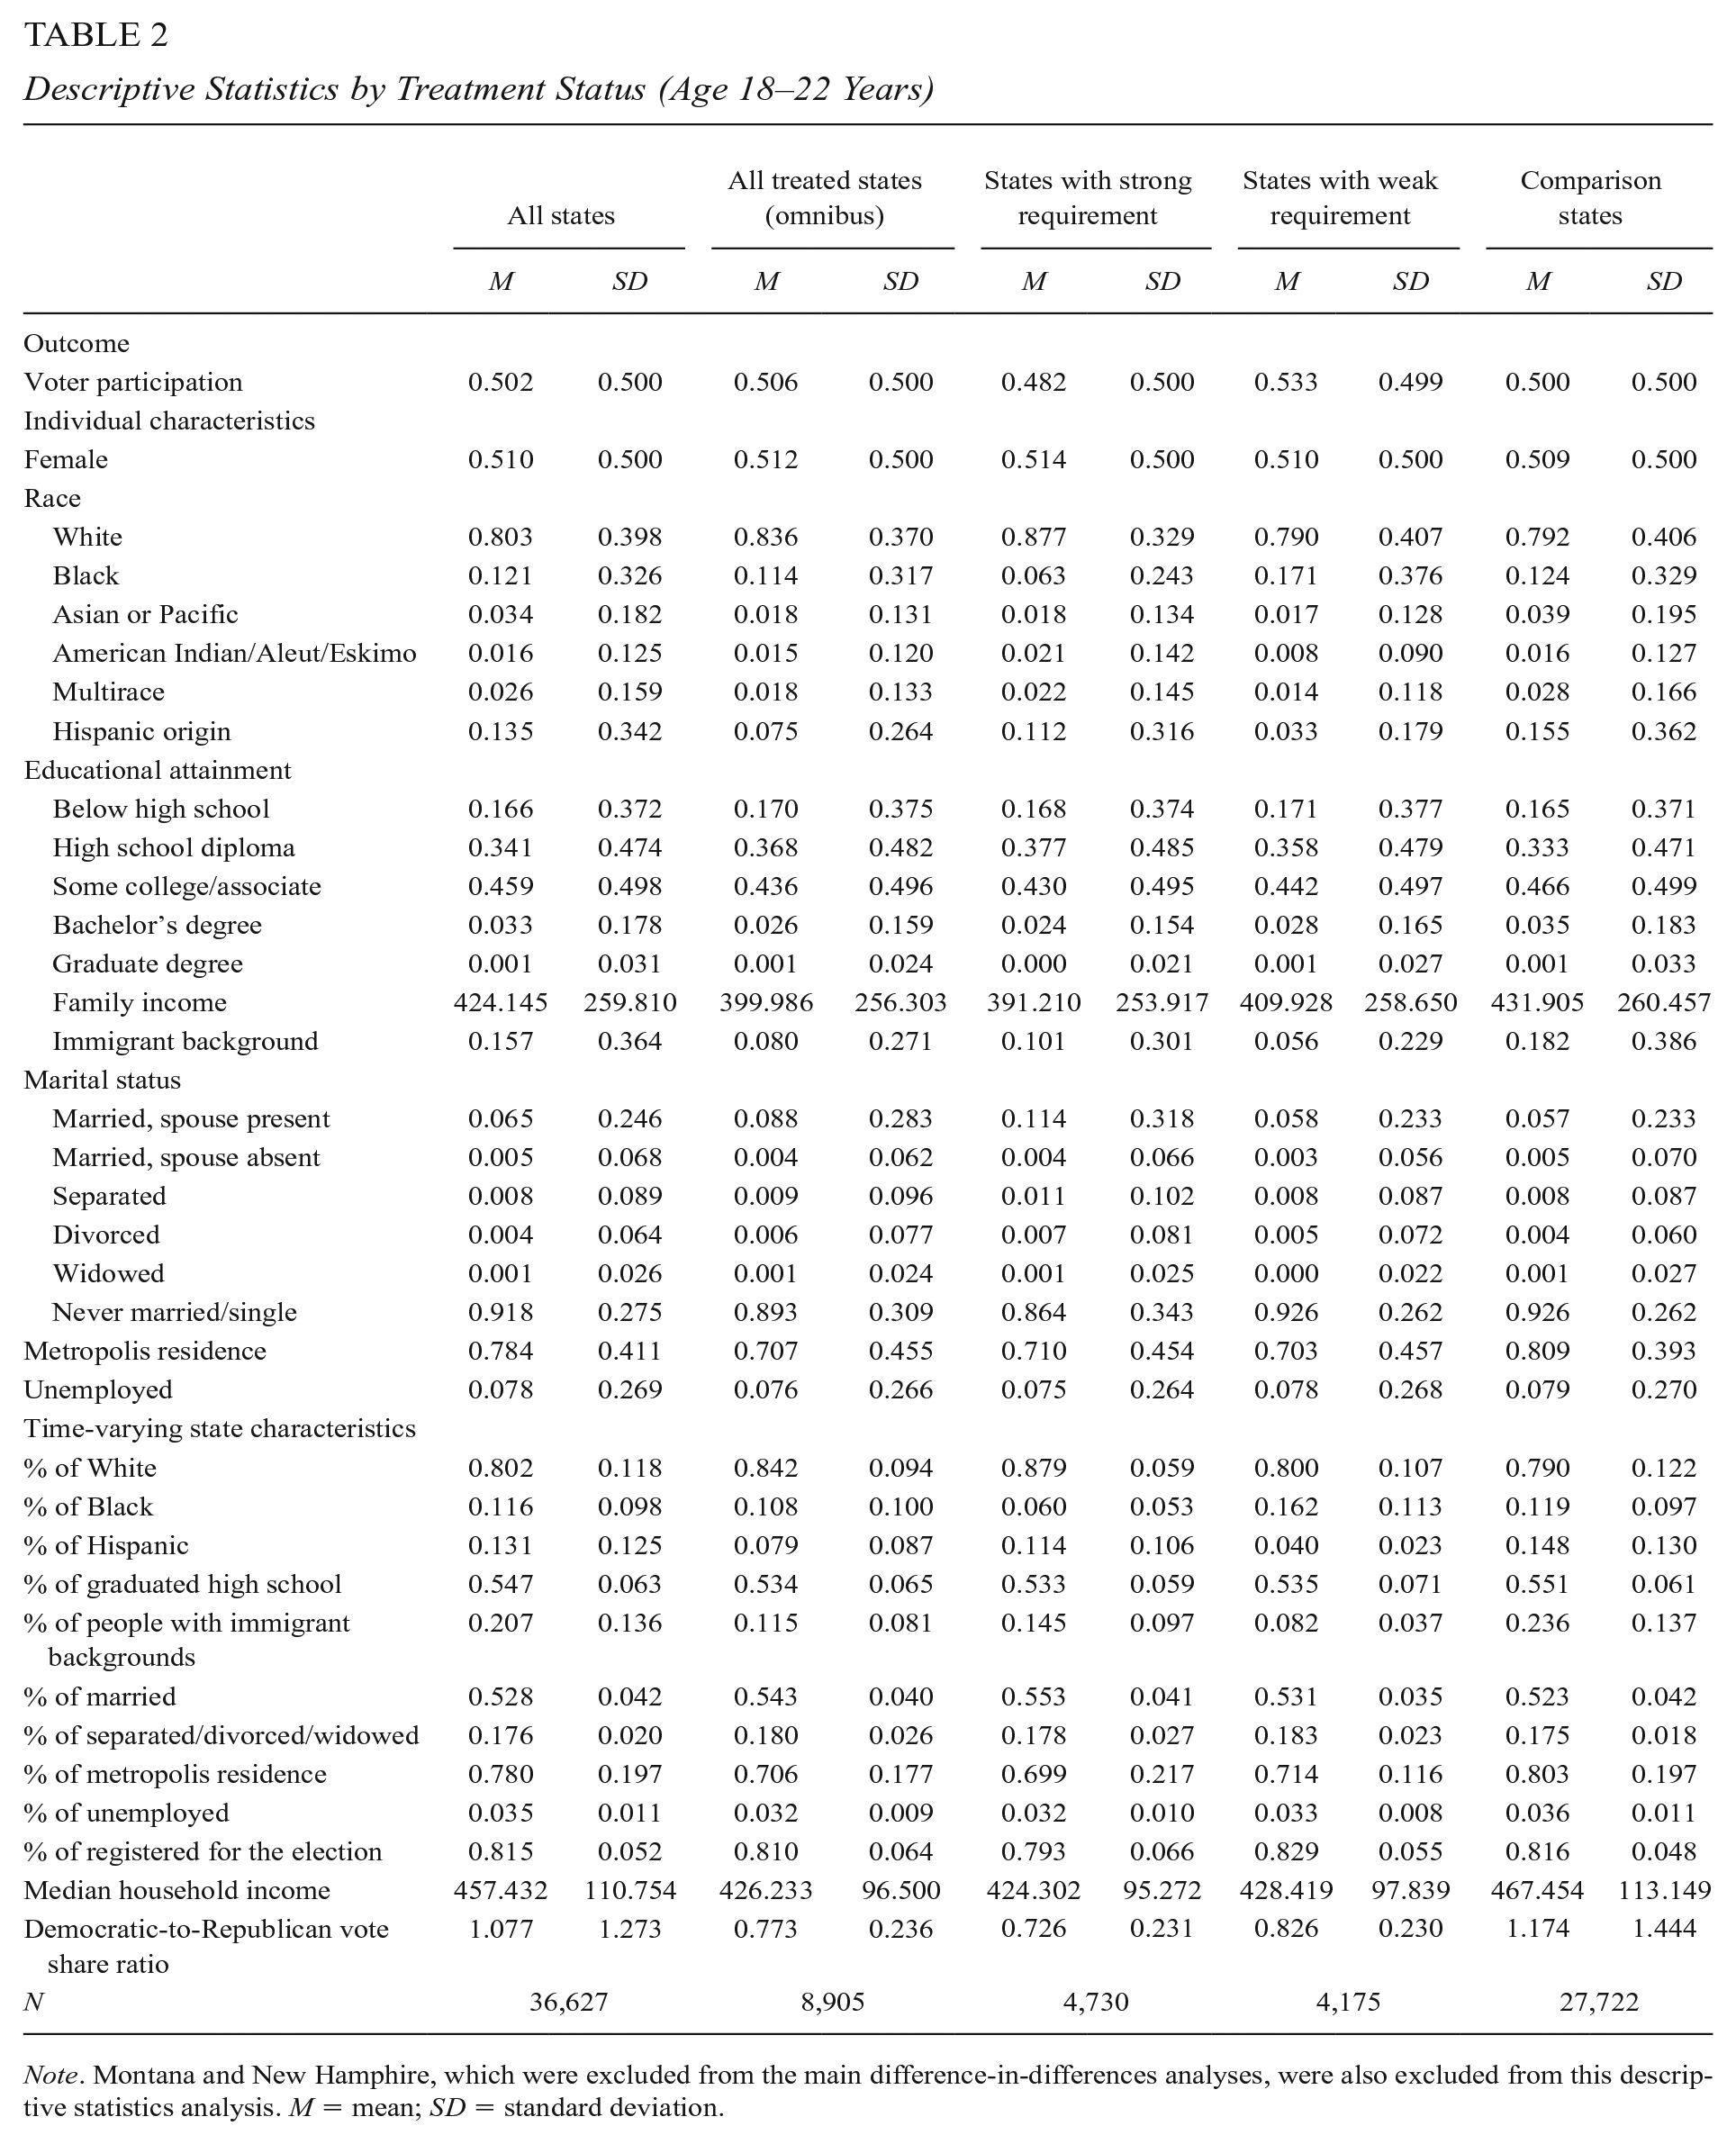
Note. Montana and New Hamphire, which were excluded from the main difference-in-differences analyses, were also excluded from this descriptive statistics analysis. M = mean; SD = standard deviation.
We find noticeable differences in demographic and socioeconomic characteristics, including race/ethnicity, immigrant background, and family income. However, voter participation is similar across four group categories. We explore these trends further below.
Figure 1(a)–1(c) show the trends of turnout among young voters (18–22 years old) in treatment states relative to comparison states from 1996 to 2020. First, we compared all states that implemented CEI omnibus treatment to comparison states (Figure 1(a)). Next, we split treatment states into two groups—states with a strong requirement and states with a weak requirement. Figure 1(b) and 1(c) shows trajectories of turnout in each group, respectively. The vertical line represents mid-2016 when Arizona adopted CEI as a pioneer. Several states soon followed (see Table 1 for detailed information). Visually, all three figures show parallel trends in voter turnout among 18- to 22-year-old voters prior to CEI (August 2016) providing confidence in the identification strategy. We include the event study graphs and more rigorous tests of parallel pretreatment trends in the “robustness checks” section.
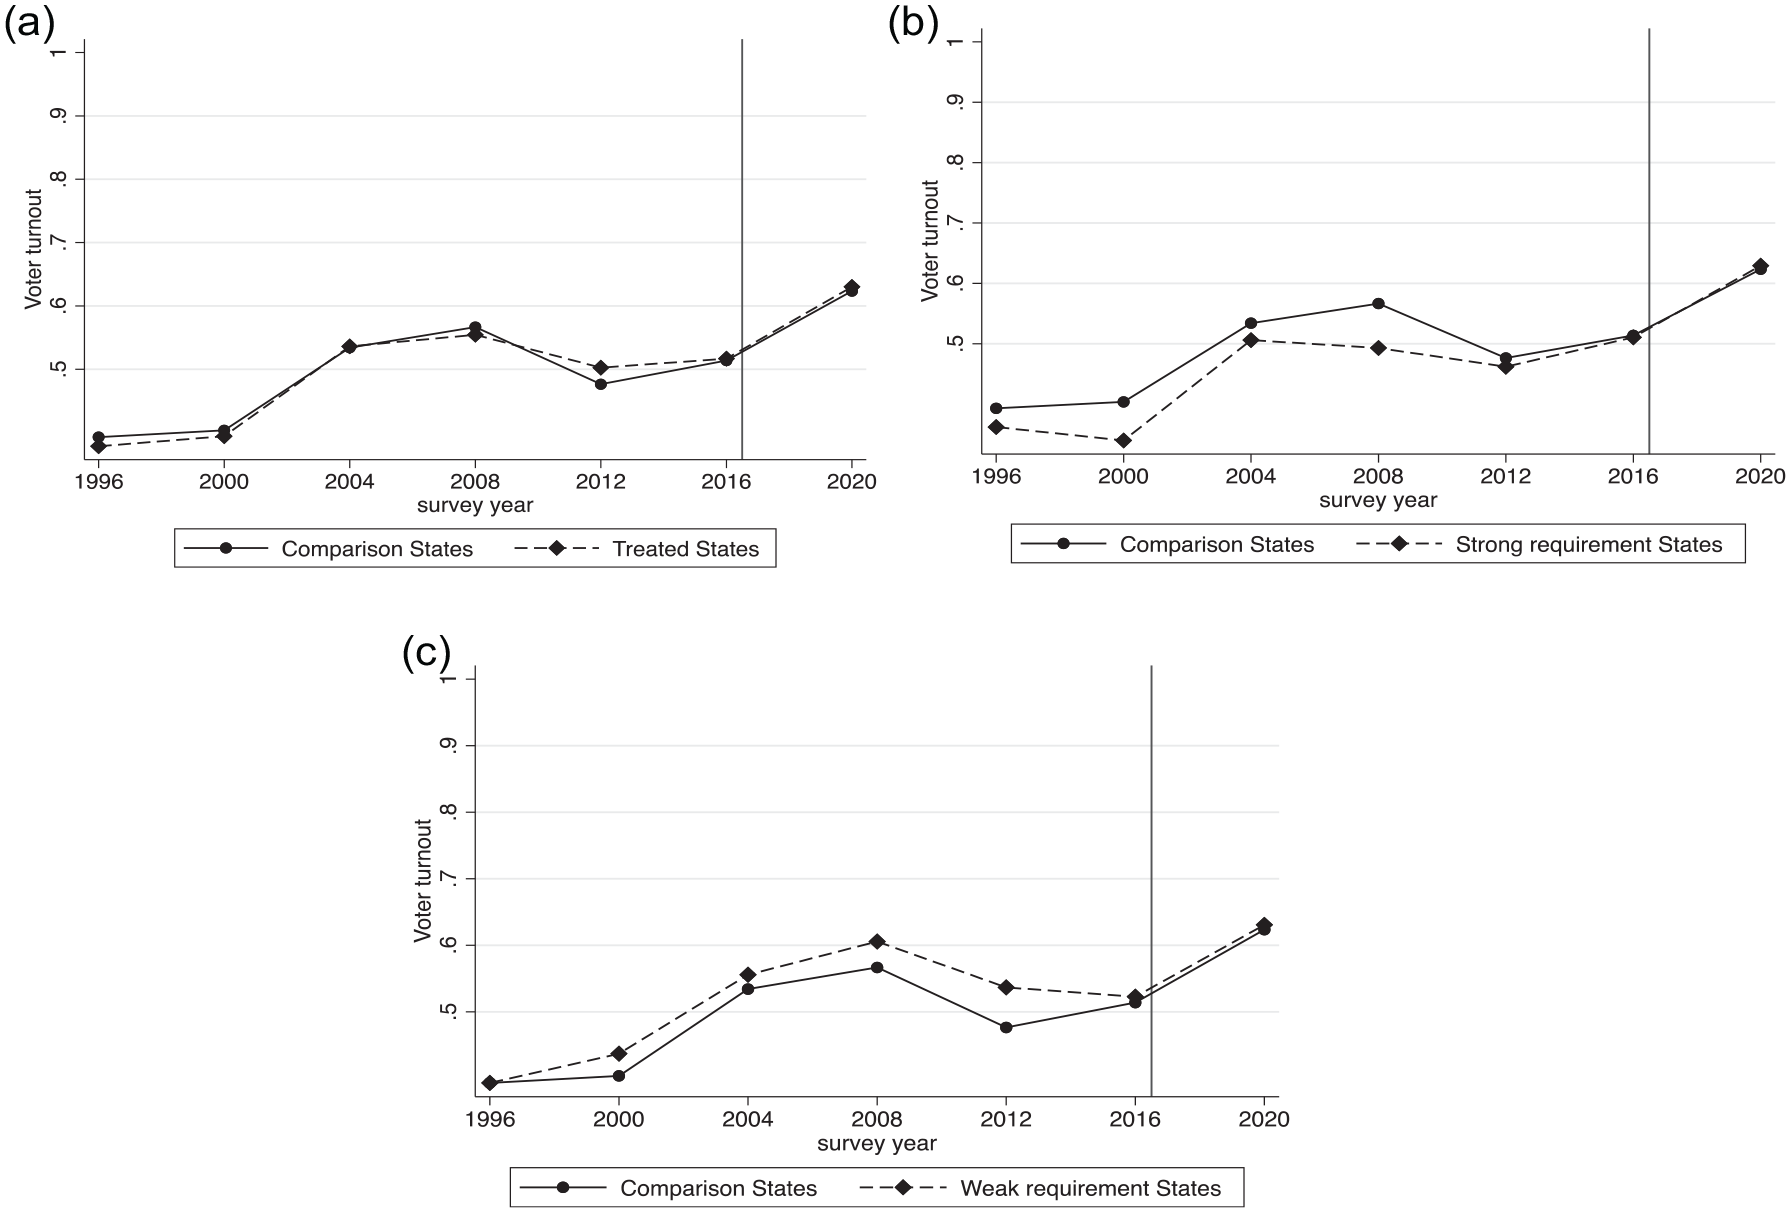
Raw trends in voter turnout among 18- to 22-year-old citizens. (a) Omnibus. (b) Strong requirement. (c) Weak requirement. The vertical line represents mid-2016 when Arizona adopted CEI as a pioneer.
Results
Table 3 reports the difference in differences (DD) estimates of the effect of CEI on young voter turnout. First, we estimate the effect of the omnibus treatment (Models 1–5 in Table 3). Model 1 only includes state- and year-fixed effects, Model 2, preferred model, includes individual covariates, and Model 3 includes both individual- and state-level time-varying covariates. In Models 4 and 5, we add the general linear trend control and state-specific linear trend control, respectively. We find that the omnibus CEI treatment did not have a significant detectable effect on young voter turnout across all models with different sets of covariates. Specifically, the DD coefficient in our preferred model is −0.002 (95% confidence interval [CI] = [−0.045, 0.042]), which is not statistically significant at p < .05. In terms of precision of our estimates, we rule out CEI effects larger than 5 percentage points or about 10% on a base of approximately 50% voter turnout.
The Impact of the Civics Test Policy on Voter Turnout Among a Treated Age Group (18–22-Year-Old Citizens)
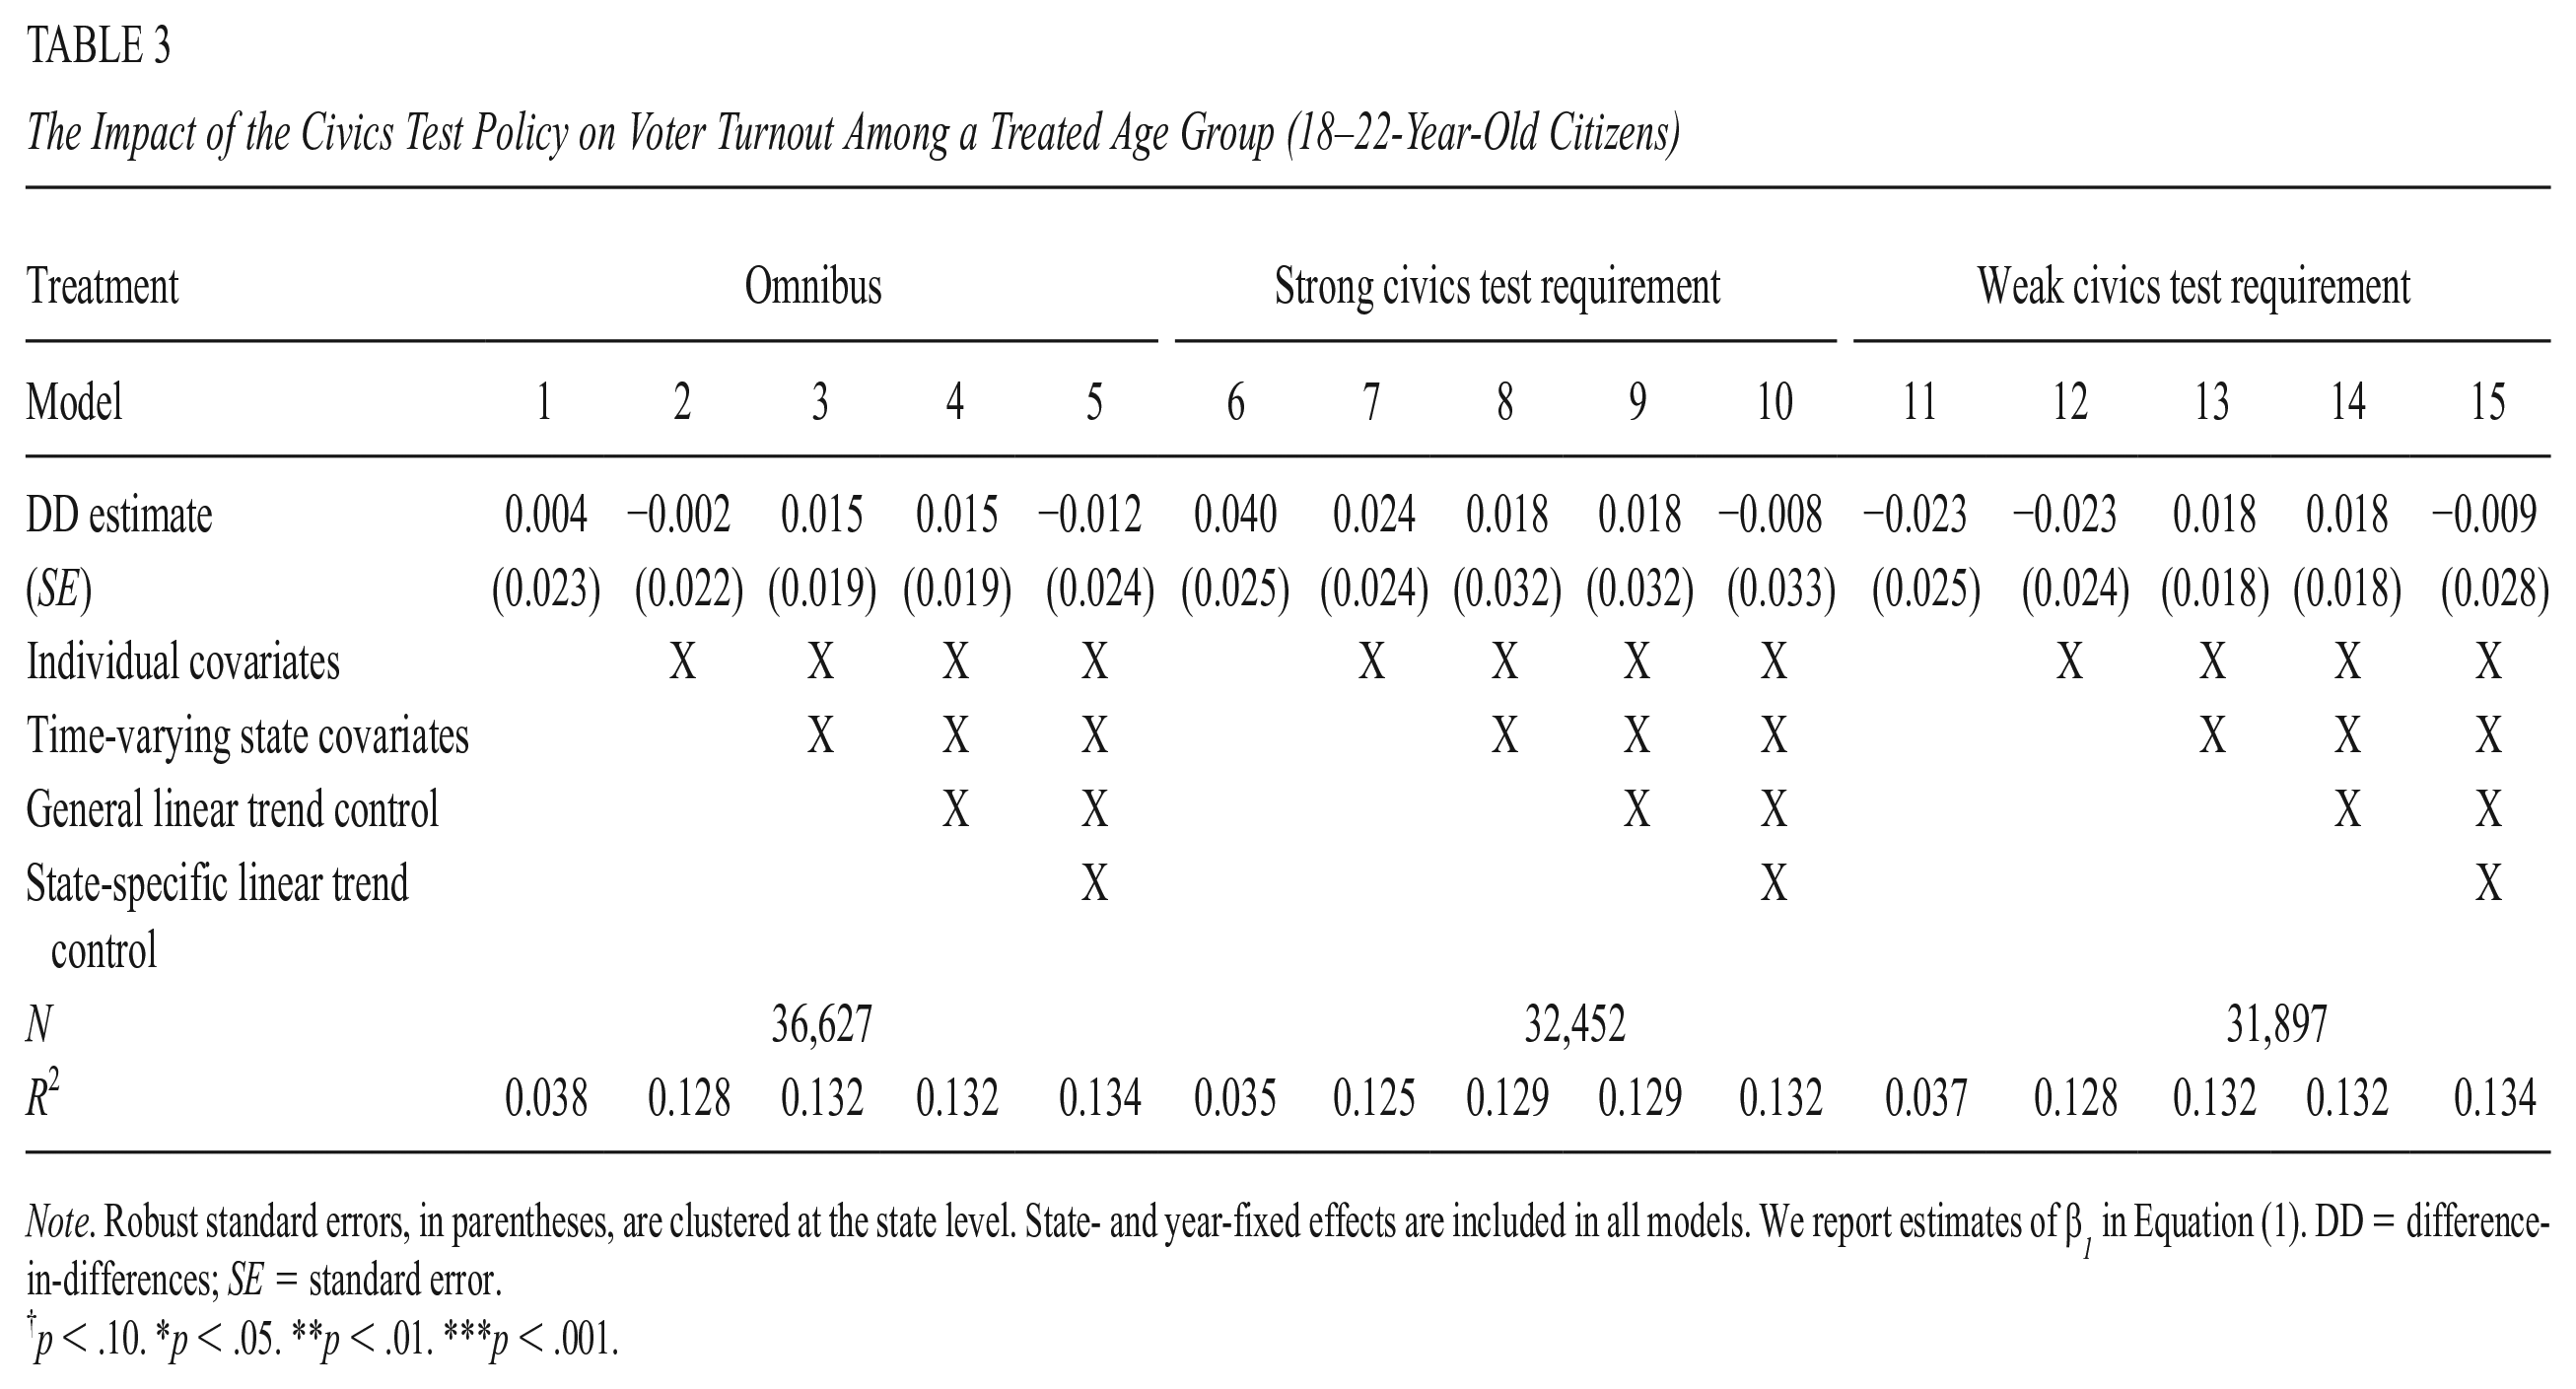
Note. Robust standard errors, in parentheses, are clustered at the state level. State- and year-fixed effects are included in all models. We report estimates of β1 in Equation (1). DD = difference-in-differences; SE = standard error.
p < .10. *p < .05. **p < .01. ***p < .001.
The results separated by two treatment arms—states with strong and weak civics test requirements in comparison with no CEI states—are presented in Models 6 to 10 and 11 to 15, respectively. Regardless of the intensity of requirement, CEI implementation did not significantly impact young voter turnout (strong requirement: b = 0.024, 95% CI = [−0.024, 0.073]; weak requirement: b = −0.023, 95% CI = [−0.071, 0.025] from our preferred model specification, Models 7 and 12).
Event Study Results
We present the results of event studies for each treatment in Figure 2. Figure 2(a) shows the effect of CEI (the omnibus treatment) on young voter turnout. Consistent with our DD results, the 95% CIs include zero in the postperiod, which implies that there were no statistically significant effects of CEI on voter turnout. Similarly, Figure 2(b) and 2(c), which shows the effects of strong and weak civics test requirement respectively, documents the null effect of CEI regardless of the intensity of requirement.
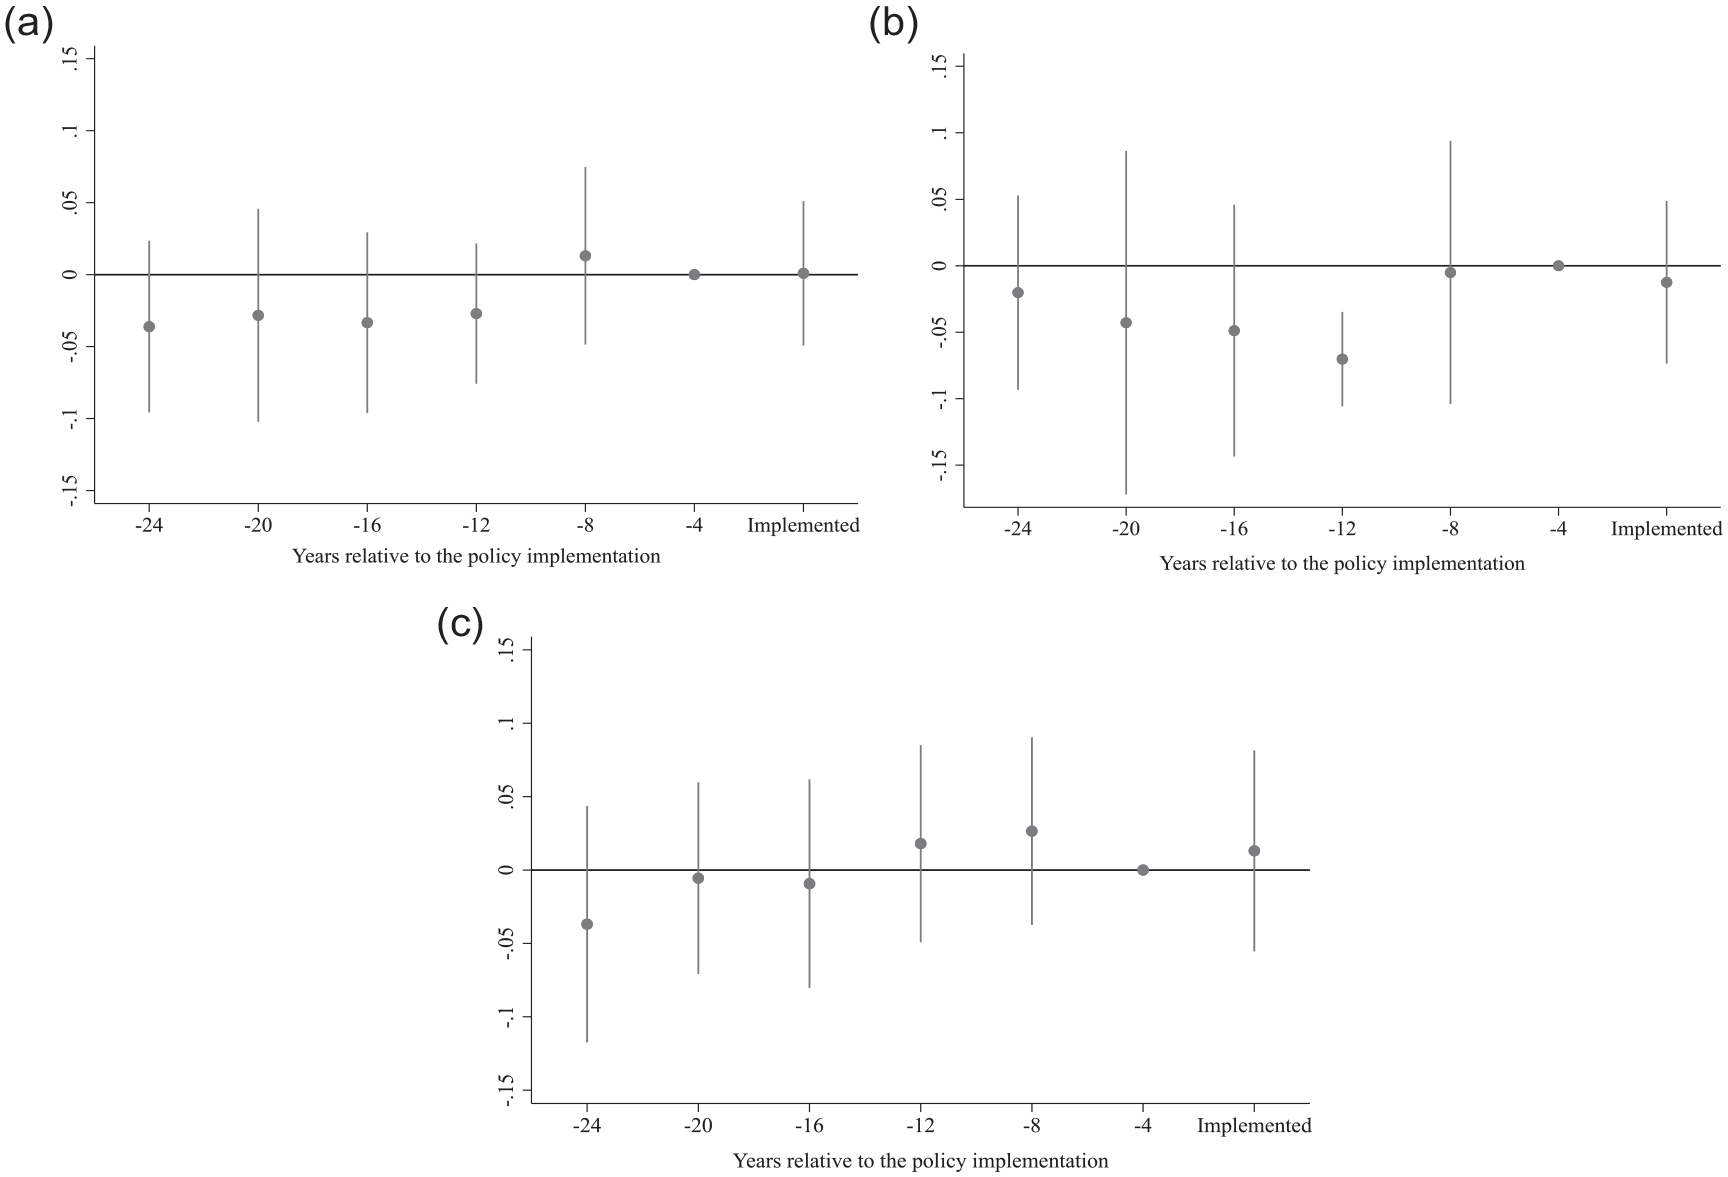
Event study graphs among a treated age group (18–22-year-old citizens). (a) Omnibus treatment. (b) Strong civics test treatment. (c) Weak civics test treatment.
In addition, in support of the parallel trends assumption, 95% CIs of coefficients of all corresponding pre-CEI implementation periods except the 2008 period for the strong civics test treatment (Figure 2(b)) include zero. Furthermore, we fail to reject the null hypothesis that there are no significant differences between the treatment and comparison states before CEI implementation (F = 1.20, p = .32 for the omnibus treatment; F = 1.87, p = .13 for the strong civics test treatment; and F = 2.07, p = .10 for the weak civics test treatment).
Heterogeneous Effects of CEI
Following Campbell and Niemi (2016) who found heterogeneous effects of civics requirement policy on civic knowledge, particularly among Hispanic students, we further examine whether the effect of CEI differs across demographic characteristics, including race/ethnicity, gender, and immigrant background, and present the results in Table 4. In addition, to examine whether results are robust to alternative age thresholds such as 18 to 20 years, we also explore heterogeneous effects across age. To economize on space, we only present heterogeneous effects of the omnibus treatment (all other results are fairly consistent and available on request).
Heterogeneous Impacts of the Civics Test Policy on Voter Turnout Among a Treated Age Group (18–22-Year-Old Citizens)
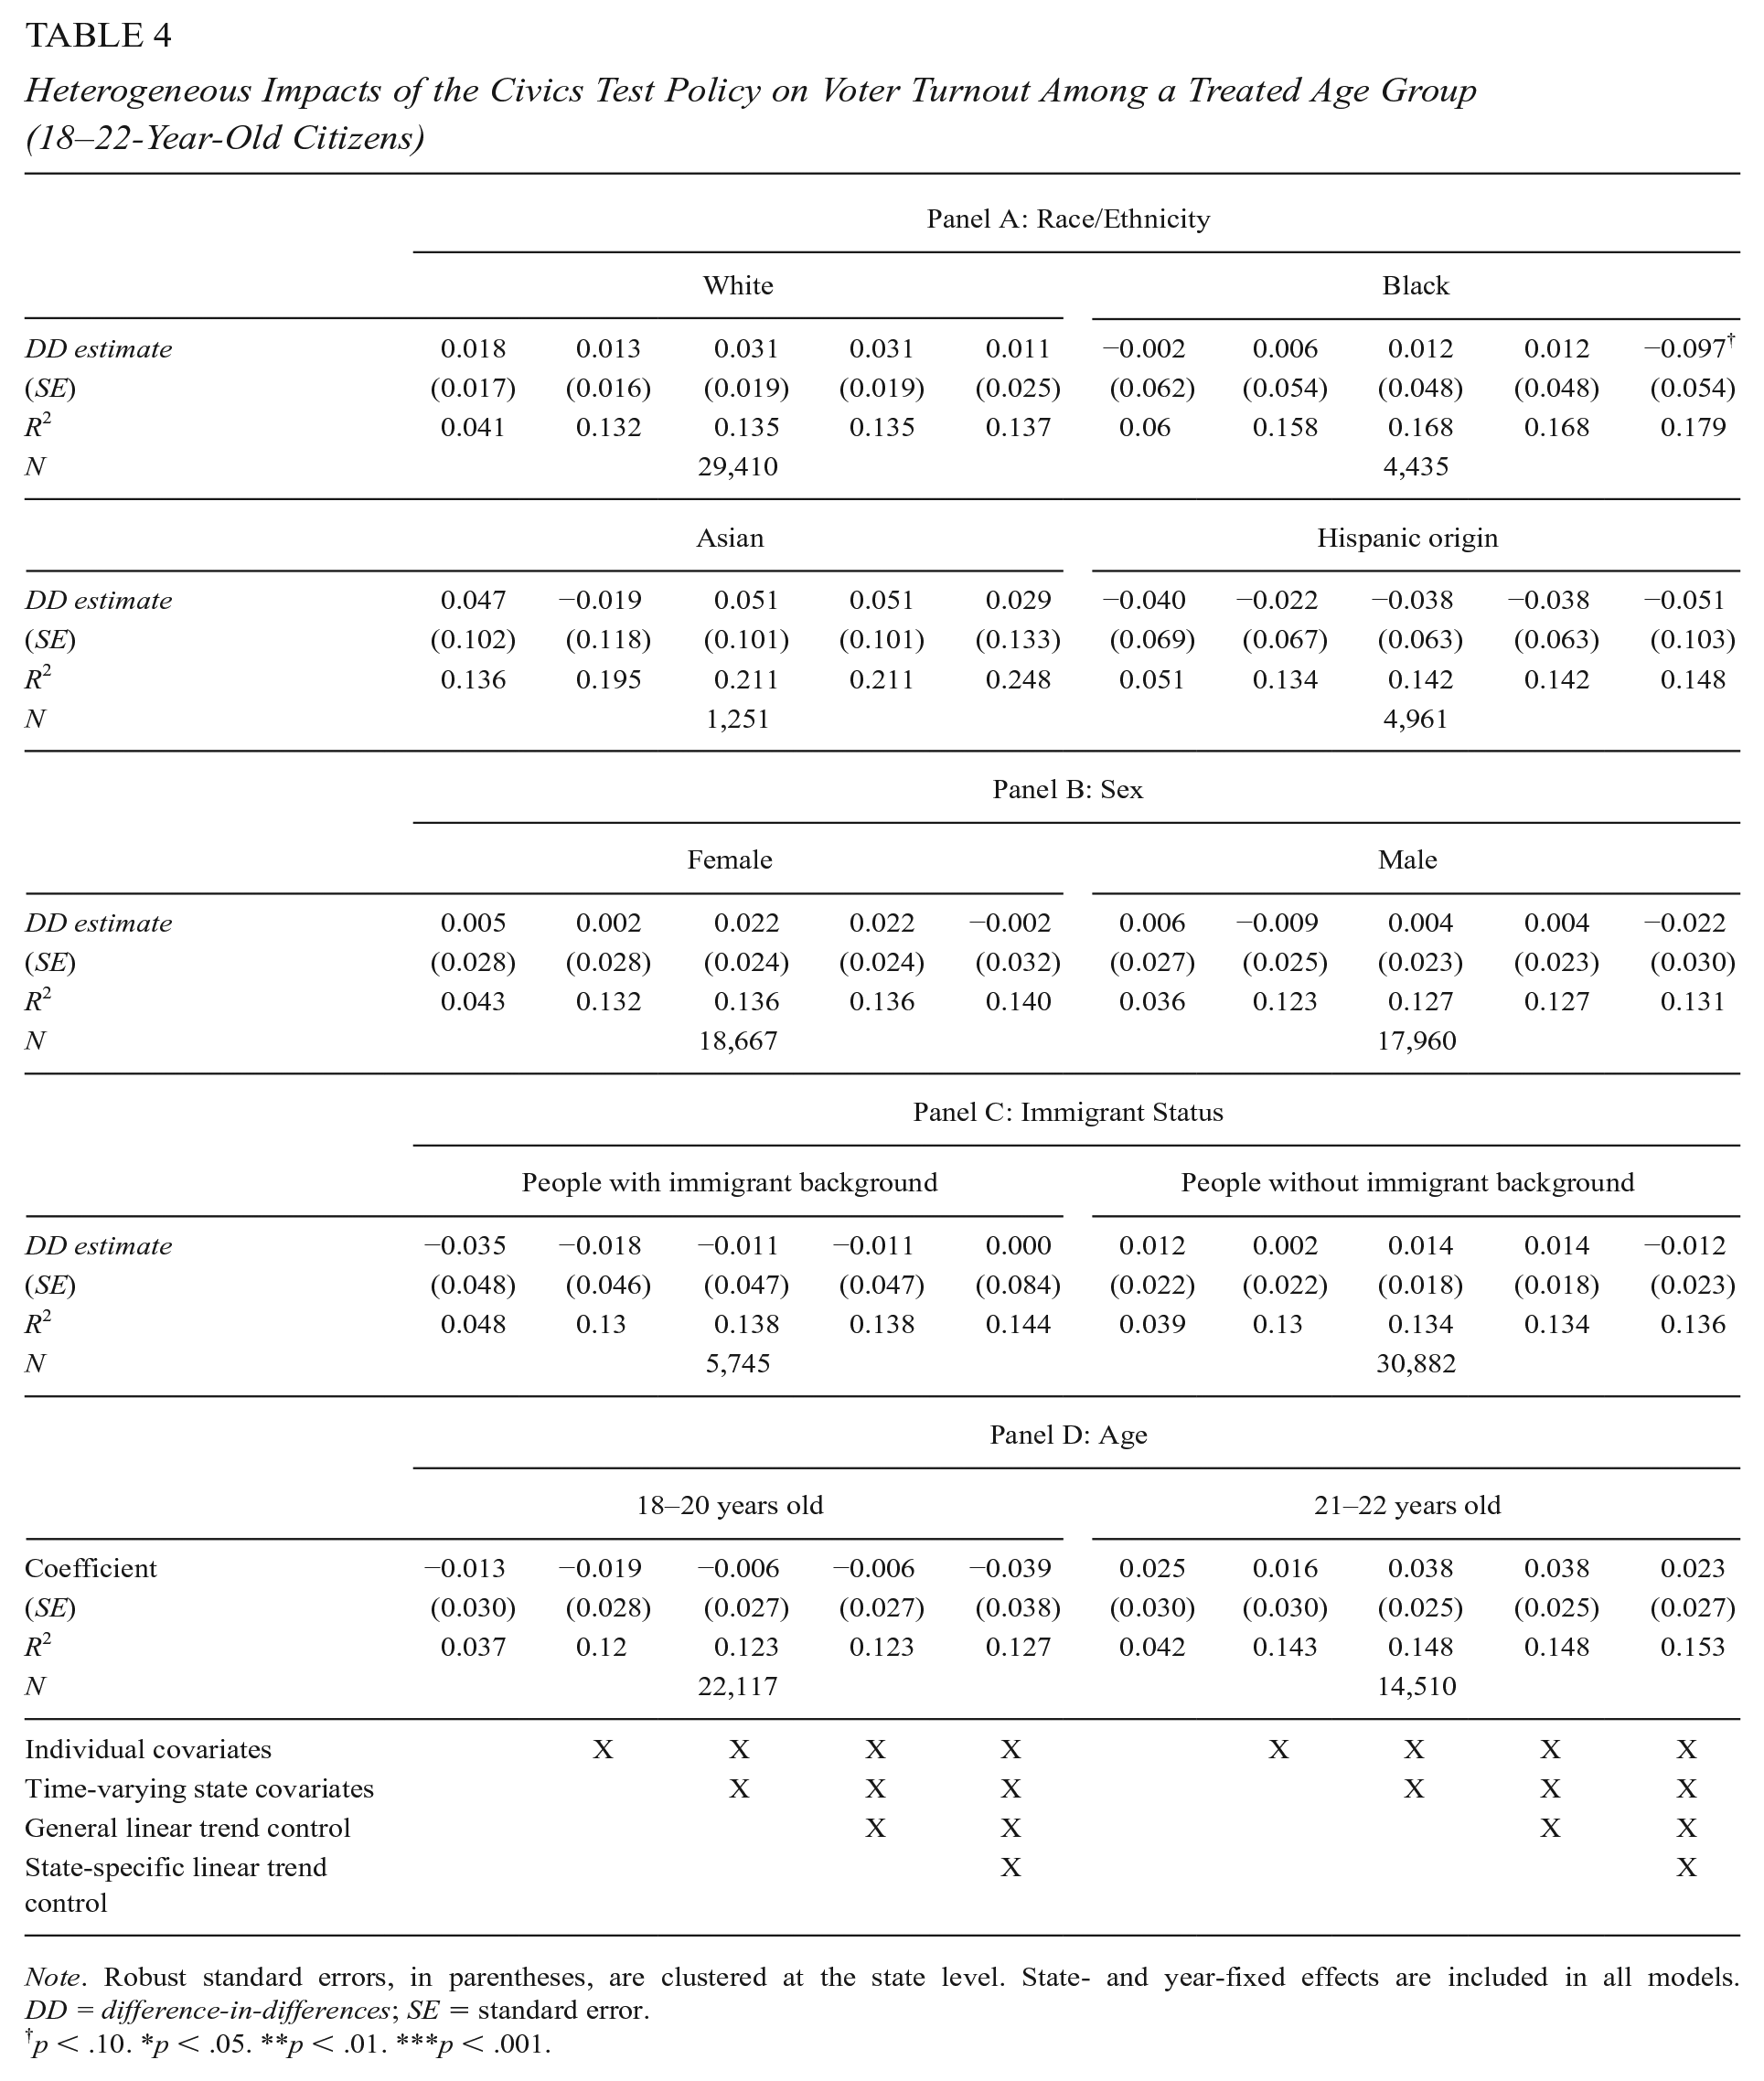
Note. Robust standard errors, in parentheses, are clustered at the state level. State- and year-fixed effects are included in all models. DD = difference-in-differences; SE = standard error.
p < .10. *p < .05. **p < .01. ***p < .001.
Across the board, we continue to find statistically insignificant null results. Concerningly, we found that Black young voters in states with CEI showed a 9.7 percentage point lower predicted probability of voting compared to Black young voters in comparison states, holding other covariates constant. Given the marginal significance level (p < .10), we interpret this result with caution; but going forward, research must continue to monitor heterogeneous effects by race/ethnicity given mixed theoretical and empirical evidence from prior literature.
Robustness Checks
In this section, we conduct four additional analyses to examine the robustness of our results—(a) placebo group checks, (b) triple differences (DDD) analysis, (c) alternative comparison group analyses to account for preexisting civic education/assessment policy differences across states, and (d) analyses with an additional state-level time-varying covariate—the Cost of Voting Index—to account for election law and voting-related policy differences across states and periods.
First, we conduct similar DD and event study analyses (following the same model specifications (1) and (2)) for a placebo group sample of 28 to 32 year olds as this group finished high school before CEI was implemented. The DD estimates of CEI effects on the placebo group are presented in Table 5. Models 1 to 5 show that there was no statistically significant effect of the omnibus CEI treatment on the voter turnout of the placebo group (b = −0.031, 95% CI = [−0.071, 0.009] from our preferred model specification). 7
The Impact of the Civics Test Policy on Voter Turnout Among a Placebo Group (28–32-Year-Old Citizens)
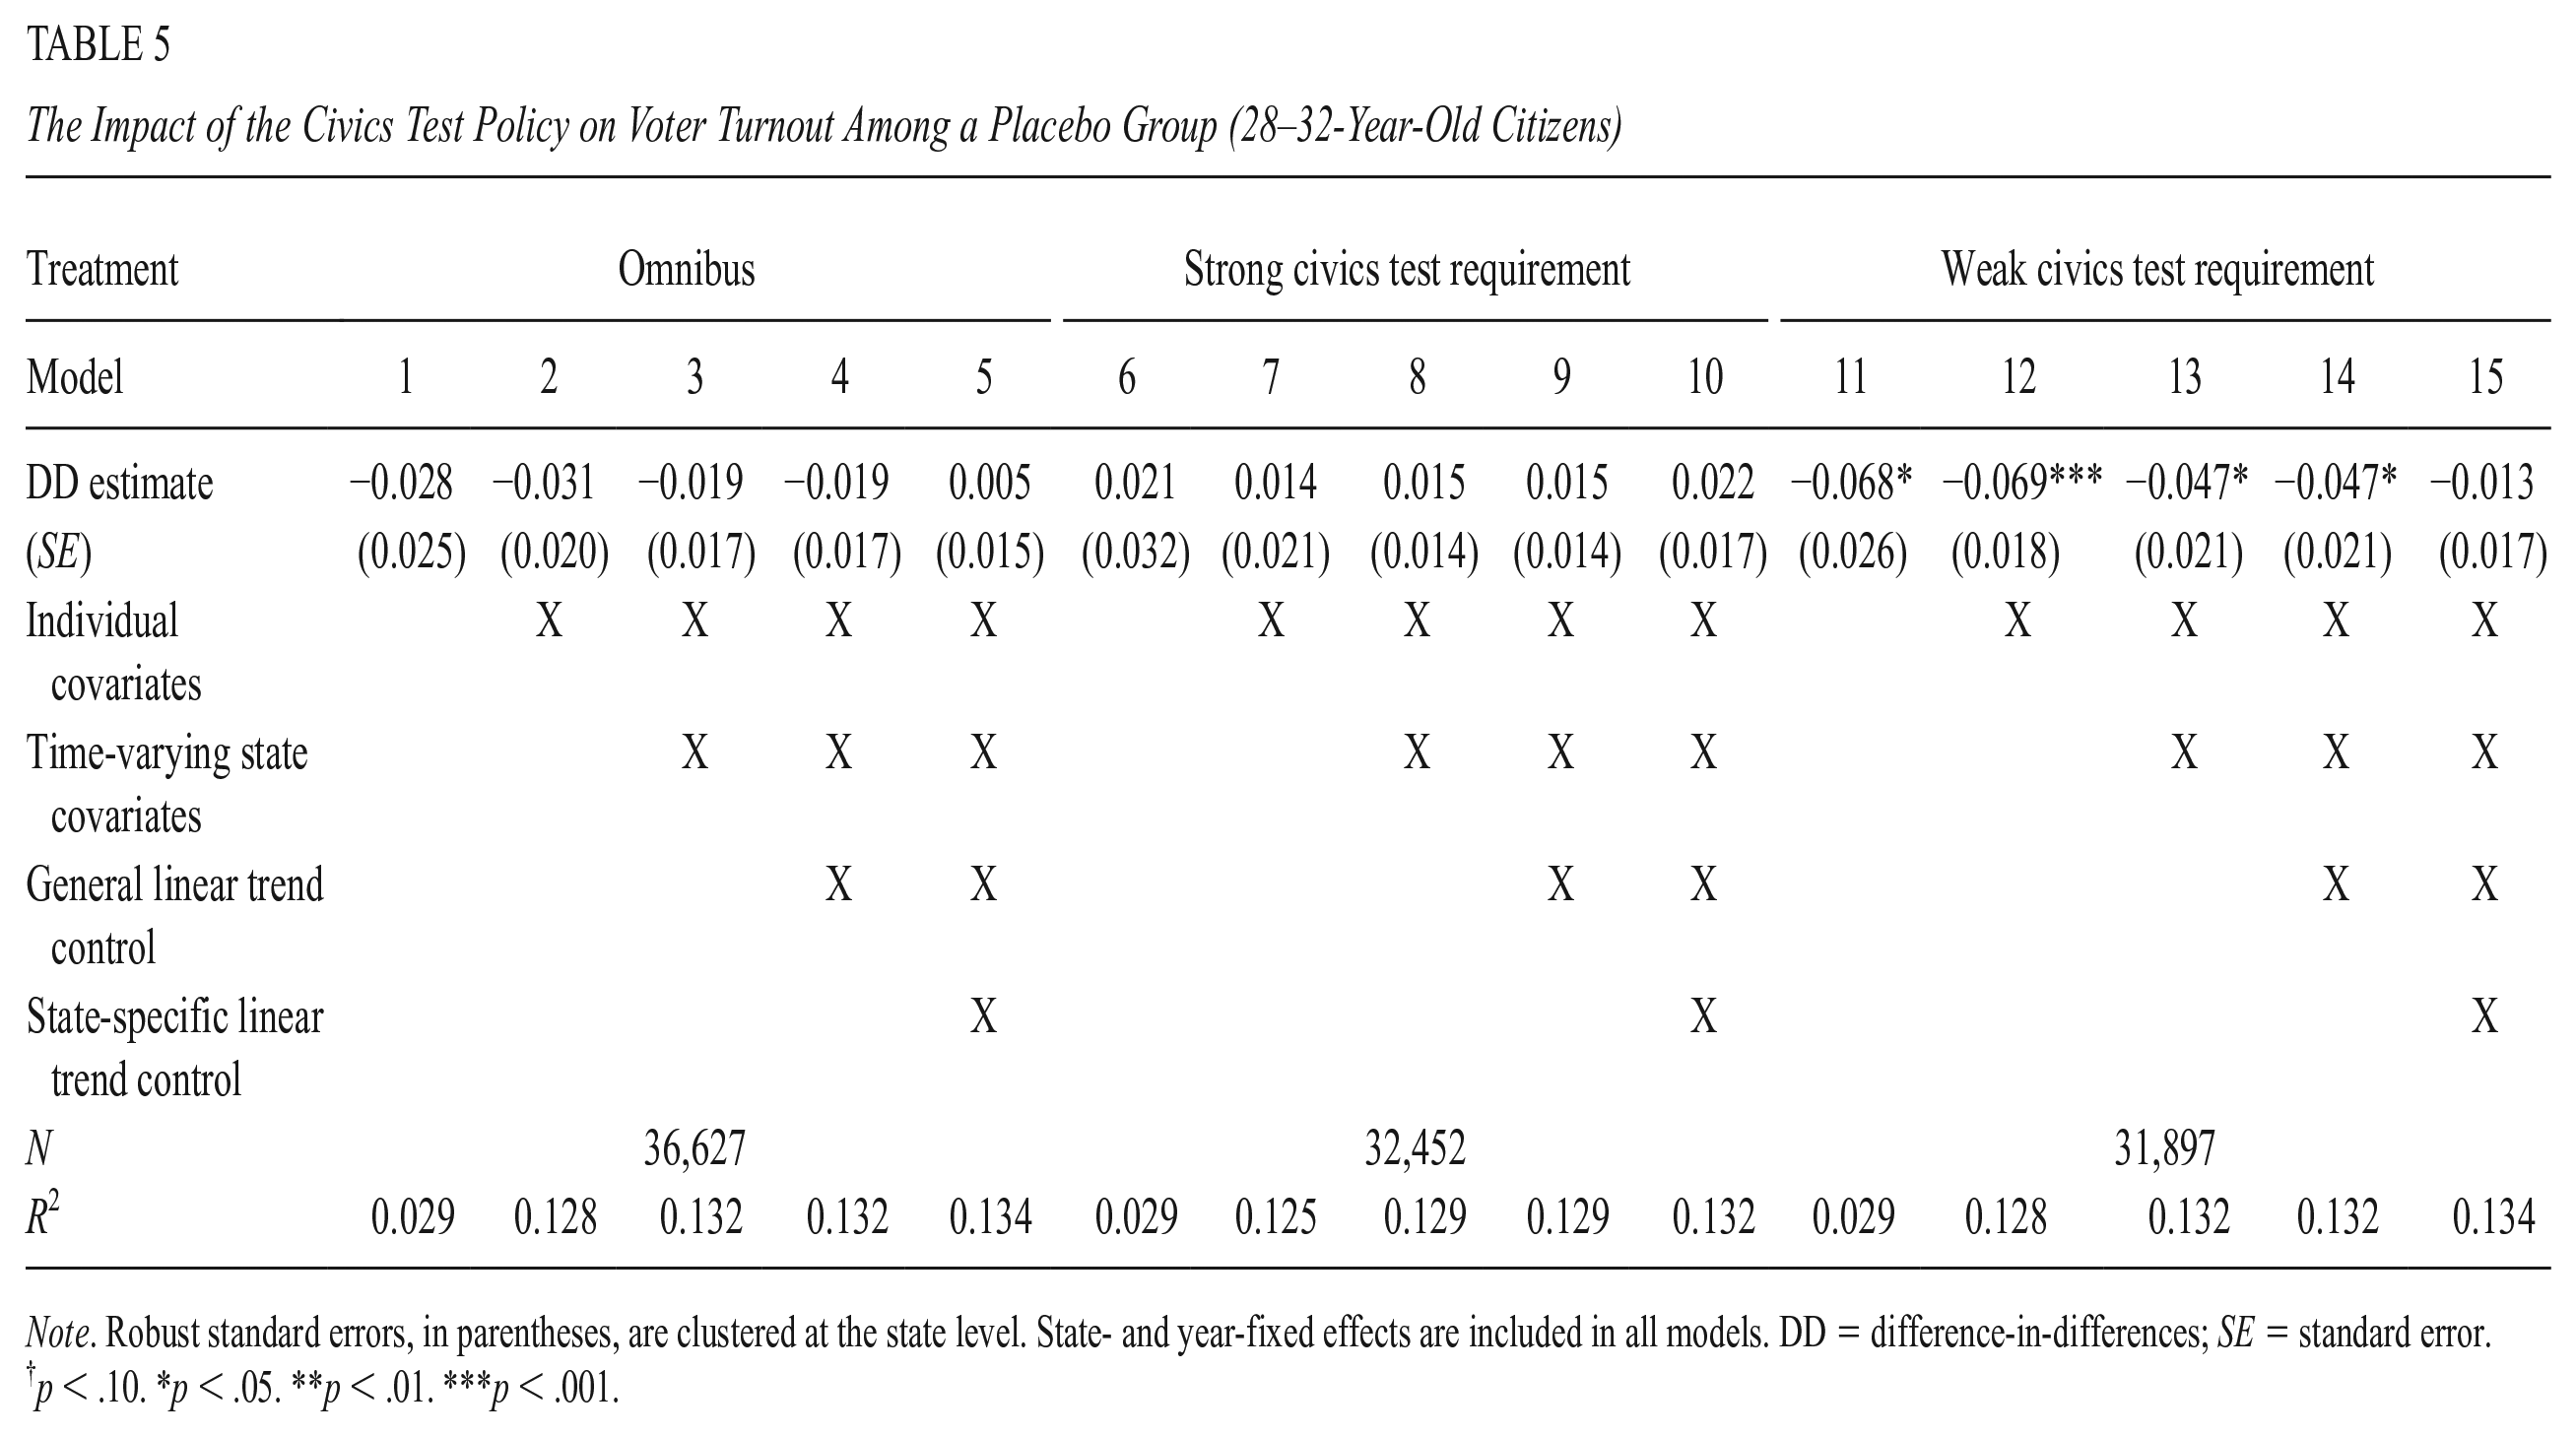
Note. Robust standard errors, in parentheses, are clustered at the state level. State- and year-fixed effects are included in all models. DD = difference-in-differences; SE = standard error.
p < .10. *p < .05. **p < .01. ***p < .001.
Second, we conduct a difference-in-differences-in-differences (DDD) analysis by adding a placebo stratum in the DD. The DDD design helps to remove the potential bias from state-level time-varying confounders that change differentially across states (Wing et al., 2018). 8 We report these results in Supplementary Table A1 in the online version of the journal. Similar to the DD analysis, we add individual-level covariates, state-level time-varying covariates, the general linear trend control, and state-specific linear trend control, one at a time in successive models. Consistent with the findings from the DD design, our DDD estimates show a null effect of CEI on young voter turnout (b = 0.036, 95% CI = [−0.011, 0.083] from our preferred model specification).
Third, we include two alternative comparison groups in our analysis to test the sensitivity of our core results. The canonical DD research designs compare treated units with not-yet-treated or control units before and after treatment implementation to estimate the causal effects of the treatment. In other words, DD models rely on making “clean” comparisons between treated and control units. While all the states in our baseline comparison group did not adopt CEI prior to 2020 and are thus technically “clean” comparison groups, some of them had other strong civics course curricula or assessments in high schools. To disentangle that likely confound, we define two alternative comparison groups.
First, using state-level data on enrollment in AP U.S. History and AP Government (a proxy for other CEIs), we exclude states that had AP U.S. History or AP Government enrollment in the upper quartile in 2015 from our comparison group. 18-22-year-old citizens in states that implemented CEI show an average 2.6 percentage point increase, though statistically nonsignificant, in the probability of voting compared to those in states that had no CEI and relatively low enrollment in AP U.S. History/Government (b = 0.026, 95% CI = [−0.019, 0.071] from our preferred model specification in Table 6). Second, we exclude states that had a state-mandated civics assessment and course policy in 2012 from our comparison group, using information from Campbell and Niemi (2016). The results, presented in Table 7, show that there was a negative but not statistically significant effect of CEI on young voter turnout (b = −0.042, 95% CI = [−0.090, 0.007] from our preferred model specification). Taken together, the findings show that requiring a mandatory civics test for high school graduation, when compared to states with no strong civics test requirements, does not affect voter turnout rates.
Difference-in-Differences Analyses Without States With AP U.S. History/Government Enrollment in Upper Quartile in 2015
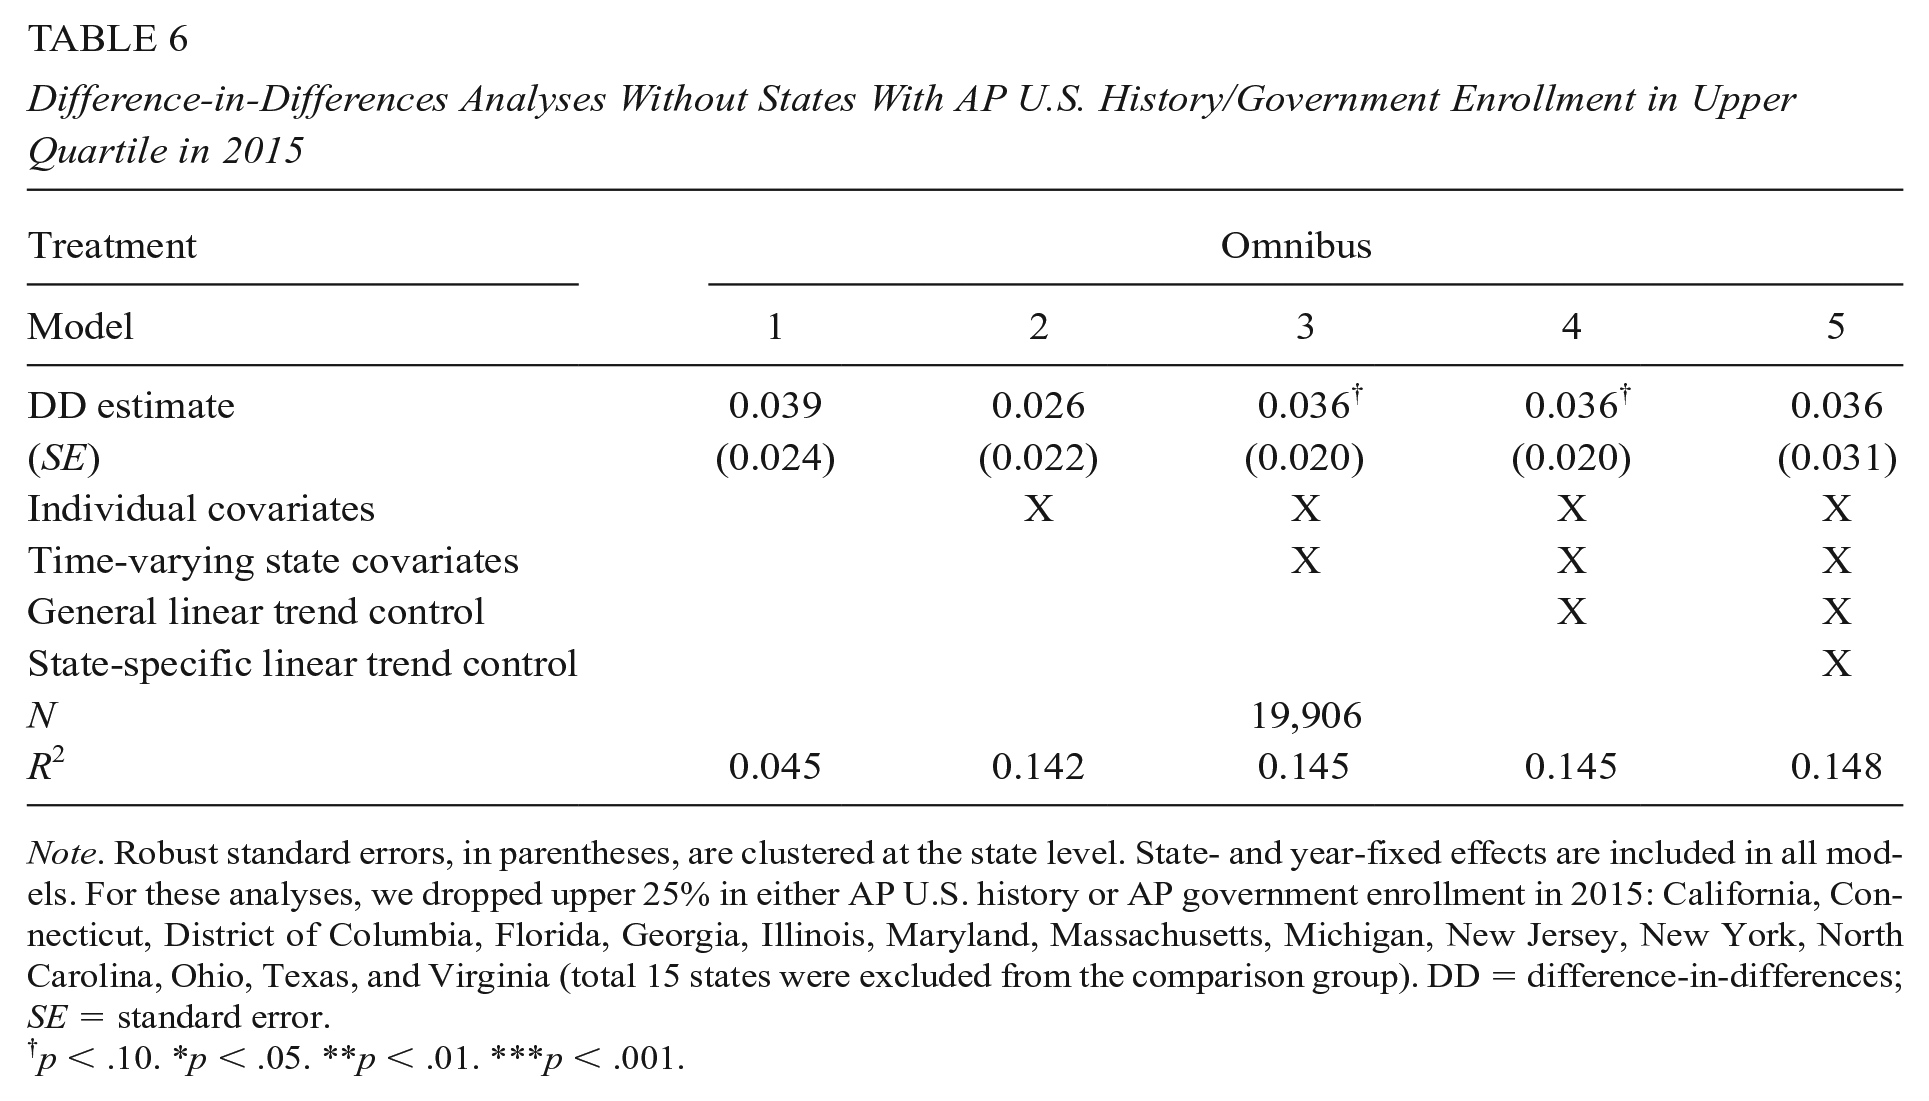
Note. Robust standard errors, in parentheses, are clustered at the state level. State- and year-fixed effects are included in all models. For these analyses, we dropped upper 25% in either AP U.S. history or AP government enrollment in 2015: California, Connecticut, District of Columbia, Florida, Georgia, Illinois, Maryland, Massachusetts, Michigan, New Jersey, New York, North Carolina, Ohio, Texas, and Virginia (total 15 states were excluded from the comparison group). DD = difference-in-differences; SE = standard error.
p < .10. *p < .05. **p < .01. ***p < .001.
Difference-in-Differences Analyses Without States With Strong Civic Education Requirement in 2012
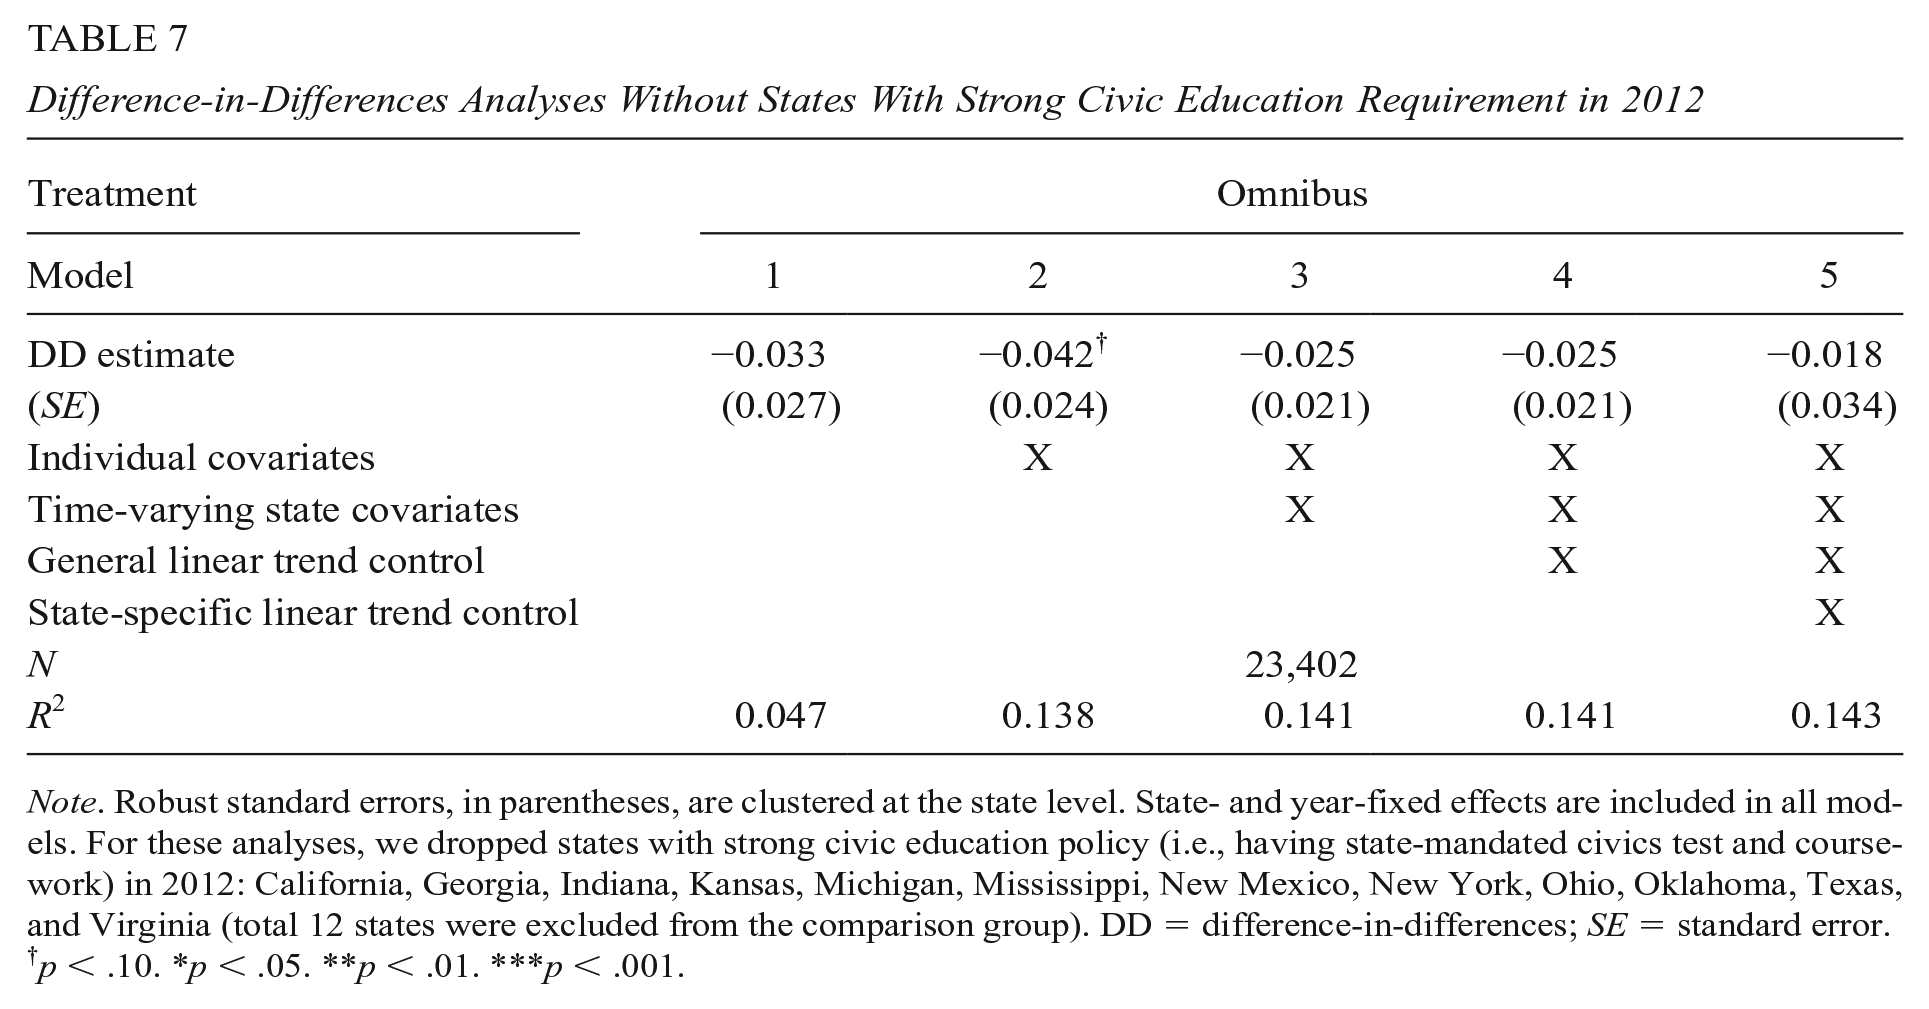
Note. Robust standard errors, in parentheses, are clustered at the state level. State- and year-fixed effects are included in all models. For these analyses, we dropped states with strong civic education policy (i.e., having state-mandated civics test and coursework) in 2012: California, Georgia, Indiana, Kansas, Michigan, Mississippi, New Mexico, New York, Ohio, Oklahoma, Texas, and Virginia (total 12 states were excluded from the comparison group). DD = difference-in-differences; SE = standard error.
p < .10. *p < .05. **p < .01. ***p < .001.
Finally, we include the Cost of Voting Index (Schraufnagel et al., 2022) in our model as a state-level time-varying covariate to account for state voting laws. Voting laws are an important factor in voter turnout—policies that ease voting increase turnout (Grumbach & Hill, 2022; Holbein & Hillygus, 2016; Yu, 2019). Therefore, our DD estimates could be biased if state voting laws changed between 2016 and 2020, or if CEI adoption was endogenous to state laws. To isolate the CEI effect from state voting laws changed between 2016 and 2020, we use the Cost of Voting Index, which reflects (a) registration deadline, (b) voter registration restrictions, (c) registration drive restrictions, (d) preregistration laws, (e) automatic voter registration, (f) voting inconvenience, (g) voter ID laws, (h) poll hours, (i) early voting days, and (j) absentee voting (Schraufnagel et al., 2022). We report results of DD models with the voting index in Supplementary Table A4 in the online version of the journal. Consistent with the findings from the main DD in Table 3, the results show a null effect of CEI on young voter turnout (b = −0.002, 95% CI = [−0.045, 0.042] from our preferred model specification).
Limitations
It is important to note that our estimates are “ITT” estimates. The CEI effect could be underestimated because young voters who were likely not exposed to the CEI policy could have been included in the treatment group due to data limitations. Specifically, due to exemption rules for student groups, treatment groups might include students who were not exposed to the civics test even in states that adopted the policy. For example, Nevada exempts some English learners and students doing Individualized Education Programs (IEPs) from the civics test requirement (Brennan & Railey, 2017). Therefore, those students should be categorized into the untreated group. Even though English learners and students with IEPs account for only a small proportion of the total population, including them in the treatment group may result in an underestimation of the policy effect. In sum, owing to this noise in the treatment group, the estimated effect could be smaller than the “true” policy effect. Therefore, this should be considered a conservative estimate, ITT, of the civics test policy’s effect on voter turnout.
Second, the CPS does not have information on respondents’ residences during high school; thus migration across states post high school cannot be estimated very clearly. Given that some students move to other states to attend college, it is likely that distinguishing between the treatment group and comparison group based on residence at the time of survey interviews is imperfect. That said, past research shows that the vast majority of college students who were registered to vote did so in their hometowns (Niemi & Hanmer, 2010). Given the unprecedented shutdown of college campuses amid COVID-19 in 2020, it is likely that college students voted in their hometowns (or used mail-in-ballots), which further bolsters confidence in our decision to use state of residence at the time of surveys as a proxy for treatment/control exposure as well as outcome analysis. 9 Therefore, we do not believe that this data limitation biases our results substantively.
Third, this study does not account for differences in treatment “dosage” (beyond simplistic categorizations of strong vs. weak policy adoptions) or fidelity of implementation. To be specific, since several states customized their CEI, details of the policy differ by state. For example, some states had slightly different passage standards (e.g., 60% in Wisconsin vs. 70% in Tennessee). In addition, some states, such as Arizona and Arkansas, allow students to retake the test to pass it. While our study provides an average ITT effect of policy adoption, additional nuance on policy implementation might reveal heterogeneity that future research could explore.
Fourth, even though we used a DD design to isolate the effect of CEI, we acknowledge the potential bias in estimations likely to occur due to time-varying omitted variables at multiple levels. Specifically, if there were omitted state-level time-varying covariates that are correlated with youth voter turnout and states’ decisions to adopt CEI—for example, other voting-related policies that are not captured by the Cost of Voting Index—our estimates could be biased.
Finally, it is important to note that we examined a short-term effect of CEI on voting given that CEI was adopted just 4 years before the election at most. It is possible that the effect had not shown up yet because states and schools needed time to adjust to the new test policy, especially given that the test is administrated by local agents such as school districts or schools in some states. However, anecdotally, we find that the civics test is often given to students as a separate task without noticeable efforts to link it to the social studies curriculum; we remain skeptical regarding the efficacy of this approach in improving voter turnout. Future studies should examine the long-run effect of the policy.
Discussion and Conclusion
This study is the first to examine the causal effect of a state-mandated civics test policy on youth voter turnout. Using nationally representative data of young voters from 1996 to 2020 and difference in differences and event study designs, we found no detectable effect of state-mandated civics test policy—the Civics Education Initiative (CEI)—on youth voter turnout. Specifically, our preferred model provides a fairly precise estimate of a null effect (b = −0.002, p > .05; 95% CI = [−0.045, 0.042]), robust across several alternative specifications. That said, we are cautious in our interpretation because we do not have sufficient power to rule out very small effects of CEI (i.e., estimates smaller than 5 percentage points), which would be considered small but still quite not null based on prior literature on voter turnout.
These largely null results are unsurprising, however, in this context. Proponents of state-mandated civics test policy argue that such tests ensure that students have the bare minimum political knowledge to actively engage in politics (Civics Education Initiative, 2017). Yet, the causal chain linking civics test policy to civic knowledge and ultimately to political participation seems rather weak. First of all, adopting a mandated civics test does not guarantee that civics/history will suddenly be well-taught in schools despite rhetoric—“If it is tested, it is taught” (Civics Education Initiative, 2017). Furthermore, to our knowledge, states that adopted CEI did not adopt any new civic curriculum closely associated with the exam. Rather, they provided schools and districts with a document that included an exhaustive list of questions and answers that had to be incorporated into existing social studies curriculum (e.g., Idaho State Department of Education, 2023).
Second, studying for a civics test may not necessarily improve political knowledge, especially the knowledge relevant to increase active voting participation. For example, Holbein and Hillygus (2020, Chapter 5) pointed out that applied political learning is much more effective than rote memorization of general facts about government when it comes to increasing youth voter turnout. Given that CEI uses questions from the publicly available naturalization exam, students may simply memorize answers. Indeed, Quizlet, an online platform/application, provides flashcards to memorize simple facts to prepare for the test (e.g., Nella Rosella, 2023). This rote memorization probably helps students pass the test; however, it is highly questionable whether it will help students gain political knowledge or motivate them to participate more actively in the political process.
On the other hand, recent experimental studies that examined the effect of voting information on youth voter turnout (e.g., how to register to vote) found significant impacts on voter registration and turnout (Bennion & Nickerson, 2016; Bergan et al., 2022) than the CEI effect. Furthermore, students who participated in voting-related activities at a high school, including a get out the vote campaign and visiting elected officials, showed about 7.2 percentage points higher rates of voter turnout than comparison students (Gill et al., 2018). Similarly, Cohodes and Feigenbaum (2021) showed that broad-based curricula that promote noncognitive skills in high-performing charter schools improved not just young voter turnout among girls by 6 percentage points but also spilled over to their parents.
Even when comparing turnout among young citizens in states that adopted CEI with comparison states that had low civics coursework participation or education requirements, we found null effects across the board. Our results provide further suggestive evidence regarding the persistent gaps between civic knowledge and engagement, at least when operationalized as voter turnout. Even though prior research suggested that a civics test policy might increase youth’s political knowledge (Campbell & Niemi, 2016), it does not seem to increase voter turnout. Unsurprisingly, this finding is consistent with prior rigorous research that found no significant relationship between taking civics courses and voter turnout (Holbein & Hillygus, 2020; Weinschenk & Dawes, 2022).
In addition, we examined heterogeneous effects of CEI based on demographic characteristics, including race, ethnicity, gender, and immigrant background. Although heterogeneous effects were not observed in most subgroups, we found a marginally significant, 9.7 percentage point decrease in the probability of voting among Black youth in states that implemented CEI (p < .1). While prior studies have documented stronger associations between civic education and political outcomes for students from historically marginalized groups, including people of color and low socioeconomic status (Campbell, 2008; Langton & Jennings, 1968), we found a concerning pattern in the opposite direction here that future research must dig deeper into. As discussed in the “literature review” section, some scholars have warned of a narrowing of civic education—spending more time memorizing facts and less time engaging in class discussions and activities—caused by the civics test policy. This loss might be particularly detrimental to some students who might not have many opportunities outside of school to experience political discussions or activities. In light of prior research, our finding suggests that the negative impact of civics test policies may be particularly prominent among some groups, such as Black people, who have historically been excluded from politics (Conway, 2000; Holbrook et al., 2016; Leighley & Vedlitz, 1999; Verba et al., 1993). Although we interpret this result with caution given limited statistical power, future research should continue to examine ways to broaden civic participation in the United States.
Civic education efforts in schools, while often well-intentioned, struggle to move the needle when it comes to consequential civic participation among youth. This is particularly true for traditional civic education that emphasizes increasing students’ political knowledge, like the CEI. A change of focus from civic knowledge testing to more practical information provision interventions that provide information on the voting process and develop noncognitive skills (Holbein & Hillygus, 2020) might directly help reduce the cost of voting. That said, we are glad to note that CEI also did not adversely impact high school graduation rates (see Supplementary Tables A7 and A8 in the online version of the journal). 10
We document the stubborn unresponsiveness of youth voter turnout to state-mandated civics testing, at least in the short term, through a rigorous quasi-experimental analysis of national data that is consistent across numerous alternative specifications and robustness checks, including the use of state- and time-fixed effects, state-specific linear trends, event study analyses, Difference-in-difference-in-differences, placebo checks, comparisons with other civics test coursework variation across states, and accounting for state voting laws. While we cannot rule out that the effects may emerge in the medium or longer term when the policy has been in place for a longer period of time, the policy appears to be ineffective in the short term. If states hope to improve civic participation among successive generations of citizen leaders, they must take a different and more expansive approach than to simply mandate a civics test policy aimed at testing civic and political knowledge for high school graduation.
Supplemental Material
sj-pdf-1-epa-10.3102_01623737231195887 – Supplemental material for The Stubborn Unresponsiveness of Youth Voter Turnout to Civic Education: Quasi-Experimental Evidence From State-Mandated Civics Tests
Supplemental material, sj-pdf-1-epa-10.3102_01623737231195887 for The Stubborn Unresponsiveness of Youth Voter Turnout to Civic Education: Quasi-Experimental Evidence From State-Mandated Civics Tests by Jilli Jung and Maithreyi Gopalan in Educational Evaluation and Policy Analysis
Footnotes
Acknowledgements
The authors thank Dr. John Holbien for generously sharing his data on state-level, AP U.S. History and Government course enrollment rates. We also thank Dr. Kelly Rosinger, Dr. Christopher Witko, and participants of the Pennsylvania State University Population Research Institute (PRI) Education and Inequality working group (PRI is supported by a grant from the Eunice Kennedy Shriver National Institute of Child Health and Human Development (P2CHD041025)), the 2023 Association of Education Finance and Policy annual conference, and the 2023 Midwest Political Science Association conference for comments/feedback on an earlier draft. All remaining errors are our own.
Declaration of Conflicting Interests
The author(s) declared no potential conflicts of interest with respect to the research, authorship, and/or publication of this article.
Funding
The author(s) received no financial support for the research, authorship, and/or publication of this article.
Supplemental Material
Supplemental material for this article is available online.
Notes
Authors
JILLI JUNG, MA, is a doctoral student in the Department of Education Policy Studies at The Pennsylvania State University. She is interested in examining the impacts of social and educational policies on adolescents, using quasi-experimental designs.
MAITHREYI GOPALAN, PhD, is an assistant professor of education and public policy at The Pennsylvania State University. Her research examines the causes and consequences of racial and socioeconomic disparities in student outcomes using interdisciplinary perspectives.
References
Supplementary Material
Please find the following supplemental material available below.
For Open Access articles published under a Creative Commons License, all supplemental material carries the same license as the article it is associated with.
For non-Open Access articles published, all supplemental material carries a non-exclusive license, and permission requests for re-use of supplemental material or any part of supplemental material shall be sent directly to the copyright owner as specified in the copyright notice associated with the article.