
Abstract
Federal law defines eligibility for English learner (EL) classification differently for Indigenous students compared with non-Indigenous students. To be EL-eligible, non-Indigenous students are required to have a non-English primary language. Indigenous students, by contrast, can be English-dominant or English monolingual. A critical question, therefore, is how EL classification impacts Indigenous students’ educational outcomes. This study explores this question for Alaska Native students, drawing on data from five Alaska school districts. Using a regression discontinuity design, we find preliminary evidence that among students who score near the EL classification threshold in kindergarten, EL classification has a large negative impact on Alaska Native students’ academic outcomes in the third and fourth grades. Negative impacts are not found for non–Alaska Native students.
EL classification is operationalized and experienced in varied ways for different groups of students and, as a result, may have differential impacts. Research identifies key differences in the experiences of EL-classified students by racial and ethnic group (Flores et al., 2020; Ochoa, 2013; Umansky et al., 2020) as well as for U.S.-born students compared with those who have immigrated to the United States (Valenzuela, 1999). However, research on experiences with, and effects of, EL classification has focused almost exclusively on first- and second-generation immigrant students. American Indian, Native Hawaiian, and Alaska Native EL students are important, but often overlooked, EL-classified student groups (Carjuzaa & Ruff, 2016; Villegas, 2020). For numerous reasons described below, EL classification and services may be experienced differently by, and have different impacts on, Indigenous students.
Indigenous students are a diverse group of students from different regions, with varying heritage languages, cultures, and histories. This study focuses on Alaska Native students who themselves come from 229 federally recognized tribes (Bureau of Indian Affairs, 2019) with roughly 20 Alaska Native languages (Alaska Stat. § 44.12.310) from four major language families: Aleut, Tsimshianic, Haida, and Athabancan-Eyak-Tlingit (Krauss, 2007). Roughly a quarter of Alaska Native students are EL-classified when they enter school (Umansky et al., 2021).
While diverse, the shared history of educational imposition and forced linguistic and cultural assimilation among Indigenous students adds a weighty and concerning layer to a student classification—EL—that is defined by a focus on English development rather than heritage language proficiency and revitalization (National Academies of Sciences, Engineering, and Medicine [NASEM], 2017). Yet EL classification is tied to resources that may support beneficial programs, materials, and staffing for Indigenous students who are disproportionately likely to attend under-funded schools (National Indian Education Association, n.d.). As such, while there is reason to believe that EL classification may, on average, operate differently for, and be experienced differently by, Alaska Native students compared with non–Alaska Native students, it is not clear whether EL classification may benefit or harm Alaska Native students.
This study utilizes a regression discontinuity design with data from five Alaska school districts to answer the following research questions:
While data limitations prevent ideal implementation of regression discontinuity, the results of this study present a first attempt at isolating the impact of EL classification among Indigenous students. For students near the EL threshold, results indicate that EL classification has a significant and sizable negative impact on Alaska Native students’ academic outcomes in the third and fourth grades. These negative effects are unique to Alaska Native students; they are not present among non–Alaska Native students.
Indigenous Education Policy
Early U.S. Indigenous education policy was centered on a militaristic boarding school model that isolated students from their families and communities, suppressed heritage language use, engaged in racist instruction and policing of student behavior, and resulted in the deaths of many children (Adams, 1995; C. Barnhardt, 2001; Child, 1998; Hirshberg, 2008; Jester, 2002; Leap, 2012; Vitale, 2020). In Alaska, the boarding school model lasted into the 1970s and its legacy reverberates through Alaska Native communities today (Hirshberg, 2008).
While certain laws, including the Indian Self-Determination and Educational Assistance Act (1975), the Native American Languages Act (1990), and in Alaska, the Alaska Native Educational Equity, Support and Assistance Act (2002), support Indigenous languages and self-determination in education, barriers persist with regard to heritage language development and culturally responsive instruction (Beaulieu, 2008; Jester, 2002; Lomawaima & McCarty, 2006; Patrick, 2008; Winstead et al., 2008; Wyman et al., 2010b). Required standards displace culturally sustaining and place-based curricula (Lomawaima & McCarty, 2002; Siekmann et al., 2017), omitting Indigenous histories and relying instead on White-centric perspectives (Quijada Cerecer, 2013). Similarly, standardization of instruction and assessment is generally misaligned with Indigenous knowledges and Indigenous student identities (R. Barnhardt & Kawagley, 2005; Dinero, 2004; Nelson-Barber & Trumbull, 2015; Reyhner & Hurtado, 2008). Furthermore, non-Indigenous teachers at times employ a deficit-oriented lens when engaging with Indigenous students and communities (Jester, 2002; Jester & Fickel, 2013; Quijada Cerecer, 2013).
In contrast to assimilative education, culturally responsive and sustaining education policies and practices integrate cultural elements into instruction to create authentic, responsive learning experiences (Brayboy & Castagno, 2009; McCarty & Lee, 2014). While causal evidence is needed, culturally responsive and sustaining education practices and policies are positively associated with Indigenous students’ outcomes (Castagno & Brayboy, 2008). In Alaska specifically, integrating instruction on Alaska Native cultural traditions, practices, and knowledges with core content learning—such as star navigation to support math learning—can engage and support Alaska Native students (Ayuluk et al., 2015; R. Barnhardt & Kawagley, 2005; Hogan, 2008; Jester & Fickel, 2013; Lipka & Adams, 2004; Siekmann et al., 2017).
Indigenous Languages and English Use in the United States
There has been tremendous language loss within Indigenous communities, due in large part to the legacy of assimilationist policies and practices (McCarty, 2003). Heritage language loss, preservation, and revitalization look different across communities; many languages are no longer spoken, whereas others are spoken only by elders. Youth may grow up speaking a heritage language, hearing a heritage language spoken in their household, or learning their heritage language in school (McCarty et al., 2006). In Alaska, only four of the 20 Alaska Native languages are estimated to have more than 100 highly proficient speakers (Alaska Native Language Preservation & Advisory Council, n.d.) and only two Alaska Native languages are known to be learned by youth as their first language (Alaska Native Language Center, n.d.; Krauss, 2007).
There are strong, Indigenous-led, efforts across the United States to preserve and revitalize heritage languages. Heritage language programs 3 are positively associated with Indigenous students’ linguistic and academic growth, as well as engagement, intergenerational communication, sense of identity, and connection to community (Apthorp et al., 2002; Arviso & Holm, 2001; August et al., 2006; Lomawaima & McCarty, 2002; Smallwood et al., 2009). As of 2018, there were at least six districts in Alaska that offered Alaska Native heritage language programs or bilingual programs, including Yupik 4 and Inupiaq languages (Umansky et al., 2021). Research on Yupik programs suggests that they have strong support from community members and families, but face challenges through standardized education policy implementation and rapid language shift to English among youth (Williams & Rearden, 2006; Wyman et al., 2010a, 2010b).
Many Indigenous students speak English as their primary language (Carjuzaa & Ruff, 2016). However, students’ English varieties may differ from Standard American English 2 , the variety of English privileged in U.S. school settings (Carjuzaa & Ruff, 2016; Leap, 2012; Wiley & Lukes, 1996). A student’s English variety may be influenced by an Indigenous language, whether the language is still spoken in the household or was spoken by prior generations (Leap, 2012). Given the diversity of Indigenous languages and communities, these varieties of English and their origins vary (Wong Fillmore, 1996). As one example, however, “a” and “the” do not have translations in Athabaskan—a family of Indigenous languages spoken in Alaska. The variety of English developed in communities where Athabaskan is spoken included patterns of omitting or adapting articles in ways that vary from Standard American English, patterns that may now be present in households whether Athabaskan is still spoken or not (C. Thompson, 1984). The varieties of English spoken by Indigenous students are whole, valid English varieties, not markers of language deficiency (Devereaux & Palmer, 2019; Leap, 2012).
English Learner Policy and Its Impacts on Students
EL policy stems from the intent to ensure that students are not foreclosed from equitable educational access because of a lack of English proficiency (Hakuta, 2020). EL policy includes three main areas: (a) classifying eligible students, (b) providing educational supports, and (c) reclassifying students out of EL status once evaluated to have reached English proficiency (ESSA, 2015). Decisions regarding the processes and assessments used to determine classification and exit are largely left to the state, and service provision decisions are often left to the district or school, resulting in policies and practices that vary widely across the United States (Linquanti & Cook, 2013).
Initial EL identification typically begins with a home language survey, where guardians answer questions about a student’s language background and certain responses elicit screening for EL classification. Screening involves the administration of a state-determined English proficiency assessment; a student will typically be classified as EL if they score under a set proficiency threshold (Bailey & Kelly, 2013). EL classification sets in motion a set of programmatic and monitoring interventions. These interventions, by federal law, are designed to support the linguistic and academic needs of students acquiring English and typically include English language development (ELD) instruction, modified core content instruction, and annual assessment to evaluate English proficiency growth and eligibility for exit from EL status (ESSA, 2015).
Because EL classification impacts the services a school must provide, it is important to understand whether and how EL classification impacts students’ educational opportunities and outcomes. Research on these questions has shown divergent effects. Shin (2018) found that EL classification resulted in higher standardized math and ELA scores among students who entered kindergarten near the EL threshold. By contrast, Umansky (2016) found that EL classification had a negative effect on students’ standardized test scores in Grades 2 through 10. Findings of divergent effects likely reflect variation in services, differences in classification processes and thresholds, and the diversity of EL students (Cimpian et al., 2017).
The diversity of EL students is masked by a federally mandated policy system that clusters all students into a solitary high-stakes category. Research is beginning to unpack how EL classification impacts students differently, with evidence that EL classification may be more beneficial academically and linguistically for students with lower English proficiency levels (Callahan et al., 2010) as well as for students in schools with larger EL populations (Callahan et al., 2008) and those in bilingual programs (Umansky, 2016). Students born outside of the United States may also benefit more from EL classification than those born in the United States (Callahan et al., 2010).
EL classification likely impacts non-academic outcomes as well. Murphy and Johnson (2022) found evidence of negative effects of initial EL classification on special education identification among Spanish-speaking EL students in elementary grades. EL disproportionality in special education (Sullivan, 2011) is consequential for students, as overidentification may lead to constricted access to rigorous content (Bianco, 2005) or stigmatizing labels (Higgins et al., 2002), whereas under-identification may result in a lack of necessary and legally obligated supports.
Another important, yet understudied, outcome is attendance. Attendance plays an important role in students’ access to learning and educational outcomes (Gottfried, 2010), and EL-classified students are more likely than non-ELs to face academic, economic, and social challenges that are correlated with chronic absenteeism (George, 2019). Moreover, with evidence that EL classification negatively impacts students’ self-efficacy and sense of well-being in school (M. G. Lee & Soland, 2022), it is possible that EL classification may result in lower attendance. Yet to date we know of no studies examining the causal effects of EL status on attendance.
Indigenous Students and EL Policy
EL policy is widely perceived to be designed for students who speak a language other than English as a primary language (Carjuzaa & Ruff, 2016). However, the federal definition of a potential EL is differentiated for three groups of students: immigrant-origin students, migrant students, and students who are “Native American or Alaska Native, or a native resident of the outlying areas” (ESSA, 2015, § 8101(20)). Only the first two groups of students are eligible based on having a primary language other than English. Students in the third category, Indigenous students, by contrast, are eligible for EL identification if they come “from an environment where a language other than English has had a significant impact on the individual’s level of English language proficiency” (ESSA, 2015, § 8101(20)). The origin of this differentiated definition for Indigenous students appears to be rooted in a recognition that many Indigenous students would be speakers of Indigenous languages were it not for a history of forced linguistic and cultural assimilation (Crawford, 1997). Although neither “environment” nor “significant impact” has been defined in federal legislation or guidance, the language in ESSA indicates that Indigenous students can speak English as their primary language and still be eligible for EL identification if they meet other state EL identification criteria (Regional Education Laboratory Northwest, 2019).
This, coupled with the high proportion (80%–90%) of Indigenous students who speak English as their sole home language (Siebens & Julian, 2011), suggests that Indigenous EL students’ linguistic profiles are likely different from those of non-Indigenous EL students. Unfortunately, because EL research has centered on immigrant-origin students (Carjuzaa & Ruff, 2016), it is difficult—and in some states impossible—to determine the proportion of Indigenous EL-classified students who speak English versus a heritage language. This is because in many states, the home language survey fails to capture the complexities of language use, focusing on one primary language rather than recognizing the possibility of students’ use of and exposure to multiple home and heritage languages (Bailey & Kelly, 2013). In other cases, due to the centering of non-Indigenous EL policy, states may not allow English to be recorded as the primary language of record for EL students. This is the case in Alaska, the implications of which are discussed later.
For Indigenous EL students who speak a variety of English other than Standard American English, the purpose of EL classification is not immediately obvious. It may be explicit instruction in Standard American English although this is not typically considered a core element of EL services. Similarly, it may be heritage language revitalization, although the near absence of text on bilingual instruction in ESSA casts doubt on this focus. What is clear is that given their different linguistic assets, there is likely a need for differentiation between EL supports provided to those acquiring English as an additional language compared with those who speak English as their primary language (Devereaux & Palmer, 2019; Smith, 2016). Little is known, however, about how, if at all, education agencies differentiate EL services for Indigenous students generally, or Indigenous English-dominant students specifically (Villegas, 2020).
Theoretical Orientation
Given what is known regarding Indigenous education and EL practices, there are reasons to theorize that EL supports could act either as a support or as a barrier for Alaska Native EL-classified students’ academic achievement, disability identification, and attendance rates. In this section, we build from our literature review to outline mechanisms through which EL classification may benefit or harm Alaska Native student outcomes.
EL classification may support Indigenous students through the provision of resources focused on Indigenous languages and cultures, including heritage language and bilingual programs, which are positively associated with an array of outcomes and protective factors (Brayboy & Castagno, 2009; McCarty & Wiley Snell, 2011; NASEM, 2017; Smallwood et al., 2009). EL services may also support Indigenous students by providing instruction on Standard American English. In a study focused on outcomes of American Indian EL students, Bilagody (2014) found that teachers and parents felt Standard American English instruction was beneficial for students’ academic progress. Finally, EL services may include familial engagement practices and/or family-centered educator professional development. Doing so may lead to stronger connections between schools and families, which in turn may result in stronger academic outcomes (Wilder, 2014) and improved attendance (Gottfried & Gee, 2017).
There are also reasons why EL classification might function as a barrier for Indigenous students. EL classification may exacerbate a deficit-oriented framing of Indigenous students, identifying students by a lack of linguistic proficiency (Garcia, 2009) rather than their multilingual assets (Callahan & Gándara, 2014). For English-speaking Indigenous students, EL classification may be experienced in stigmatizing ways in that the classification implies that a student is not a speaker of any English variety, failing to recognize these students’ proficiency in whole and complete English varieties (Ahler, 2007; McCarty et al., 2009). This may exacerbate trends of internalization of language shame, which can be experienced by Indigenous students who have received harmful messaging that their heritage language or English variety is a symbol of lower social status (T. S. Lee, 2007; McCarty et al., 2009; Romero-Little et al., 2007). Stigmatization can negatively impact self-esteem and attitudes about school, which may negatively impact attendance (Gottfried & Gee, 2017) and achievement (Steele, 2010). In addition, EL classification has been shown to limit access to core content (Estrada, 2014; Kanno & Kangas, 2014; K. D. Thompson, 2017b), limiting students’ opportunity to learn and subsequent achievement (Carlson & Knowles, 2016). Accountability pressures focused on English language acquisition can harm heritage language maintenance (Ahler, 2007; Wyman et al., 2010a) and limit culturally relevant content (Siekmann et al., 2017), again with possible negative effects on achievement and engagement.
Finally, EL classification may negatively impact timely and appropriate identification for special education. Uninformed educators may interpret non–Standard American English practices among Indigenous ELs as language disorders resulting in overidentification in special education (Collier, 2012). By contrast, schools may delay special education identification among EL-classified students in an attempt to focus on specialized services which could result in delayed or under-identification in special education (Murphy & Johnson, 2022; Umansky et al., 2017).
In sum, whether EL classification and services are beneficial or harmful for Indigenous students likely depends on how services and policies are designed and implemented (Cimpian et al., 2017; Hopkins et al., 2015). We now turn to describe the EL education context in Alaska.
Alaska Context and EL Identification Policy
With tremendous cultural and linguistic diversity (C. Barnhardt, 2001), Alaska has the largest area of any U.S. state, but also the lowest population density (U.S. Census Bureau, 2020). Sixteen percent of Alaska’s roughly 750,000 residents and 22% of the state’s 150,000 K–12 population identify as American Indian/Alaska Native, the largest proportions of any U.S. state (Alaska Department of Education and Early Development [DEED], n.d.; U.S. Department of Education, 2019). Twenty percent of Alaska’s K–12 students attend rural schools, half of which are in communities inaccessible by road (Vazquez Cano et al., 2019). In Alaska, in 2019, 12% of the state’s K–12 students were EL-classified, and of those, 41% were American Indian or Alaska Native, far higher than the 8% of ELs nationally who were American Indian/Alaska Native (Office of English Language Acquisition, 2020). A quarter of Alaska Native kindergartners are EL-classified (Umansky et al., 2021), and Yupik is the most common language family spoken by EL students in the state (Snyder et al., 2019).
Both Indigenous students and EL students face lower rates of high school completion and lower standardized academic assessment scores in relation to non-Indigenous and non-EL peers in Alaska (Alaska DEED, 2018). Only 11% of Alaska Native EL students are reclassified out of EL status by seventh grade (Umansky et al., 2021), a much lower percentage than similar analyses looking at predominantly non-Indigenous students (Slama, 2014; K. D. Thompson, 2017a).
At the time of our study, there were two pathways to EL identification in Alaska. Following the primary path, guardians of students entering a school district completed a home language survey asking about students’ language practices and contexts. Students who were identified as having a primary language other than English were then administered an English proficiency screener assessment. Students who scored below the state’s threshold were classified as EL (Alaska DEED, 2020). The alternative EL identification process allowed teachers or administrators to identify and screen students who they believed to be potential EL students but who did not identify a language other than English on their home language survey. Specifically, educators could employ a state-developed language observation checklist to evaluate how a given student’s English language practices “compared to Standard English-speaking students of the same age” (Alaska DEED, 2020). Students identified as potential ELs through this checklist were then administered the screener assessment and, as in the primary pathway, identified as EL based on their score.
Data and Method
Author Positionality
Ilana Umansky is the granddaughter of Eastern European Jewish immigrants to the United States and an associate professor in the University of Oregon’s College of Education. Until recently, her research focus on education policy for multilingual students was largely centered on immigrant-origin students, having developed after working for several years in Mexico and Central America. Her interests focus on structures and systems and the ways in which, unless challenged, they frequently perpetuate stratification and inequity. This framing informs the way she understands and responds to the questions addressed in this study. She considers herself a learner in the space of EL education policy and Indigenous students.
Manuel Vazquez Cano identifies as an immigrant, Latino man. He is a researcher at Education Northwest as well as a PhD candidate at the University of Oregon. His primary area of research examines how policy and programmatic decisions open or constrain opportunities for multilingual students, primarily through quantitative methods. His research is informed by his own immigrant experience, time classified as an EL, and desire to improve opportunities for students in his community. He engaged the topic of the study after years of research partnership work with educators in Alaska and repeatedly hearing from educators a need to better understand the experiences of Alaska Native, EL-classified students. He is not a part of the Alaska Native community and is continuing to develop his understanding of Indigenous education.
Lorna Porter identifies as a White, female education policy researcher. Her research approach is shaped by her personal experiences as a student, her experiences working in urban schools in afterschool and nonprofit educational programs, a commitment to educational equity for racially and linguistically diverse communities, and mainstream quantitative methodological training. She is not a part of the Alaska Native community and is early in her journey of learning about the sociohistorical experiences of Indigenous communities. She came into this work primarily as a scholar who studies EL classification among immigrant-origin students.
Sample
This study was carried out together with another mixed-methods, practitioner-oriented study conducted in partnership with the Alaska Department of Education and Early Development and a group of Alaska school districts (Umansky et al., 2021). 5 The data across the two studies included statewide longitudinal student-level data matched with data from five Alaska school districts. Data also included district EL program plans and interviews with EL and Alaska Native education leaders. In this study, we utilize the quantitative data, but our research questions, methods, and framing are shaped by the full data.
The study sample consists of kindergarten-entrant students who took the EL screener assessment across five Alaska school districts over the years 2011/2012 to 2018/2019 (N = 2,653). These students were identified as potential ELs through either the home language survey or the teacher observation checklist. While only five of 54 Alaska school districts, the sample represents 19% of EL students and 42% of Alaska Native EL students who entered kindergarten between 2011/2012 and 2018/2019. We derived two analytic samples—the first for academic outcome analyses (Grades 3–5; 1,563 students) and the second for non-academic outcome analyses (Grades K–5; 2,653 students). In all, the study sample consisted of eight separate cohorts. Table A in Supplementary Appendix B (available in the online version of the journal) illustrates the cohorts in each sample.
The five districts in the analytic sample varied in size, urbanicity, and student composition (see Table B in Supplementary Appendix B, available in the online version of the journal). Two of the districts served fewer than 5,000 students, two between 5,000 and 10,000 students, and one served more than 10,000 students. The two smallest districts, Districts 4 and 5, were the most remote and had the largest concentrations of Alaska Native and EL-classified students, with more than 75% of students being Alaska Native. The percentage of EL-classified students in District 4 was between 51% and 75%, whereas the percentage ranged between 25% and 50% in District 5 (values are binned for anonymity). The three larger districts had lower proportions of Alaska Native and EL-classified students, although District 2 had a larger proportion of Alaska Native students (11%–20%) compared with the other two (≤10%).
Each of the five districts had an EL strategic plan. These plans outline key instructional approaches and supports for EL-classified students. Table C in Supplementary Appendix B (available in the online version of the journal) summarizes core elements of each district’s plan: program model for access to core content, program model for ELD instruction, and any programs or services specific to Alaska Native EL students. Only one of the five districts (District 4) offered bilingual education in an Alaska Native language (Yupik); the other four used sheltered English instruction for core content access, an approach that relies on instruction delivered in English and modified to students’ English proficiencies. Districts used different ELD service models, including push-in ELD services, pull-out ELD services, and structured English immersion.
Only two districts describe EL services specific to Alaska Native students. The first (District 2) described working with families to better understand how students’ English proficiency may have been impacted by a language other than English, presumably an activity focused on EL identification rather than EL service provision. The second district (District 4) described their Yupik bilingual program, the presence of Indigenous bilingual staff and educators, and Indigenous community engagement activities, specifically noting meetings with Alaska Native families focused on supporting students’ dual language development. In sum, only District 4 appeared to differentiate EL services for Indigenous students. That district drew upon educational elements theorized to benefit Indigenous students (bilingual education, community engagement, bilingual staff). We conduct a sensitivity check (described below) to ascertain whether EL classification had differing estimated average effects in this one district; however, we lack data on what proportion of Alaska Native EL students in District 4 participated in these services.
Table 1 and Table D in Supplementary Appendix B (available in the online version of the journal) describe the analytic samples for the academic outcomes, and non-academic outcomes, respectively. In the academic sample (Table 1), 84% of students were Alaska Native, 92% ever qualified for free or reduced-priced lunch (FRPL), and 92% of students were EL-classified. As the tables show, there were differences between students who scored above and below the EL screener threshold as well as between Alaska Native and non–Alaska Native students. Most notably, a higher proportion of below threshold compared with above threshold, and Alaska Native compared with non–Alaska Native students, qualified for FRPL and had lower mean scores across multiple measures on Alaska’s kindergarten readiness assessment, the Alaska Development Profile (ADP).
Mean Student Characteristics Among Full Sample Used in the Math and English Language Arts Analyses, by Alaska Native Identity and Performance on the Initial Kindergarten English Language Proficiency Assessment
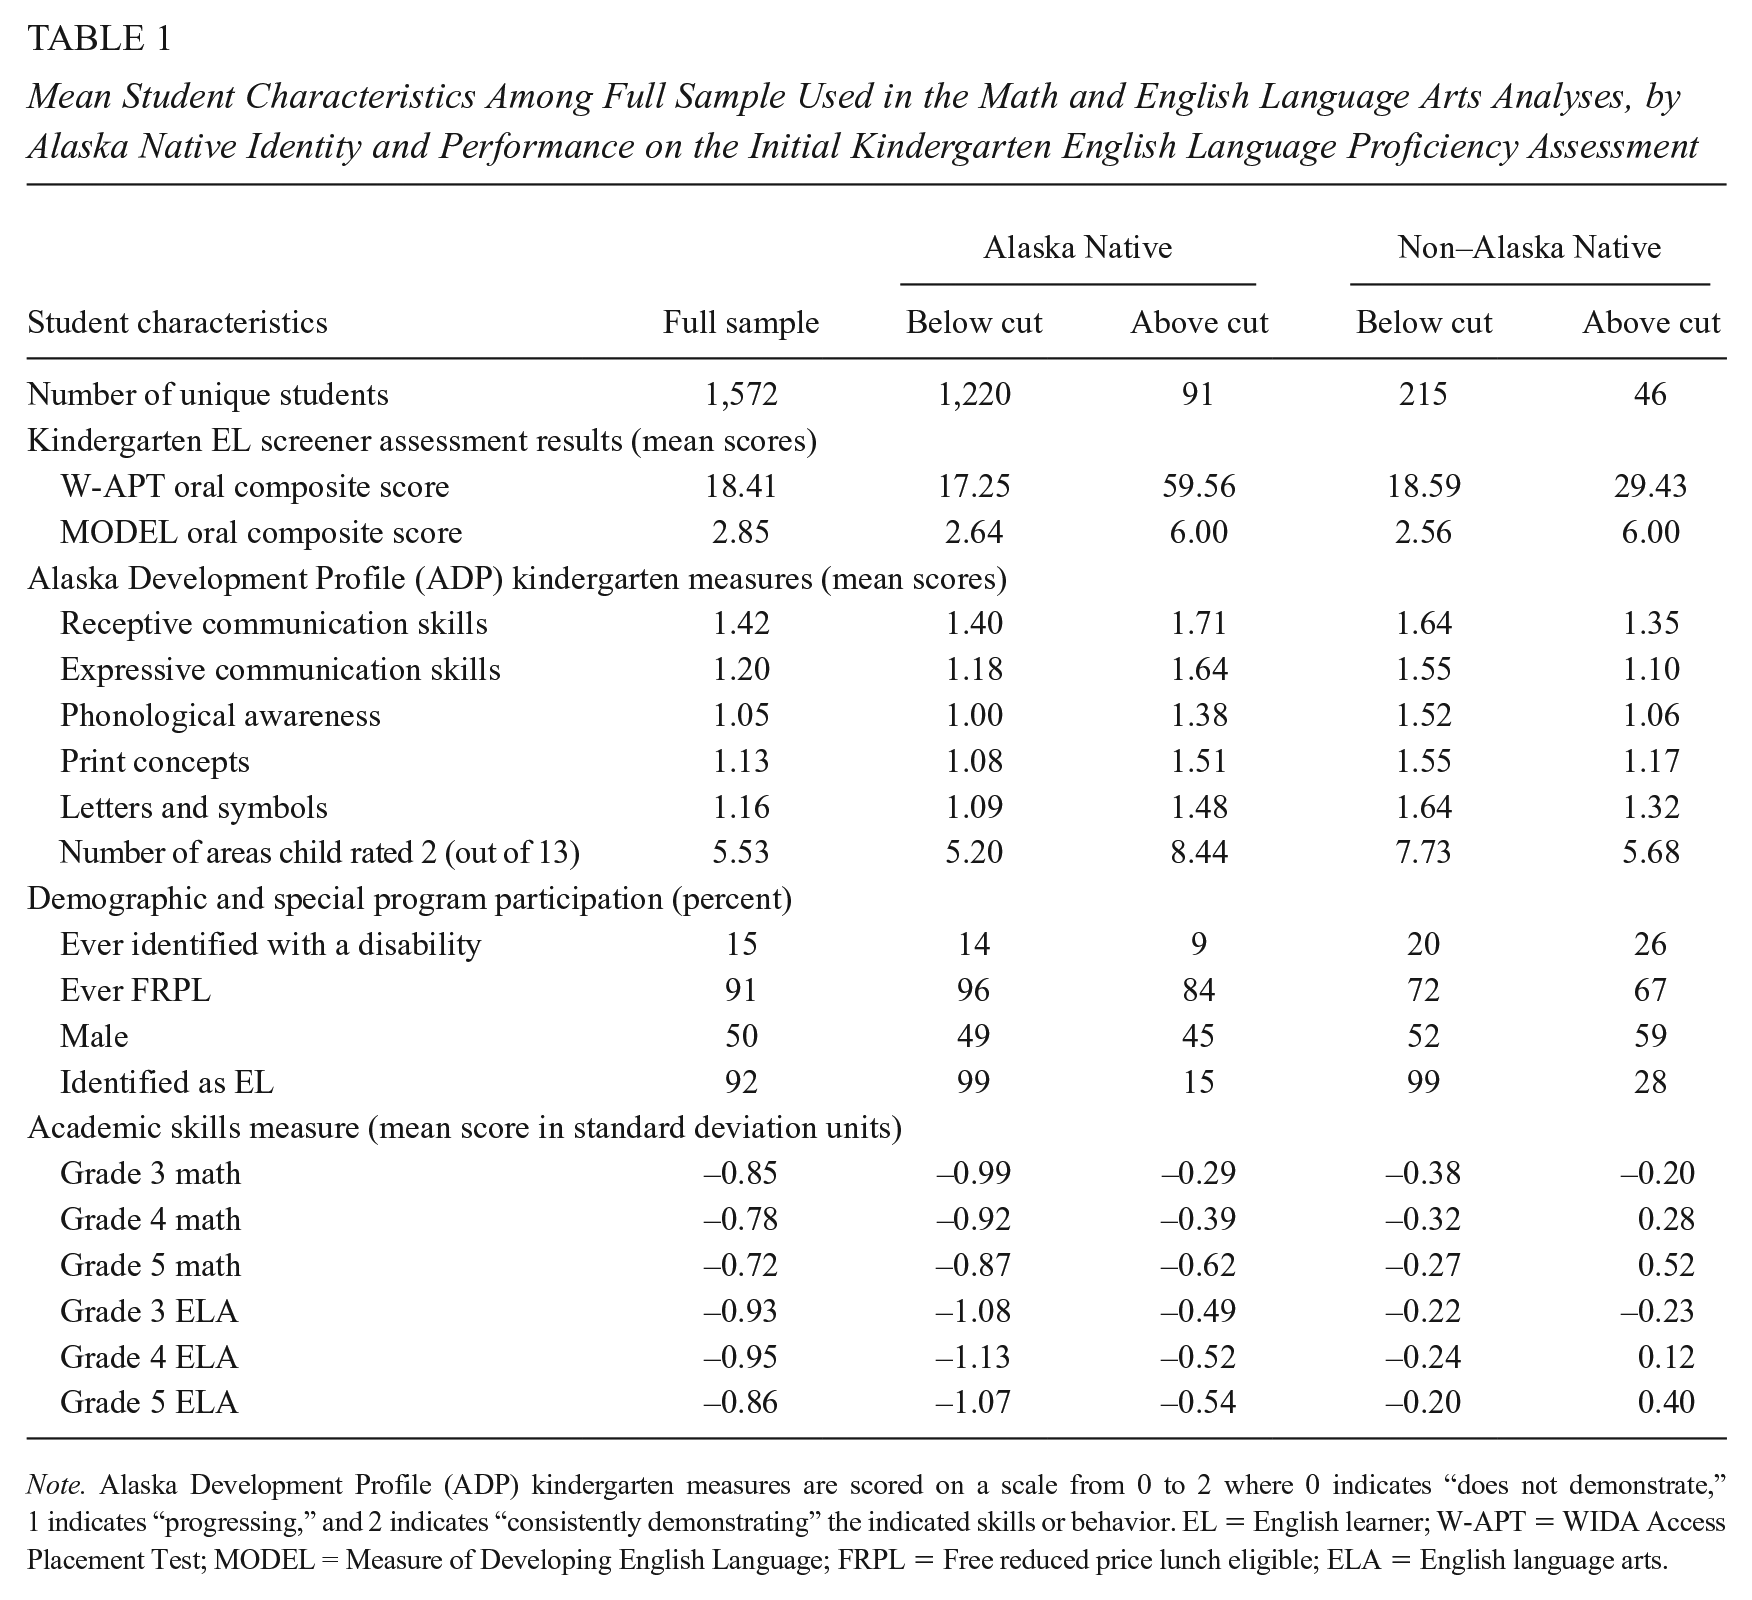
Note. Alaska Development Profile (ADP) kindergarten measures are scored on a scale from 0 to 2 where 0 indicates “does not demonstrate,” 1 indicates “progressing,” and 2 indicates “consistently demonstrating” the indicated skills or behavior. EL = English learner; W-APT = WIDA Access Placement Test; MODEL = Measure of Developing English Language; FRPL = Free reduced price lunch eligible; ELA = English language arts.
Treatment Variable
In Alaska, school districts could select from two English proficiency screener assessments developed by the WIDA Consortium to screen newly enrolled kindergarten students: the WIDA Access Placement Test (W-APT) or the Measure of Developing English Language (MODEL) assessment. Three districts in our sample used the W-APT assessment exclusively, one district used the MODEL assessment, and one used both assessments (Table B in Supplementary Appendix B, available in the online version of the journal). Upon entry into school, students who were potentially eligible for EL services were assessed in the speaking and listening domains on one of these assessments. Each student was then assigned a composite oral proficiency score. The W-APT oral composite score ranges from 0 to 30 (integer scores only) and the MODEL oral composite score from 1.0 to 6.0 (scored by 0.1). Students who earned a score below 29 on the W-APT or below 6.0 on the MODEL assessment were to be classified as EL (Alaska DEED, 2020). 6 The study treatment variable for our reduced-form model is a binary variable equal to 1 if the student scored at or below the EL threshold and should, therefore, have been identified as EL, and 0 if the student scored above the EL threshold.
Compliance with EL classification policy was high, but not perfect. Overall, 97% of students were assigned to the appropriate language status based on their oral composite score (Figure A in Supplementary Appendix B, available in the online version of the journal). At the threshold, scoring within the EL range led to an 88 percentage point jump in the likelihood of being assigned as EL among Alaska Native students (the corresponding figure for all students was 85 percentage points).
Moderator Variable
Our first research question focuses on the estimated effect of EL classification for Alaska Native students only. In the second research question, we ask how estimated EL classification effects differed for Alaska Native compared with non–Alaska Native students. We therefore used a moderator variable that indicated whether a given student was ever identified as Alaska Native while observed in the data. 7
Outcome Variables
In this study, we explore the estimated impact of EL classification on a set of academic and non-academic outcomes. The academic outcomes, ELA and math achievement, are our primary outcomes of interest and are measured using scores on the statewide Performance Evaluation for Alaska’s Schools (PEAKS) assessment. 8 PEAKS assessment scores are standardized by grade and year using the full statewide data set. We pool cohorts and look at test score outcomes in the third through fifth grade. Third grade is the first instance of PEAKS administration and sample sizes are too small for meaningful results after the fifth grade.
Our non-academic outcomes include attendance rates and disability identification in Grades K–5. Attendance is measured as the percentage of days a student attended school in a given academic year. Disability identification is a binary variable indicating whether, during that year, a student was identified as having a disability and placed on an individualized education plan.
Analytic Strategy
Our main analytic approach used a regression discontinuity (RD) design to estimate the effect of EL classification on our set of outcomes. When appropriate assumptions are met, RD provides robust causal estimates that replicate findings from experimental data (Cook et al., 2008; Imbens & Lemieux, 2008; Murnane & Willett, 2010). Generally, it is difficult to identify the effect of an intervention because those who receive the treatment (in our case EL classification) are systematically different from those who do not. RD can overcome this nonrandom selection problem when treatment is assigned based on a set threshold on a continuous pretreatment covariate. The premise is that there is essentially random assignment of students into the EL group among those who score close to the screener threshold (Robinson, 2011; Shin, 2018).
We used students’ oral composite scores as the running variable that predicts EL or non-EL classification. To have the W-APT and MODEL scores on a common scale, we centered each assessment at the relevant cut-score and standardized the resulting screener assessment scores. The main model for Question 1, which drew exclusively on the Alaska Native student sample, is as follows:
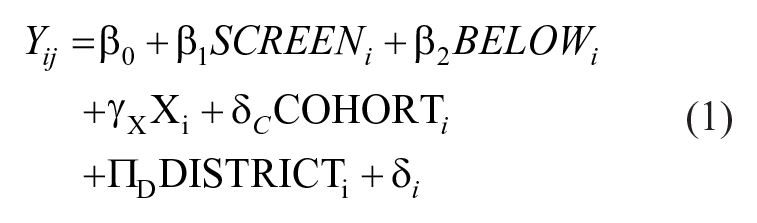
where Y represents student i’s outcome in year j, SCREEN is a running variable that represents student i’s standardized screener score, BELOW represents our dichotomous treatment variable, indicating that student i scored below the EL threshold, and X represents a vector of student and school-level covariates. At the student level, we included gender, kindergarten readiness scores, migrant status, and whether ever eligible for FRPL or disability identification (this last covariate was omitted in the models with disability identification as the outcome). At the school level, we included the proportion of the school that was classified as EL, the proportion of the school that was American Indian/Alaska Native, and a set of dummy variables representing the relative urbanicity or rurality of the student’s kindergarten school location (Vazquez Cano et al., 2019). We also included cohort (COHORT) and district (DISTRICT)) fixed effects. Our outcomes, Y, included standardized math and ELA scores in Grades 3 through 5, and attendance and annual disability identification in Grades K through 5. We use robust standard errors (Kolesár & Rothe, 2018). Covariates were identified based on theory and their inclusion tested. The final model had a linear slope and no differentiation of slope above and below the cut-score. This specification was arrived at through observation of the data and comparison of model fit (Akiake information criterion [AIC]). The coefficient of interest is β2, which represents the impact of scoring just below the EL threshold on student achievement, disability identification, or attendance among potential ELs near the threshold. We conducted a set of robustness checks to test for the sensitivity of our findings to our analytic approach and model specifications. These robustness checks are described below and in Supplementary Appendix A (available in the online version of the journal).
Data for an RD design should, under ideal conditions, have a minimum of four data points above and below the cut-score (What Works Clearinghouse, 2020). The more data on each side, the more accurately one can model functional form. In this setting, while there were abundant data points below the EL threshold, Alaska EL policy set the threshold for EL classification at (MODEL) or just below (W-APT) the highest possible score on the screener. As a result, once standardized and centered, we had only two data points at or above the threshold. Because of this limitation, we run a host of robustness checks to assess the consistency of results across various modeling and data choices (described in Supplementary Appendix A, available in the online version of the journal). Furthermore, we present our findings not as decisive causal effects, but rather as a first attempt to isolate and estimate any causal effects of EL classification on Alaska Native students. Table E in Supplementary Appendix B (available in the online version of the journal) provides the number of below- and above-EL threshold Alaska Native and non–Alaska Native students, by district.
For Research Question 2, we conducted a difference-in-regression discontinuity analysis, using the full sample of both Alaska Native and non–Alaska Native students. The model is the same, except that we included an indicator variable for whether a student was non–Alaska Native, and we added two interactions to the model: one that interacted the non–Alaska Native indicator variable with the running screener score variable (SCREEN) to allow for the relationship of screener score with academic achievement to vary for Alaska Native and non–Alaska Native students, and another that interacted the non–Alaska Native indicator variable with the indicator variable of whether a student scored at or below the EL threshold (BELOW). The coefficient on this second variable is the parameter of interest, representing the difference in the effect of EL classification for non–Alaska Native students compared with Alaska Native students. The direction, magnitude, and significance of this coefficient answer our research question about whether the estimated effects of EL classification impacted Alaska Native students differently than non–Alaska Native students. Of note, the sample of non–Alaska Native students who took the screener assessment in the five districts was a fraction of the Alaska Native student sample. In the third grade, for example, when students first took the state math and ELA assessments, there were only 256 non–Alaska Native students in the sample compared with 1,332 Alaska Native students. As such, our statistical power to detect differences between the groups was limited, and we describe descriptive patterns in the results beyond those with statistical significance.
For all models, we calculated the optimal bandwidth using the Imbens and Kalyanaraman (2012) method and the rd package in Stata (Nichols, 2011) and ran models for a range of bandwidths around the cut-score threshold at 0.1 intervals. We present and describe results from multiple bandwidths but focus our discussion at the optimal bandwidth for each outcome and grade level (Table F in Supplementary Appendix B, available in the online version of the journal). Optimal bandwidths were typically smaller at higher grade levels and for the non-academic outcomes, but generally ranged between 1 and 1.5 SDs. This range is in line with (Cimpian et al., 2017) and somewhat larger than other RD studies of EL classification effects (Johnson, 2020; Umansky, 2016). This may be due to the relatively small sample size and the fuzzy nature of the regression discontinuity. Of note, the size of the bandwidth is only relevant for the data below the EL threshold; above the threshold all data are within a 0.15 bandwidth and therefore all above-threshold data are included in every model. Larger bandwidths can more precisely estimate effects but are also more vulnerable to bias in results when the functional form is not correctly specified. In this case, however, model fit statistics indicate that a linear function form best fits the data (Murnane & Willett, 2010).
Figures B and C in Supplementary Appendix B (available in the online version of the journal) present initial descriptive evidence of mean differences in the average math (Figure B) and ELA (Figure C) test scores for students above and below the EL threshold, by grade, for students in a range of bandwidths from 0.5 to 2 SDs. Across bandwidths, there are sizable gaps in mean test scores in both subject areas that decline only very moderately when looking at the smaller bandwidths. These figures provide further support for using our calculated optimal bandwidths.
Equation 1 is a reduced-form intent-to-treat model that estimates the effect of scoring just below the threshold on our outcomes of interest. Because we have incomplete compliance with treatment assignment using the cut-score rule, for our primary models we adjust our estimated effects using the Wald estimator (Angrist et al., 1996; Bloom, 1984) to provide a local average treatment effect that estimates the effect of EL classification on our outcomes. The Wald estimator simply divides the coefficient of interest, β2, and its standard error by the effect of meeting EL identification criteria (scoring below the EL threshold) on EL identification (0.879 at the optimal bandwidth for Alaska Native students and 0.849 for all students). As always, a limitation of regression discontinuity is that it provides causal estimates of the impact of the intervention for individuals who score near the intervention assignment threshold, but not necessarily for those well above or below the threshold. In our case, this means that our estimates reflect the impact of EL identification for students near the EL cut-score—those with relatively advanced oral proficiency in Standard American English upon entry into kindergarten.
Assumption Checks
For the RD design to demonstrate internal validity, there are key assumptions that must be met (Murnane & Willett, 2010). First, the forcing variable must reliably sort students into treatment and control groups. As reported above, scoring just below the EL threshold resulted in an 88 percentage point jump in the likelihood of EL classification. While this represents a strong forcing variable, scoring below the threshold did not universally result in EL identification. As such, we adjust our estimates using the Wald estimator, as described above.
A second assumption is that there was no manipulation of scores around the cutoff. We examined the distribution of screener scores (Figure D in Supplementary Appendix B, available in the online version of the journal) and found no indication of crowding above or below the cutoff. In addition to the visual check, we also conducted a density test using local polynomial density estimators (Cattaneo et al., 2020). The test rejected the null hypothesis that there was a discontinuity in the density of cases at the cutoff.
A third assumption is that students in the treatment and control group are equal in expectation on observable and nonobservable characteristics within the bandwidth. We inspected the data for systematic differences on observable characteristics through a panel of graphs (Figure E in Supplementary Appendix B, available in the online version of the journal). We did not observe visual jumps in ADP scores but did observe small jumps by gender and proportion of students eligible for FRPL. We tested our observations in a regression framework, finding that scoring below the threshold significantly predicted gender and FRPL eligibility but no other pretreatment covariates (Table G in Supplementary Appendix B, available in the online version of the journal). For this reason, we included gender and FRPL eligibility among our covariates in the final model.
Finally, RD designs are sensitive to the specification of the correct functional form; incorrect specification may lead to a biased estimate. To ensure we selected the appropriate functional form, we conducted a visual check by plotting the relationship between the standardized screener score and our outcomes of interest. We then modeled the relationship with a range of functional forms including linear and polynomial functional forms, and shared as well as differentiated slopes, above and below the EL threshold. In both visual inspection and comparison of model fit, we found the linear model with shared slopes was appropriate for all models.
Robustness Checks
We ran a range of robustness checks, including using different bandwidths of data, different functional forms and slope parameters, and inclusion and exclusion of covariates. We also used a growth model to estimate the impact of EL classification in the third grade and subsequent changes after the third grade. In addition to different models, we also examined estimated effects with different samples, including among Alaska Native students within specific districts and across districts that used the same screener assessment, and models that only included non–Alaska Native students. For example, we examined EL classification effects in District 4 alone, given that district’s inclusion of Alaska Native–specific EL services, including a Yupik bilingual program. Our robustness checks are focused on math and ELA test score outcomes as we consider these the primary outcome variables in this study. We describe these alternative analyses in Supplementary Appendix A (available in the online version of the journal).
We present results for alternative bandwidths in our main results. For each analysis, we identify the grade- and outcome-specific optimal bandwidth (Table F in Supplementary Appendix B, available in the online version of the journal) and center alternative bandwidths around the mean optimal bandwidth for that outcome. In addition, Figure 2 presents results for our academic outcomes across 27 alternative bandwidths (0.1 increments plus optimal bandwidth) ranging from 0.5 to 2.5 SD.
We present further robustness check results in Supplementary Appendix B (available in the online version of the journal), Tables H (alternative models), I (alternative samples), and J (growth models). We conducted a placebo regression discontinuity analysis, testing for discontinuities in test score outcomes for students above and below a placebo threshold (1.5 SD below the true cut-score). Results from the placebo analyses are in Table K of Supplementary Appendix B (available in the online version of the journal). Results, as expected, are close to zero and nonsignificant.
Finally, we estimated the effect of EL classification using a coarsened exact matching (CEM) approach. CEM relies on researcher expertise to identify matching variables that are predictive of treatment or the outcome (Iacus et al., 2012), reducing the sample to more comparable treatment and control groups. In the context of our analysis, it allowed us to estimate the effect of EL classification among a set of students different from that of the RD, including students farther away from the threshold. However, stringent assumptions are required for a causal CEM estimates, including that no unobserved variables influenced the estimate. To reduce the threat of omitted variable bias, we only used students who were initially identified as potential EL students and we required an exact match on students’ ADP domain scores for each of the ADP’s five communication, language, and literacy domains (e.g., expressive communication skills and phonological awareness). We further required exact matches on gender, disability identification (omitted in models where disability identification is the outcome of interest), FRPL eligibility, and whether or not a student is Alaska Native. Table L in Supplementary Appendix B (available in the online version of the journal) reports descriptive information for the third grade math and ELA-matched samples, alongside the full and 1.5 RD bandwidth sample. Using the matched sample, we then analyzed the relationship between EL classification and the outcomes of interest in a regression framework, using the same covariates included in RD models (Table M in Supplementary Appendix B, available in the online version of the journal). We interpret our estimates as a robustness check and estimation of possible EL classification effects among a wider sample of students.
The consistency of our results across the wide range of bandwidths, samples, models, and approaches does not altogether alleviate limitations based on the lack of data points above the EL threshold. However, it does provide evidence that our results are driven by causal mechanisms rather than correlations or modeling artifacts.
Methodological Considerations
In addition to the above analyses, we note specific decisions we made that reflect principles put forward through Quantitative Critical Race Theory (QuantCrit; Castillo & Gillborn, 2022) and Indigenous research methodologies (Brayboy et al., 2012; Chilisa, 2019). A key tenant of QuantCrit is centering the issue of race and racism. We frame our analytic work within the racist history of U.S. policy toward Indigenous communities, with the understanding that observed inequities and categorizations stem from this history. We also recognize that racial identities are socially constructed categories (Gillborn et al., 2018), and when we focus our analysis on Alaska Native students specifically, we are including a group of students who themselves are incredibly diverse, although likely share experiences shaped by the racialized policies and systems of the United States broadly, and the U.S. education system specifically.
Aligned with principles of Indigenous research methodology, we integrated conversations with school and community stakeholders into our methodological approach (Umansky et al., 2021), with the goal of incorporating meaningful input from Alaska Native stakeholders (Brayboy et al., 2012; Chilisa, 2019). We also argue that disaggregating EL students by race/ethnicity, as we do in this study despite the statistical issues that arise with small population research, may be critical to moving forward our understanding of heterogeneous impacts of such a classification across students (Castillo & Gillborn, 2022). In doing so, we purposefully disrupt the pattern in which Indigenous populations are removed from statistical studies or clustered with other populations due to small sample sizes (National Congress of American Indians, n.d.).
Importantly, we frame our results within the understanding that observed inequities are not the result of student or community deficits, but rather produced through systems and structures that fail to recognize and respond to the rich assets of Indigenous communities (linguistic, cultural, community, economic, etc.). Specifically, we hope that our language and framing challenge the ways in which much previous research has failed to account for the rich linguistic practices of speakers of varieties of English, through contextualizing the EL label for Alaska Native students within a sociolinguistic and historical discussion.
Results
Estimated Effects of EL Classification on Alaska Native Student Outcomes
Among students near the kindergarten EL threshold, we estimate that EL classification had a negative impact on Alaska Native students’ academic outcomes in math and ELA in Grades 3 and 4 with negative results dissipating (ELA) or reversing (math) in Grade 5. Table 2 shows results for academic outcomes from our main RD models, and Figure 1 presents results visually, by grade and subject area at optimal bandwidths (additional bandwidths and models presented in Figures F–K in Supplementary Appendix B, available in the online version of the journal). Figure 2 presents estimated effect sizes across bandwidths from 0.5 to 2.5 SD, by subject and grade. Results were largely consistent across bandwidths at or larger than 1 SD, although they tended to be less negative (or more positive) at bandwidths smaller than 1. Results from the Wald estimator suggest that EL classification resulted in a negative effect on test scores in math and ELA of roughly a third of a standard deviation in the third and fourth grades among students near the EL threshold with slightly larger effects in the third grade and results only marginally significant in the fourth grade. Specifically, in math, there was an estimated negative impact of EL classification on students near the threshold of 0.407 SD units in the third grade and 0.297 SD in the fourth grade. In ELA, negative effects were slightly smaller, but more consistent between the third and fourth grades, declining in absolute magnitude from 0.306 to 0.283 SD. In both math and ELA, the negative estimated effects dissipated by Grade 5. While effects flipped in direction in the fifth grade, they were not statistically significant (the math estimate, however, was meaningful in size).
Estimated Effect of EL Classification on Math and English Language Arts (ELA) Standardized Test Scores, Among Alaska Native Students, by Grade and Bandwidth
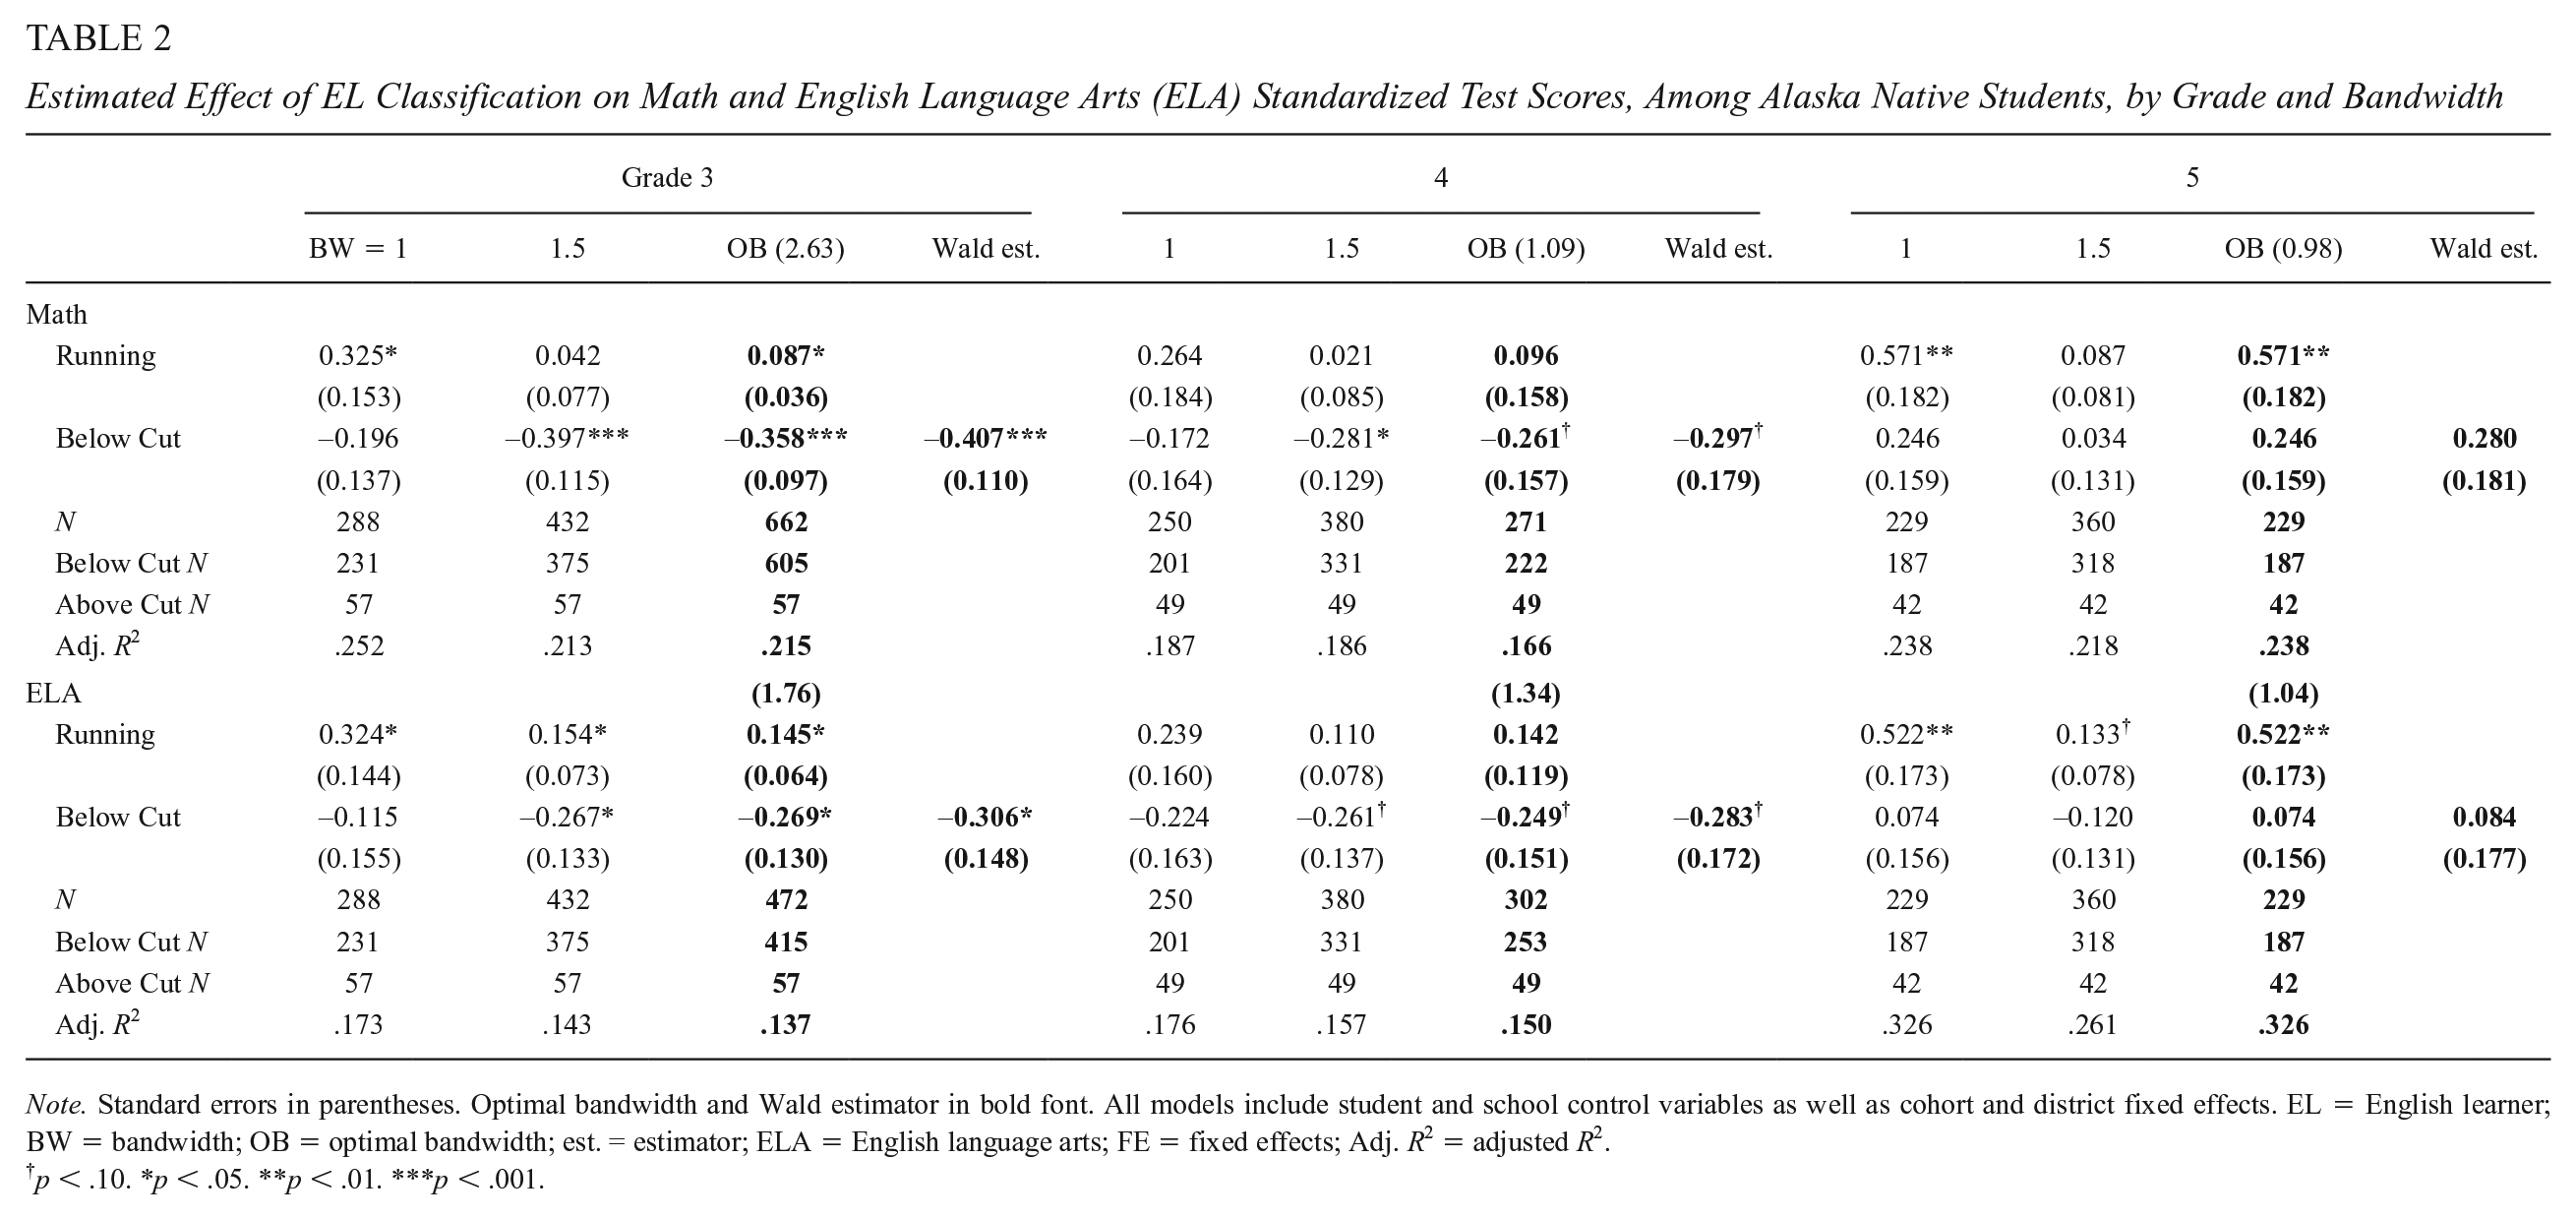
Note. Standard errors in parentheses. Optimal bandwidth and Wald estimator in bold font. All models include student and school control variables as well as cohort and district fixed effects. EL = English learner; BW = bandwidth; OB = optimal bandwidth; est. = estimator; ELA = English language arts; FE = fixed effects; Adj. R2 = adjusted R2.
p < .10. *p < .05. **p < .01. ***p < .001.
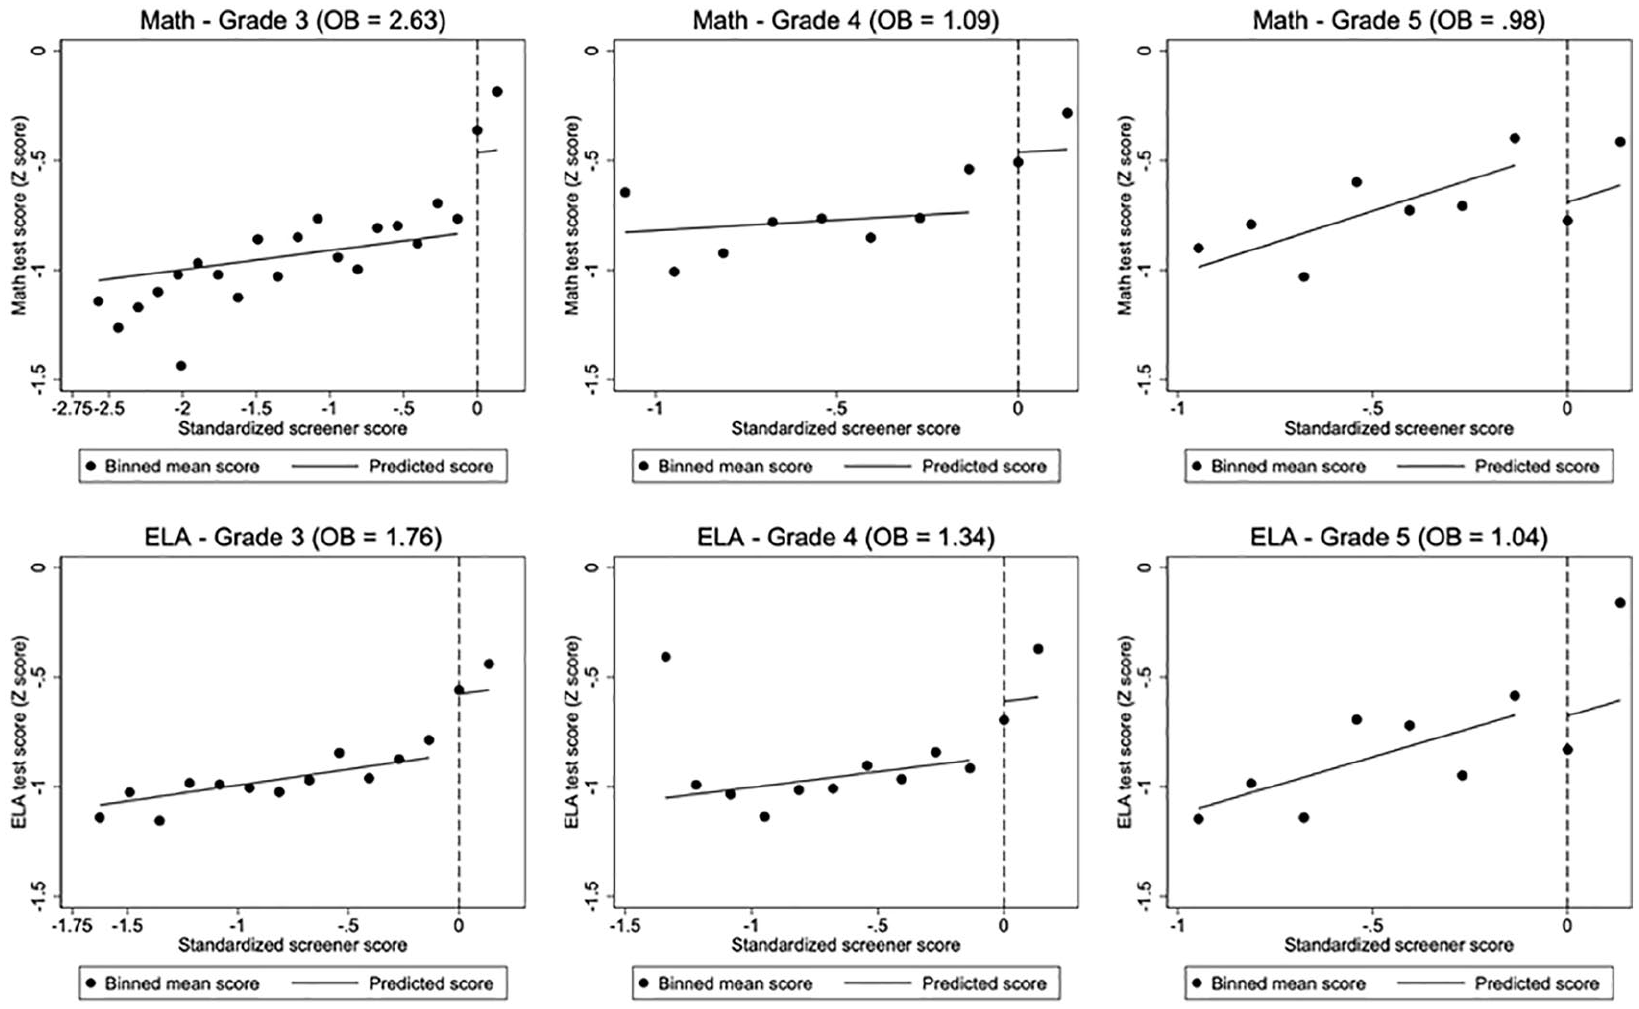
Regression discontinuity results of estimated effect of EL classification on standardized math and English language arts (ELA) test scores among Alaska Native students, by grade, using optimal bandwidths.
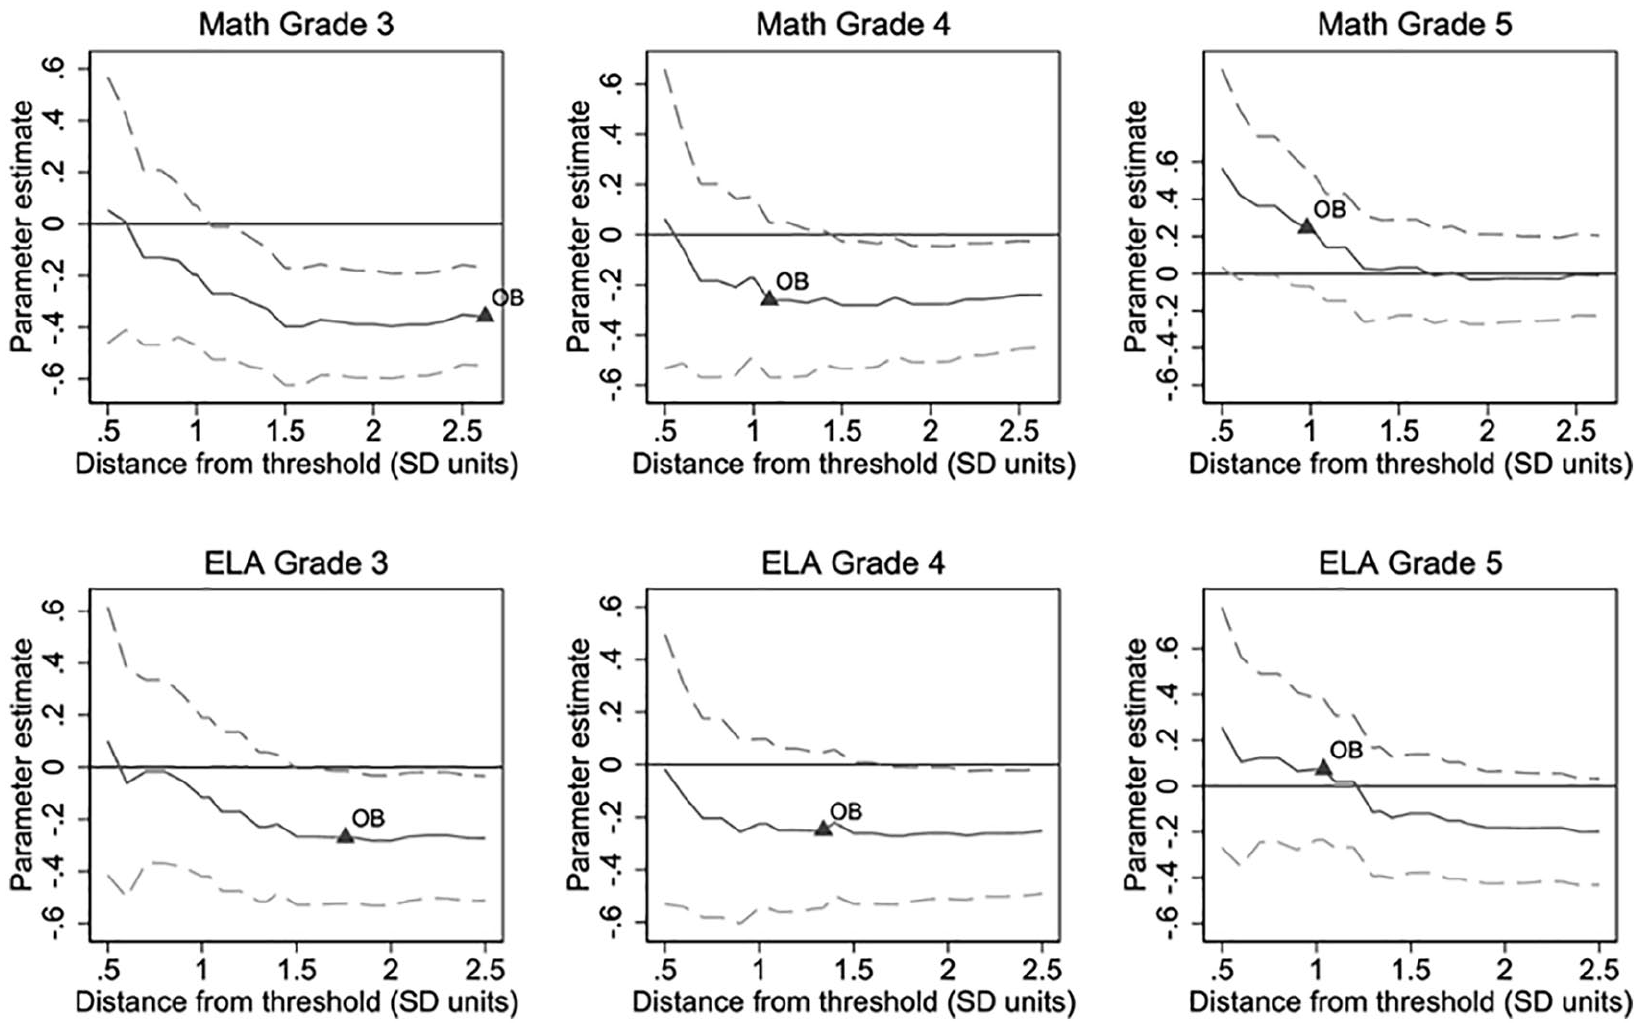
Estimated impact of EL identification on math and English language arts (ELA) achievement among Alaska Native students, by grade, across multiple bandwidths.
These third and fourth grade negative estimated effects were 2 to 4 times larger than prior estimates of negative impacts of kindergarten EL classification from studies that did not focus on Alaska Native or other Indigenous students: for example, 0.093 SD in math and 0.070 in ELA in the third grade (Umansky, 2016). The effect sizes are important in the Alaska context as well. In the third grade and over the time period examined, these effect sizes were equivalent to more than a third of the statewide achievement gap in ELA and over half of the gap in math on the state content assessment between Alaska Native and non–Alaska Native students.
The dissipation (and possible reversal) of estimated effects in Grade 5 suggests that, at the elementary level, negative effects of EL classification may have been limited to the early to mid-elementary grades. Alternatively, differences in the fifth grade may have been driven by sample or cohort differences. Figure L in Supplementary Appendix B (available in the online version of the journal) investigates this finding further. The figure plots, relative to state averages, predicted math and ELA scores of students just below, and just above, the EL threshold, in each grade, using coefficients from optimal bandwidth models. Trends in these figures suggest that the dissipation/reversal of EL classification effects in the fifth grade was driven both by gains in test scores, relative to the state mean, by students who scored just below the EL threshold and by declining test scores, relative to the state mean, of students who fell above the EL threshold. Similar patterns are evident using raw data in Figures B and C in Supplementary Appendix B (available in the online version of the journal) presented earlier.
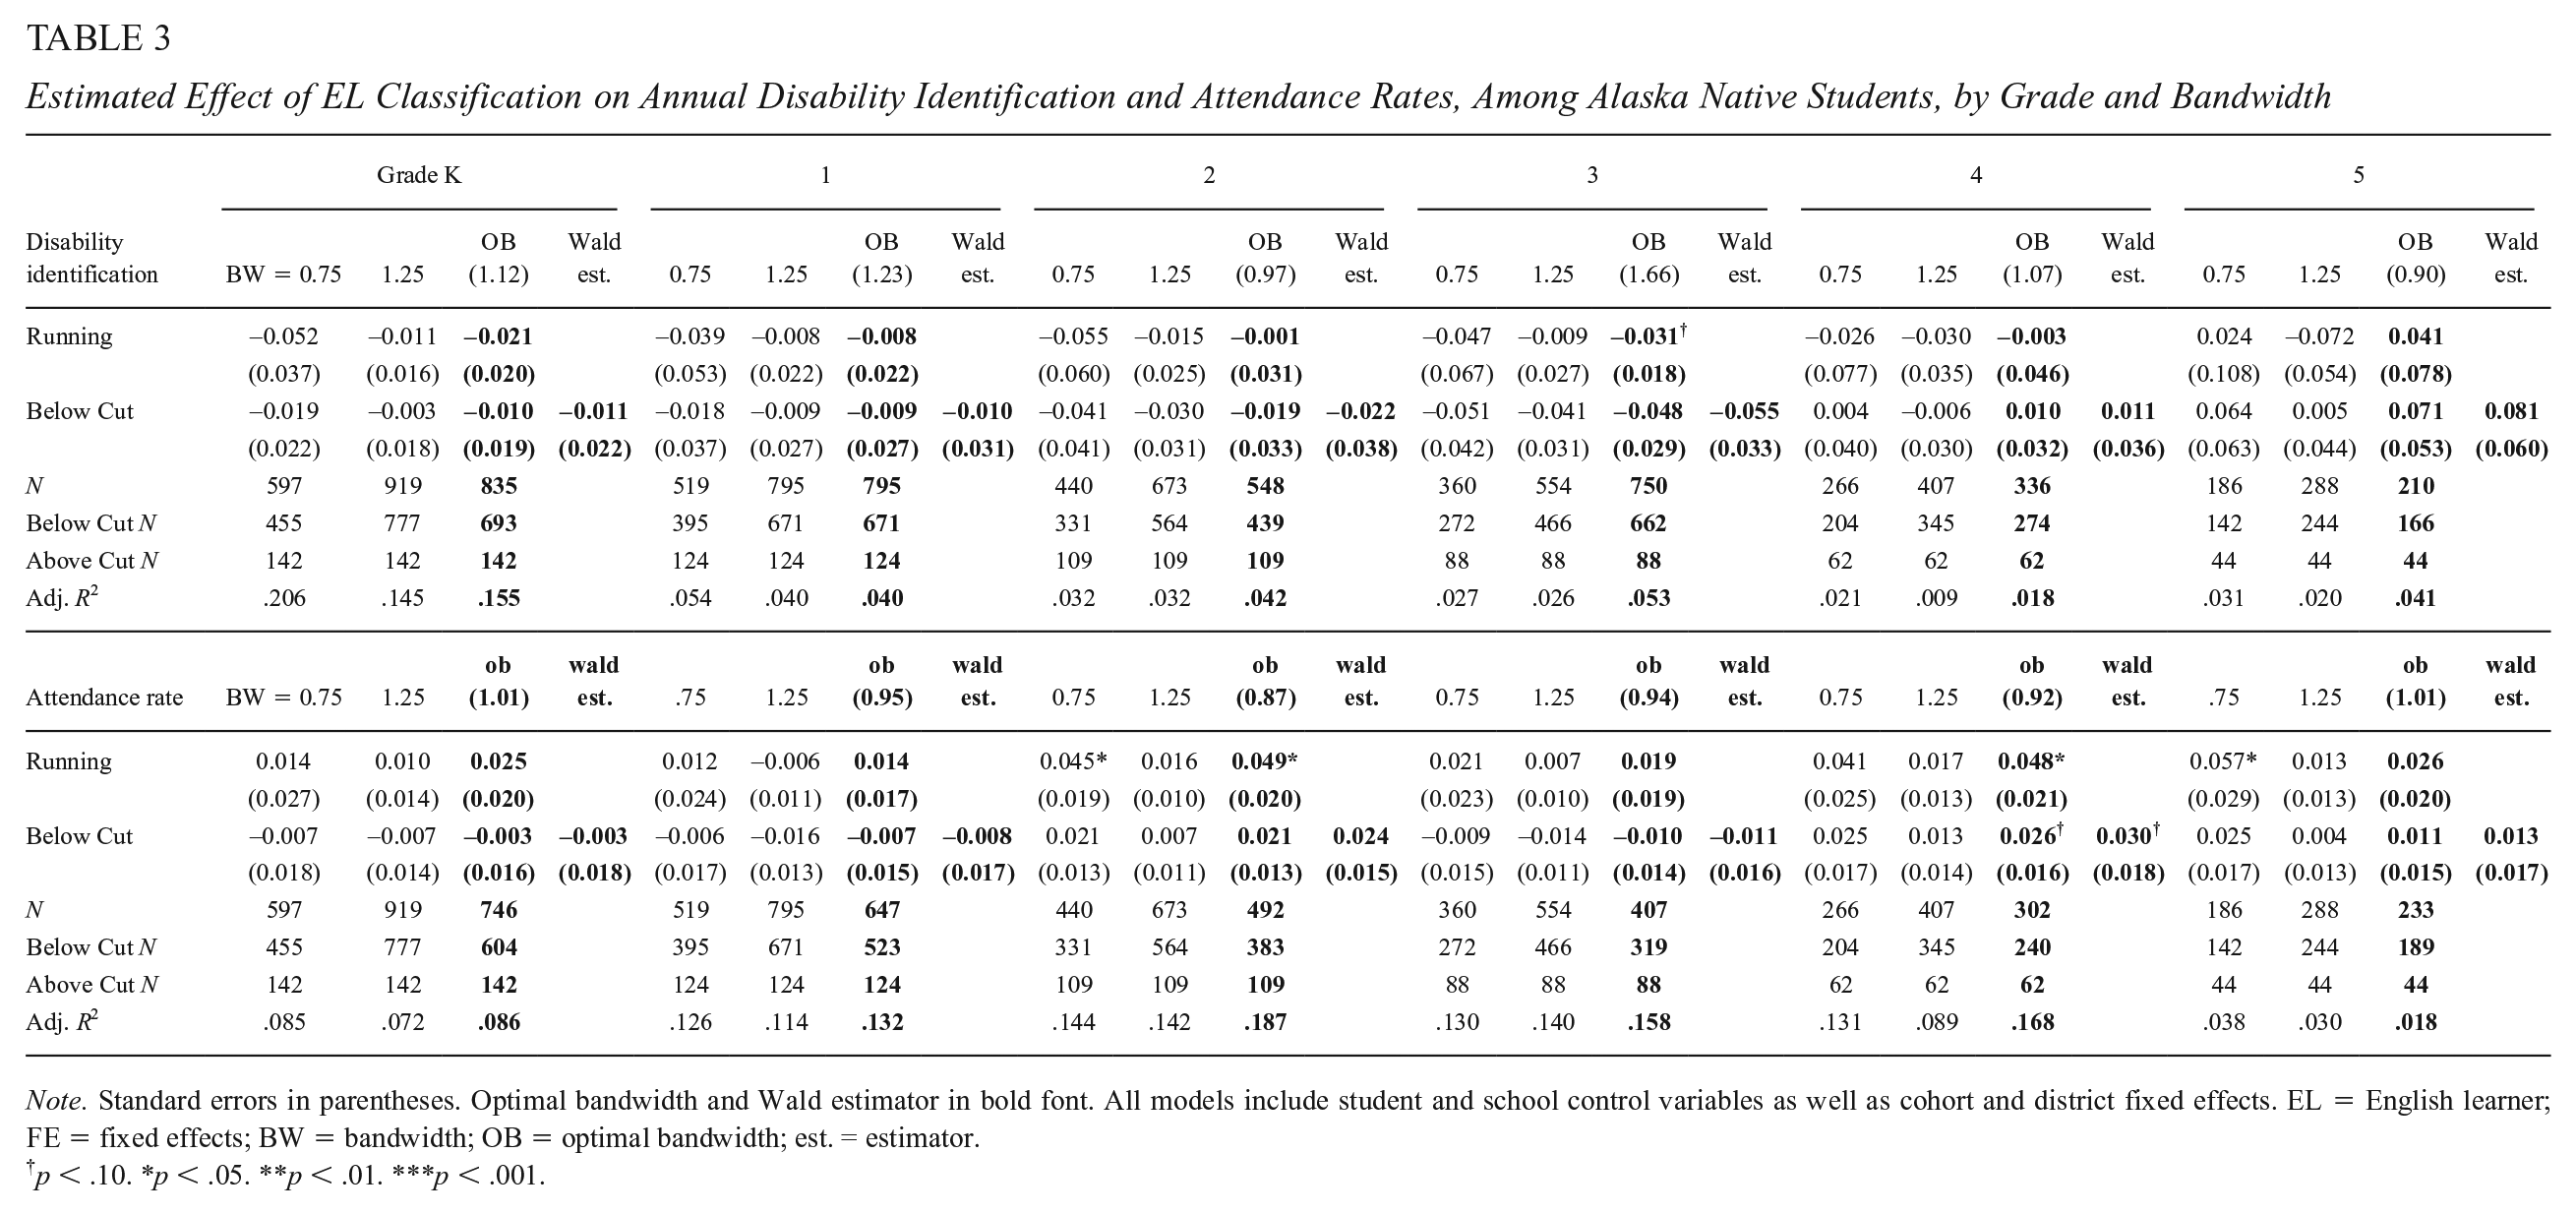
Table 3 presents results for our two non-academic outcomes: disability identification and annual attendance rates in kindergarten through fifth grade. In general, we find no statistically significant results with regard to either outcome. For disability identification, point estimates follow a pattern found in prior research and discussed later, in which EL identification is associated with lower likelihood of EL identification in early elementary (Grades K–3) and higher likelihood in upper elementary (Grades 4–5). While point estimates are meaningful in the third (−5.5 percentage points) and fifth grades (8.1 percentage points), and consistent across bandwidths, none of the results reach statistical significance.
Estimated Effect of EL Classification on Annual Disability Identification and Attendance Rates, Among Alaska Native Students, by Grade and Bandwidth
Note. Standard errors in parentheses. Optimal bandwidth and Wald estimator in bold font. All models include student and school control variables as well as cohort and district fixed effects. EL = English learner; FE = fixed effects; BW = bandwidth; OB = optimal bandwidth; est. = estimator.
p < .10. *p < .05. **p < .01. ***p < .001.
For attendance rates, point estimates were small and fluctuated in direction across grades, ranging between −1 (Grade 3) to +3 percentage points (Grade 4), equivalent to between 1.8 fewer to 5.4 more school days per year based on Alaska’s minimum number of school days (180; Education Commission of the States, 2020). Results were only marginally significant in one grade (Grade 4). Inconsistency in the pattern, small estimated effects, and minimal statistical significance indicate no detectable effect of EL classification on attendance.
In sum, there is evidence that, for students near the threshold, EL classification negatively impacted Alaska Native students’ math and ELA outcomes in the third and fourth grades, with negative effects dissipating by the fifth grade. By contrast, there is little, if any, evidence that EL classification meaningfully impacted Alaska Native students’ disability identification or school attendance.
Results across alternative RD model and sample specifications (see Tables G, H, and I and Figures F–K in Supplemental Appendix B, available in the online version of the journal) demonstrate consistency with our main models in directionality and approximate magnitude albeit with some movement in point estimate size and statistical significance. This includes models that probed our model specifications such as the no covariate model, the growth model, and models with alternative functional forms, as well as models that looked at substantively unique samples. The model that included only data from the district with specialized EL services for Alaska Native students also showed consistent results; however, negative effects of EL classification were of substantively smaller magnitude. Growth model results also supported our main findings, with significant or marginally significant negative effects in the third grade (math and ELA) that tapered (math only) in subsequent years. Of note, academic results from checks modeling slope quadratically were smaller in absolute magnitude and not statistically significant. Because the quadratic models had nearly equivalent model fit both visually and in terms of AIC, it is important to note them and consider the possibility of null findings.
Findings from CEM analyses regarding academic outcomes (see Table M in Supplementary Appendix B, available in the online version of the journal) aligned with the direction of effects estimated in the main RD approach, although again there were differences in magnitude and precision. For ELA outcomes, the effects of EL classification were, as with the RD estimates, negative and meaningful in magnitude. Unlike RD results, negative effects in ELA did not dissipate in the fifth grade. In math, results were not statistically significant and were only meaningful in magnitude in the third grade.
Differences in EL Classification Effects for Alaska Native and Non–Alaska Native Students
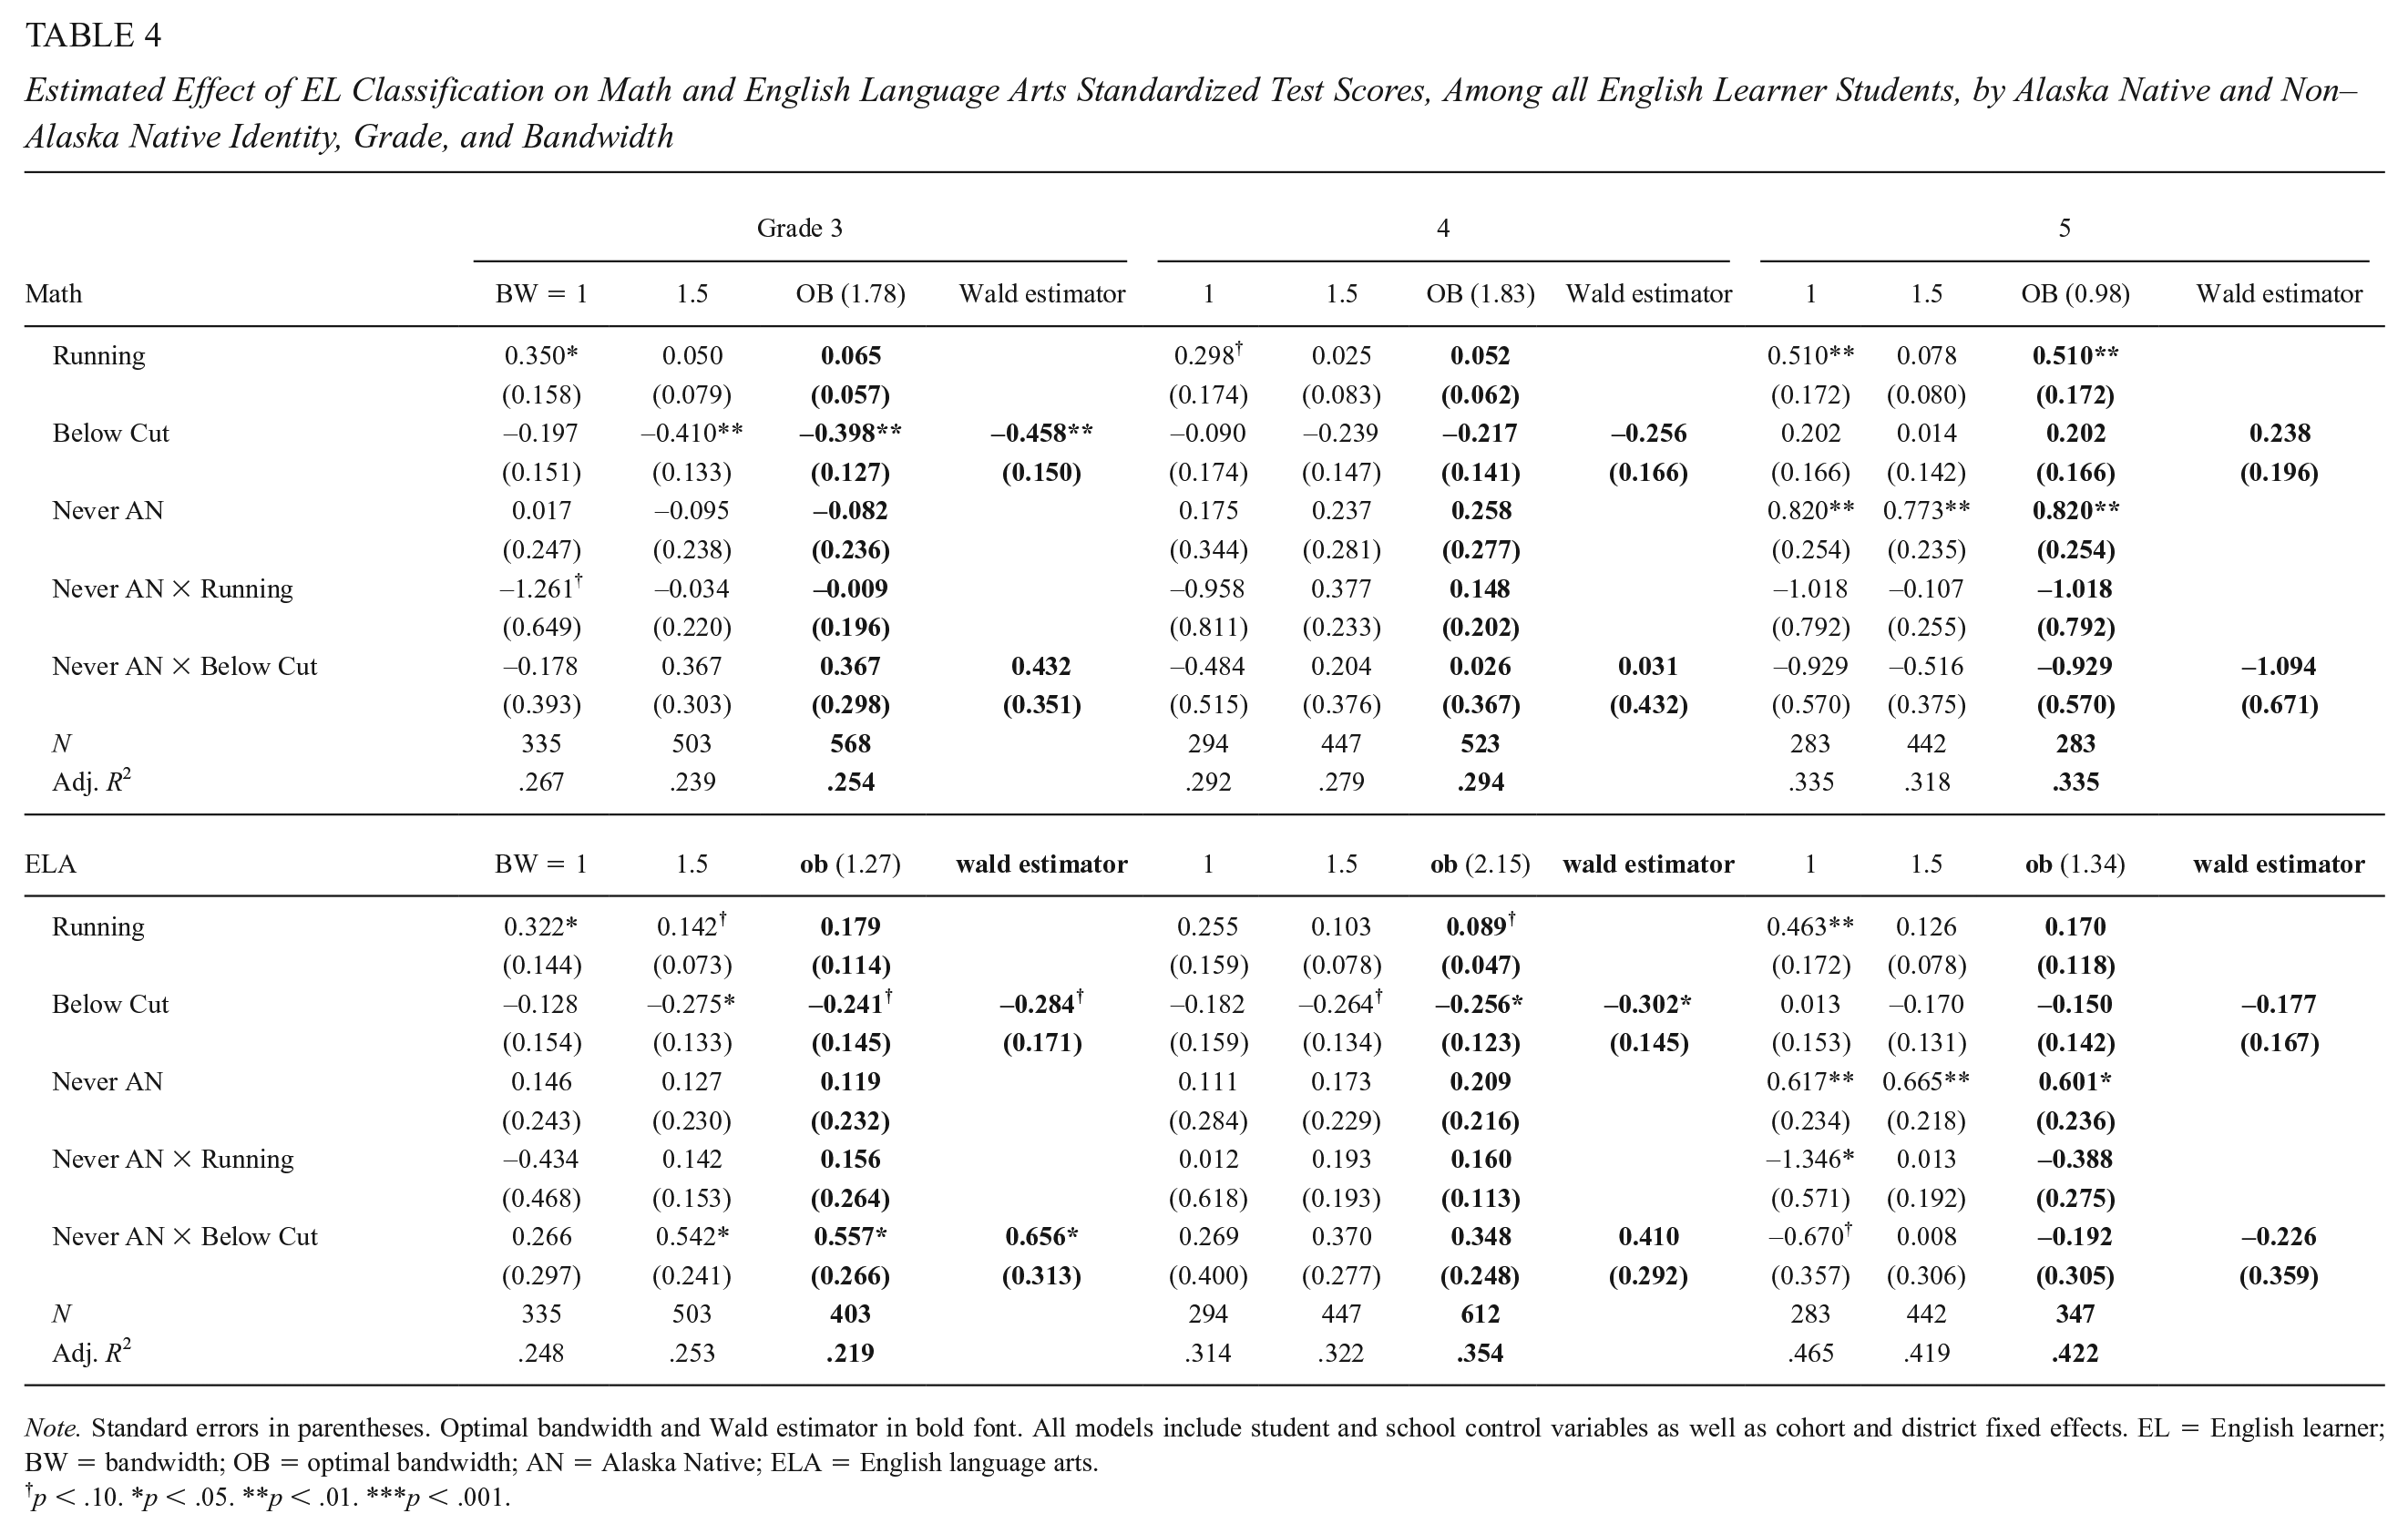
Our second research question explored differences in the estimated effects of EL classification between Alaska Native and non–Alaska Native students near the kindergarten EL threshold. Table 4 presents results for math and ELA outcomes. In both cases, estimated effects for Alaska Native students (“Below Cut”) were, as in our results for Research Question 1, sizable, statistically or marginally significant, and negative in third grade. Results remained sizable and negative in fourth but were statistically significant in ELA only. As with Research Question 1, estimated effects dissipated in the fifth grade, especially in math.
Estimated Effect of EL Classification on Math and English Language Arts Standardized Test Scores, Among all English Learner Students, by Alaska Native and Non–Alaska Native Identity, Grade, and Bandwidth
Note. Standard errors in parentheses. Optimal bandwidth and Wald estimator in bold font. All models include student and school control variables as well as cohort and district fixed effects. EL = English learner; BW = bandwidth; OB = optimal bandwidth; AN = Alaska Native; ELA = English language arts.
p < .10. *p < .05. **p < .01. ***p < .001.
The “Never AN × Below Cut” coefficients reflect the estimated difference in EL classification effects between Alaska Native and non–Alaska Native students. In both math and ELA in third and fourth grades, point estimates suggest that EL classification was less harmful (or more beneficial) for non–Alaska Native students compared with Alaska Native students, although this difference was only significant in ELA in the third grade. In the third grade, ELA-estimated effect sizes for non–Alaska Native students were positive (e.g., the coefficient on the main effect “Below cut” was −0.284 and the coefficient on the “Never AN × Below Cut” interaction was 0.656; −0.284 + 0.656 = 0.372). In the fifth grade, however, as negative EL effects dissipated among Alaska Native students, the estimated difference in effects for non–Alaska Native students in both subject areas reversed direction, suggesting possible negative effects of EL classification in that grade although these differences were not statistically significant (e.g., math: 0.238 − 1.094 = −0.856). Our robustness check using only non–Alaska Native students (Table I in Supplemental Appendix, available in the online version of the journal) aligned with these findings. Although sample sizes were very small, estimates of the effect of EL classification on third grade ELA and math scores were positive and nonsignificant. The ELA result, in particular, was meaningful in magnitude: 0.229 SD.
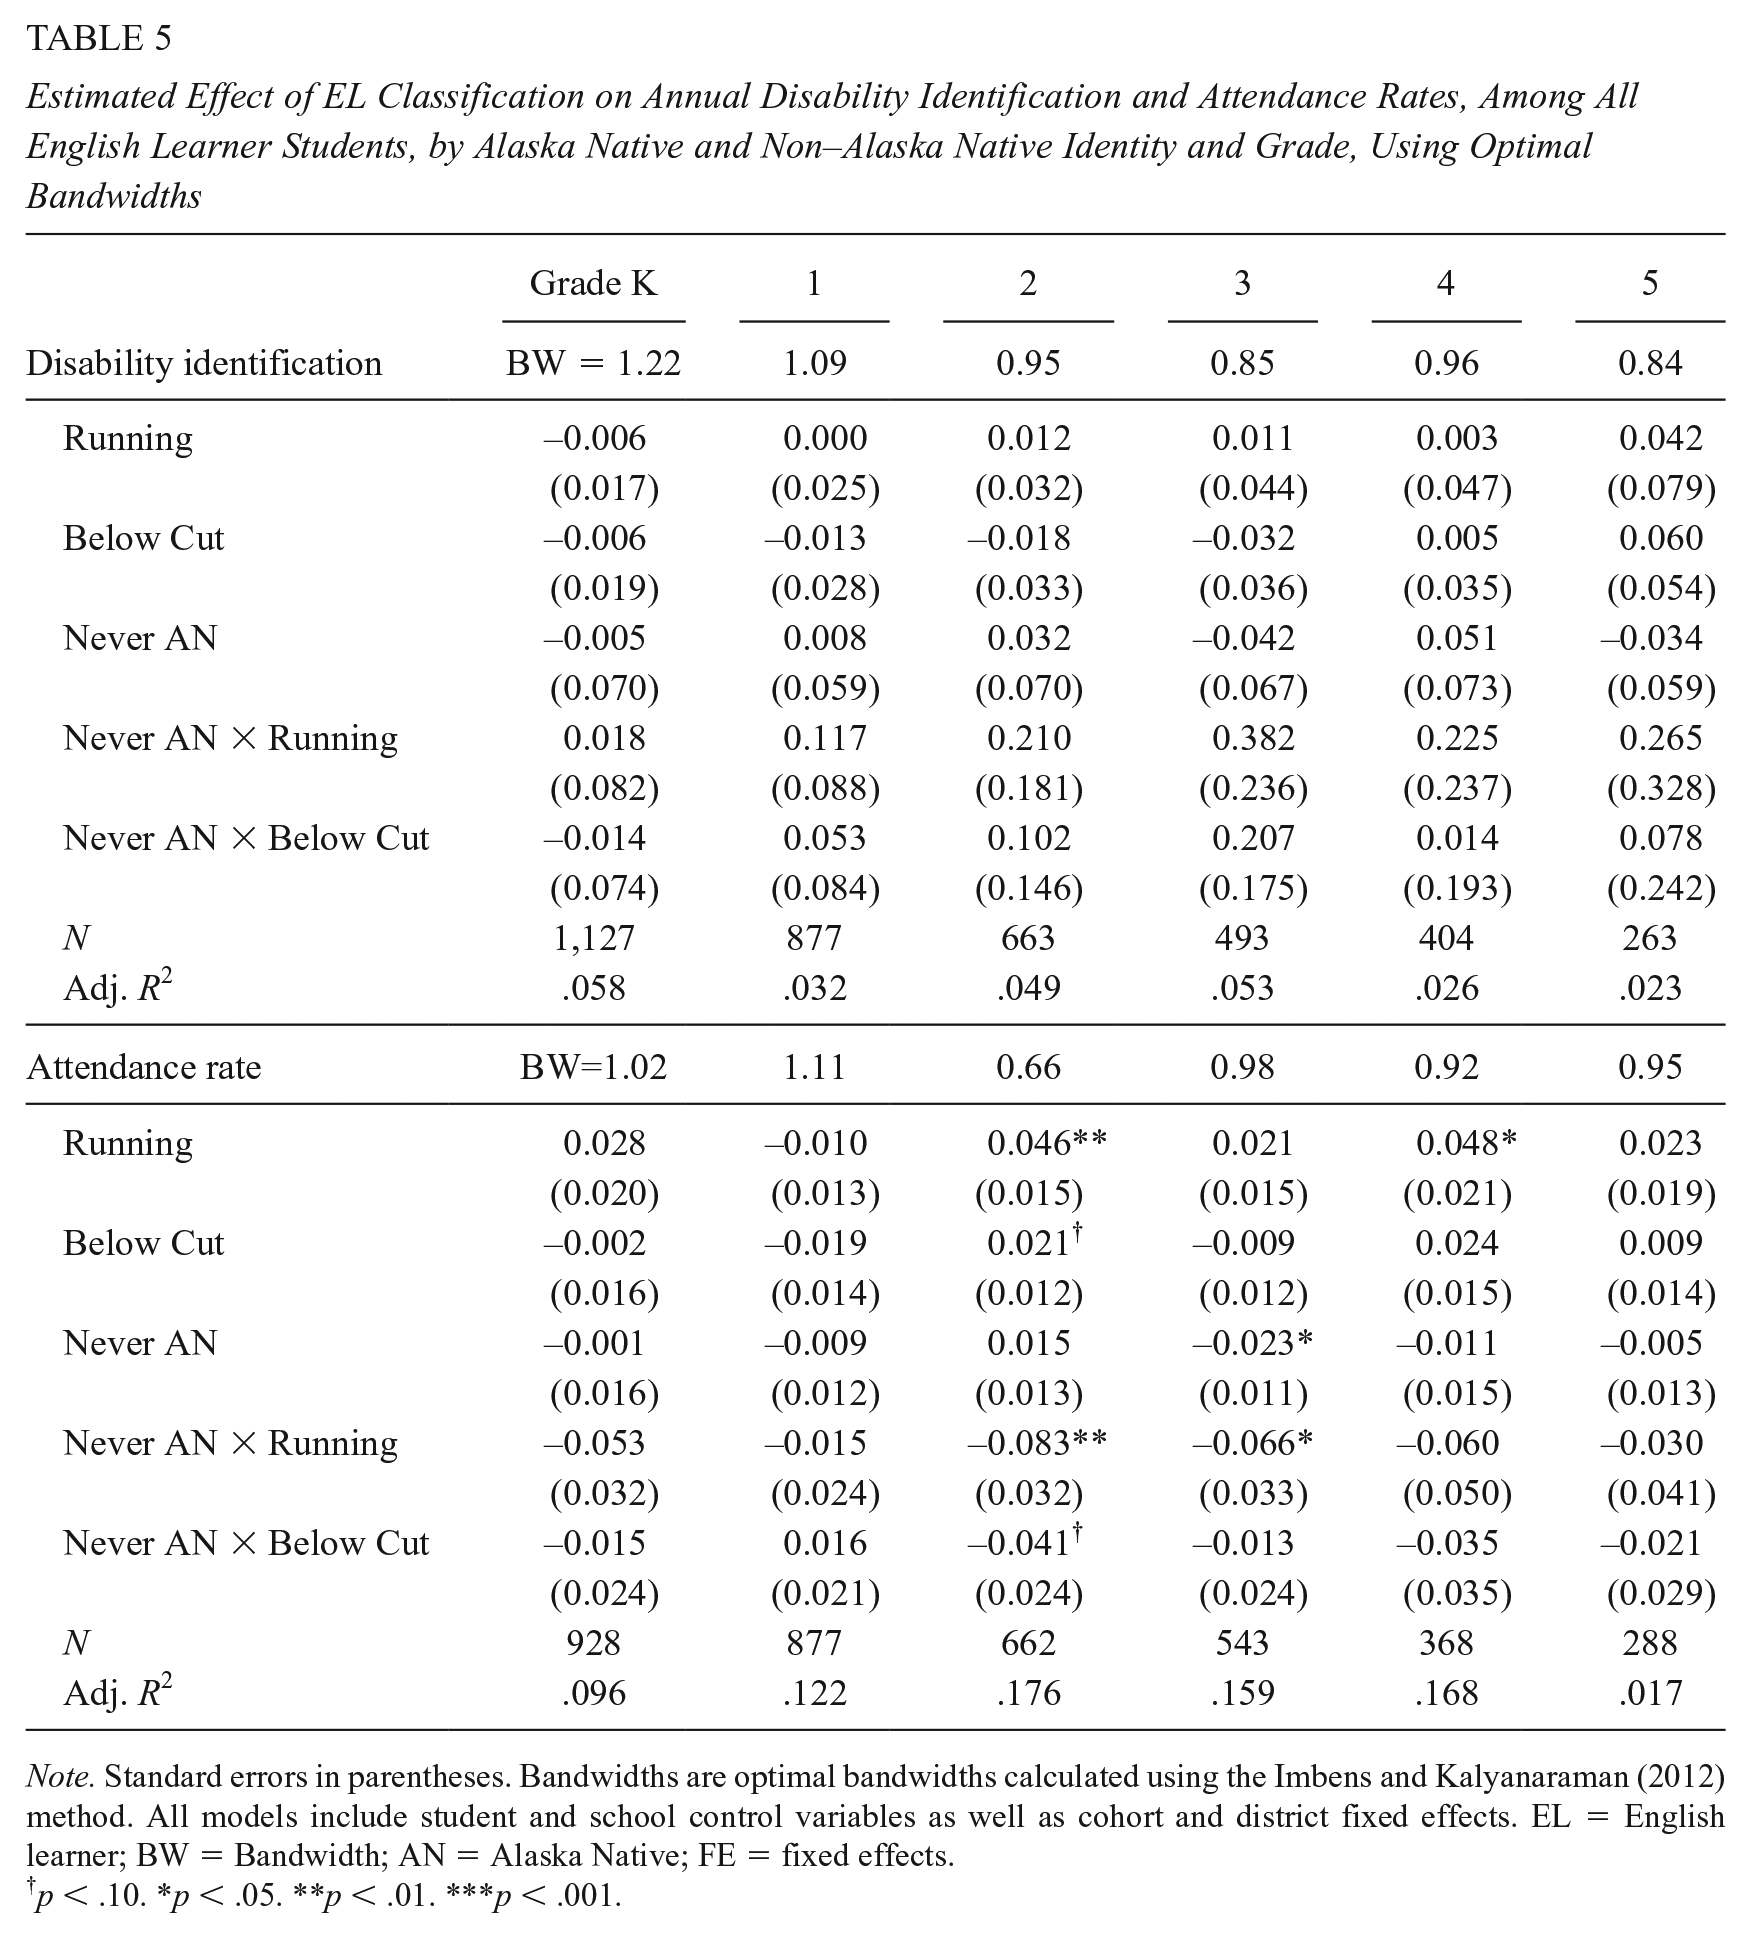
Table 5 presents results for disability identification and attendance using optimal bandwidths (Table N in Supplemental Appendix B, available in the online version of the journal, shows alternative bandwidth results). In the case of disability identification, there was no evidence that EL classification impacted Alaska Native and non–Alaska Native students differently. Point estimates for the difference between Alaska Native and non–Alaska Native students were small, unstable, and nonsignificant. In the case of attendance, point estimates on the coefficient of interest were more stable and tended to be negative, although they only approached significance in the fourth grade. These results are highly tentative but suggest that EL classification may have resulted in lower attendance rates of 1 to 4 percentage points (2–7 days annually) among non–Alaska Native students near the EL threshold in kindergarten.
Estimated Effect of EL Classification on Annual Disability Identification and Attendance Rates, Among All English Learner Students, by Alaska Native and Non–Alaska Native Identity and Grade, Using Optimal Bandwidths
Note. Standard errors in parentheses. Bandwidths are optimal bandwidths calculated using the Imbens and Kalyanaraman (2012) method. All models include student and school control variables as well as cohort and district fixed effects. EL = English learner; BW = Bandwidth; AN = Alaska Native; FE = fixed effects.
p < .10. *p < .05. **p < .01. ***p < .001.
In summary, there was evidence that EL classification may have impacted Alaska Native students near the EL threshold more negatively than non–Alaska Native students in ELA and math in third and fourth grades, but tentative indication that, as negative EL effects dissipated in the fifth grade among Alaska Native students near the threshold, they may have taken hold among non–Alaska Native students near the threshold. There was tentative evidence, as well, that EL classification may have disproportionately and negatively impacted non–Alaska Native students’ attendance.
Discussion
This study provides a first attempt toward estimating the causal impact of EL classification in kindergarten on Alaska Native students’ educational outcomes in five school districts in Alaska, including how, if at all, those impacts differ compared with EL classification impacts among non–Alaska Native students in the same districts. This question is pertinent because of the unique historical and social contexts of education for Alaska Native and other Indigenous students within the United States (Brayboy & Lomawaima, 2018) and because of the differentiated federal guidelines in EL identification for Indigenous students (ESSA, 2015). Very limited research has examined Indigenous EL-classified students’ experiences as distinct from those of non-Indigenous EL students (for an exception, see Carjuzaa & Ruff, 2016), a gap this article aims to begin to fill.
There are reasons to think that EL classification may, on average, be beneficial for Alaska Native students. EL classification is directly linked to rights, services, and funding for classified students, creating a basis of resources and specialized services for Alaska Native students who are concentrated in rural schools that are often strapped for funding, materials, and resources (C. Barnhardt, 2001; National Indian Education Association, n.d.). Our partner study found that some districts offered Indigenous heritage language immersion programs as a central component of their EL services, whereas others had EL supports related to Alaska Native community and family engagement, culturally sustaining pedagogy, or staffing of Alaska Native educators (Umansky et al., 2021). While limited, this demonstrates that EL resources and services can be targeted toward supports that theory would suggest benefit Alaska Native students.
On the other hand, among the overall EL population, EL classification has been shown to stigmatize students as non-English-proficient (Dabach, 2014; K. D. Thompson, 2015) within a wider system that values Standard American English fluency (Wiley & Lukes, 1996). EL classification can negatively impact students’ access to English-proficient peers, self-concept, course access, academic achievement, and ultimately graduation and college-going (Chin, 2020; Johnson, 2019; M. G. Lee & Soland, 2022). EL classification fails to recognize some students’ fluency in nonstandard English varieties (Flores & Rosa, 2015), and as such, services may be shaped largely around a prevalent image of an EL student of immigrant origin who has a non-English-dominant language and is acquiring English as a new language. Furthermore, there is qualitative evidence that EL services, such as ELD, may displace culturally relevant content (Siekmann et al., 2017).
Thus, it is an open question whether EL classification is beneficial to Alaska Native students. While Indigenous students make up a small proportion (8%) of EL students nationally, in several U.S. states they make up large proportions of EL students (Office of English Language Acquisition, 2020), making this question all the more critical. Nine states report an Indigenous language as one of the top five EL home languages with another four states reporting nonstandard English varieties in the top five EL home languages (Ruiz Soto et al., 2015). 9
Typically, regression discontinuity results provide strong causal estimates for students near the threshold of intervention assignment (Cook et al., 2008; Murnane & Willett, 2010), in this case students who score near the top of the state’s English proficiency screener assessments. However, in our current study, data and context limitations make our RD results more tentative. Specifically, our sample size is small, especially for non–Alaska Native students, and Alaska state policy sets the EL threshold high on the English proficiency screener assessments, resulting in few data points above the EL cut-score. We test the robustness of our results with numerous model and sample specifications as well as an examination with a wider population of causal inference. While the relative consistency of our results across these modeling specifications adds weight to our causal claims, smaller or reversed estimates at small bandwidth sizes and results in some specifications that lack statistical significance indicate the need to interpret our main results with caution.
Among Alaska Native students who enter kindergarten with relatively high measured English proficiency levels on state English proficiency screeners, we find preliminary evidence that EL classification has a large, negative impact on students’ math and ELA outcomes in the third and fourth grades. Estimated negative academic impacts were larger than those for non–Alaska Native students in Alaska and also larger than effects identified in prior literature (Chin, 2020; Cimpian et al., 2017; Johnson, 2020; Pope, 2016; Shin, 2018; Umansky, 2016).
A more nuanced story emerged with regard to fifth grade outcomes, when estimated effects among Alaska Native students dissipate (ELA) or reverse (math) while potentially worsening for non–Alaska Native students. Descriptive analysis of mean and predicted test scores across grades for Alaska Native students near the threshold indicates that dissipating negative effects may be driven both by declining test scores, relative to the state average, among Alaska Native students just above the EL threshold and by gains in test scores among Alaska Native students just below the threshold. Our partner study found that reclassification rates out of EL status picked up somewhat in late elementary, so it is possible that gains in test scores of below-threshold students may be driven, in part, by the proportion of the below-threshold sample who have exited EL status by fifth grade (Umansky et al., 2021). Of note, our robustness checks using growth modeling and CEM suggest that negative EL effects among Alaska Native students may only dissipate in math.
Results were less conclusive regarding attendance and disability identification, with limited evidence of a possible delayed effect of EL classification on disability identification. This later finding aligns with prior research regarding a possible negative effect of EL classification on disability identification for certain groups of students (Murphy & Johnson, 2022) and delayed disability identification among EL students (Umansky et al., 2017).
Limitations
While we argue that this study’s results provide initial causal estimates of the impact of EL classification on Alaska Native students in five diverse Alaska districts, the study has several limitations. Most importantly, because of where Alaska sets its EL classification threshold, we had limited data on the relationship of screener scores to our outcomes of interest for students above the EL threshold. Because of this, we consider our results preliminary and call for more research on this topic. In addition, as with all regression discontinuity studies, causal inference applies specifically to students near the treatment threshold. While we include a matching approach as a robustness check that allows for a broader population of causal inference, causal inference in matching relies on strong and difficult-to-prove assumptions. Nonetheless, the alignment in results between the two methods and the complementarity between the robustness of RDs’ causal inference with the wider population of causal inference in the matching technique give strength to our findings. We also had relatively small sample sizes, although we align this study with calls from the National Congress of American Indians (n.d.) regarding the importance of conducting quantitative analyses focused on Indigenous populations, rather than clustering them into a racial “other” category or replacing statistics with an asterisk (Unger et al., 2018). In future research, it will be essential to examine EL classification effects for other American Indian, Alaska Native, and Native Hawaiian populations.
Variation in the effects of EL classification across contexts (Cimpian et al., 2017) is likely driven by variation in the experiences students have when classified as ELs, especially what services they receive, and how services align with their linguistic and academic skills and interests. Given the unique policy, language, and historical context of Alaska Native (and other Indigenous) EL students, critical questions for future research relate to how EL services are adapted for Indigenous EL students, including the prevalence of heritage language programs as an EL service for Indigenous students. Research should also examine how Indigenous ELs who speak English as their dominant language are supported in school, focusing on the services they receive and whether these services are differentiated from those acquiring English as a new language.
This study drew on data from five districts, two of which were predominantly Alaska Native. While sample sizes were too small to thoroughly examine district variation, it is conceivable that districts whose EL populations are primarily Indigenous may align services to better meet the needs of these students (Callahan et al., 2008). We see suggestive evidence of this from District 4, a district with a large Alaska Native population that offers Yupik bilingual education, hires Indigenous bilingual staff, and works to engage families in developing students’ heritage languages. In our sensitivity checks comparing District 4 effects in third grade with those of the other four districts, we observe consistent negative effects but of a considerably smaller magnitude. This aligns with prior work which suggests that EL classification effects differ by instructional setting, and that negative effects may be avoided in bilingual settings (Umansky, 2016).
This study found evidence that negative EL effects may dissipate by the end of elementary school. Future research should examine whether negative effects are confined to early to mid-elementary grades, or whether, given exacerbated tracking and stigmatization of EL-classified students at the secondary school level (K. D. Thompson, 2015), negative effects are observed in middle and high school grades.
Implications for Policy and Practice
We close with implications of this work for policy and practice. First, the finding that, among students near the threshold, EL classification has a large, negative estimated impact on Alaska Native students’ academic outcomes in third and fourth grades begs a foundational question of whether EL classification is appropriate for monolingual English-speaking Alaska Native students as currently specified in ESSA (2015), and if so, what is meant by a non-English language having a “significant impact” on students’ English proficiency. Currently, while the EL definition is differentiated for Indigenous students, there is no federal guidance on how to operationalize and adapt services based on this alternative definition. Of note, non-Indigenous student groups whose primary language is a nonstandard English variety (influenced by heritage languages and forced linguistic assimilation), such as some Black and Latinx students, are not currently eligible for EL classification and services (Baldwin, 1997; Paris & Ball, 2011; Santa Ana & Bayley, 2008).
Few states have clear and differentiated procedures for identifying Indigenous EL students, although some, including Montana, Washington, and North Dakota, are exceptions (Umansky et al., 2022). Alternative and more direct mechanisms to support the educational opportunities and outcomes of Alaska Native and other Indigenous students might include funding for schools serving high proportions of Indigenous students and supports for Indigenous heritage language immersion programs through Title VI of the Elementary and Secondary Education Act (ESEA).
If Alaska Native students continue to be identified as ELs in the absence of a non-English home language, then our results suggest that current EL services, at least in the five districts examined and at least in the mid-elementary grades, may not be meeting Alaska Native students’ needs. This is not altogether unsurprising, given that the current required elements of EL service provision (ESSA, 2015; Lau v. Nichols, 1974) are not closely aligned with the educational foci put forward as important for Indigenous students. But EL services do not need to be shaped around goals that are less relevant to students with more advanced English skills or those looking to develop a heritage language. As described earlier, the federal EL definition appears to consider the lasting impacts of past policies and, therefore, differentiate EL eligibility for American Indian and Alaska Native students. EL services and goals could also be differentiated for Indigenous students. These extended or differentiated goals could include heritage language development, culturally relevant instruction, and bi-dialectical instruction that both honors students’ non–Standard English varieties and teaches Standard American English development (Brayboy & Castagno, 2009; Charles, 2005; Delpit, 1995; Lipka & Adams, 2004; Lipka & Ilutsik, 1995; McCarty & Lee, 2014; McCarty, 2008; Nelson-Barber & Trumbull, 2015; Pearson et al., 2013). Indeed, the National Advisory Council on Indian Education, in an annual report to congress, calls for expansion of Indigenous language development and revitalization programs through Title III of ESEA (National Advisory Council on Indian Education, 2016), as does a broad group of Alaska stakeholders through the Alaska Native Knowledge Network (2001) and a national report on EL education from the NASEM (2017).
Despite acculturative policies focused on English acquisition, EL-classified students and their families and communities have historically pushed back and shaped EL supports to better meet their needs and interests (Charles, 2005; Schultz, 2016). We hope the findings from this study can be used by Alaska Native and other Indigenous stakeholders to advocate for their interests as they pertain to Indigenous student EL identification and service provision. This might include advocating for resources for supporting Indigenous EL-classified students and clarification on the use of EL funds for Indigenous students whose primary language is English and/or who want to develop their heritage language. Most fundamentally, how and when Alaska Native and other Indigenous students should be identified for EL classification, and how they should be served and supported while EL-classified, are important decisions that should be considered and determined by the communities most impacted by these policies and practices, centering Indigenous self-determination in any policy and practice discussions.
At the federal level, the Department of Education’s Office of Indian Education and Office of English Language Acquisition could convene a group of Indigenous stakeholders to determine what a significant impact on English language proficiency should mean and what EL supports should look like for Indigenous students who want to develop their heritage languages and for those who are already fluent English speakers of nonstandard varieties. At the state and local level, Alaska Native and other Indigenous communities, educators, families, and leaders should be the foremost decision-makers in how EL supports are shaped and enacted for Indigenous students. Existing organizations such as the Alaska Native Language Preservation and Advisory Council and district Indian education parent committees are potential spaces for Alaska Native communities to shape EL services and supports.
Supplemental Material
sj-pdf-1-epa-10.3102_01623737221144320 – Supplemental material for Resource for Self-Determination or Perpetuation of Linguistic Imposition: Effects of English Learner Classification Among Alaska Native Students*
Supplemental material, sj-pdf-1-epa-10.3102_01623737221144320 for Resource for Self-Determination or Perpetuation of Linguistic Imposition: Effects of English Learner Classification Among Alaska Native Students* by Ilana M. Umansky, Manuel Vazquez Cano and Lorna M. Porter in Educational Evaluation and Policy Analysis
Footnotes
Acknowledgements
As authors, we would like to extend our gratitude and appreciation for meaningful discussion and feedback which shaped the intent, design, analysis, and writing of this study. Acknowledgement and thanks go to anonymous district and school leaders from the five school districts included in this study, as well as to Ashley Pierson, Michelle Hodara, Mandy Smoker-Broaddus, Teresa McCarty, Bryan Brayboy, Elijah Moreno, Robert Linquanti, and Gary Cook. We are grateful to the Alaska Department of Education and Early Development and to Education Northwest for their support of this work.
Declaration of Conflicting Interests
The author(s) declared no potential conflicts of interest with respect to the research, authorship, and/or publication of this article.
Funding
The author(s) received no financial support for the research, authorship, and/or publication of this article.
Notes
Authors
ILANA M. UMANSKY, PhD, is an associate professor in the College of Education at the University of Oregon. Her research focuses on education policy as it influences the opportunities and outcomes of multilingual students, immigrant-origin students, and students classified in school as English learners.
MANUEL VAZQUEZ CANO, MS, is a principal researcher at Education Northwest, as well as a PhD Candidate at the University of Oregon College of Education. His research focuses on the educational experiences of immigrant and multilingual students.
LORNA M. PORTER, PhD, is currently a research associate at WestEd. Her research focuses on education policies that shape the opportunities and outcomes of students classified as English learners.
References
Supplementary Material
Please find the following supplemental material available below.
For Open Access articles published under a Creative Commons License, all supplemental material carries the same license as the article it is associated with.
For non-Open Access articles published, all supplemental material carries a non-exclusive license, and permission requests for re-use of supplemental material or any part of supplemental material shall be sent directly to the copyright owner as specified in the copyright notice associated with the article.