
Abstract
This article provides evidence about predictive relationships between features of community college interventions and their impacts on student progress. This evidence is based on analyses of student-level data from large-scale randomized trials of 39 (mostly) community college interventions. Specifically, the evidence consistently indicates that impacts tend to be larger as the number of intervention components increases and with the degree to which interventions promote full-time enrollment in fall and spring and/or summer enrollment. Less consistent evidence suggests that impacts tend to be larger for interventions that increase advising, tutoring, and, to a lesser extent, financial support. These results provide food for thought about the design of future community college innovations to be tested by researchers or tried by practitioners.
Keywords
I
Two decades later, MDRC has completed 31 RCTs of 41 (mostly) community college interventions in 45 U.S. institutions, 1 involving 67,400 students, most of whom were from low-income families (Diamond et al., 2021). In addition, numerous other researchers and organizations have conducted RCTs of community college interventions. Consequently, the What Works Clearinghouse (WWC) has now published reviews of 48 postsecondary RCTs that meet their evidence standards without reservations. 2
To help pave the way for learning further lessons from this large and growing body of research, MDRC constructed a restricted-access data set composed of consistently measured student-level data from all postsecondary RCTs that MDRC has led. This data set is known as The Higher Education Randomized Controlled Trial or THE-RCT (Diamond et al., 2021).
Capitalizing on student-level outcome data from THE-RCT, plus detailed coding of key features of the interventions represented in the THE-RCT, we address the following questions:
To what extent is variation in the impacts of interventions in THE-RCT database on student academic progress predicted by the number of components that an intervention includes (its comprehensiveness)?
To what extent is this impact variation predicted by the presence and intensity of specific intervention components?
These questions focus on unpacking the value-added of specific intervention features, as opposed to identifying specific promising program models. Effect estimates for a few program models already exist in the prior literature (e.g., see Miller and Weiss (2021) for City University of New York’s [CUNY] Accelerated Study in Associate Programs [ASAP], Weiss, Visher, et al. (2015) for learning communities, and Mayer et al. (2015) for performance-based scholarships). Instead of focusing on which program models are most effective, this article attempts to understand why some program models are more effective than others based on their features/components. This provides exploratory evidence regarding program features that tend to be present in more effective program models.
In what follows, we provide background for the present analysis, introduce the features of community college interventions that were studied, describe the methodology that was used, report findings that were obtained, and discuss implications and limitations of those findings.
Background
In fall 2020, community colleges served nearly 5 million students, representing 29% of U.S. undergraduates (Integrated Postsecondary Education Data System [IPEDS], 2020). Despite providing unprecedented access to postsecondary education, their student degree attainment rates are quite low. Among first-time, full-time students seeking degrees or certificates whose first postsecondary school is a 2-year public institution, only 31% graduate within 3 years (IPEDS, 2021).
Practitioners and scholars who study college success have identified multiple systemic issues, institutional practices, and student barriers that create and sustain this problem (Baum et al., 2013; Braxton, 2002; Calcagno et al., 2008). These impediments include, among others, the financial costs of attending school (for tuition, fees, housing, transportation, food, etc.); competing time and resource demands of school, work, and family; the need to navigate complex institutional systems (e.g., to meet financial aid and degree requirements); underfunded student support services; campus environments that do not foster a sense of belonging for all students; and insufficient preparation for college-level work, often due to negative systemic influences on students’ prior educational preparation (e.g., the absence of academically rigorous high school course offerings; T. Bailey et al., 2010, 2015; Bettinger et al., 2012; Bound et al., 2007; Denning, 2017; Horn et al., 2004; Karp, 2016; Kolenovic et al., 2013; Perna et al., 2015).
To address the challenges created by these barriers, many community college interventions have been implemented. The strategies incorporated by these interventions have varied widely, reflecting differences in the barriers they intend to address and available resources. For example, these interventions range in comprehensiveness from a single component like financial support, enhanced student advising, or a college success course, to varying combinations of these and other components described later. Furthermore, the durations of these interventions range from a single semester to multiple years.
Although many rigorous RCTs have found these interventions to improve student academic progress, only a few have found large improvements. In addition, there are few rigorous syntheses of the lessons learned from this growing body of research. Existing syntheses have tended to focus on a specific intervention type or student subgroup.
Prominent examples of this narrower focus include syntheses of impact evaluations of performance-based scholarships (Mayer et al., 2015), learning communities (Weiss, Visher, et al., 2015), grant aid (Nguyen et al., 2019), loss of financial aid (LaSota et al., 2021), and enhanced advising (Karp et al., 2021), plus the IES WWC practice guide on strategies for helping postsecondary students in developmental education (T. Bailey et al., 2016). These syntheses contribute substantially to the postsecondary “what works” knowledge base, but there are limitations.
The first five examples focus on evidence from multiple RCTs and quasi-experimental designs (QEDs) of a particular intervention type or class, with limited knowledge building across intervention types. The sixth example considers many intervention types but focuses only on students referred to developmental education, thereby excluding strong evaluations for different target populations.
Intervention Features Studied by the Present Analysis
The present analysis builds on the preceding research by examining a wide range of community college interventions for a diverse student sample to assess how variation in intervention features is related to variation in intervention impacts on student academic progress. These features include the number of components in an intervention (its comprehensiveness) and the presence and intensity of specific components hypothesized to increase academic progress.
When reforming current educational practice or designing new educational programs, community colleges can choose among these features in accord with their budget, personnel, and institutional constraints. Thus, plausible evidence (even if it is only suggestive) about the potential effectiveness of intervention features can help inform such decisions.
The growing body of evidence about the effectiveness of specific community college interventions, most of which are multicomponent service packages, is valuable for understanding the impacts of these packages. Thus, evidence-based decision-making is becoming possible for colleges or college systems considering the adoption of these packages. However, evaluations of these bundled packages rarely seek to identify the added value of their individual components. Thus, practitioners or researchers looking to create their own bundle of intervention components have limited information about the added value of the individual components from which they might choose, especially as part of a package.
To rectify this situation, this article uses data from rigorous evaluations of the impacts of 39 community college interventions to begin to identify the effectiveness of their specific components. This research is based on a statistical analysis of the extent to which the presence and intensity of seven popular intervention components predict intervention impacts. As explained later, these predictive analyses can only provide suggestive evidence about the extent that intervention components cause intervention impacts to increase; they cannot confirm this causality. Nonetheless, the present findings provide considerable food for thought about how to advance future community college research and practice.
Intervention Components That Have Been Evaluated Previously
This section briefly reviews what has been learned to date from rigorous evaluation studies about the effectiveness of specific community college intervention components.
Increased Financial Supports
To reduce financial barriers to student success, community college interventions often provide financial supports, such as free textbooks, scholarships, or tuition waivers. If such support helps students afford college attendance, reduces their need to work for pay, or reduces their need for loans, it can reduce financial stress and competing demands on students’ time. In addition, some financial supports, like the provision of cash or transit cards for attending required advising sessions, can be used to incentivize desired student actions.
Prior RCTs have produced ample evidence that financial reforms are part of intervention packages that positively, although often modestly, influence students’ academic progress (e.g., see Angrist et al., 2009, 2010, 2014, 2016; Anzelone et al., 2020; Bettinger et al., 2012; Cohodes & Goodman, 2014; Deming & Dynarski, 2009; Goldrick-Rab et al., 2016; Mayer et al., 2015).
Increased Advising
Insufficient or underutilized advising services are commonly cited as obstacles to student success in community college. Student-to-adviser ratios are typically high, and students are rarely provided with ongoing, comprehensive advising. A common response to this problem is to provide enhanced advising to help students navigate institutional systems, identify and address academic or personal problems, and make connections to needed resources.
Some enhanced advising interventions assign students to a dedicated adviser who can provide frequent ongoing support. In these situations, students may be required to attend a specified number of advising sessions. In addition, as noted earlier, financial incentives have been used to encourage this attendance.
A fairly robust RCT literature on approaches to enhancing academic advising has documented positive, although often modest, impacts on student academic outcomes (e.g., see Avery et al., 2014; T. Bailey et al., 2016; Barr & Castleman, 2017; Bettinger & Baker, 2014; Carrell & Sacerdote, 2013; Evans et al., 2017; Karp et al., 2021; Oreopoulos & Petronijevic, 2016; Scrivener & Weiss, 2009), with occasional null findings (e.g., see C. Miller, Cohen, et al., 2020).
Increased Tutoring
Tutoring is commonly available at community colleges but is often underutilized. To address this issue, some interventions have provided enhanced tutoring to all students or a specific subgroup of students (e.g., those on academic probation) to help them pass specific courses. For example, enhanced tutoring is sometimes used to help students become college-ready in subjects for which they have been referred to developmental education. Sometimes tutors are imbedded in class; other times students meet with tutors outside of class.
Direct evidence about the independent impact of enhanced tutoring is limited because it is often one of multiple components in a reform package (e.g., see Barnett et al., 2012; Gardenhire et al., 2016; Patel & Valenzuela, 2013; Scrivener et al., 2018; Sommo & Ratledge, 2016; Weiss et al., 2019).
Learning Communities
Learning communities, a popular reform strategy for community colleges, place cohorts of students together in two or more linked courses with mutually reinforcing themes and assignments and faculty who try to coordinate their efforts. These courses usually last one semester and occasionally provide added support, such as advising or tutoring.
The theory of change for learning communities predicts that they increase student engagement and facilitate student connections with their peers and instructors. This theory also predicts that the interdisciplinary links imbedded in learning communities enable students to develop higher-order thinking skills, master course material more quickly, pass more of their classes, and maintain more consistent future enrollment (Smith et al., 2009; Visher et al., 2008; Weiss et al., 2019).
Learning communities are a frequently evaluated reform (Visher & Teres, 2011; Weiss et al., 2010; Weissman et al., 2011, 2012). A synthesis of this evidence, based on RCTs for 6,794 students from six community colleges, indicates that learning communities have small positive impacts on student academic progress (Weiss, Visher, et al., 2015). However, learning communities also have been part of broader reform packages that produced larger student impacts (Weiss, Mayer, et al., 2015).
Student Success Courses
Some community college interventions include a student success course, designed to help students navigate college and build personal and academic skills. Common course topics include information about a student’s college, assistance in academic and career planning, and techniques for setting goals and improving study skills. Success courses are taught by a range of community college staff, including instructors who teach other courses and academic advisers who typically do not teach courses. Student success courses are usually provided when a student starts community college.
Several RCTs of interventions that include a student success course have yielded mixed findings, with some positive impacts (Weiss, Mayer, et al., 2015) and some mixed or null findings (Weiss et al., 2010, 2011; Weiss, Mayer, et al., 2015; Weissman et al., 2011).
Promoting Full-Time and Summer Enrollment
Enrolling full-time or during the summer is an indicator of academic momentum that is associated with improved student outcomes (Attewell et al., 2012). Some interventions strictly require full-time enrollment as part of a broader package of services, while others nominally require full-time enrollment, without penalties for dropping to part-time enrollment. Other interventions financially incentivize full-time or summer enrollment, in some instances financially rewarding earning 12 or more credits rather than rewarding attempting 12 or more credits. Still other interventions promote full-time or summer enrollment (PFTSE) through messaging campaigns, by email, text, or mail.
Such strategies have a track record of achieving this goal and improving student academic progress (Anzelone et al., 2020; C. Miller, Headlam, et al., 2020; C. Miller & Weiss, 2021; Patel & Rudd, 2012; Ratledge et al., 2021; Weiss et al., 2019; Weiss, Mayer, et al., 2015).
Instructional Reform
Although instructional approaches vary widely across community college classrooms, heavy reliance on lectures remains a dominant approach. However, some recent instructional reforms to this approach have been rigorously tested. These reforms include, among other things, techniques for positioning students as active learners through discussion and guided learning, the use of technology to tailor instruction to individual student needs, modification of developmental math courses to better align with students’ programs of study, and integrating developmental reading and writing to leverage their synergy.
Several RCTs of these and other instructional reforms have documented varying degrees of success at improving student outcomes (Logue et al., 2016; T. Miller, Daugherty, et al., 2020; Rutschow et al., 2019; Weiss et al., 2021; Weiss & Headlam, 2019).
Intervention Comprehensiveness
Other things being equal, it seems reasonable to expect that comprehensive interventions with multiple components that focus on multiple barriers to student progress will produce larger impacts than more narrowly focused interventions with fewer components. This expectation is consistent with past research (e.g., Bertrand et al., 2019; C. Miller, Headlam, et al., 2020; C. Miller & Weiss, 2021; Roder & Elliott, 2019; Scrivener et al., 2015).
This expectation is also consistent with the fact that community college students face a broad range of barriers to academic success, which different intervention components are designed to address. For example, navigating the complex bureaucracy of college can stifle some students, and enhanced advising might help them to overcome this barrier. Lack of resources to pay the full cost of college may hold back other students, and financial support might alleviate some of this burden. Difficulties in mastering required course material may prevent yet another group of students from progressing, and enhanced tutoring or instructional reforms may help to solve this problem. Furthermore, by addressing multiple barriers to student progress, multicomponent interventions should produce positive impacts for a broader range of students than would a single-component intervention.
Moreover, for many students there are multiple barriers to success. Thus, interventions with multiple complementary components that address multiple barriers would seem, on their face, to be more promising than interventions with fewer components addressing fewer barriers.
Method
The present methodology is based on prior research about how best to use individual-level data from multisite RCTs to estimate true cross-site impact variation and to model hypothesized predictors of this variation (see H. S. Bloom et al., 2017; H. S. Bloom & Spybrook, 2017; Raudenbush & Bloom, 2015, for discussion of the statistical methods involved; see Weiss et al., 2014, for a discussion of the conceptual framework; and see H. S. Bloom et al., 2003; Weiss et al., 2017, for two large-scale empirical applications of the approach).
The approach uses multilevel random-effects models (Raudenbush & Bryk, 2002) to quantify and predict impact variation across interventions in THE-RCT database based on data for individual students. It is similar in some ways to “meta-regressions” that use impact estimates from existing studies to estimate a distribution of true impacts (Pigott & Polanin, 2019).
The Present Sample of RCTs
Our analysis is based on data from 30 of the 31 postsecondary RCTs that MDRC had led when work on this article began. 3 Hence, the analysis reflects almost a total enumeration of this subpopulation of large-scale RCTs. 4 For further information, see Supplementary Figure A.1 in the online version of the journal for a PRISMA 5 Flow Diagram describing the number of interventions and students studied.
The 30 RCTs in the present analysis are all high quality. Twenty-seven have been reviewed by the U.S. Department of Education’s WWC and all 27 met the WWC’s evidence standards without reservations. 6 The three RCTs that have not yet been reviewed by the WWC almost certainly will meet those standards because their design, analytic approach, and attrition rates are similar to the 27 RCTs that were reviewed.
Furthermore, the present 30 RCTs comprise a sizable portion of all U.S. large-scale community college RCTs. For example, only 36 large-scale (n > 350) postsecondary RCTs have been reviewed by the WWC and met its evidence standards without reservations. 7 As noted earlier, 27 of the RCTs in our analyses met WWC standards without reservations. Hence, the generalizability of our findings to all large-scale postsecondary RCTs that met WWC standards without reservation may be quite strong.
Finally, because the present analysis is intended to explore predictive relationships between key features of community college interventions and the impacts of those interventions on student academic progress, the ability of the present RCT sample to support this type of analysis is far more important than its ability to generalize impact findings to a specific population of community college interventions. Thus, what is most important for the present RCT sample is the amount of variation in intervention features and intervention impacts it represents, and thus its ability to support precise estimates of covariation between these factors. As shown later, the present sample provides considerable such variation.
The principal limitation of the present sample, however, is the number of interventions tested (33 or 38, depending on the student outcome, as shown in Supplementary Figure A.1 in the online version of the journal). This factor limits the number of intervention features that can be used together in a multipredictor model of intervention impacts, which, in turn, limits the ability of the present analysis to disentangle separate predictive relationships between intervention features and intervention impacts.
Nonetheless, as will be demonstrated, analysis of data for the present sample and the extensive sensitivity tests of the present findings that were conducted provide credible evidence about predictive relationships between the intervention features studied and intervention impacts.
Data Sources
Data for the present study are from three main sources.
MDRC’s THE-RCT Restricted Access File (THE-RCT RAF)
Student data were obtained from THE-RCT RAF, a restricted-access student-level database created by MDRC and housed at the University of Michigan’s Inter-university Consortium for Political and Social Research (ICPSR). These data include information about each RCT (e.g., its experimental group indicators) plus student academic outcome data by semester (for enrollment and credit accumulation). Academic outcome data were originally derived from college or system transcript records and National Student Clearinghouse records.
Reports and Articles
All studies represented in THE-RCT were documented by reports, journal articles, and/or research and policy briefs. Most of these information sources include information about intervention components, implementation fidelity, and so on. This information was used to code intervention components and comprehensiveness. See Supplementary Appendix F in the online version of the journal for references.
Communication With Report Authors
When coding features of the interventions, there were several instances where we contacted the original study authors to clarify information.
Outcome Measures 8
The present findings are based on student-level data from THE-RCT for two measures of student academic progress:
Total credits accumulated during students’ first year after random assignment. This measure indicates students’ progress toward a degree, which typically requires at least 60 college-level credits. 9 Thirty-three interventions have such data (see Supplementary Figure A.1 in the online version of the journal).
Student enrollment during their third semester after random assignment. To make academic progress, students must continue to enroll in school over time. Thirty-eight interventions have data for this measure (see Supplementary Figure A.1 in the online version of the journal).
By focusing on these two short-term student outcomes, we minimize sample loss due to limited follow-up duration. Specifically, (a) for total credits accumulated through Year 1, no students or studies were lost due to limited follow-up, 10 and (b) for student enrollment in Semester 3, only one study (AtD Mentoring) and about half the sample from another study (Performance-based Scholarships [PBS] Variations) were lost due to limited follow-up.
In contrast, to examine intervention impacts on 3-year degree completion (a common time frame for examining graduation rates for community college students), it would have only been possible to use 15 of the 39 interventions in THE-RCT. This much smaller sample would vitiate our already limited ability to estimate separate conditional predictive relationships for intervention features from multipredictor models and would greatly reduce the statistical precision of estimated unconditional predictive relationships from single-predictor models.
Notably, among students and studies for whom 3 years of follow-up data are available, there is a strong correlation (r = .77) between estimated intervention impacts on Year 1 credits accumulated and estimated impacts on 3-year degree completion. Hence, our short-term findings for credit accumulation may provide insights about what to expect for degree completion.
Finally, information about the presence and intensity of intervention components (our predictors) is only available consistently through students’ first year after random assignment. Thus, we can only measure intervention features that can directly influence short-term impacts.
Coding Intervention Features
Members of our broader research team coded each intervention in our database with respect to the presence and intensity of its core components and its comprehensiveness.
Intervention Components
Intervention components were coded based on a conceptual framework developed by Weiss et al. (2014). This framework focuses on the content of an intervention (its services/activities), the quantity of an intervention (e.g., its dosage), and the conveyance of an intervention (by whom and how it was delivered). The framework also focuses on program and control group service differences produced by an intervention (its “service contrast”). Coding of the intensity of specific intervention components was thus based primarily on information about program and control group service-receipt differences.
Because service contrasts for specific intervention components vary substantially, we could quantify predictive relationships between intervention features and intervention impacts. For example, during Year 1 after random assignment, the EASE intervention provided US$76 more in financial support per program group student than was received by the average control group student. In contrast, the PBS NY intervention provided over US$2,000 more per program group student. We thus measured the “intensity” of interventions’ financial support as a linear function of its average program and control group difference, which was scaled from a minimum of 0 (for no support) to a maximum of 1 (for the most support observed). 11
For intervention components with less consistent reporting, we developed codes by closely examining all interventions and creating categories that reflect their variation in intensity. For example, we created a five-category indicator of the average difference in the number of contacts with an advisor experienced by program and control group students. We then scaled these categories in equal intervals from 0 to 1 to represent the range of values from the least to most intense versions of intervention-induced advisor use. Supplementary Table A.1 in the online version of the journal describes the resulting codes for all intervention features and Supplementary Table A.3 in the online version of the journal lists their coded values for each intervention.
Intervention Comprehensiveness
We also created a measure of intervention comprehensiveness, which counts the number of components coded for each intervention, ranging from 0 to 6. Although this measure does not represent an intervention component, it represents a potentially important feature of community college interventions that is hypothesized to influence their impacts.
For further information on the process used to code these intervention features, see Supplementary Appendix E in the online version of the journal.
Statistical Models
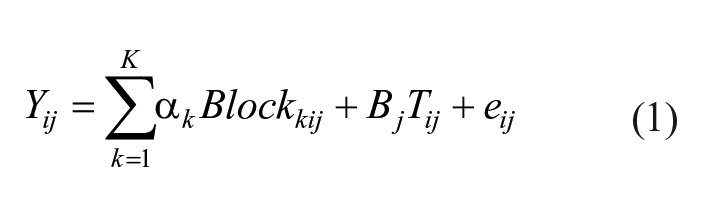
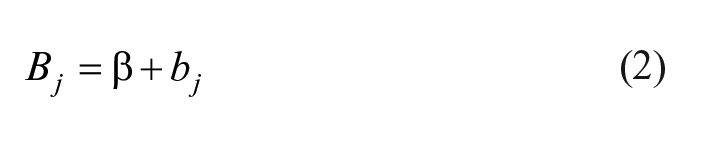
The first step in our analysis for each student outcome was to estimate the mean (β) and standard deviation (τ) across interventions of true impacts of random assignment to treatment (i.e., intent to treat). This was done by estimating the following fixed intercept, random treatment coefficient model, which is similar to that recommended by Raudenbush and Bloom (2015) and H. S. Bloom et al. (2017).
Level 1 (Students):
Level 2 (Interventions):
In this model,
We next estimated the statistical relationship between
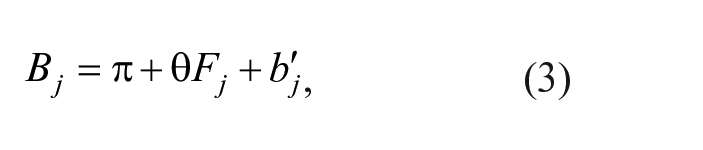
where
Because the intensity of each intervention component is measured on a scale from 0 (for absence of the component) to 1 (for its most intense version), its regression slope, θ, equals the difference between mean impacts for the component’s least and most intense versions. We refer to this difference as the impact increment for the component.
For intervention comprehensiveness, which equals the number of components in an intervention, θ equals the change in mean impact per additional component. However, θ times the maximum observed number of intervention components (six) equals the difference between mean impacts for our least and most comprehensive interventions (the impact increment for intervention comprehensiveness).
Note that θ in Equation 3, which represents the unconditional predictive relationship between the intensity of a given intervention feature and intervention impacts, does not control for predictive relationships that might exist for other intervention features whose intensities are correlated with F across interventions. To achieve this statistical control, we estimated the conditional relationship between the intensity of a given intervention feature,

The slope for each feature in the model (
To avoid overfitting models like Equation 4 by including too many predictors for the number of available data points (i.e., interventions) and to limit statistical precision loss from multicollinearity among intervention features, we developed a series of sensitivity tests of single-feature results. These sensitivity tests estimated conditional predictive relationships between specific intervention features and intervention impacts, holding constant a small number of other potential impact determinants. Specifically,
Four-component model: We estimated a multivariate version of Equation 4 that included intensity measures for the four intervention components with single-feature evidence of an ability to predict intervention impacts (our “promising” components).
Two-feature models: We estimated a series of “two-feature” versions of Equation 4, each of which included a measure of intervention comprehensiveness plus an intensity measure for one of our promising components.
Single-feature model with student characteristics: We re-estimated our single-feature models with the addition of intervention-level average student characteristics for which we have data (gender, age, and race/ethnicity). 12
Single-feature model with setting characteristics: We re-estimated our single-feature models with the addition of setting characteristics for which we have data (urbanicity and institution size). 13
Full study sample and full study sample without ASAP: We estimated all models, for our full sample of interventions and for our full sample minus two interventions (CUNY ASAP and ASAP Ohio) that had unusually large impact estimates and unusually intense intervention components, and thus might have had undue influence on our findings.
We then based our conclusions about the ability of specific intervention features to predict (and perhaps causally influence) intervention impacts on the “preponderance of evidence” from this full set of analyses.
Findings
As important context for our main analyses, this section first describes the RCTs and students in our analysis, illustrates the distribution of impact estimates across interventions, and presents estimates of the mean and standard deviation of true impacts across interventions. The section then presents findings from our full set of analyses.
RCTs and Students in the Analysis
Supplementary Tables A.2 through A.5 in the online version of the journal describe each of our RCTs in terms of the components and duration of the intervention they tested, the number of sites that were involved, student sample sizes, student demographics, and characteristics of the educational institutions involved.
This information indicates that the present RCTs are highly diverse. For example, they range in size from 444 students to about 9,000 students and from between 1 and 10 community college campuses. In addition, the interventions tested range in scope from light touch approaches to comprehensive programs and from one semester to 3 years of duration.
These interventions targeted widely varying student populations, such as students from low-income backgrounds, students who were new to college, or students who were referred to remedial coursework (see Supplementary Table A.4 in the online version of the journal).
Student demographics also varied widely (see Supplementary Tables A.5a and A.5b in the online version of the journal). Most students were female, although one intervention only served men. In 11 interventions there was no racial majority, in four interventions Black students were the majority, in 16 interventions Hispanic students were the majority, and in eight interventions White students were the majority. The interventions took place in urban, suburban, and rural/town locations, and at large, medium and small colleges, although most were at large colleges in cities (see Supplementary Table A.5c in the online version of the journal).
Table 1 summarizes the prevalence of each intervention component in our analysis. Note that financial support, the most prevalent component, is part of 51% of the interventions studied. Next were increased advising usage (38%) and promotion of full-time or summer enrollment (33%). The least prevalent components were increased tutoring usage (28%), instructional reforms (26%), learning communities (23%), and success courses (23%).
Prevalence of Intervention Components
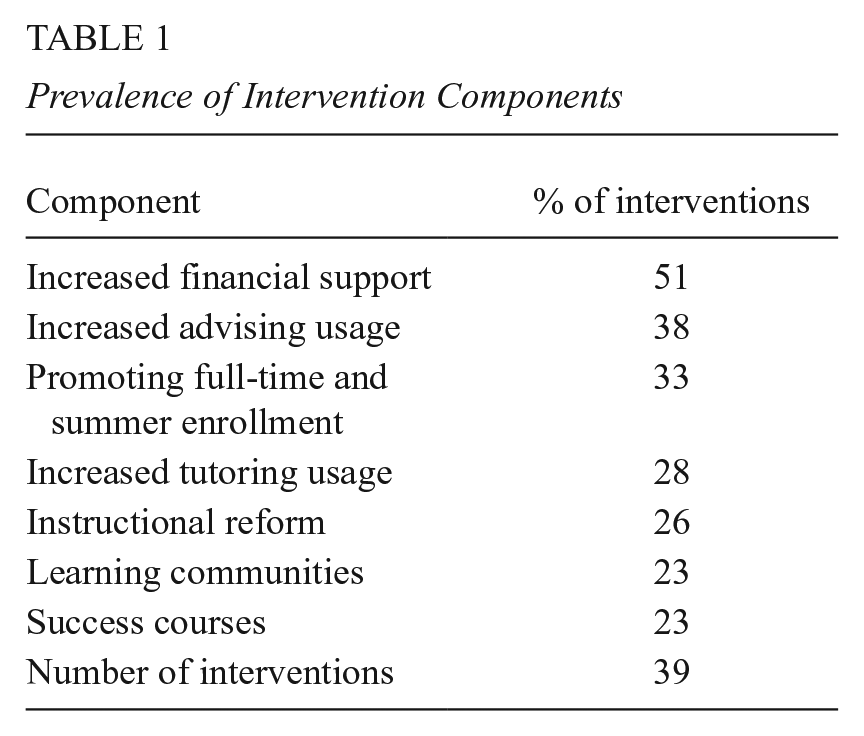
Table 2 reports the percentage of interventions with different numbers of components. Note that 59% have multiple components, which highlights the challenge of identifying the separate impact contributions of specific intervention components.
Comprehensiveness of Interventions
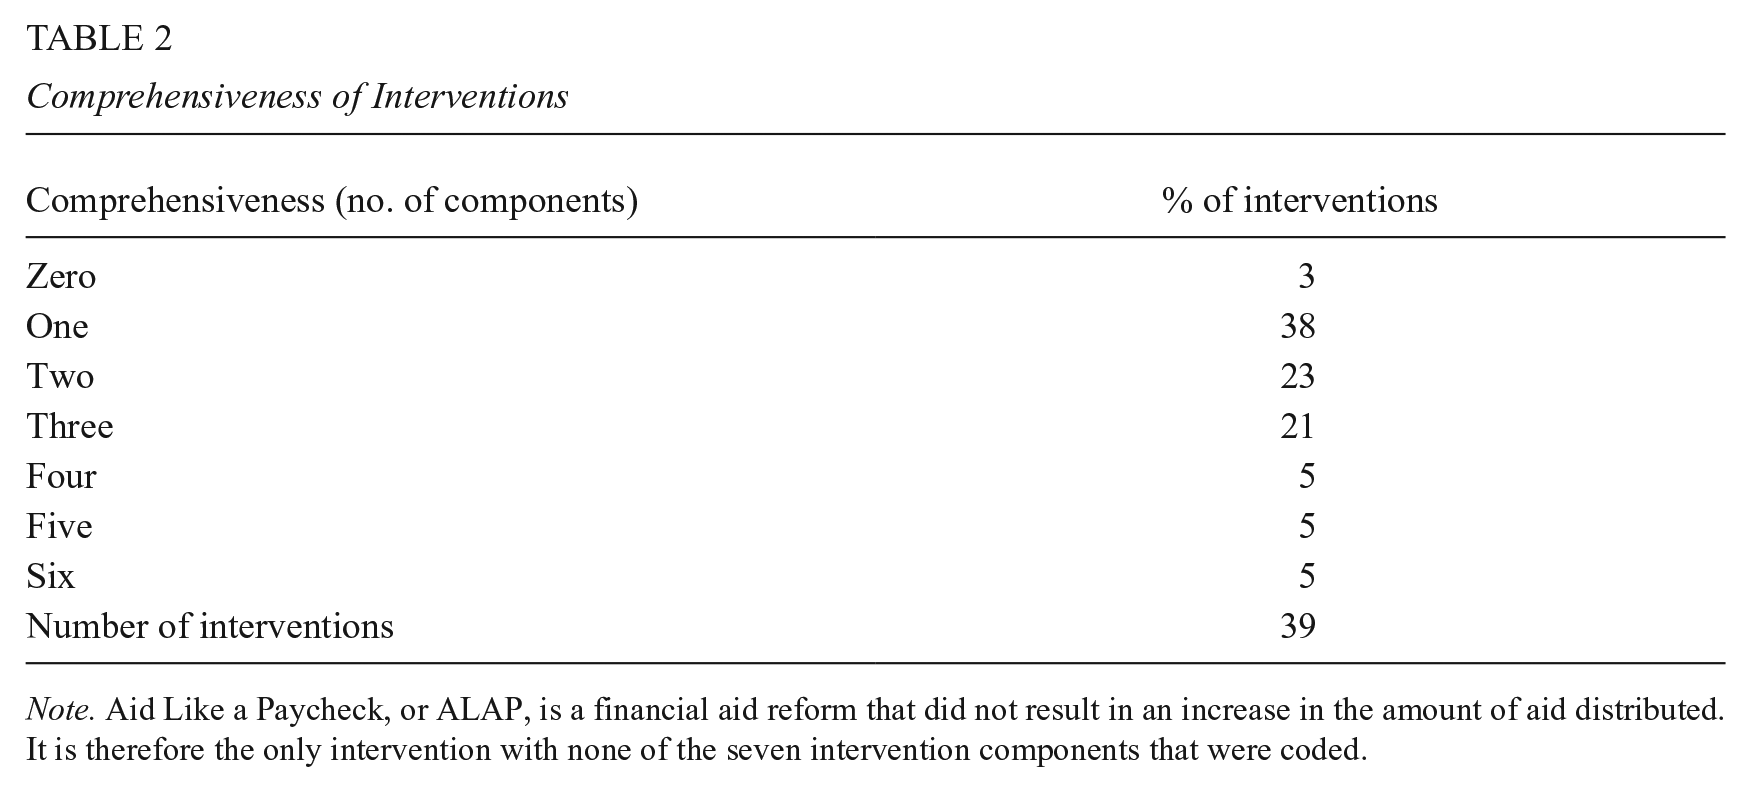
Note. Aid Like a Paycheck, or ALAP, is a financial aid reform that did not result in an increase in the amount of aid distributed. It is therefore the only intervention with none of the seven intervention components that were coded.
Distributions of Impact Estimates—Individual Study Results
Before presenting our main results, it is useful to examine the distribution of intervention impact estimates upon which they are based. For this purpose, Figure 1 presents a Forest Plot of estimated impacts on credits accumulated through students’ first year after random assignment. 14 Interventions are listed in the order of the magnitude of their estimated impact, and for each intervention, the figure displays its abbreviated name, its impact estimate, and the 90% confidence interval of this estimate. The horizontal axis of the figure indicates the direction and magnitude of each impact estimate. Supplementary Figure A.2 in the online version of the journal presents related findings for impacts on third-semester enrollment, which are highly correlated with impacts on credits accumulated (r = .74).
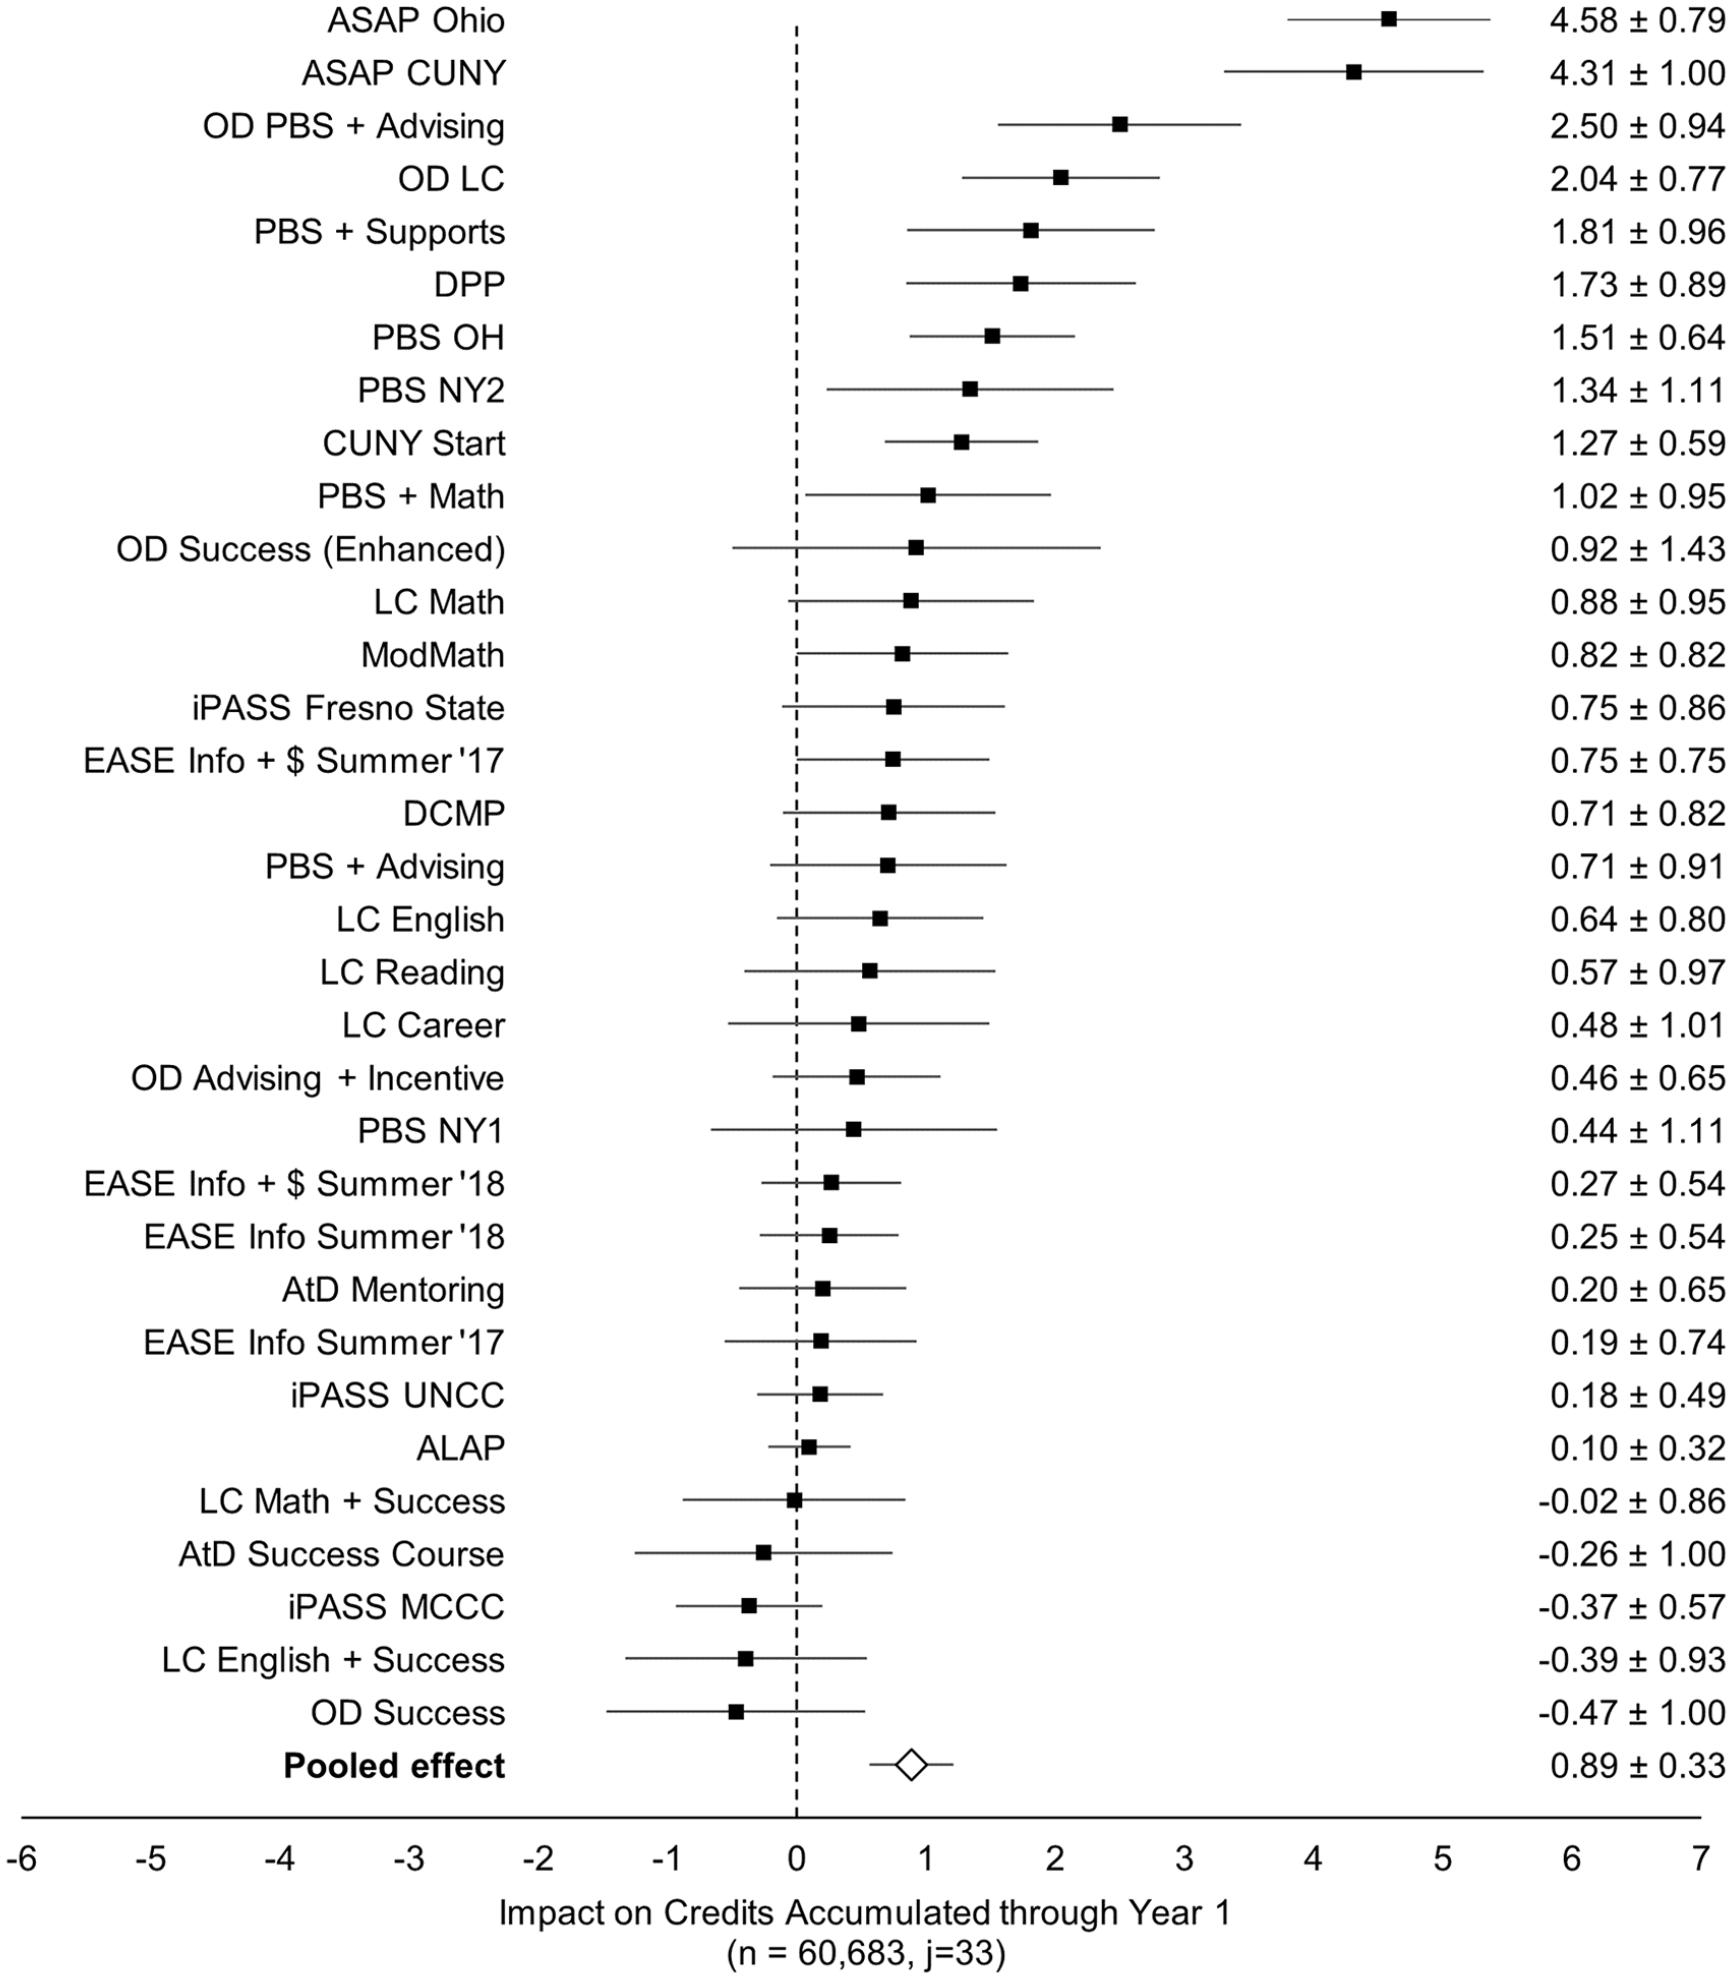
Forest plot of impact estimates and 90% confidence intervals, by intervention (credits accumulated through Year 1).
Impact estimates in Figure 1 vary from a 0.47 credit loss relative to control group students, to a 4.58 credit gain. This broad range suggests that there might be enough true impact variation for a meaningful analysis of covariation between intervention impacts and components. 15
However, much of this variation is produced by two interventions (CUNY ASAP and ASAP Ohio) with especially large positive impact estimates. Without them, impact estimates range from a 0.47 credit loss to a 2.50 credit gain. It is possible that these two interventions (which also have two of the three largest impact estimates for third-semester student enrollment) might unduly influence estimates of impact variation, which, in turn, might unduly influence estimates of covariation between intervention impacts and intervention components.
To assess this influence, we examine the sensitivity of all findings to the presence or absence of ASAP in our sample. Because our broadest base of evidence is the full-study sample (which includes ASAP), we consider its results to be our primary findings and present them in the main body of this article. Supplementary Tables C.1–C.9 in the online version of the journal provide further details for our variety of sensitivity tests by reporting each full-sample finding and its counterpart without ASAP.
Estimated Distributions of True Impacts Across Interventions
Table 3 presents estimates of the mean (β) and standard deviation (τ) of true impacts across interventions, for the full sample and without ASAP. These findings were produced by estimating the two-level regression model represented by Equations 1 and 2, which does not include impact predictors.
Estimated Mean and Standard Deviation of the Distribution of True Impacts Across Interventions, by Outcome (With and Without ASAP)
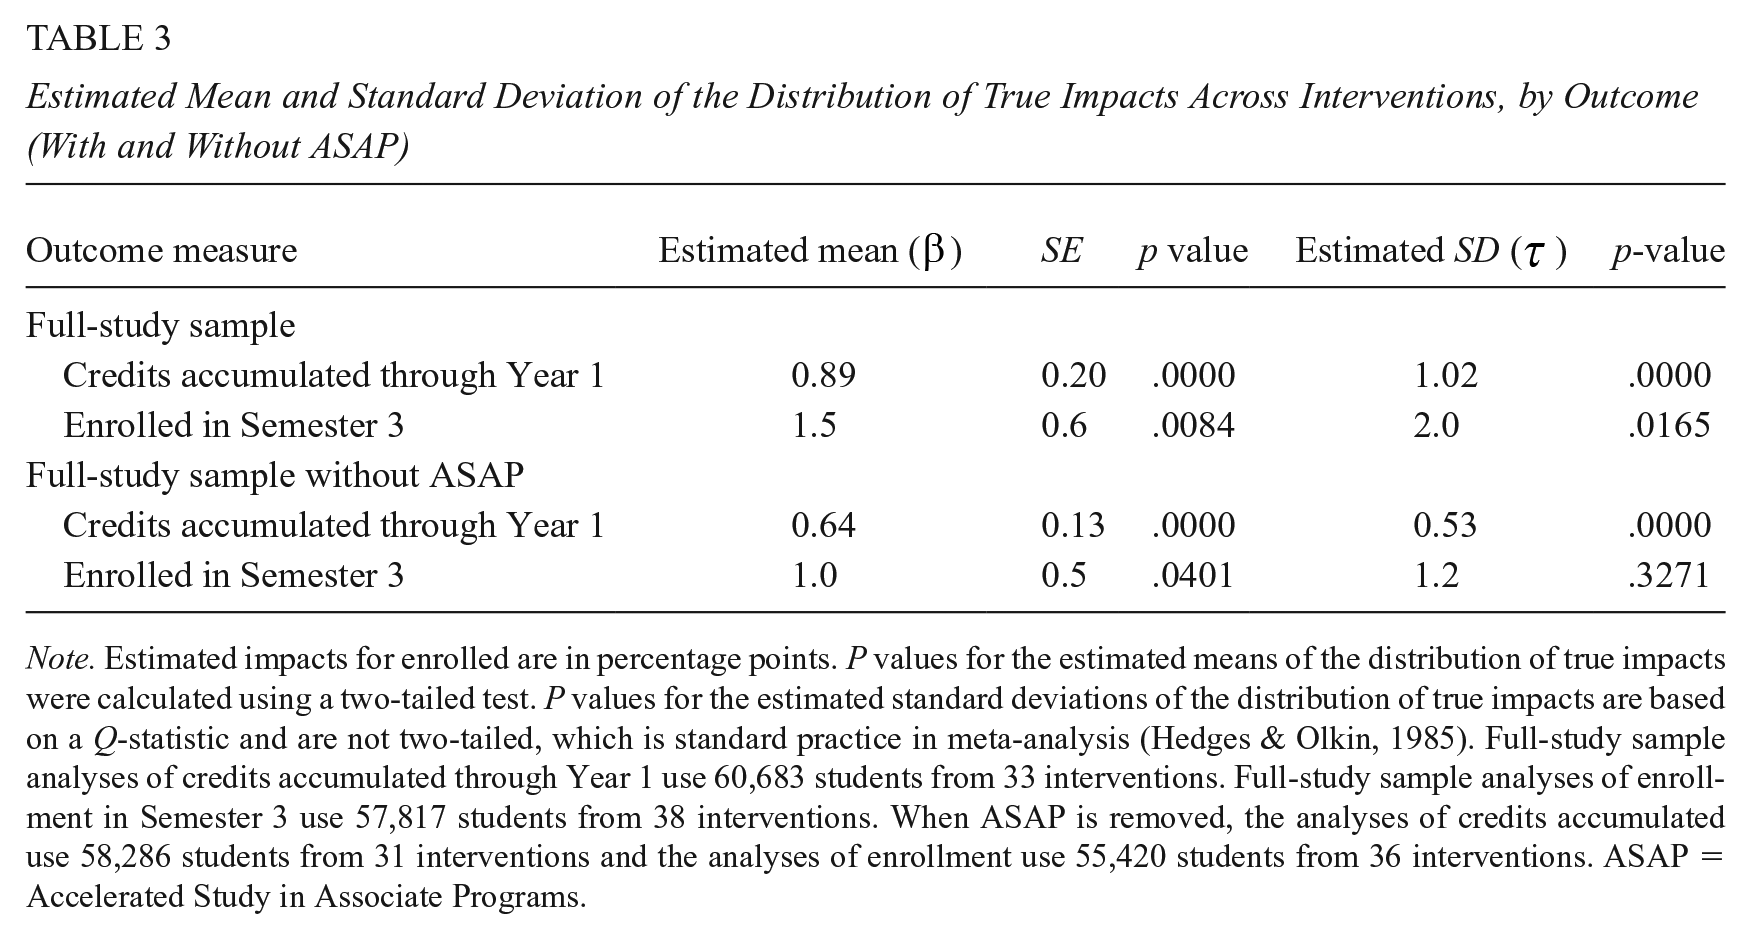
Note. Estimated impacts for enrolled are in percentage points. P values for the estimated means of the distribution of true impacts were calculated using a two-tailed test. P values for the estimated standard deviations of the distribution of true impacts are based on a Q-statistic and are not two-tailed, which is standard practice in meta-analysis (Hedges & Olkin, 1985). Full-study sample analyses of credits accumulated through Year 1 use 60,683 students from 33 interventions. Full-study sample analyses of enrollment in Semester 3 use 57,817 students from 38 interventions. When ASAP is removed, the analyses of credits accumulated use 58,286 students from 31 interventions and the analyses of enrollment use 55,420 students from 36 interventions. ASAP = Accelerated Study in Associate Programs.
Consider, first, the estimates of mean impacts (β), which are positive and highly statistically significant for both student outcomes. 16 This is clear evidence that, on average, the broad range of community college interventions studied had positive impacts on students’ short-term educational progress and continued course enrollment.
Note, however, that estimated mean impacts in Table 3 are appreciably larger with ASAP in the sample than without it (0.89 vs. 0.64 for credits accumulated and 1.5 versus 1.0 percentage points for enrollment rates). Thus, ASAP has a noticeable influence on estimated mean impacts.
Next, and most important for the present analysis, are estimates of true impact variation across interventions (τ). This cross-intervention standard deviation is estimated to be 1.02 credits for credit accumulation and 2.0 percentage points for student enrollment rates. Because these results are highly statistically significant, one can be confident that they represent true cross-intervention impact variation. Moreover, these results are larger in magnitude than their counterparts for mean impacts, which indicates substantial variation in the effectiveness of the present interventions. This impact variation is the basis for estimating covariation between intervention impacts and intervention features.
Estimated impact variation without ASAP is appreciably smaller, however, and that for student enrollment rates is no longer statistically significant. Thus, without ASAP, there is less true impact variation for estimating covariation between intervention features and impacts. Although it is difficult to know a priori how much impact variation is enough to make such analysis meaningful, findings in Table 3 are generally encouraging.
Predicting Impacts With One Intervention Feature at a Time
This section presents findings about predictive relationships between intervention impacts and intervention features, taken one feature at a time. These unconditional “single-feature” findings are based on separate estimates of the regression slope (θ) and intercept (π) in Equation 3.
To motivate this discussion, Figure 2 plots estimated intervention impacts on credits accumulated by the number of intervention components. On the horizontal axis, the plotted points range from zero for the intervention with none of the intervention components studied (ALAP), to six for the two interventions with the most components (CUNY ASAP and CUNY Start). 17 On the vertical axis, the plotted points range from an estimated decrease of 0.47 credits for OD Success to an estimated increase of 4.58 credits for ASAP Ohio (the same as in Figure 1).
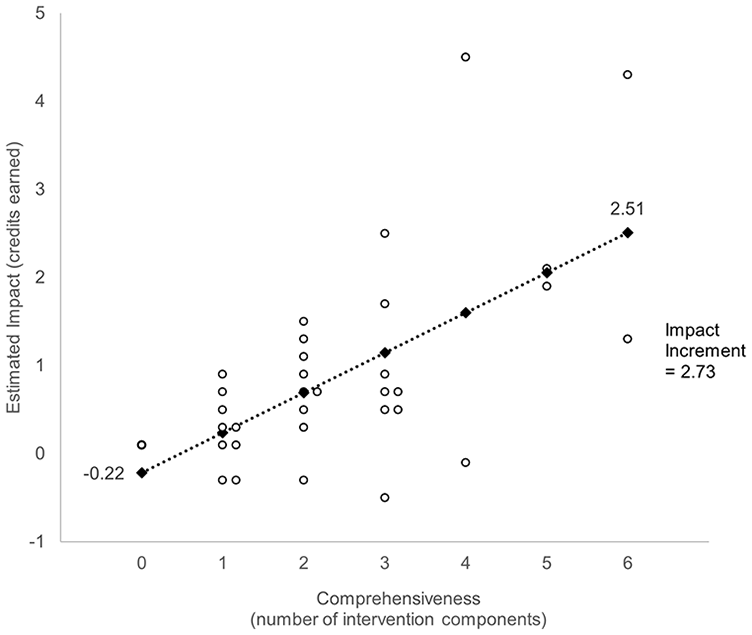
Intervention impacts on credits accumulated versus intervention comprehensiveness (Year 1).
Figure 2 indicates a clear upward trend in impacts as the number of intervention components increases. To clarify this trend, the regression line (Equation 2) that best fits the plotted points is superimposed on the figure. The slope of this line is the predicted rate at which mean intervention impacts increase, on average, per additional intervention component. Because this slope was based on data for all interventions in the analysis—not just a comparison of the impact for the one intervention with zero of the components we coded and the mean impact for the two interventions with six components—it has maximum statistical precision.
Diamonds on the line represent predicted mean impacts for each number of intervention components, and the constant vertical distance between adjacent diamonds equals the constant regression slope. The diamond for zero components (the regression intercept) indicates that the predicted impact for an intervention with none of the components studied is a loss of −0.22 credits. At the other extreme, the predicted impact for six components is 2.51 credits.
The bracket on the right of the figure denotes the vertical distance between the diamond for zero intervention components and the diamond for six components. This is the predicted difference in mean impacts between the least and most comprehensive interventions, which is an additional impact of 2.73 course credits. As noted earlier, we refer to this difference as an “impact increment.” 18 Now consider our single-feature findings.
Intervention Comprehensiveness
Table 4 presents single-feature results for intervention comprehensiveness based on full-sample data for our two student outcomes. Results in the top panel are estimated regression slopes, like that in Figure 2, with comprehensiveness measured on a scale from zero to six components. The estimated slope for credits accumulated indicates that intervention impacts increase, on average, by 0.45 credits per additional component. This estimate is highly statistically significant for the full-study sample (p < .0000) and remains positive and statistically significant without ASAP.19,20 The consistency of results with and without ASAP are denoted here and hereafter by
Estimated Unconditional Relationships Between Intervention Comprehensiveness and Impacts From a Single-Feature Model (Full-Study Sample)
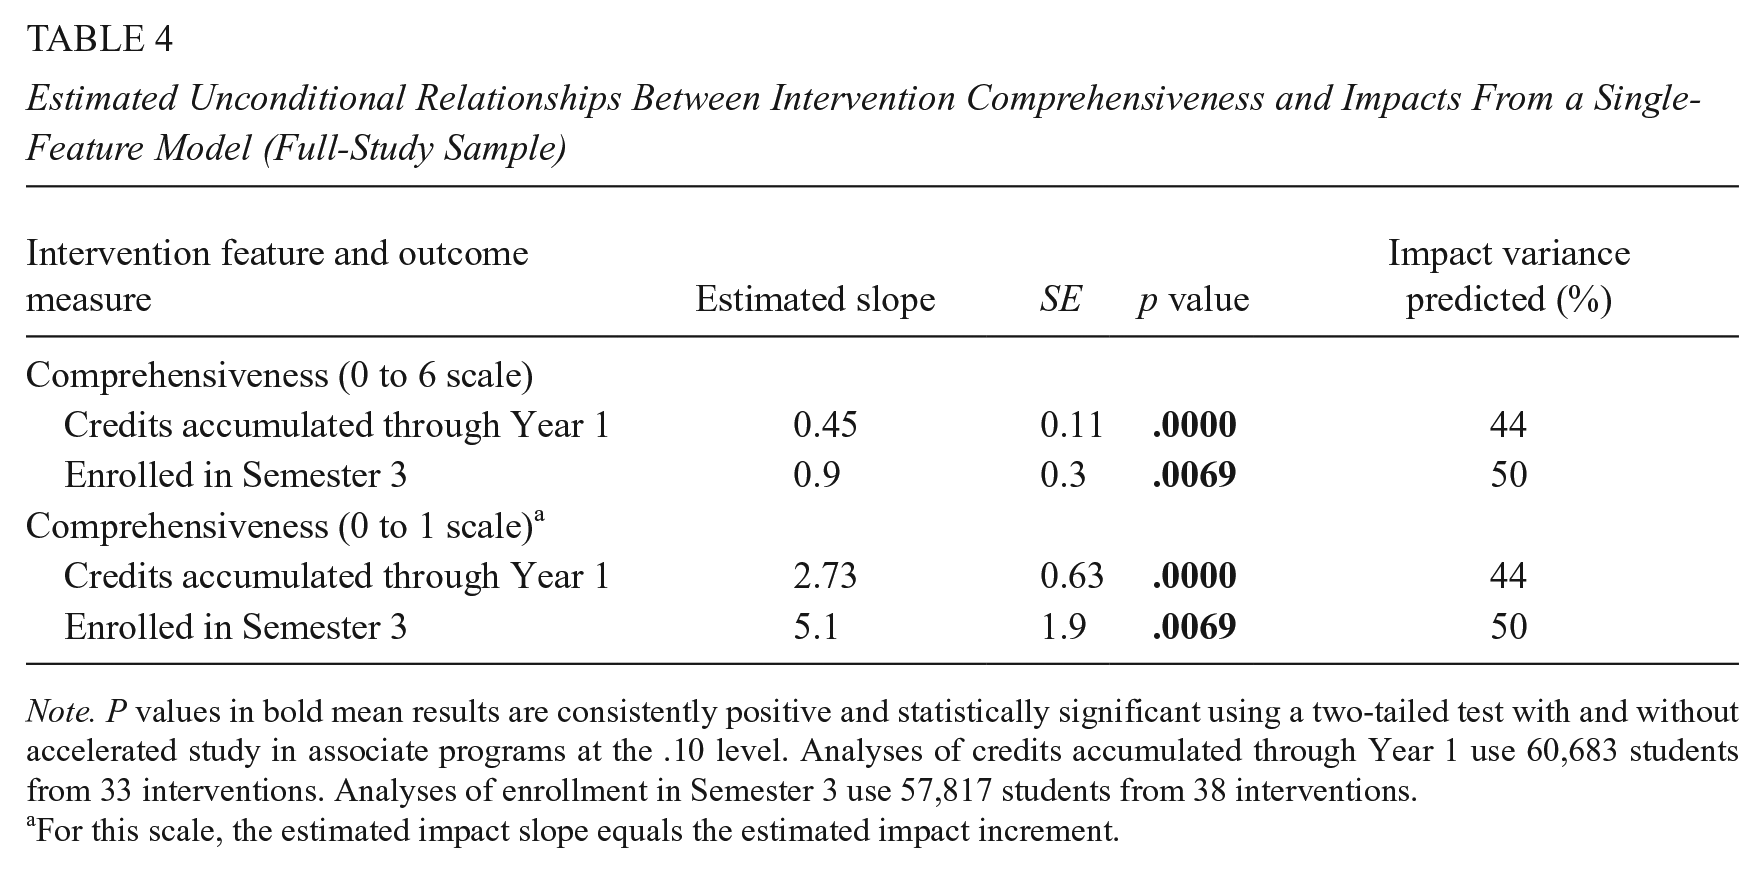
Note. P values in bold mean results are consistently positive and statistically significant using a two-tailed test with and without accelerated study in associate programs at the .10 level. Analyses of credits accumulated through Year 1 use 60,683 students from 33 interventions. Analyses of enrollment in Semester 3 use 57,817 students from 38 interventions.
For this scale, the estimated impact slope equals the estimated impact increment.
The top panel of Table 4 also demonstrates a positive relationship between the number of intervention components and intervention impacts on student enrollment rates. The full-sample regression slope for this outcome equals an additional 0.9% of students enrolled in Semester 3 per additional intervention component. This positive estimate is highly statistically significant (p = .0069) and remains statistically significant without ASAP (hence its bolding).
To facilitate interpretation of these findings, the bottom panel of Table 4 transforms regression slopes into impact increments by multiplying each slope by the maximum number of intervention components in the present sample (six). This produced estimated impact increments of 2.73 additional credits accumulated and 5.1 percentage points more students enrolled, which are highly statistically significant with and without ASAP. 21
One way to assess the practical implications of these findings is to note that community college students typically must average at least 20 college-level credits per year to graduate in 3 years—a common period for assessing on-time degree completion. Hence, the estimated impact increment for credit accumulation is equivalent to 14% (2.73 / 20 = 0.14) of the average annual credits needed for on-time graduation.
A second way to assess the importance of the preceding findings is to estimate the percentage of true cross-intervention impact variation that is predicted by intervention comprehensiveness. 22 Table 4 indicates that 44% of this variation is predicted for credits accumulated and 50% is predicted for continued student enrollment.
On balance then, Table 4 indicates that the number of components in a community college intervention is consistently, substantially, and positively related to its impacts on important student outcomes. But are some components more promising than others?
Intervention Components
Table 5 presents estimates from single-feature models of the impact increments for each intervention component in the present analyses. To help interpret findings in the table, they are grouped by whether they provide consistent, mixed, or no single-feature evidence of positive predictive relationships between the intensity of an intervention component and intervention impacts, where:
Estimated Unconditional Relationships Between Intervention Components and Impacts From a Single-Feature Model (Full-Study Sample)
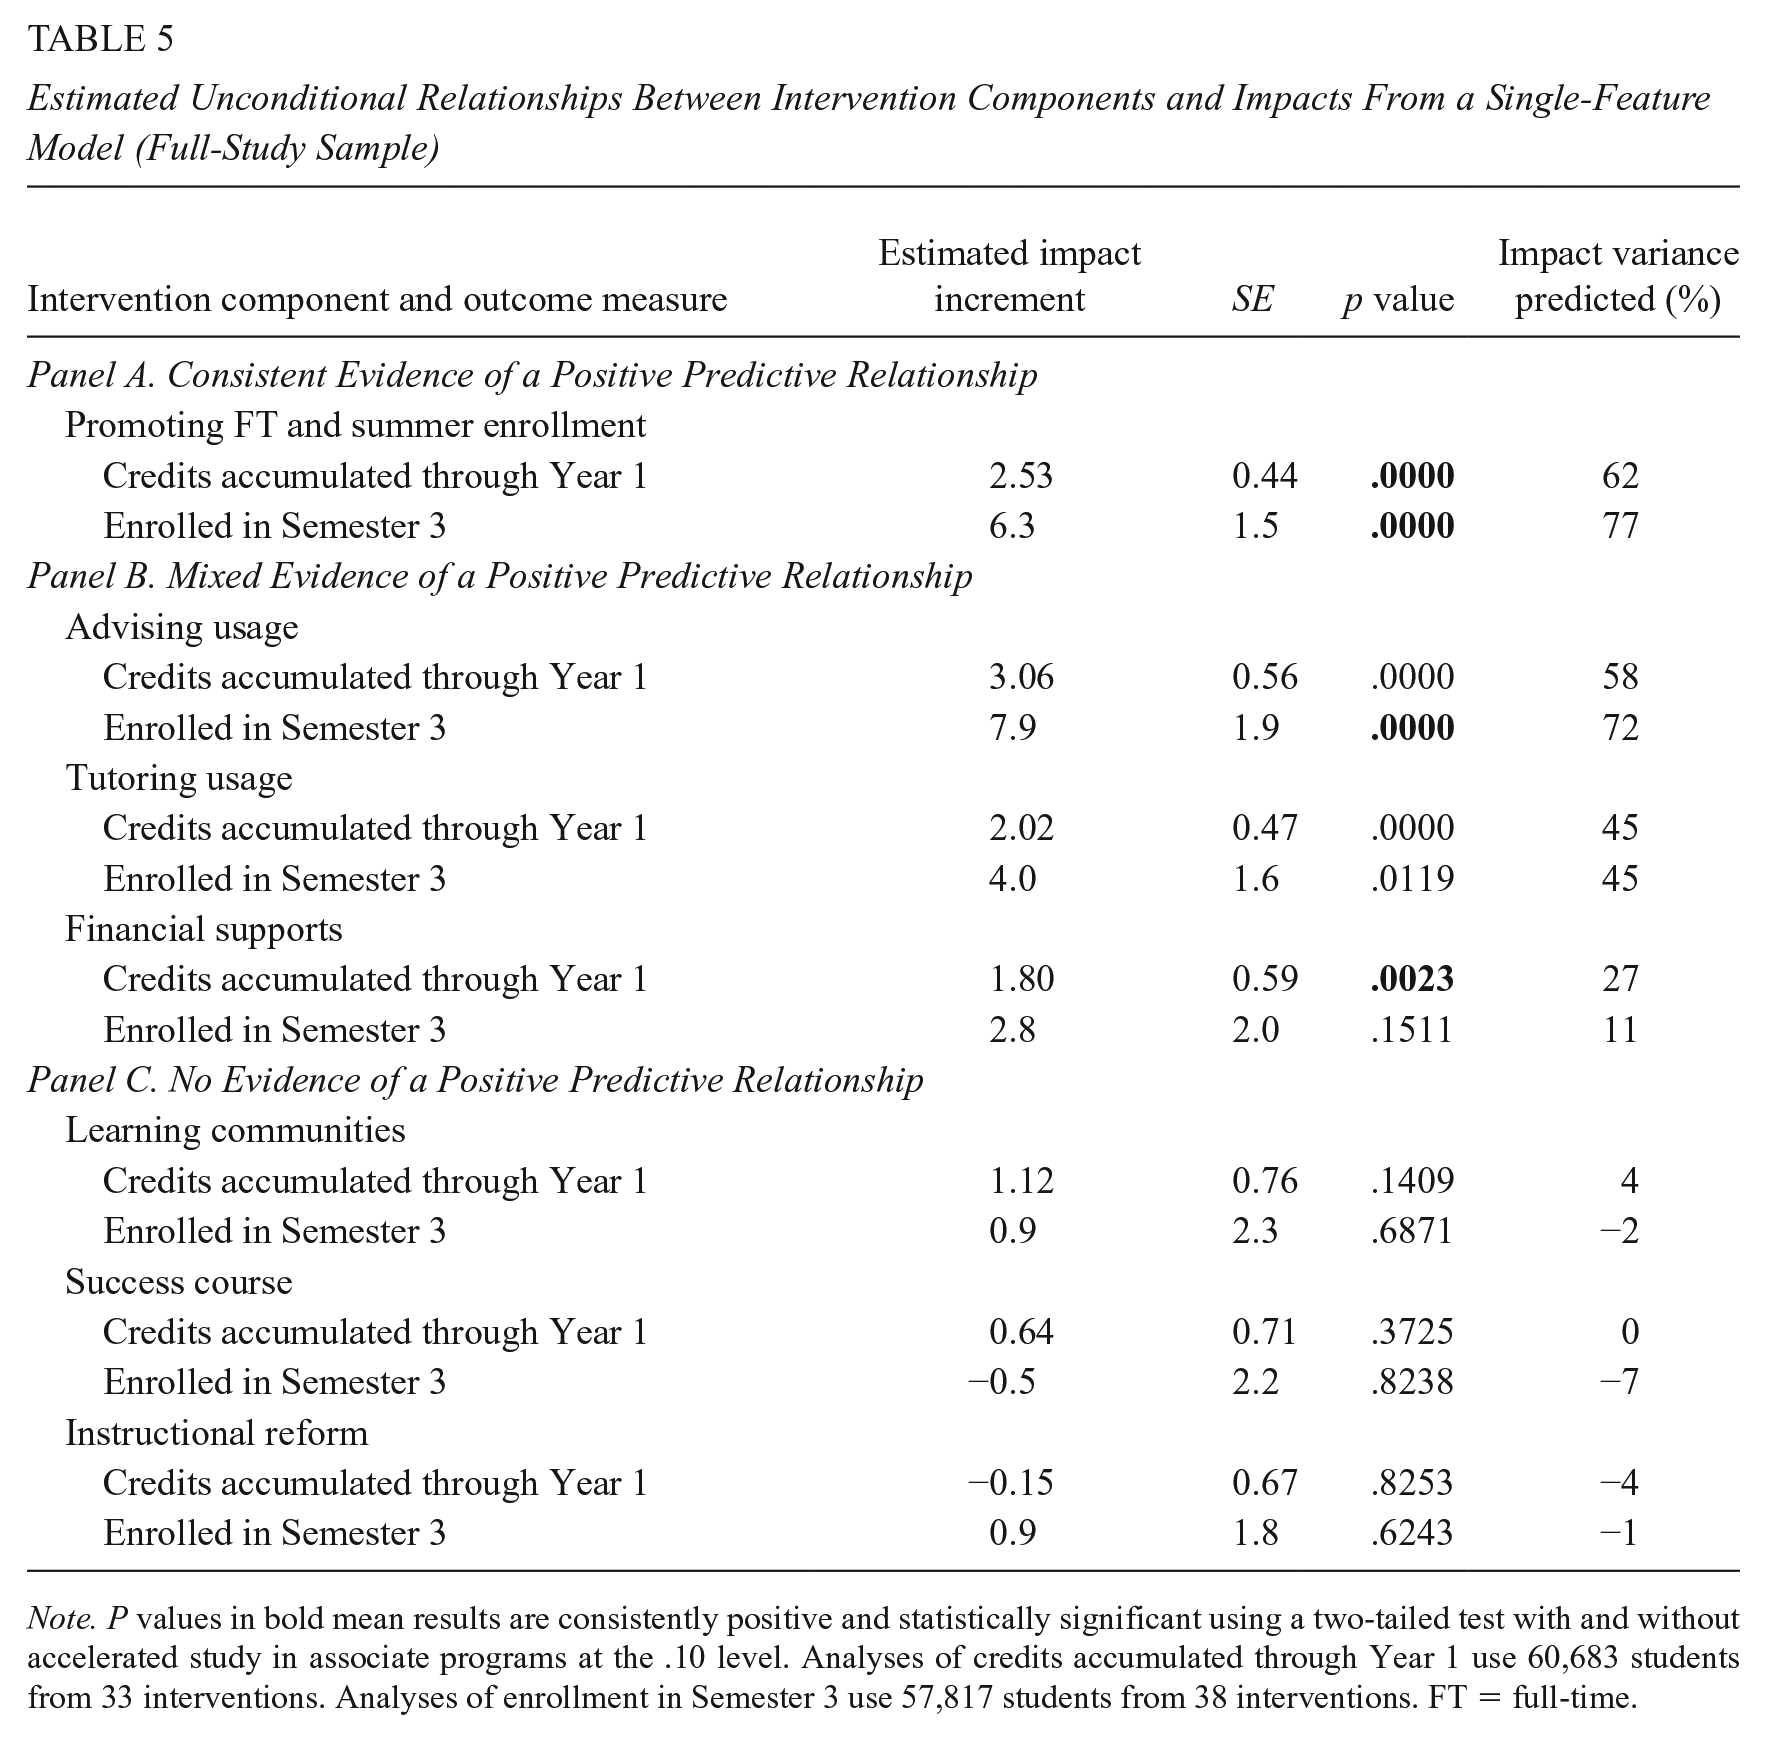
Note. P values in bold mean results are consistently positive and statistically significant using a two-tailed test with and without accelerated study in associate programs at the .10 level. Analyses of credits accumulated through Year 1 use 60,683 students from 33 interventions. Analyses of enrollment in Semester 3 use 57,817 students from 38 interventions. FT = full-time.
Consistent single-feature evidence means that all four estimates of single-feature impact increments (with and without ASAP and for both student outcomes) are positive and statistically significant.
Mixed single-feature evidence of a positive predictive relationship exists when some, but not all four estimates of single-feature impact increments are positive and statistically significant.
No single-feature evidence of a positive predictive relationship exists when no estimates of single-feature impact increments are positive and statistically significant.
Now consider the findings.
Consistent single-feature evidence
Findings in the top panel of Table 5 for PFTSE provide consistent single-feature evidence of a positive relationship with intervention impacts. Full-sample estimates of the impact increment between an intervention which does not have this component and one with its most intense version (emphasizing full-time fall and spring enrollment plus summer enrollment) is an additional 2.53 credits accumulated by Year 1 after students’ random assignment (also see Supplementary Figure A.3 in the online version of the journal) and an additional 6.3% of students enrolled during Semester 3.
These estimates are highly statistically significant, and thus are quite likely to reflect true positive impact increments. They are also consistent with and without ASAP. Furthermore, variation across interventions in the intensity of this component predicts 62% of impact variation for first-year credit accumulation and 77% for third-semester student enrollment.
Mixed single-feature evidence
Findings in the middle panel of Table 5 provide mixed evidence of positive predictive relationships between intervention impacts and increased advising usage, tutoring usage, and financial support.
For example, full-sample estimates of impact increments for increased advising usage (3.06 more credits earned [see Supplementary Figure A.4 in the online version of the journal] and 7.9% more students enrolled) are highly statistically significant. In addition, variation in this intervention component explains 58% of true impact variation for credits accumulated and 72% for student enrollment rates. Furthermore, the estimated impact increment for third-semester student enrollment is positive and statistically significant when ASAP is omitted. However, its counterpart for first-year credits accumulated drops precipitously without ASAP (from 3.06 to 0.98 credits) and is no longer statistically significant.
Evidence in the table for increased tutoring usage is mixed in a different way. Its full-sample estimates of impact increments for both student outcomes are moderate in size and highly statistically significant. In addition, full-sample variation in this intervention component explains almost half of the variation in true impacts. However, these results disappear without ASAP.
Evidence for increased student financial support is mixed in other ways. On the one hand, its full-sample estimates of impact increments are smaller than those for the preceding three components, although intervention-provided financial support for students ranged from zero to more than US$2,000. On the other hand, the estimated impact increment for credits earned is positive and statistically significant with and without ASAP. However, it was not statistically significant for student enrollment. Furthermore, variation in financial support explained little impact variation (27% for credits accumulated and 11% for student enrollment rates).
No single-feature evidence
There is no single-feature evidence of a positive predictive relationship between intervention impacts and the intensity of learning communities, success courses, or instructional reforms. None of their estimated impact increments are statistically significant; most of these estimates are very small in magnitude (and some are negative); and variation in these components predicts virtually no impact variation for either student outcome.
Hereafter, we refer to the four intervention components that have some single-feature evidence of a positive predictive relationship with intervention impacts (PFTSE, increased advising usage, increased tutoring usage, and increased financial supports) as the four “promising” components that emerged from our analysis.
Findings From Our Sensitivity Tests
So far, we have examined predictive relationships between intervention features and intervention impacts, one feature at a time. This can identify the extent to which intervention impacts tend to increase as the number of their components increases or as the intensity of a specific component increases.
However, although intervention impact estimates from the well-implemented RCTs in our sample have clear causal interpretations, estimates of unconditional predictive relationships between these impacts and the number or nature of intervention features cannot be interpreted causally without making a strong assumption. Specifically, one must assume that there are no characteristics of the interventions studied, their student populations, or their institutional settings that causally influence intervention impacts and are correlated with the intensity of the intervention feature in a given single-feature model.
However, for example, interventions that PFTSE also tend to emphasize increased tutoring usage, which implies a positive correlation between the two intervention components (r = .38). 23 Thus, if increasing the intensity of each component causes intervention impacts to increase, the omission of one of them from an impact-predictor model will tend to overestimate the causal effect of the other. This is because the model would attribute part of the causal effect of the omitted component to the included component. 24
Similarly, if intervention impacts were systematically larger for one type of student than for another, and if the percentage of students of the first type were positively correlated with the intensity of a given intervention feature, a single-feature model would tend to overstate the causal influence of the feature. 25 The same problem would occur if intervention impacts were systematically larger than average in one type of college setting and that setting was positively correlated with the intensity of the intervention feature in a single-feature model. 26 This illustrates how estimates of the causal influence of a given factor (X1) on an outcome (Y) can be confounded with the causal influence of a correlated causal factor (X2) on that outcome.
Ideally, to get closer to causal analyses we would estimate a model with impact predictors that include all measured intervention features, student characteristics, and setting characteristics that are hypothesized to influence intervention impacts. Doing so would produce estimates of predictive relationships between intervention impacts and each intervention feature in the model, controlling for (i.e., holding constant) the intensity of all other intervention features in the model and the student and setting characteristics in the model. Such results represent conditional predictive relationships. And if all correlated causal influences on intervention impacts are included in a model, its estimated regression slopes and impact increments for a given intervention feature would be unbiased estimates of true causal influences. 27
However, it is not possible to know all the intervention features, student characteristics, or setting characteristics that causally influence intervention impacts. Even if one did, it is unlikely that data would be available for all of them. Furthermore, given the 33 or 38 intervention-level data points for the present analysis (depending on the student outcome), including more than three or four impact predictors in a model would risk increased error and misinterpretation from overfitting and multicollinearity.
Thus, to learn as much as possible from the present data by controlling for some likely causal confounds while reducing the threat of error and misinterpretation from model overfitting and multicollinearity, we conducted the sensitivity tests described earlier. Table 6 presents the results of these tests for our four promising intervention components, and Table 7 presents their results for intervention comprehensiveness. 28
Summary of Estimated Relationships Between Intervention Components and Intervention Impacts (Full-Study Sample)
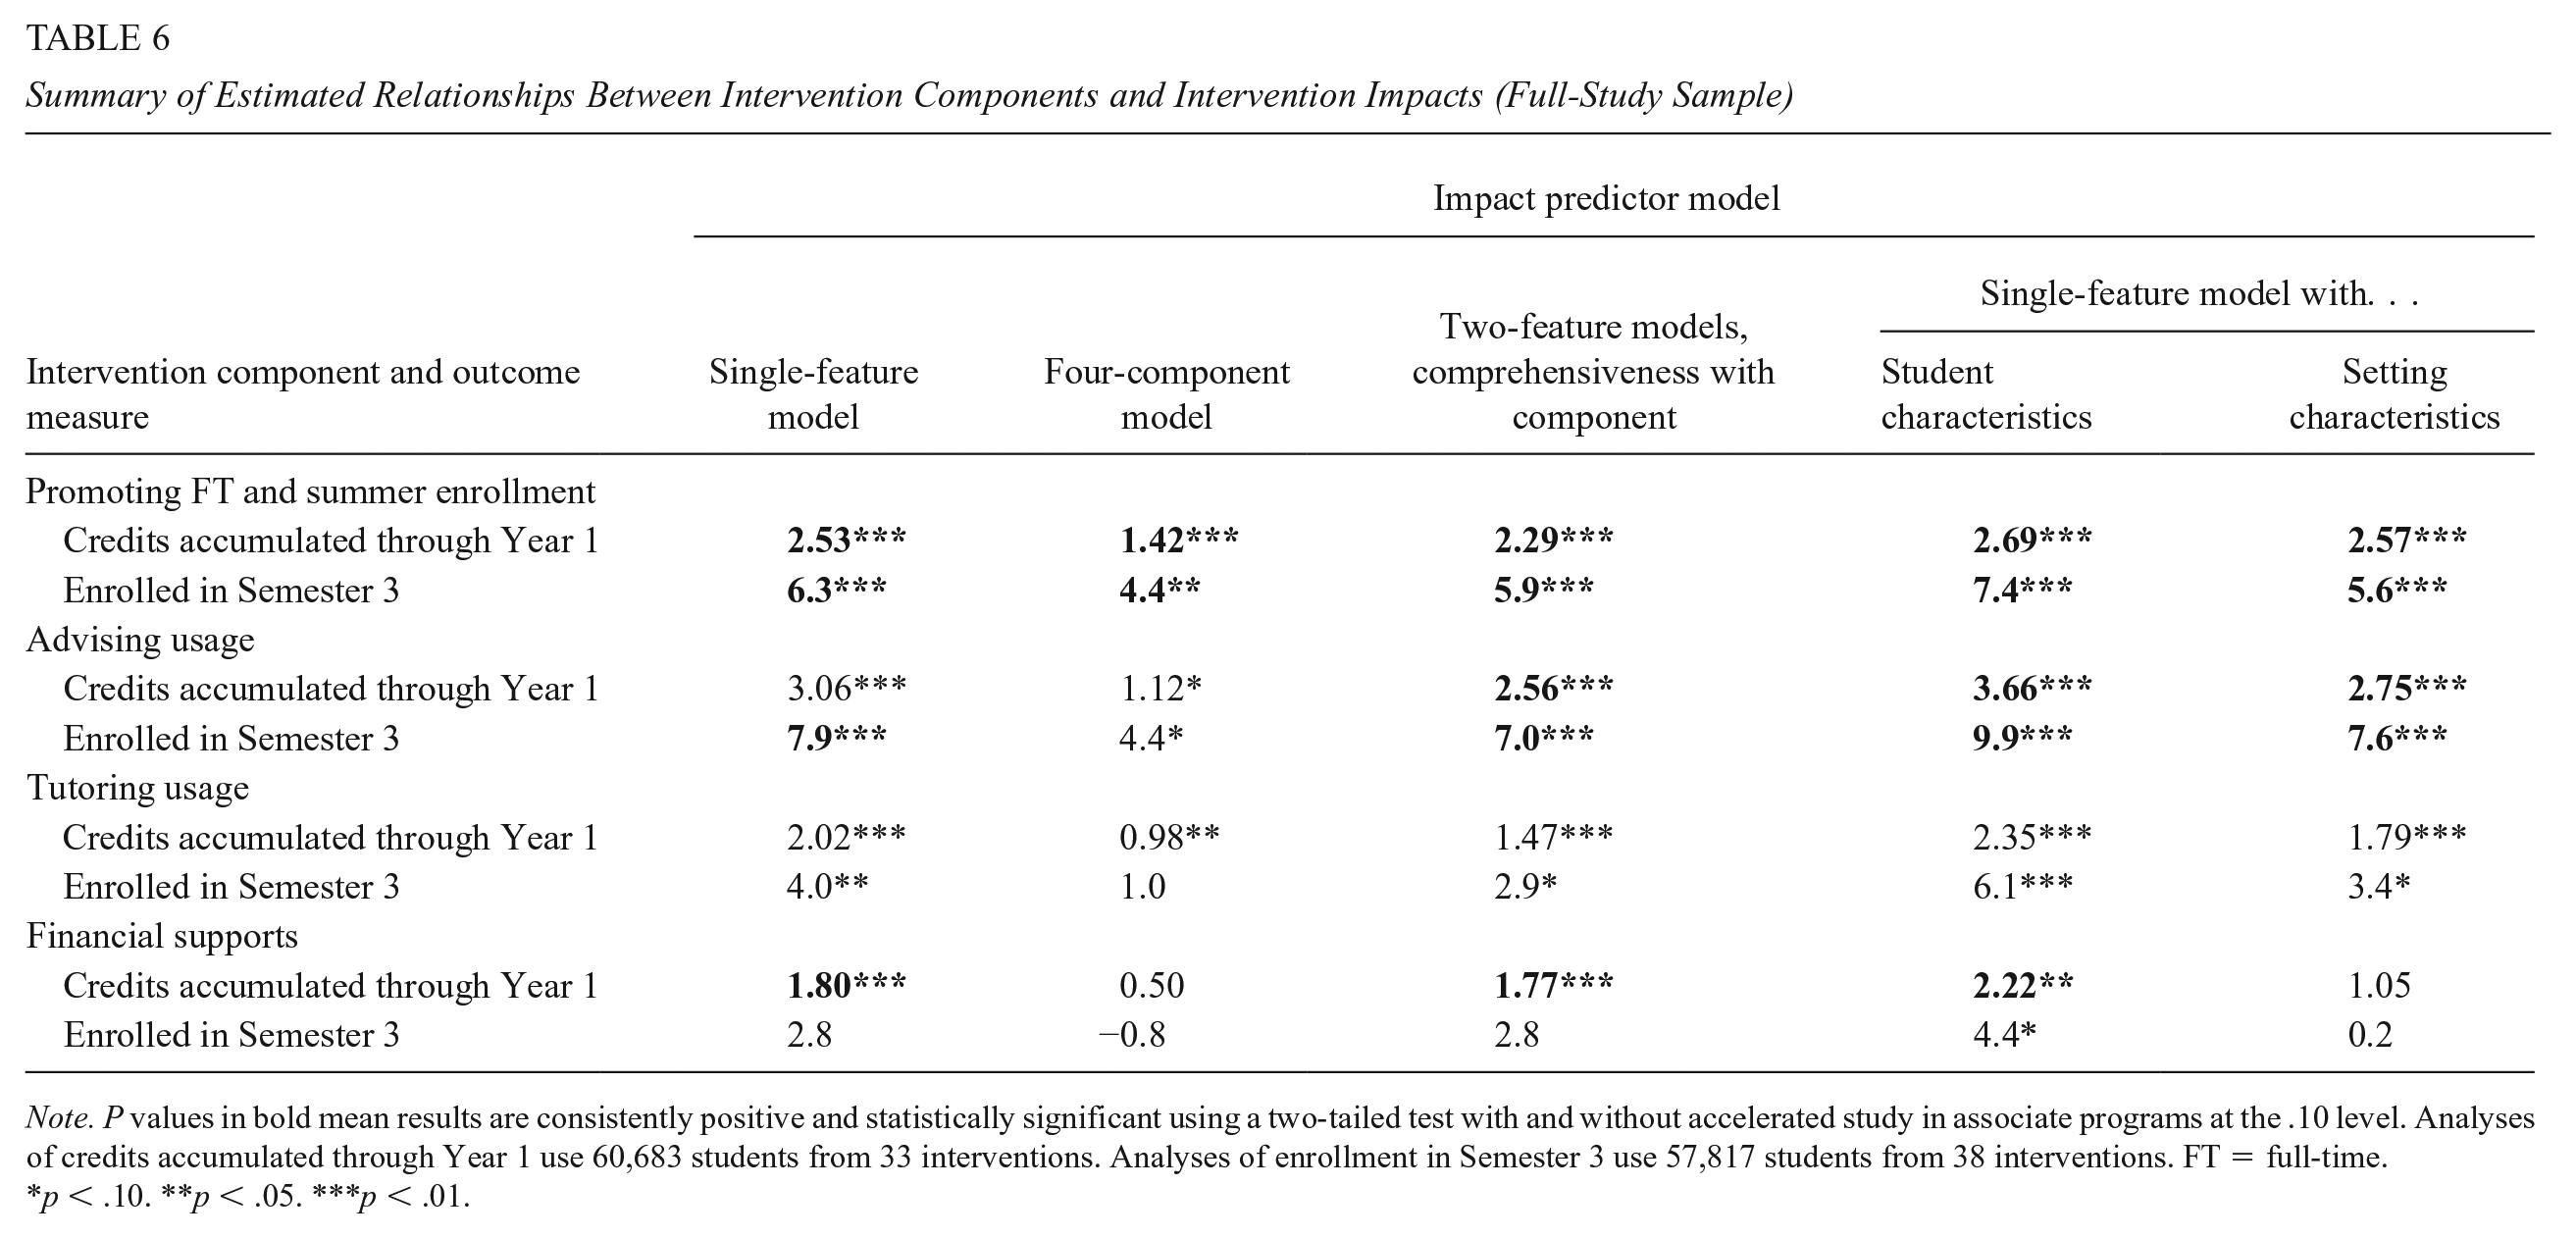
Note. P values in bold mean results are consistently positive and statistically significant using a two-tailed test with and without accelerated study in associate programs at the .10 level. Analyses of credits accumulated through Year 1 use 60,683 students from 33 interventions. Analyses of enrollment in Semester 3 use 57,817 students from 38 interventions. FT = full-time.
p < .10. **p < .05. ***p < .01.
Summary of Estimated Relationship Between Intervention Comprehensiveness and Impacts (Full-Study Sample)
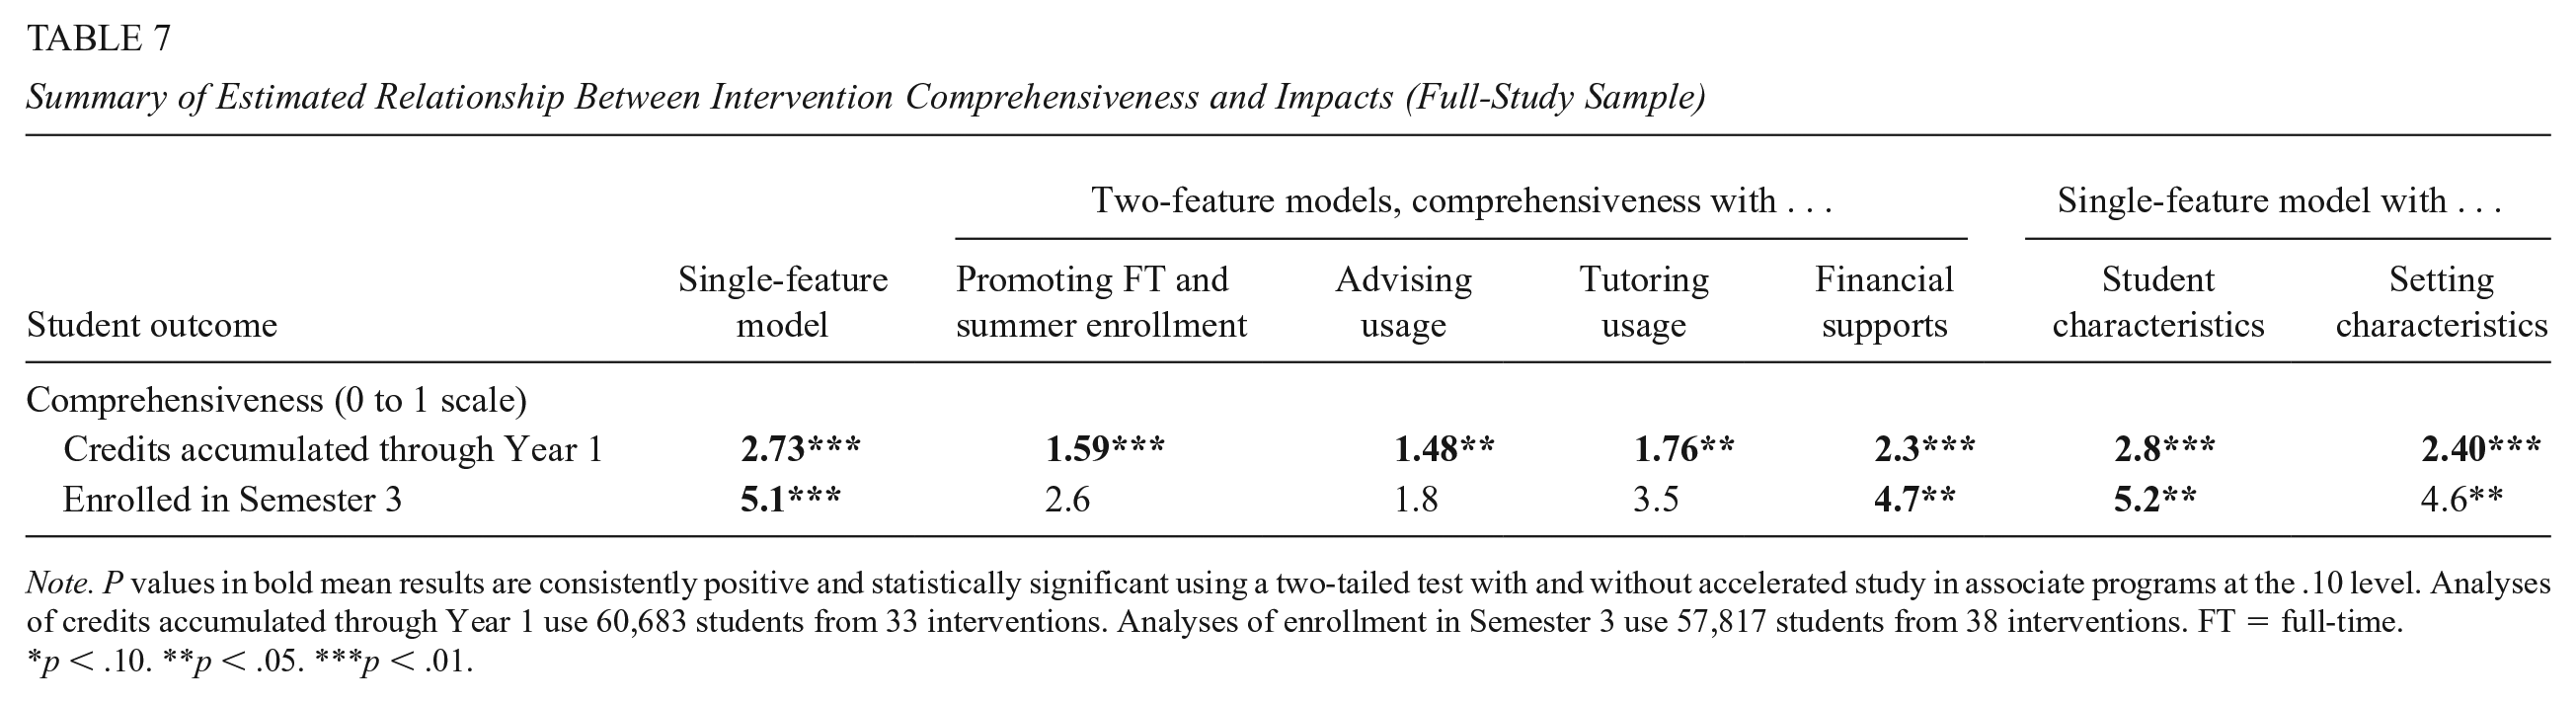
Note. P values in bold mean results are consistently positive and statistically significant using a two-tailed test with and without accelerated study in associate programs at the .10 level. Analyses of credits accumulated through Year 1 use 60,683 students from 33 interventions. Analyses of enrollment in Semester 3 use 57,817 students from 38 interventions. FT = full-time.
p < .10. **p < .05. ***p < .01.
Consider the findings in Table 6. As a point of reference, the first column repeats single-feature estimates of unconditional impact increments in Table 5 (e.g., 2.53 additional credits and 6.3 percentage points for PFTSE, both of which are statistically significant with and without ASAP). The remaining columns present corresponding estimates of conditional impact increments from multipredictor models that include as intervention-level (i.e., Level 2) predictors other intervention features, student characteristics for which consistent data are available, or setting characteristics for which consistent data are available.
The second column in Table 6 reports estimates of conditional impact increments from a model with our four promising intervention components together as impact predictors (our “four-component” model). 29 Hence, the conditional impact increment here for PFTSE holds constant the intensity of the other three promising components. Because those components are positively correlated with PFTSE and with intervention impacts (see Supplementary Table D.1 in the online version of the journal), the estimated conditional impact increments for PFTSE in Table 6 (1.42 additional credits and 4.4 additional percentage points) are smaller than their unconditional counterparts in Table 5. However, they are still statistically significant with and without ASAP. 30
The third column in Table 6 reports estimates of conditional impact increments from a model that adds a slightly modified measure of intervention comprehensiveness to the single-feature model for each promising intervention component. 31 Hence, the estimated conditional impact increment for PFTSE in this column holds constant intervention comprehensiveness. Because intervention comprehensiveness is positively correlated with PFTSE and with intervention impacts (see Supplementary Table D.1 in the online version of the journal), the estimated conditional impact increments for PFTSE (2.29 additional credits and 5.9 additional percentage points) are smaller than their unconditional counterparts. However, they are still statistically significant with and without ASAP. 32
The fourth column in Table 6 reports estimates of conditional impact increments from a model that adds intervention-level measures of students’ gender, age, and race/ethnicity to the single-feature model for each intervention component. Hence, the estimated conditional impact increment for PFTSE here holds constant those student characteristics. Because the correlations of these student characteristics with PFTSE and with intervention impacts are very low, estimated conditional impact increments for PFTSE (2.29 additional credits and 7.4 additional percentage points) are quite similar to their unconditional counterparts in Table 5 and are statistically significant with and without ASAP. 33
The fifth and final column in Table 6 reports estimates of conditional impact increments from a model that adds measures of intervention setting characteristics (institution size and the urbanicity of its location) to the single-feature model for each intervention component. Hence, the estimated conditional impact increment for PFTSE here holds constant these setting characteristics. Because the correlations of these setting characteristics with PFTSE and with intervention impacts are very low, estimated conditional impact increments for PFTSE (2.57 additional credits and 5.6 additional percentage points) are similar to their unconditional counterparts in Table 5 and are statistically significant with and without ASAP. 34
As can be seen, the findings in Table 6—which control statistically for a range of potential impact influences—provide fully consistent evidence of a predictive relationship between PFTSE and intervention impacts. This consistency increases the plausibility that promotion of full-time and summer enrollment might cause intervention impacts to increase.
Findings in Table 6 for increased advising usage, although less consistent, provide encouraging evidence of a positive relationship with intervention impacts. All full-sample estimates of impact increments are positive and statistically significant for both student outcomes. Without ASAP, all but one of these estimates is statistically significant for third-semester student enrollment, although none of these estimates is statistically significant for first-year credits accumulated.
Findings for increased tutoring usage, while mixed, provide encouraging evidence about its relationship with intervention impacts. Full-sample estimates of impact increments are statistically significant for all models for first-year credits accumulated and for all but one model for third-semester student enrollment. However, none of these estimates is statistically significant without ASAP.
Findings for increased financial support are encouraging but provide less consistent evidence about positive predictive relationships with intervention impacts. Three of the five full-sample impact-increment estimates are positive and statistically significant for first-year credit accumulation, with or without ASAP. In addition, only one full-sample impact increment estimate is positive and statistically significant for third-semester enrollment.
Now consider the findings in Table 7 for intervention comprehensiveness. The first column (“Single-feature model”) reports estimates of its unconditional impact increments from Table 4. The next four columns report estimates of conditional impact increments from two-feature models that each add one promising intervention component to intervention comprehensiveness. 35 The last two columns add student characteristics or setting characteristics.
Note that all estimated impact estimates for first-year credits accumulated are positive and statistically significant with and without ASAP. This is highly consistent evidence of a predictive (and perhaps causal) relationship with intervention impacts. Findings for third-semester student enrollment provide a mixed message, however.
Discussion
This final section of our article summarizes and interprets our key findings, considers their strengths and limitations, and suggests next steps for a productive research agenda on ways to improve community college education.
Summary of Findings
The analysis demonstrates the promise of community college interventions, which for the present sample of 39 interventions led by MDRC over the past 20 years have positive average impacts on key student outcomes, although substantial impact variation.
Our findings show that intervention impacts tend to increase with the number of intervention components and with the intensity of four promising components: (a) promotion of full-time and/or summer enrollment (with the most consistent evidence), (b) increased student advising usage, (c) increased student tutoring usage, and (d) increased student financial support (with the least consistent evidence).
Most striking among these findings is that explicit promotion of full-time and/or summer enrollment was consistently related to increased positive impacts on both student outcomes studied and both intervention samples used, regardless of what other intervention features, student characteristics, or setting characteristics were controlled for. Next most striking were the equally consistent findings for intervention comprehensiveness with respect to first-year credit accumulation (but not for third-semester student enrollment rates).
Although this exploratory evidence can suggest causal hypotheses, it cannot confirm them. Nonetheless, given the rigorous RCTs upon which our analyses are based and the extensive sensitivity tests of our results that were conducted, the present findings provide some of the best evidence that exists about the likely effectiveness of these popular intervention components in the context of real-world multicomponent interventions.
Interpretation of Findings
Consider first the finding that intervention impacts tend to increase with the number of intervention components. For impacts on credits accumulated during their first year after random assignment, this result is fully consistent across the wide range of sensitivity tests that were conducted. In addition, it aligns well with current thinking in the field, where comprehensive support services are viewed to be highly effective (e.g., see Dawson et al., 2021). Furthermore, it has considerable intuitive appeal because more components can address more impediments to student success. However, for impacts on student enrollment rates in their third semester after random assignment, our findings were mixed.
Now consider the finding that interventions that PFTSE tend to have larger impacts. This finding is consistent across all of the sensitivity tests conducted for both outcomes. But it raises an important question: what about part-time students? Around 3.2 million community college students enroll part-time. Some of these students, if offered the right package of supports and services, can be induced to enroll full-time.
Still, strictly requiring full-time enrollment will limit who participates in an intervention: Many students may opt out of interventions if they feel full-time status is not an option due to, for example, time or financial constraints. Fortunately, full-time enrollment can be promoted through nominal requirements, financial incentives, and informational campaigns, without excluding part-time students. For example, the PBS Ohio intervention offered students a full-time scholarship worth more money than the part-time scholarship. Such an approach may still help part-timers through other components in an intervention while also promoting full-time enrollment. In addition, it is worth considering promoting summer enrollment among part-time students because a part-time student earning 9 credits each fall and spring can still graduate in 3 years if they pass a few summer courses.
Differences in the effectiveness of various approaches to promoting full-time or summer enrollment are an area ripe for future research. In addition, these findings highlight the need for interventions that better support part-time students.
Our findings also provide promising evidence about the effectiveness of increased advising usage, although the evidence for this intervention component is not fully robust to the omission of ASAP from our sample. This is because ASAP had among the largest impacts and the largest advising service contrast. Strikingly, in their first program year, students in CUNY ASAP and ASAP Ohio, reported 32 and 19 (respectively) more advising contacts than did their control group counterparts.
It is also worth noting how ASAP increased advising contacts so dramatically. During students’ first semester, they are required to attend advising sessions at least twice per month and they receive a monthly transportation pass that, in some cases, is conditioned on attending those advising sessions. For colleges interested in implementing advising interventions, practical guidance is available from Karp et al. (2021).
Next, consider tutoring. In the present analysis, tutoring was part of 11 interventions, and it was offered in-class or outside of class in a learning center, success center, or lab. To increase tutoring participation, interventions required it, incentivized it, or encouraged it.
Data on the amount (and content) of tutoring received by students are limited, but students in the CUNY ASAP program self-reported attending an average of 24 tutoring sessions during their first program year. Hence, the tutoring service contrast is unusually large for CUNY ASAP.
While enhanced tutoring is associated with larger than average intervention impacts, this finding is not robust to the exclusion of ASAP. However, there is substantial positive evidence from pre-K–12 research on tutoring’s positive impacts (Fryer, 2016; Nickow et al., 2020). Thus, the value of tutoring is an area ripe for further research in community colleges. For example, might high-dose tutoring (which based on Fryer Jr.’s definition is far more tutoring than that for any of the interventions in the present analysis) substantially increase pass rates in developmental or gatekeeper math courses, which are a major barrier for many students? Or might tutoring just not be an effective way to boost student retention and credit accumulation in community college education?
Finally, consider increased student financial support. Perhaps the most surprising finding from the present analysis is that, after controlling for other intervention components, there is no longer a relationship between increased financial support and increased intervention impacts. Moreover, in the seven-arm PBS Variations RCT, which examined varying amounts of financial support directly (without any other components), there was no clear evidence of a relationship between the amount of financial support and the magnitude of intervention impacts on enrollment.
However, this might understate the potential value of strategic use of financial supports.
For example, numerous interventions used financial supports synergistically with other components (e.g., incentivizing full-time and/or summer enrollment, advising, or tutoring usage). While the value of each increased dollar is not clear, utilizing financial supports to incentivize or enable other intervention components to thrive seems like a good strategy, even if it makes disentangling its unique contribution to impacts quite challenging.
Also note that even the most generous forms of financial support in the present interventions were just more than US$2,000 in a year. This is much less than the amount offered by some effective interventions studied by others (Angrist et al., 2020). It is possible then that more substantial financial support is necessary to demonstrate its direct value-added.
Strengths and Limitations of the Present Findings
The present analyses rely on data from well-implemented randomized trials of 39 community college interventions, with a total sample of more than 65,000 students. This unusually large body of research, which was made available by MDRC through THE-RCT Restricted Access File, has several major strengths and several important limitations for research on factors that influence the impacts of community college interventions.
First, the database represents all community college RCTs that MDRC has led, and thus is not subject to publication bias, which results from the tendency of disappointing results to not be published. Second, the present findings are based on high-quality, large-scale RCTs so that impact estimates for each study are internally valid and, for the most part, precisely estimated. Third, the present data make it possible to construct student outcome measures that are defined consistently across studies and reported in their original units. Hence, there is no need to rely on standardized effect sizes defined by past studies and typically tethered to their idiosyncratic outcome variances. This greatly reduces interpretation challenges for cross-study analyses.
Despite these major strengths, the present analysis has important limitations. First, it relies on multilevel models estimated from at most 38 impact estimates (intervention-level data points). This limits the number of degrees of freedom available for simultaneously estimating predictive relationships between intervention impacts and multiple intervention features.
Second, due to the limited number of studies with longer student follow-up, the present analyses focus only on short-term student outcomes. Although this ensured the largest possible consistent sample of students, it did not provide findings for other important outcomes such as degree completion, which are of great interest to students, practitioners, and policymakers.
This situation reflects a pervasive challenge for cross-study analyses of community college interventions—the fact that only selected studies conduct long-term follow-up. And for the present sample, evaluations of interventions with more promising short-term impacts were much more likely to also conduct longer follow-up (see D. Bailey & Weiss, 2022).
Third, although impact estimates for each intervention in the present analyses can be interpreted causally, our cross-intervention analysis of covariation between intervention impacts and features is only exploratory. Thus, although our extensive sensitivities tests control for several alternative factors that might influence the impacts of these interventions, we cannot really know controlling for those factors was enough to make our estimated predictive relationships between intervention features and intervention impacts reasonable approximations of causal relationships.
Concluding Remarks
The present analysis offers exploratory insights into ways to improve academic outcomes of community college students based on individual-level data from a wide range of rigorous impact evaluations of community college interventions. This was made possible by the standardized student-level data from THE-RCT restricted-access data set. 36 As RCTs become an increasingly common evaluation approach for community college research, we strongly encourage researchers who conduct those trials to create the commonly defined outcome variables that are available in THE-RCT (credits accumulated, enrollment, grade point average [GPA], and degree completion), for commonly defined time periods (semesterly), and make these data securely available to other researchers, either in THE-RCT or elsewhere. Doing so could greatly increase the knowledge payoff from the original trials and thereby improve future life chances of community college students.
Supplemental Material
sj-pdf-1-epa-10.3102_01623737221139493 – Supplemental material for What 20 Years of MDRC RCTs Suggest About Predictive Relationships Between Intervention Features and Intervention Impacts for Community College Students
Supplemental material, sj-pdf-1-epa-10.3102_01623737221139493 for What 20 Years of MDRC RCTs Suggest About Predictive Relationships Between Intervention Features and Intervention Impacts for Community College Students by Michael J. Weiss, Howard S. Bloom and Kriti Singh in Educational Evaluation and Policy Analysis
Footnotes
Acknowledgements
This article synthesizes the results from 30 MDRC evaluations conducted from 2003-2019. The evaluations reflect the work and commitment of myriad individuals, including multiple funders, researchers, and college administrators and staff members, as well as tens of thousands of students. We are indebted to everyone involved; the research would not have been possible without them. The Higher Education Randomized Controlled Trial (THE-RCT) database, from which the report draws, was designed and created by John Diamond, Colin Hill, Austin Slaughter, and Stanley Dai (along with Michael J. Weiss). Andrea Vasquez reviewed MDRC reports from some of the studies in the synthesis and helped the authors systematically code information about the interventions’ implementation for the research.
Declaration of Conflicting Interests
The author(s) declared no potential conflicts of interest with respect to the research, authorship, and/or publication of this article.
Funding
The author(s) disclosed receipt of the following financial support for the research, authorship, and/or publication of this article: Funding for this research was provided by the Institute of Education Sciences, U.S. Department of Education, through grant R305A190161 to MDRC. Opinions expressed are those of the authors and do not represent views of the Institute or the U.S. Department of Education. The work was also funded by Arnold Ventures.
Supplemental Material
Supplemental material for this article is available online.
Notes
Authors
MICHAEL J. WEISS, PhD, is a Senior Fellow at MDRC. His research focuses on evaluating programs designed to improve community college students’ success rates and conducting methodological research to improve the quality of randomized controlled trials.
HOWARD S. BLOOM, PhD, is a consultant at MDRC. His research focuses on developing, extending and applying experimental and quasi-experimental methods for estimating impacts of specific interventions, estimating variation in intervention impacts, and identifying intervention features that predict their impacts.
KRITI SINGH, MA, was a Technical Research Analyst at MDRC. Her work at MDRC involved conducting data analysis on postsecondary education policy–related projects.
References
Supplementary Material
Please find the following supplemental material available below.
For Open Access articles published under a Creative Commons License, all supplemental material carries the same license as the article it is associated with.
For non-Open Access articles published, all supplemental material carries a non-exclusive license, and permission requests for re-use of supplemental material or any part of supplemental material shall be sent directly to the copyright owner as specified in the copyright notice associated with the article.