
Abstract
The share of students attending charter schools has been rising. There is evidence that charter school growth has increased socioeconomic segregation of students between schools. In this paper, we assess whether charter school growth affects how students are organized within nearby traditional public schools (TPS). We use administrative data from North Carolina to estimate the impact of charter school openings on segregation by income within nearby TPS. Our models exploit variation in the presence and location of charter schools over time between 2007 and 2014 for students in Grades 3 to 8. We find limited evidence that the segregation of students by income at the classroom level increases when charters open nearby. We find some evidence of increasing segregation in third grade and fourth grade math and third grade ELA classrooms at TPS within 2 miles of new charters in large urban districts schools. Our results vary somewhat depending on how we control for underlying trends and measure segregation. We find no effect of charter school growth on income segregation in higher grades.
Keywords
A
Early critics of the charter movement raised concerns that they would be more likely to serve advantaged students and exacerbate segregation (Fiske & Ladd, 2000; Frankenberg & Lee, 2003). However, Epple et al. (2016) use data from the Common Core and find that in the aggregate, charters and TPS are similarly (and substantially) segregated by race and ethnicity. The location of charter schools in urban areas is a major factor shaping segregation in both charter and nearby TPS. Still, in a recent study of the impact of charter school growth in Massachusetts and North Carolina, Mumma (2022) finds enrollment declines in TPS after charter schools open nearby, especially among White students. Other recent studies have examined the impacts of charter schools on the racial composition of students in TPS. Most notably, Monarrez et al. (2020) exploit variation in growth rates of charters within traditional school districts around the country between 1998 and 2018. They find modest increases in racial segregation of students between TPS in the districts where charters grew most rapidly.
These studies of charters on enrollments and racial segregation in nearby schools raise broader questions about the effects of charters on the composition of students in TPS. The rise in the share of students attending charter schools has coincided with growing income-based segregation in public education. Since at least the 1990s, children from low-income families and those from more affluent families have increasingly been attending different schools (Owens et al., 2016). Importantly, these patterns appear to be highly localized: Segregation of students by family income is growing faster between schools within the same district than between districts in the same area. 1 Even within schools, students are segregated by income via classroom assignments (Kalogrides & Loeb, 2013), and the segregation of students by income at the classroom level has been increasing in recent decades (Dalane & Marcotte, 2022).
While there is evidence that charter school growth has led to increases in the socioeconomic segregation of students between schools, 2 there has been no work to date on the question of whether charter school growth affects how students are grouped within TPS. This is an important question for at least two reasons. First, charter schools were established in part because of their potential to affect how administrators in TPS deliver education to better serve their students. So, assessing whether charter schools exacerbate segregation of students by socioeconomic status (SES) is relevant for understanding how TPS are affected by competition for students. Second, since the growth of charter schools has coincided with an aggregate increase in segregation of students by SES, it is important to understand if they are linked.
In this paper, we address the question of whether segregation of students by SES increases in TPS as charters open nearby. How students are assigned to classrooms in TPS can be influenced by the introduction of nearby charter schools in two ways. First, if they attract students who are economically better off than the average student at the nearby TPS, the introduction of a charter school can change the mix of students by economic status, thereby changing the composition of students to be assigned to classrooms. Second, as we discuss below, competition for students from nearby charters induces TPS administrators to respond and cater to students and parents who might otherwise opt for a charter school. For example, TPS principals faced with competition from charters reported engaging in various strategies to attract or retain students, including introducing specialized programs and expanding gifted and talented programs (Jabbar, 2015). Since income is an important predictor of achievement, any increase in ability grouping could play a part in increasing the uneven distribution of students by income.
To study whether the growth of school choice in the form of charter schools has affected how students are sorted into classrooms within proximate TPS, we make use of detailed, student-level administrative data from North Carolina. These data provide a measure of free/reduced price lunch eligibility for students, along with information on classroom assignments. 3 We refer to students who are eligible for free or reduced-price lunch as economically disadvantaged (ED) in accordance with our data-sharing agreement with the North Carolina Education Research Data Center. Using the ED status of each student in each classroom—and each student in the same grade—we calculate measures of segregation of ED students within the school/grade, at the classroom level.
Estimating whether any changes in ED segregation over time are due to the advent of charter schools nearby is complicated by the likelihood that charter schools are opened strategically and in response to anticipated demand. So, evidence that TPS located near charter schools are more segregated than those further away is not sufficient for assessing treatment effects. 4 We exploit variation in the timing and location of charter schools to identify plausibly causal estimates of impacts on nearby TPS. We estimate a series of school/grade level models of the marginal effect of one additional same-grade charter school opening near a TPS. Because charter schools serve different grades, and because they sometimes change physical locations between years, the availability of charter schools as an alternative for students in the same traditional public school can vary by grade and by year. Our estimates are identified off of changes in the within school segregation at the TPS grade level that coincide with the opening of a charter school serving that grade nearby.
We find limited evidence that segregation of students by income at the classroom level in a TPS increases when charter schools open nearby. We find some evidence of increasing segregation in third grade and fourth grade math and third grade English language arts (ELA) classrooms at TPS within 2 miles of new charters in large urban districts schools. Our results vary somewhat depending on how we control for underlying trends and measure segregation. We find no effect of charter school growth on income segregation in higher grades.
In the following sections, we seek to shed light on recent trends in within school segregation by ED status, and whether the growth of charter schools has played a role in shaping these trends. We begin with a review of the literature on school segregation by race and income, both between and within schools. We then provide an overview on the background of charter schools and what we know about how charter schools have impacted segregation. Next, we describe our analytic model, data, and how we measure ED segregation and exposure to charter schools for TPS in North Carolina. Finally, we present our results, and conclude with a discussion of implications of our results and further questions they raise.
Background
Trends in Between and Within School Segregation
Researchers documenting trends in school segregation have primarily focused on race (Bifulco & Ladd, 2007; Garcia, 2008; Kotok et al., 2017). While segregation by income has received considerably less attention than segregation by race, recent work provides evidence that levels of socioeconomic segregation between schools have been on the rise in recent decades. Using national data, Owens et al. (2016) estimate that between district segregation of students by income increased by 15% between 1990 and 2015. They also estimate that between school segregation within the largest 100 districts increased by 40% over the same time period. Marcotte and Dalane (2019) report similar patterns.
Segregation research has focused on the sorting of students between different school buildings rather than the sorting of students between classrooms within school buildings, sometimes referred to as “second generation segregation” (Mickelson, 2001). This is in part because data about which schools students attend is more widely available than data about the specific classrooms in which students spend their time. Existing research on how students are sorted into classrooms within schools tends to focus not on segregation by race or income, but on separating students by prior achievement, or academic tracking. Four existing studies do find within school racial segregation at all grades, though it is lower than between school levels of segregation (Clotfelter et al., 2002; Conger, 2005; Kalogrides & Loeb, 2013; Morgan & McPartland, 1981).
We know less about within school segregation by income. Only two papers examine within school segregation by income to our knowledge. Kalogrides and Loeb (2013) examine within school segregation by race, income, and achievement in three large urban districts. The authors find much higher levels of segregation by all three characteristics across all grades than would be expected if students were randomly assigned to classrooms. The highest levels of segregation occurred in middle and high schools, where between school segregation tends to be lower due to larger school sizes. Much of the within school segregation the authors find can be explained by prior achievement levels. Lower-tracked classes with higher concentrations of both Black and low-income students were more likely to be taught by novice teachers, raising equity concerns. In the only work examining how within school socioeconomic segregation has changed over time, Dalane and Marcotte (2022) find that SES) segregation within North Carolina elementary and middle schools grew by about 10% between 2007 and 2014.
How students are sorted into schools and how schools sort students into classrooms are questions of first order importance for students, parents, and policymakers. The resources a student has access to are a direct result of the school he or she attends, and these resources affect long-run educational and economic outcomes (Jackson et al., 2016). A student’s peers are shaped by the school he or she attends and the specific classroom(s) to which he or she is assigned. The literature on peer effects shows that the makeup of students in each classroom also plays a role in shaping individual student outcomes (Hanushek et al., 2003; Sacerdote, 2011). Teacher quality is another important factor that impacts students, and high-quality, experienced teachers are not distributed evenly across schools and classrooms. Goldhaber et al. (2018) find that disadvantaged students are more likely to be exposed to lower quality teachers.
Charter Schools and Enrollment in Traditional Public Schools
At the same time segregation by income between and within schools has been increasing, charter school enrollments have also grown. Today, about 8% of all United States public school students attend charter schools, with considerable variation across states. In nine states, more than 10% of all public school students attend charter schools (NCES, 2021). Given their increasing prevalence, researchers and policymakers have devoted considerable time to considering the theoretical and actual impacts of charter schools on students.
Since charter schools are not subject to the same restrictions as TPS, charter school advocates tout them as potentially innovative alternatives to bureaucratic and slow-to-change TPS (Chubb & Moe, 1990). Economic theory suggest that the introduction of charter schools creates market-based competition that allows parents to “vote with their feet.” This competition is theorized to not just allow for innovative alternatives to TPS, but to also increase the quality of education available in TPS through competitive pressures. Advocates claim that TPS threatened with declining enrollments due to charter school competition will improve their educational offerings to retain students (Linnick & Lubienski, 2013).
Predictions aside, charter school competition has not been found to have consistently positive impacts on public school performance (Han & Keefe, 2020; Jabbar et al., 2022; Zimmer & Buddin, 2009; Zimmer et al., 2009). This could be in part due to the selection of students who attend charter schools. Charter school skeptics argue charters may cream skim, or intentionally select the best performing public school students, or push-out more difficult to educate students. Kho et al. (2022) find evidence of charter school push-out of students with disciplinary problems, but do not find evidence of cream skimming in North Carolina. Earlier researchers found evidence of charter schools intentionally excluding the students who are most expensive to educate such as English language learners and special education students (Lacireno-Paquet et al., 2002). While charter schools exert some control over the students they enroll and continue to serve, this is only part of the story. Families also self-select into charter schools. If different kinds of parents are more or less likely to enroll their children in charter schools, this could also result in certain types of students attending charter schools at higher rates.
Since charter schools may enroll different types of students than nearby TPS, researchers have examined how the levels of between school segregation change when charter schools open within a district (Kotok et al., 2017; Marcotte & Dalane, 2019; Monarrez et al., 2020). Most studies find that the average public school student who moves to a charter school attends a more racially segregated school than the one they left (Bifulco & Ladd, 2007; Booker et al., 2005; Frankenberg et al., 2010), though there is some variation by geography and grade level (Garcia, 2008; Kotok et al., 2017).
Similarly, Bifulco et al. (2009) examine segregation in Durham, North Carolina and find that between school socioeconomic segregation is higher in that district with families exercising choice options than it would be if all students attended their zoned public school, though of course families might have made different decisions about where to live had school choice options not been available. Saporito and Sohoni (2007) measure the concentration of low-income students in public schools and also find higher levels than would be expected if all students attended their zoned public school, suggesting the children of wealthier families are opting out of public schools for either public or private schools of choice. (Ni, 2012) provides further support for this idea, finding that students of higher SES status are more likely to leave TPS for charters, resulting in over-representation of low-income students in TPS. The net effect of this appears to be modestly higher levels of between school socioeconomic segregation as charter schools open and grow within a district (Marcotte & Dalane, 2019; Monarrez et al., 2020).
Charter Schools and Within School Segregation
While researchers have examined how charter schools impact the sorting of students between schools, no studies have examined whether or how charter schools impact the sorting of students within TPS. The introduction of charter schools could impact within school socioeconomic segregation in TPS in two ways. First, if students moving to charter schools are more or less likely to be ED than the average student in the TPS they left behind, then the baseline ED rate against which all classrooms are compared changes, thereby affecting within school segregation. There is evidence that charter schools attract students from more socioeconomically advantaged families (Ni, 2012). Low-income families may have less information about choice options or may face greater barriers when enrolling in choice schools than higher income families. For example, low-income students may have less access to reliable transportation to get to a charter school. If charters do enroll a higher proportion of higher SES students than TPS, the proportion of students who remain in TPS who are ED would rise. This could impact segregation within schools even if there is no intentional change in how students are assigned to classrooms.
Second, new competition from charters could affect segregation of students within schools by changing how students are assigned to classrooms in nearby TPS. There is a substantial literature on how public schools respond to the competitive pressures introduced by school choice. Most often, principals at TPS facing competitive pressure from charter schools increased marketing or communication (Jabbar, 2015; Kasman & Loeb, 2013; Kotok & Sorden, 2022; Loeb et al., 2011). Beyond information sharing, TPS principals faced with competition from charters have also made curricular or school-wide changes to attract or retain students. For example, in a survey of TPS principals in New Orleans, a city with a large number of charter schools, Jabbar (2015) reported that several principals described expanding gifted and talented programs. One principal reported a 300% increase in gifted and talented enrollments to attract and retain students. 5 Holme et al. (2013) report that in one of the two case studies of TPS in Texas that lost enrollments to nearby charters, the district decided to house a new advanced studies program in the school, in part to try to stem “a lack of higher performing students on the campus.” Minority students are underrepresented in gifted and talented programs, and the same may be true for low income students (Yaluma & Tyner, 2018). For example, there are documented gaps in enrollment by income in other courses aimed at high-performing students, such as AP courses (Klopfenstein, 2004).
Beyond introducing gifted and talented programs in TPS schools faced with charter competition, principals also report introducing niche academic programs, like International Baccalaureate or specialized curricula such as language immersion (Holme et al., 2013; Jabbar, 2015). Principals viewed filling a niche as a way to buffer their schools from competitive pressures. More generally, TPS administrators may cater to the students and parents who might otherwise opt for a charter school via preferential treatment when assigning students to classrooms. Higher income families are more likely intervene on behalf of their children when it comes to classroom assignments (Lareau, 1987, 2000); and school principals may face heightened pressures to meet these demands when they feel threatened by local choice options.
In sum, recent research suggests the introduction of a charter school could affect the segregation of students by income in nearby TPS through two channels. First, charter schools appear to reduce enrollment and thereby change the composition of nearby public schools. Second, competition from charter schools can lead principals to expand tracking or change curricular offerings in ways that increase sorting of students. Because of both these potential effects on the composition and assignment of students in TPS, the research question we address is: Does the introduction of nearby charter schools affect the segregation of ED students in TPS?
Analytic Approach
Measuring Segregation
A necessary first step for assessing trends in the segregation of students based on economic dis/advantage is the task of measuring student socioeconomic status. Since family income is not reported in administrative data, we use the standard approach of defining ED status based on student eligibility for free meals from the U.S. Department of Education’s National School Lunch Program (NSLP). Based on the federal poverty threshold, free-lunch eligibility is set at 130% of poverty while reduced-price lunch eligibility is set at 185% of poverty. There are well known limitations of these measures, including that not all qualified students are enrolled or have eligibility established, and some students whose families do not actually meet the income requirements are enrolled (Office of Research, Nutrition, and Analysis, 2007). Other critiques include the fact that a dichotomous measure obscures important variation in income at both high and low levels of income (Michelmore & Dynarski, 2017).
Domina et al. (2018) compared the validity of the ED measure we use to measures based on family income data obtained from Internal Revenue Service (IRS) records in Oregon and a district in California. They find that the dichotomous ED measure based on NSLP captured relatively little variation in IRS-reported family income. Nonetheless, they found that this ED measure is a better predictor of educational disadvantage. This is perhaps not surprising since income alone measures only one element of socioeconomic status, a construct that includes attributes like education and family background that are associated with student educational outcomes. While we recognize that relying solely on ED status to classify students as low-income is imperfect, given the limitations of administrative data and the lack of research in this area, we argue that it is still a worthwhile and defensible approach.
Using this dichotomous measure, we classify all students in a school as ED, or not. Socioeconomic segregation within a school occurs when the characteristics of students in classrooms deviate from the characteristics of students in the school overall; with some classrooms having more ED students than the school mean, and some fewer. We measure segregation using the familiar dissimilarity index, applied to school (s) in year (t):
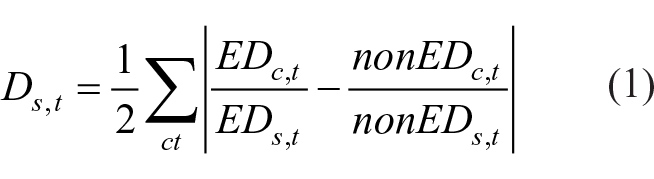
where C indexes classrooms within the school. EDc, t and nonEDc,t measure the number of economically disadvantaged and not economically disadvantaged students within the classroom in year t, while EDs,t and nonEDs,t are respectively the school total number of economically disadvantaged and not economically disadvantaged students. We calculate dissimilarity indexes separately by grade within each school, and separately for math and ELA classrooms.
The magnitude of the dissimilarity index can be interpreted as the proportion of students that would need to be reallocated to equalize the proportion of low-income to higher-income students in each classroom. 0 means that no reallocation is needed, and 1 means all students would be affected by reallocation to equalize. An advantage of the dissimilarity index is that it makes clear that the level of segregation in a school is a function of both the total number of ED and non-ED students enrolled and how students are assigned to classrooms within schools.
Data and Measuring Charter School Exposure
To examine changes in segregation at the classroom level, we use data from the North Carolina Education Research Data Center (NCERDC) to build a panel data set where the unit of analysis is at the school-grade level for all TPS in North Carolina between 2007 and 2014. We restrict our analyses to Grades 3 to 8. We do not have course assignment data in lower grades, and in high schools students are more likely to take courses with students in other grades, making the appropriate comparison group unclear. We limit our estimation sample to school/grade observations in which at least 10 students are enrolled and exclude school/grade observation in which greater than 10% of students are missing an ED status since the dissimilarity indexes we generate are based on ED status.
We generate two subject-specific dissimilarity indexes to measure ED segregation at the school/grade level, one that measures segregation within only math courses and one that measures segregation within only ELA courses. 6 We start with student-level data that contains information on each student’s school assignment, race, and critically for our analysis, ED status. The data also contain information on which courses a particular student is enrolled in each year. We use these data to aggregate students to the classroom level. Because some schools report classes over multiple semesters or terms, there are sometimes multiple iterations of the same course present in the data. Rather than isolating one iteration of each course, we use the full set of courses reported by each school. To calculate the subject-specific dissimilarity indexes for a particular school/grade/year, we select only the relevant course observations reported by that school for that grade (ELA or math). We then generate counts of the total number of ED and non-ED students within each course observation. We use the ED status counts from each reported course as the numerators and the sum of these counts as the denominators in the dissimilarity index calculation found in Equation 1.
To measure exposure to charter schools, we develop indicator variables for whether a charter school was open nearby and enrolling students in a given year within a various “crow-flies” distances, defined below. 7 Our measures of distance to nearest charter is not constrained to the TPS district. In North Carolina, charters are granted by the state educational authority, not the local school district, and students can attend charter schools regardless of whether the school is located in their home district. So, in our models, we identify effects of charters on students in a TPS school/grade off of intertemporal changes in the opening (or relocation) of charter schools serving the same grade nearby, compared to changes for further TPS in the same district over the same period.
It is important to recognize that charter schools and their expansion was uneven. During our panel, the number of charters serving Grades 3 to 8 operating in North Carolina grew from 82 to 114. This is a relatively small number in a sprawling and populous state, so in practice charter schools are not a widespread option in the state. It is helpful for our identification strategy that the small total obscures year-to-year change: Several charter schools opened and closed or changed physical locations during the panel. Nonetheless, the small total number of charter schools limits the number of TPS exposed to nearby charters for our purposes of estimating treatment effects.
In Figure 1, we show that charter schools are concentrated in the central part of the state, within large districts serving the state’s main metropolitan areas: Charlotte, Raleigh, Greensboro, Winston-Salem, and Durham (see Note 1). These five districts are the largest urban districts in the state (Charlotte-Mecklenburg, Wake, Guilford, Durham, and Winston-Salem/Forsyth) and are the only districts with at least 5 operating charter schools by the final year of our panel. 8
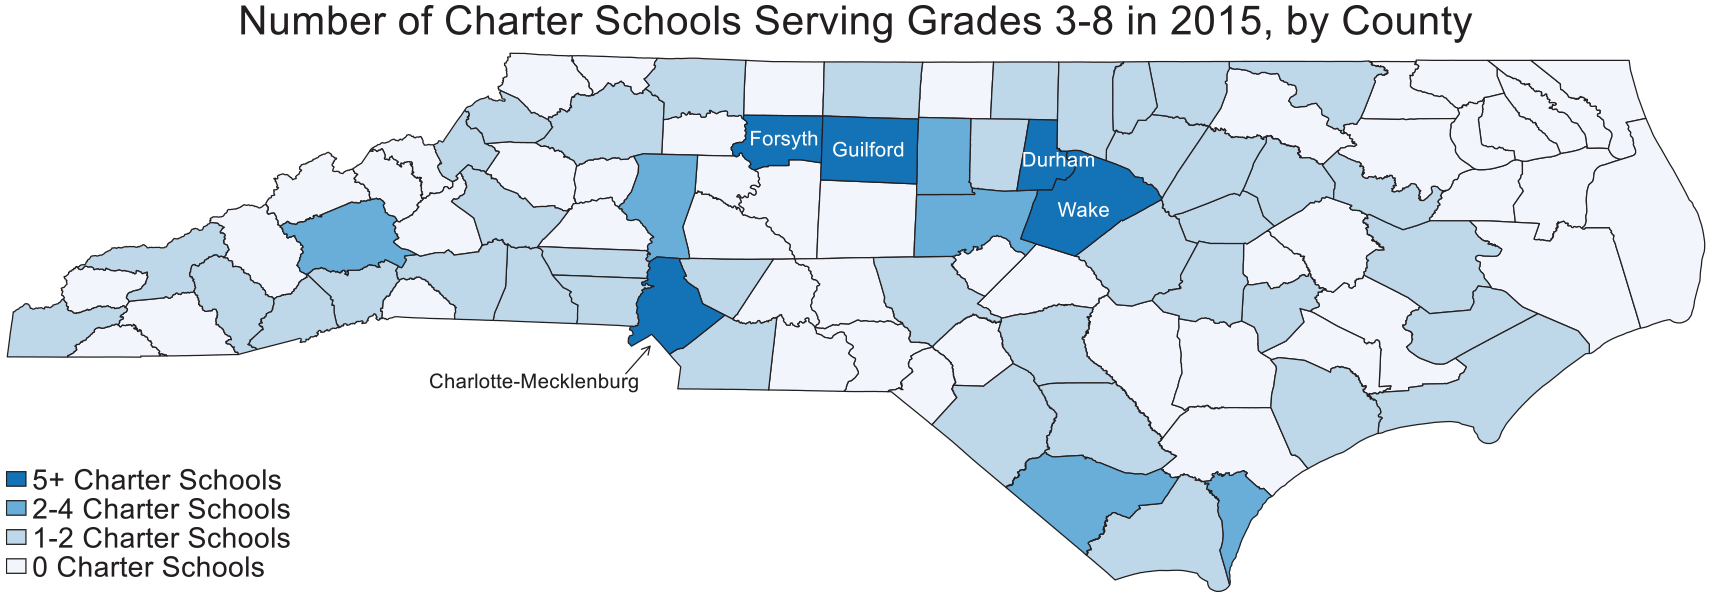
North Carolina charter schools by county, 2015.
Because charter schools are concentrated within these districts, we create separate measures of charter proximity for the five largest urban districts and for the remaining 110 districts in the state. For the proximity measures, we use the distance measurement to create two dummy variables measuring whether or not a TPS was very close, or moderately close to a charter school in a given year. In both cases, the reference group is the set of TPS farther away from any charter school in that grade/year. To define very close and moderately close, we use the distance from each TPS to the nearest charter. We define TPS as being very close if they were located within approximately 2 miles of a charter school in the large urban districts, or about 6 miles within other districts. We define TPS to be moderately close to a charter school if they are within approximately 2 to 5 miles in large urban districts, and 6 to 20 miles within other districts. 9
In Figure 2, we summarize the distribution of distances from TPS to charter schools within the largest urban districts and schools in the rest of the state. Over 60% of observations within the five largest urban districts are located less than five miles from a charter school serving the same grade, while over 50% of schools in the rest of the state are further than 15 miles from a charter school serving the same grade.
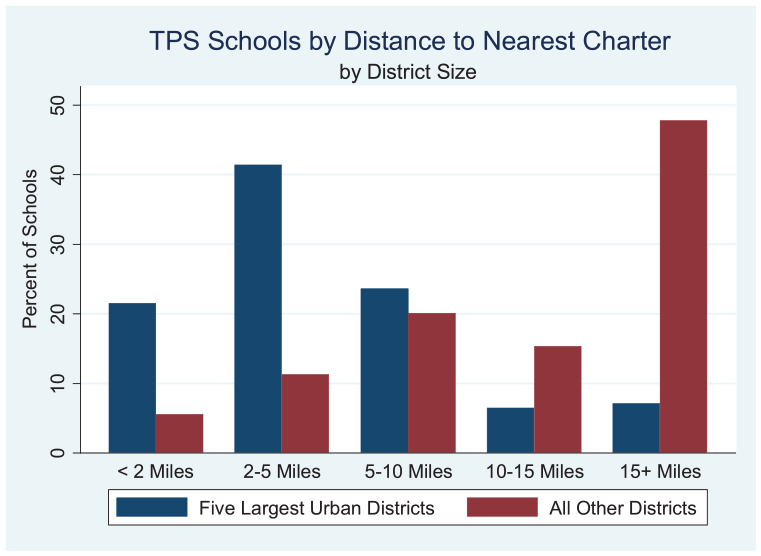
Distance to the nearest same-grade charter by district size.
Empirical Model
To estimate the impact of the introduction of charter schools on socioeconomic segregation in TPS we model the dissimilarity index at the grade-school level as a function of school attributes and changes in exposure to nearby charter schools. We measure changes in within-school segregation for TPS where charter schools are introduced or grow nearby, over and above changes in segregation over the same period for similar schools in the same district that do not face competition from nearby school/grades. Our differences-in-differences estimates make use of the fact that nearby charters often serve only a subset of grades served by a TPS, and in our most saturated models, our identification strategy relies on grade-specific segregation changes, net of overall school and district fixed effects (or changes). We estimate each model separately twice for each grade, once with the within school math dissimilarity index as the outcome and once with the within school ELA dissimilarity index as the outcome. Specifically, we regress Dst, the segregation index within school (s) in year (t) on basic attributes of the school, along with year fixed effects:
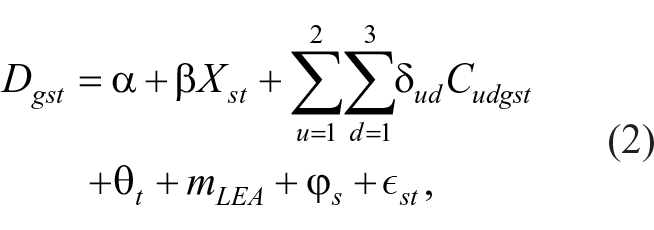
where Xst is a vector of basic attributes of the school, such as enrollment and racial composition;
In our models, we measure exposure to charter schools for students with a series of indicators:
Results
Descriptive Statistics
To begin understanding changes in segregation of ED students by classroom, we present descriptive statistics for our sample in Table 1; reporting for all schools in column 1, and separately for schools in large urban and other districts in Columns 2 and 3, respectively. The average grade enrolled 118.4 students, with larger grades in urban districts. The mean dissimilarity index is 0.235 for all grades/schools in the state. The large urban districts also have many more schools than other districts in the state, with more than 70 schools per grade compared to less than 13 schools per grade. Note that ED segregation measured by the dissimilarity index is higher in urban districts (0.267) than other districts (0.224). ED segregation in math and English language arts classes are approximately equivalent, though they are higher than classes overall (e.g., including non-academic classes).
Descriptive Statistics
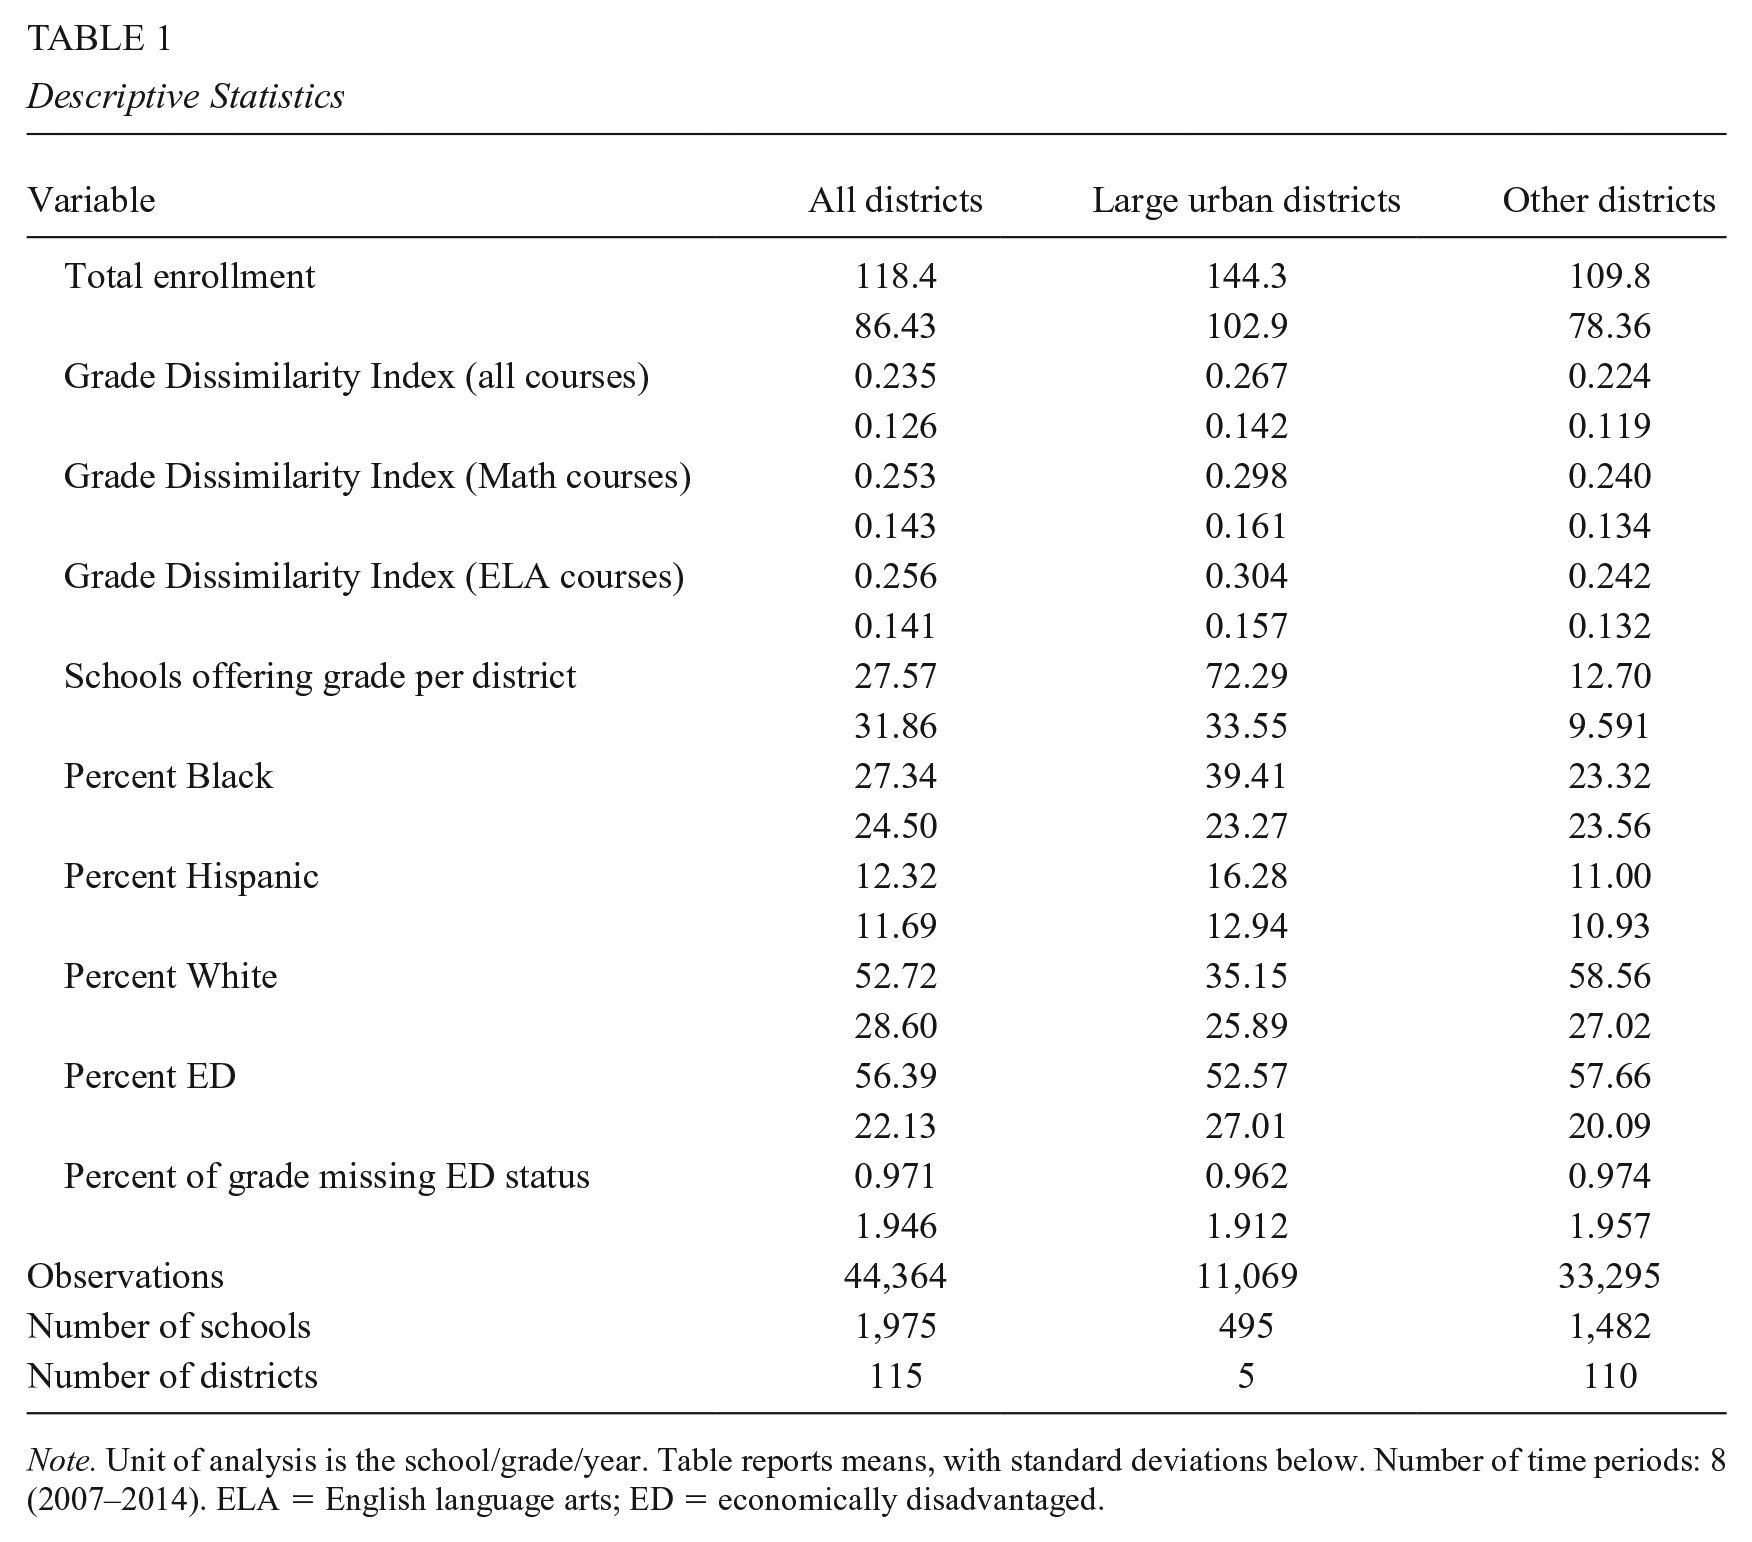
Note. Unit of analysis is the school/grade/year. Table reports means, with standard deviations below. Number of time periods: 8 (2007–2014). ELA = English language arts; ED = economically disadvantaged.
For the full sample, 56.39% of students are ED. The ED rate is slightly lower in the large urban districts (52.57%), which are the main economic centers of the state. Overall, 52.72% of students are White, non-Hispanic; 27.34% are Black, non-Hispanic, and 12.32% are Hispanic. In large urban districts, students are more likely to be Black, non-Hispanic than elsewhere (39.41% vs. 23.32%), and more likely to be Hispanic (16.28% compared to 11%).
To illustrate how within-school segregation is changing over time, in Figure 3 we plot trends in the math and ELA dissimilarity indices for elementary and middle schools. Schools in the five largest urban districts are in Panel (a) and schools in all other districts are in Panel (b). It is clear that within school segregation levels are higher in middle grades than elementary grades and in the five largest urban districts than all other districts. Elementary and middle grades in the five largest urban districts and all other districts appear to experience modest increases in within-school segregation in both math and ELA over the course of the panel.
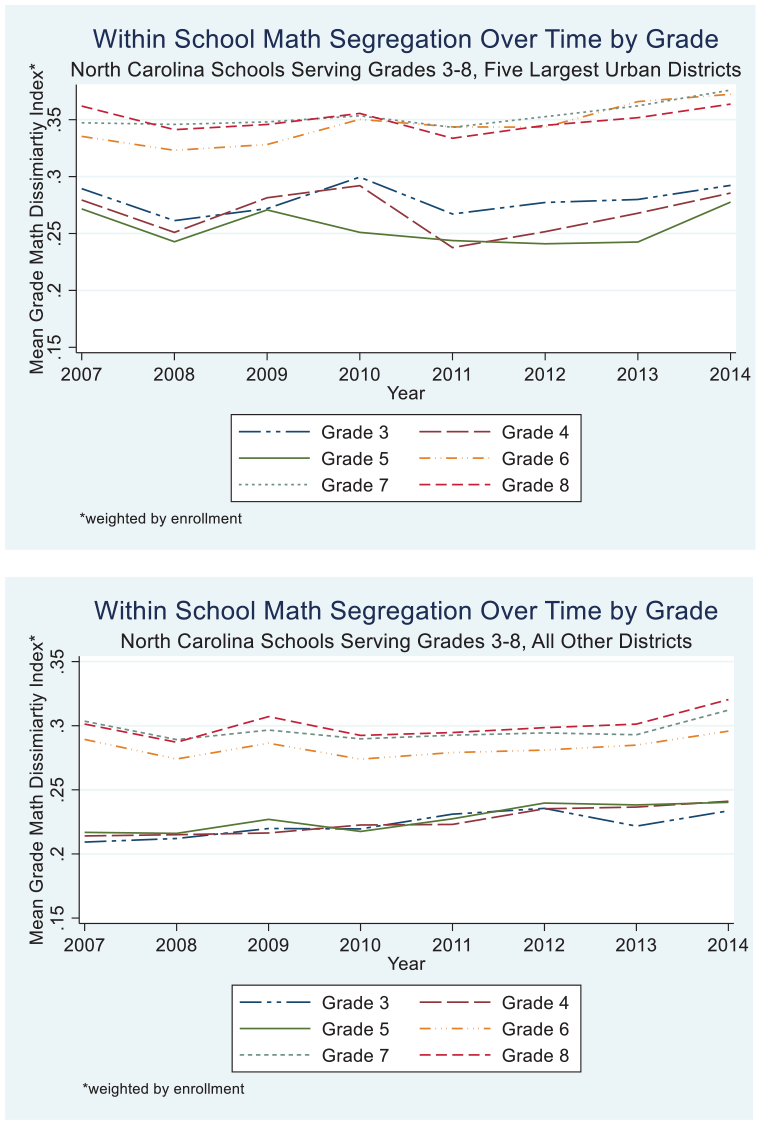
Math dissimilarity index by grade over time in five largest urban districts and all other districts.
Multivariate Models
Next, we turn to our multivariate models of changes in the dissimilarity index over time. In Table 2, we present the results from our models of exposure to charter schools on within school segregation in math classes in Grades 3 through 8 for TPS schools, from Equation 2. Here, the impact of charter schools is a two-way fixed effect estimate of changes in ED segregation for nearby TPS over the period a charter school opens, over and above changes for other TPS in the same district during the same period. We model the dissimilarity index as a function of whether a TPS was very close, or moderately close to a charter school (as described above) in a given year, and distinguish between schools in the five largest urban districts and all other districts. All models include time-varying school controls measuring enrollment and student demographics and include year fixed effects, to measure common changes in segregation in the state over the period, along with district and school fixed effects. 11
Charter Proximity and Segregation in TPS Math Classrooms, by Grade
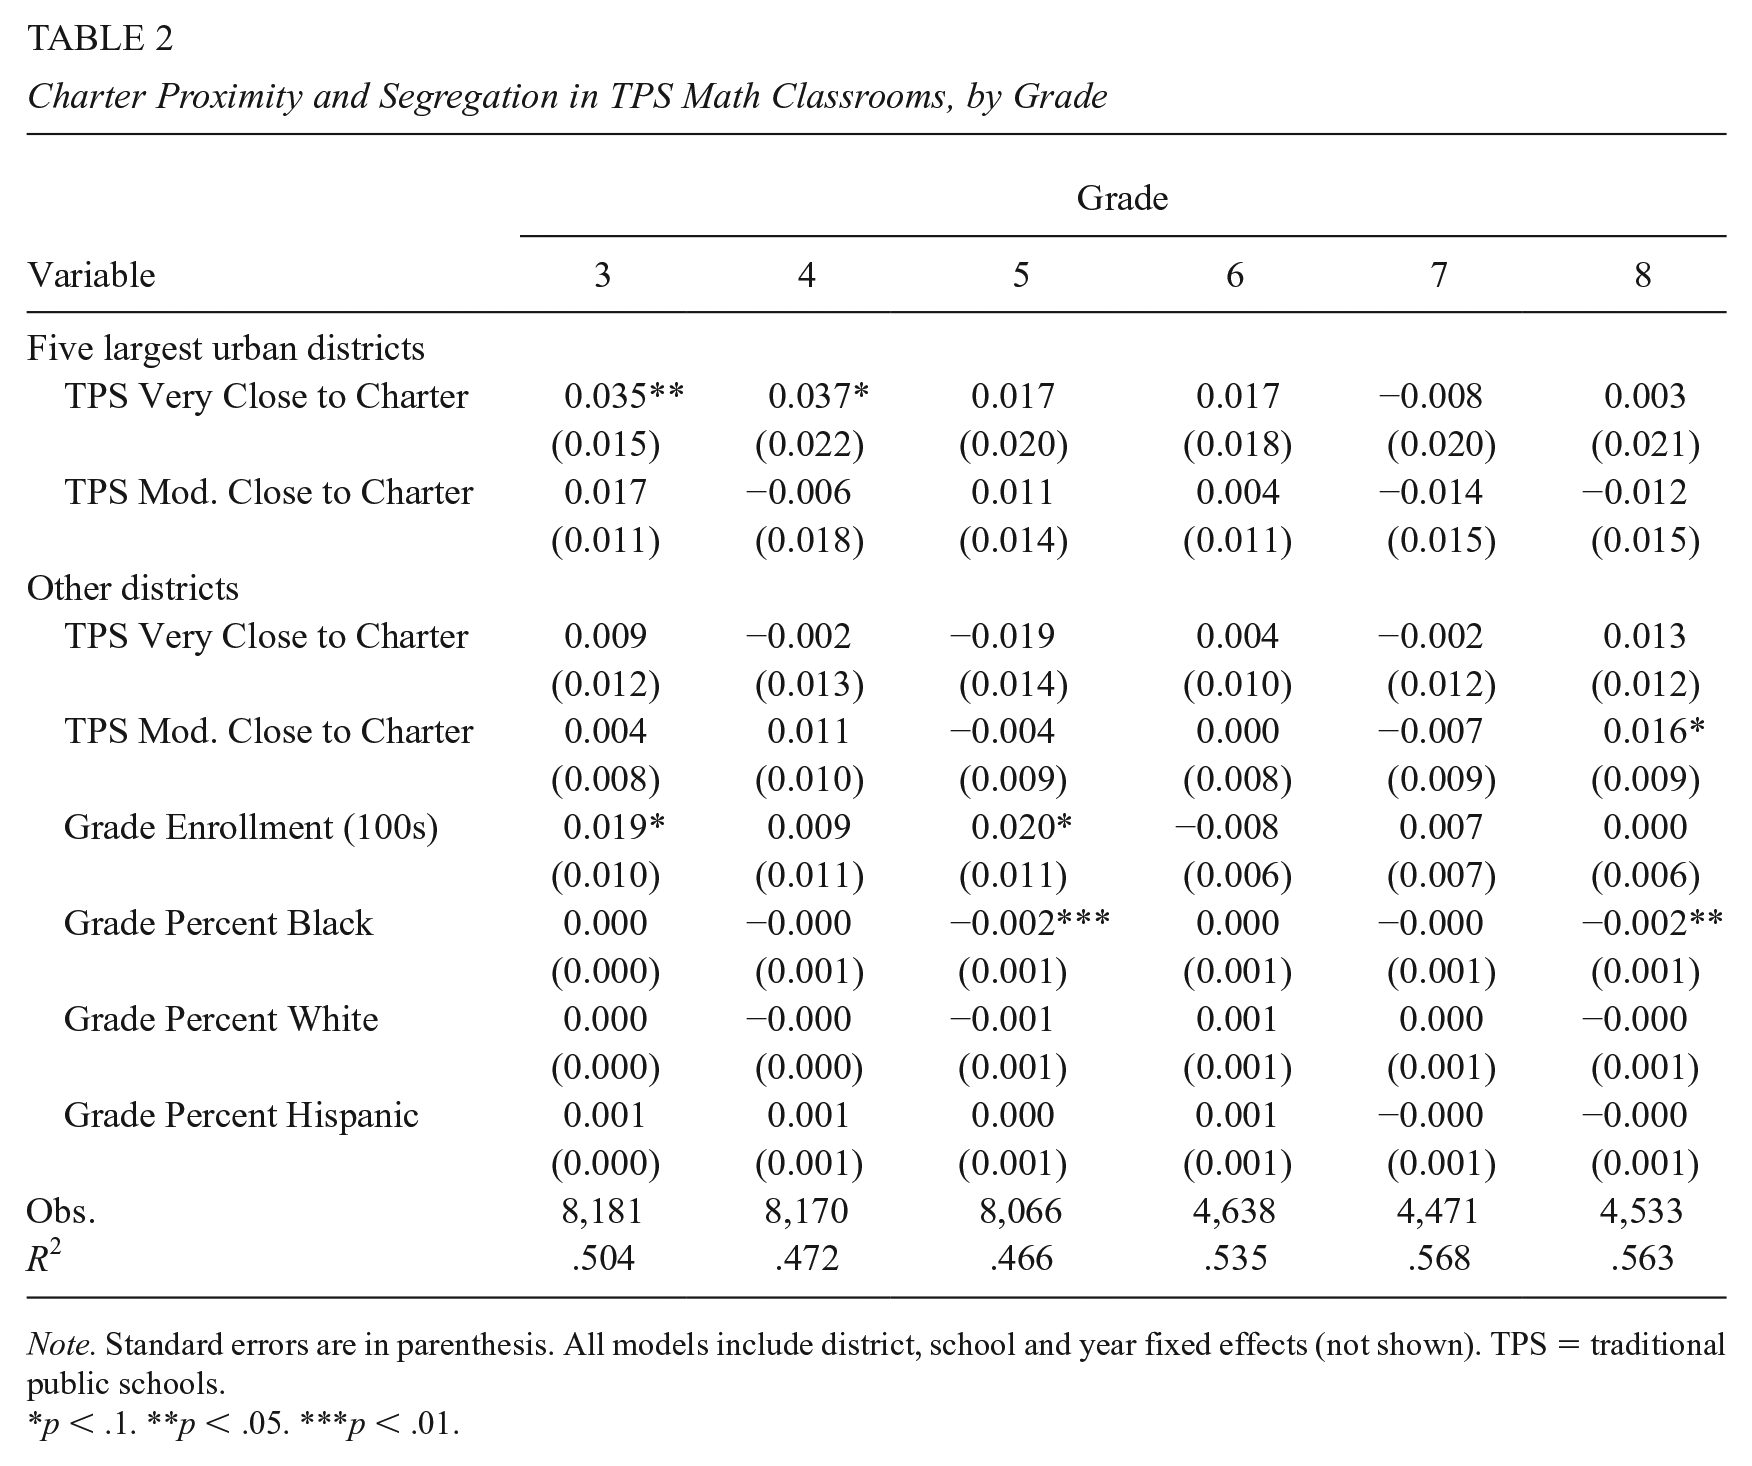
Note. Standard errors are in parenthesis. All models include district, school and year fixed effects (not shown). TPS = traditional public schools.
p < .1. **p < .05. ***p < .01.
In column 1 of Table 2, we estimate that in large urban districts, when charters serving third grade opened nearby (<2 miles), that the average nearby TPS saw ED segregation increase by 0.035 in its third grade math classes, statistically significant at the 5% level. 12 To interpret magnitude, this is about 0.2 standard deviations. Notably, we see no relationship between the opening of a charter farther away in large urban districts and within school segregation in TPS third grade classrooms. We also find no relationship between the opening of a charter school and within school segregation for TPS outside of large urban districts.
In the remaining columns of Table 2, we present results for Grades 4 through 8. We estimate that for TPS within 2 miles of new charter schools in large urban districts, ED segregation increased by 0.037 in fourth grade math classes. This is comparable in magnitude to the third grade, but significant at only the 10% level. As with Grade 3, we see no relationship between charter schools and within school segregation outside of large urban districts. Furthermore, we also find no evidence that the opening of a new charter schools serving Grades 5 through 8 have any effects on within-school segregation of students by ED status in nearby TPS in large urban districts, or elsewhere.
In Table 3, we present the results from our models of exposure to charter schools on within school segregation in TPS ELA classrooms in Grades 3 through 8. In column 1, we estimate that for TPS schools in large urban districts, when a charter school opens nearby, ED segregation in third grade ELA classes increases by 0.026 (approximately 0.15 standard deviations), significant at the 10% level. As with math, we find no evidence of changes in segregation in TPS outside of large urban districts. Furthermore, in all districts, we find no evidence of significant changes in ED segregation in ELA classrooms in TPS near new charters for Grades 4 through 8.
Charter Proximity and Segregation in TPS ELA Classrooms, by Grade
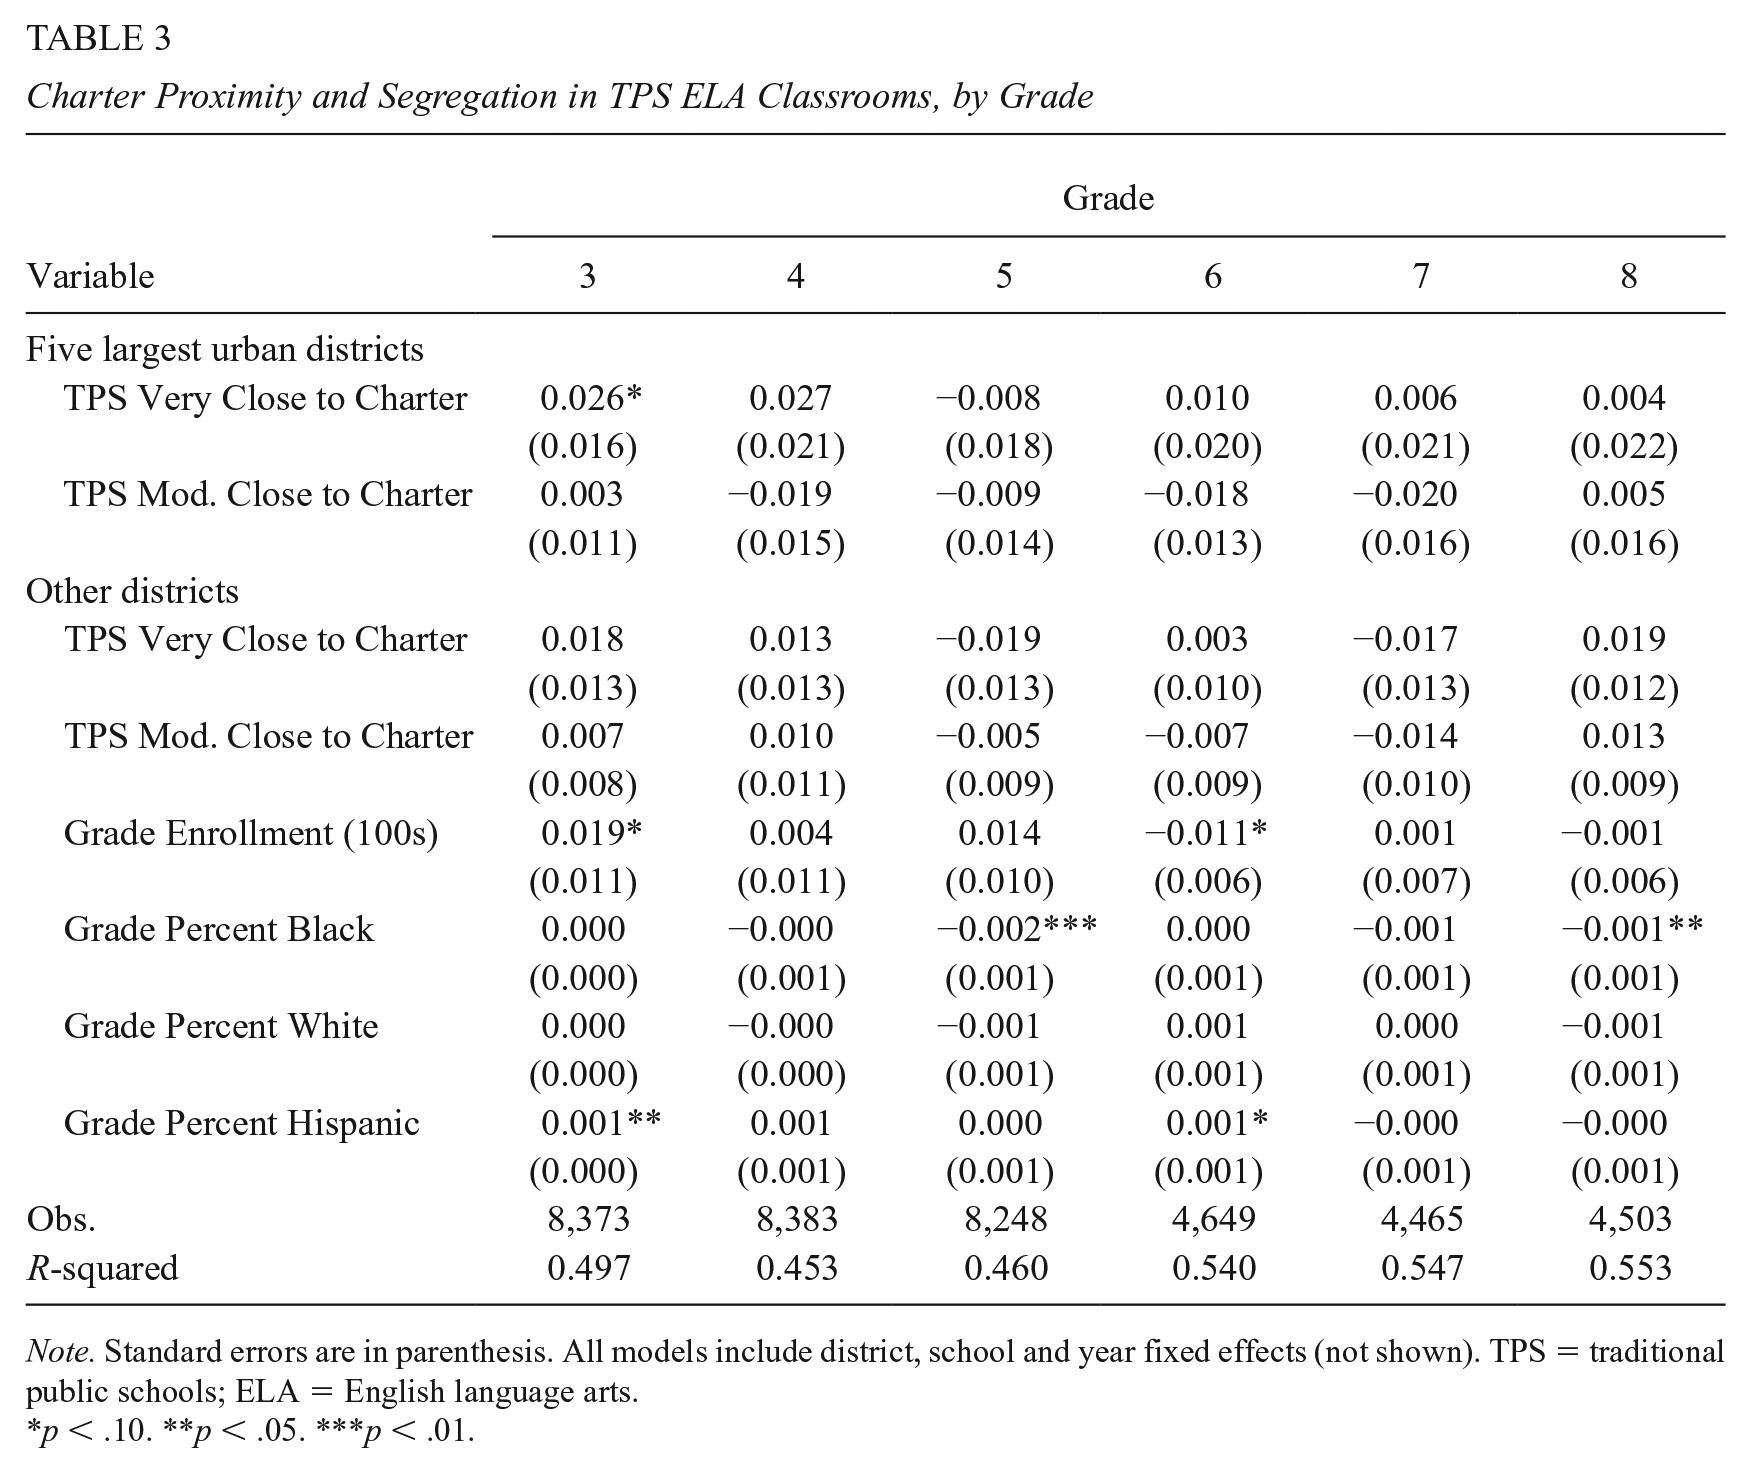
Note. Standard errors are in parenthesis. All models include district, school and year fixed effects (not shown). TPS = traditional public schools; ELA = English language arts.
p < .10. **p < .05. ***p < .01.
In sum, we find limited evidence that segregation by ED status increases in TPS math and ELA classes subsequent to the opening of charter schools nearby. The only effects we see are in early grades. This pattern of findings only for lower grades could be due to relatively large effects of new charters on enrollments in early grades at nearby TPS. This could occur if parents are more willing to change schools for their children in early grades. For example, a recent study of school mobility in Texas found that students in elementary school grades were about 25% to 33% more likely to change schools from year to year than middle school students (Villareal, 2020). Reynolds et al. (2009) similarly report higher mobility among the youngest students. The pattern could also be due to the fact that higher grades already have higher levels within school segregation and academic tracking than early grades. So, even without a compositional change, marginal changes in assignment that lead to ED segregation may be more feasible in early grades.
Robustness Checks
Estimating the impact of the introduction of charter schools on ED segregation in nearby TPS in a quasi-experimental framework is necessarily difficult. Here, we face the well-known problem of establishing the proper counter-factual, along with issues of measurement for both the main independent variables and the dependent variable. We next assess the robustness of our findings of impacts on segregation in third grade math and ELA classrooms to alternative strategies for identifying changes for TPS exposed or not exposed to charter schools, as well as choices for measuring exposure and measuring ED segregation within schools.
First, we re-estimate our model, but restrict the sample to districts that had at least one charter open during the panel. Like our main models that include district fixed effects, treatment effects are estimated by comparing changes for TPS sited near a new charter to those from TPS within the same district but farther away. By restricting the sample to charter-only districts, only schools in these districts contribute to intertemporal changes in segregation for the purposes of establishing the counterfactual. If one is concerned that districts that never host a charter are not a relevant counter-factual, then the loss of information for estimating common time effects is acceptable. An alternative strategy for handling this issue is to re-estimate our fully-specified model using the full sample, but replace common year fixed effects with district-specific linear trends. Allowing each district to follow its own trend over the period is more flexible and retains the full set of information, but in a short panel limits statistical power.
To assess whether and how our results are affected by measurement, we first change our key independent variables from (0/1) indicators of exposure to a charter school for each TPS, to measures of the total enrollment in nearby charters. Specifically, we include measures of the number of students enrolled in charters very near or moderately near a TPS. 13 Measuring charter school exposure using enrollments expands on the extensive margin effects estimated in our main results, by including changes in ED segregation as nearby charters grow in size.
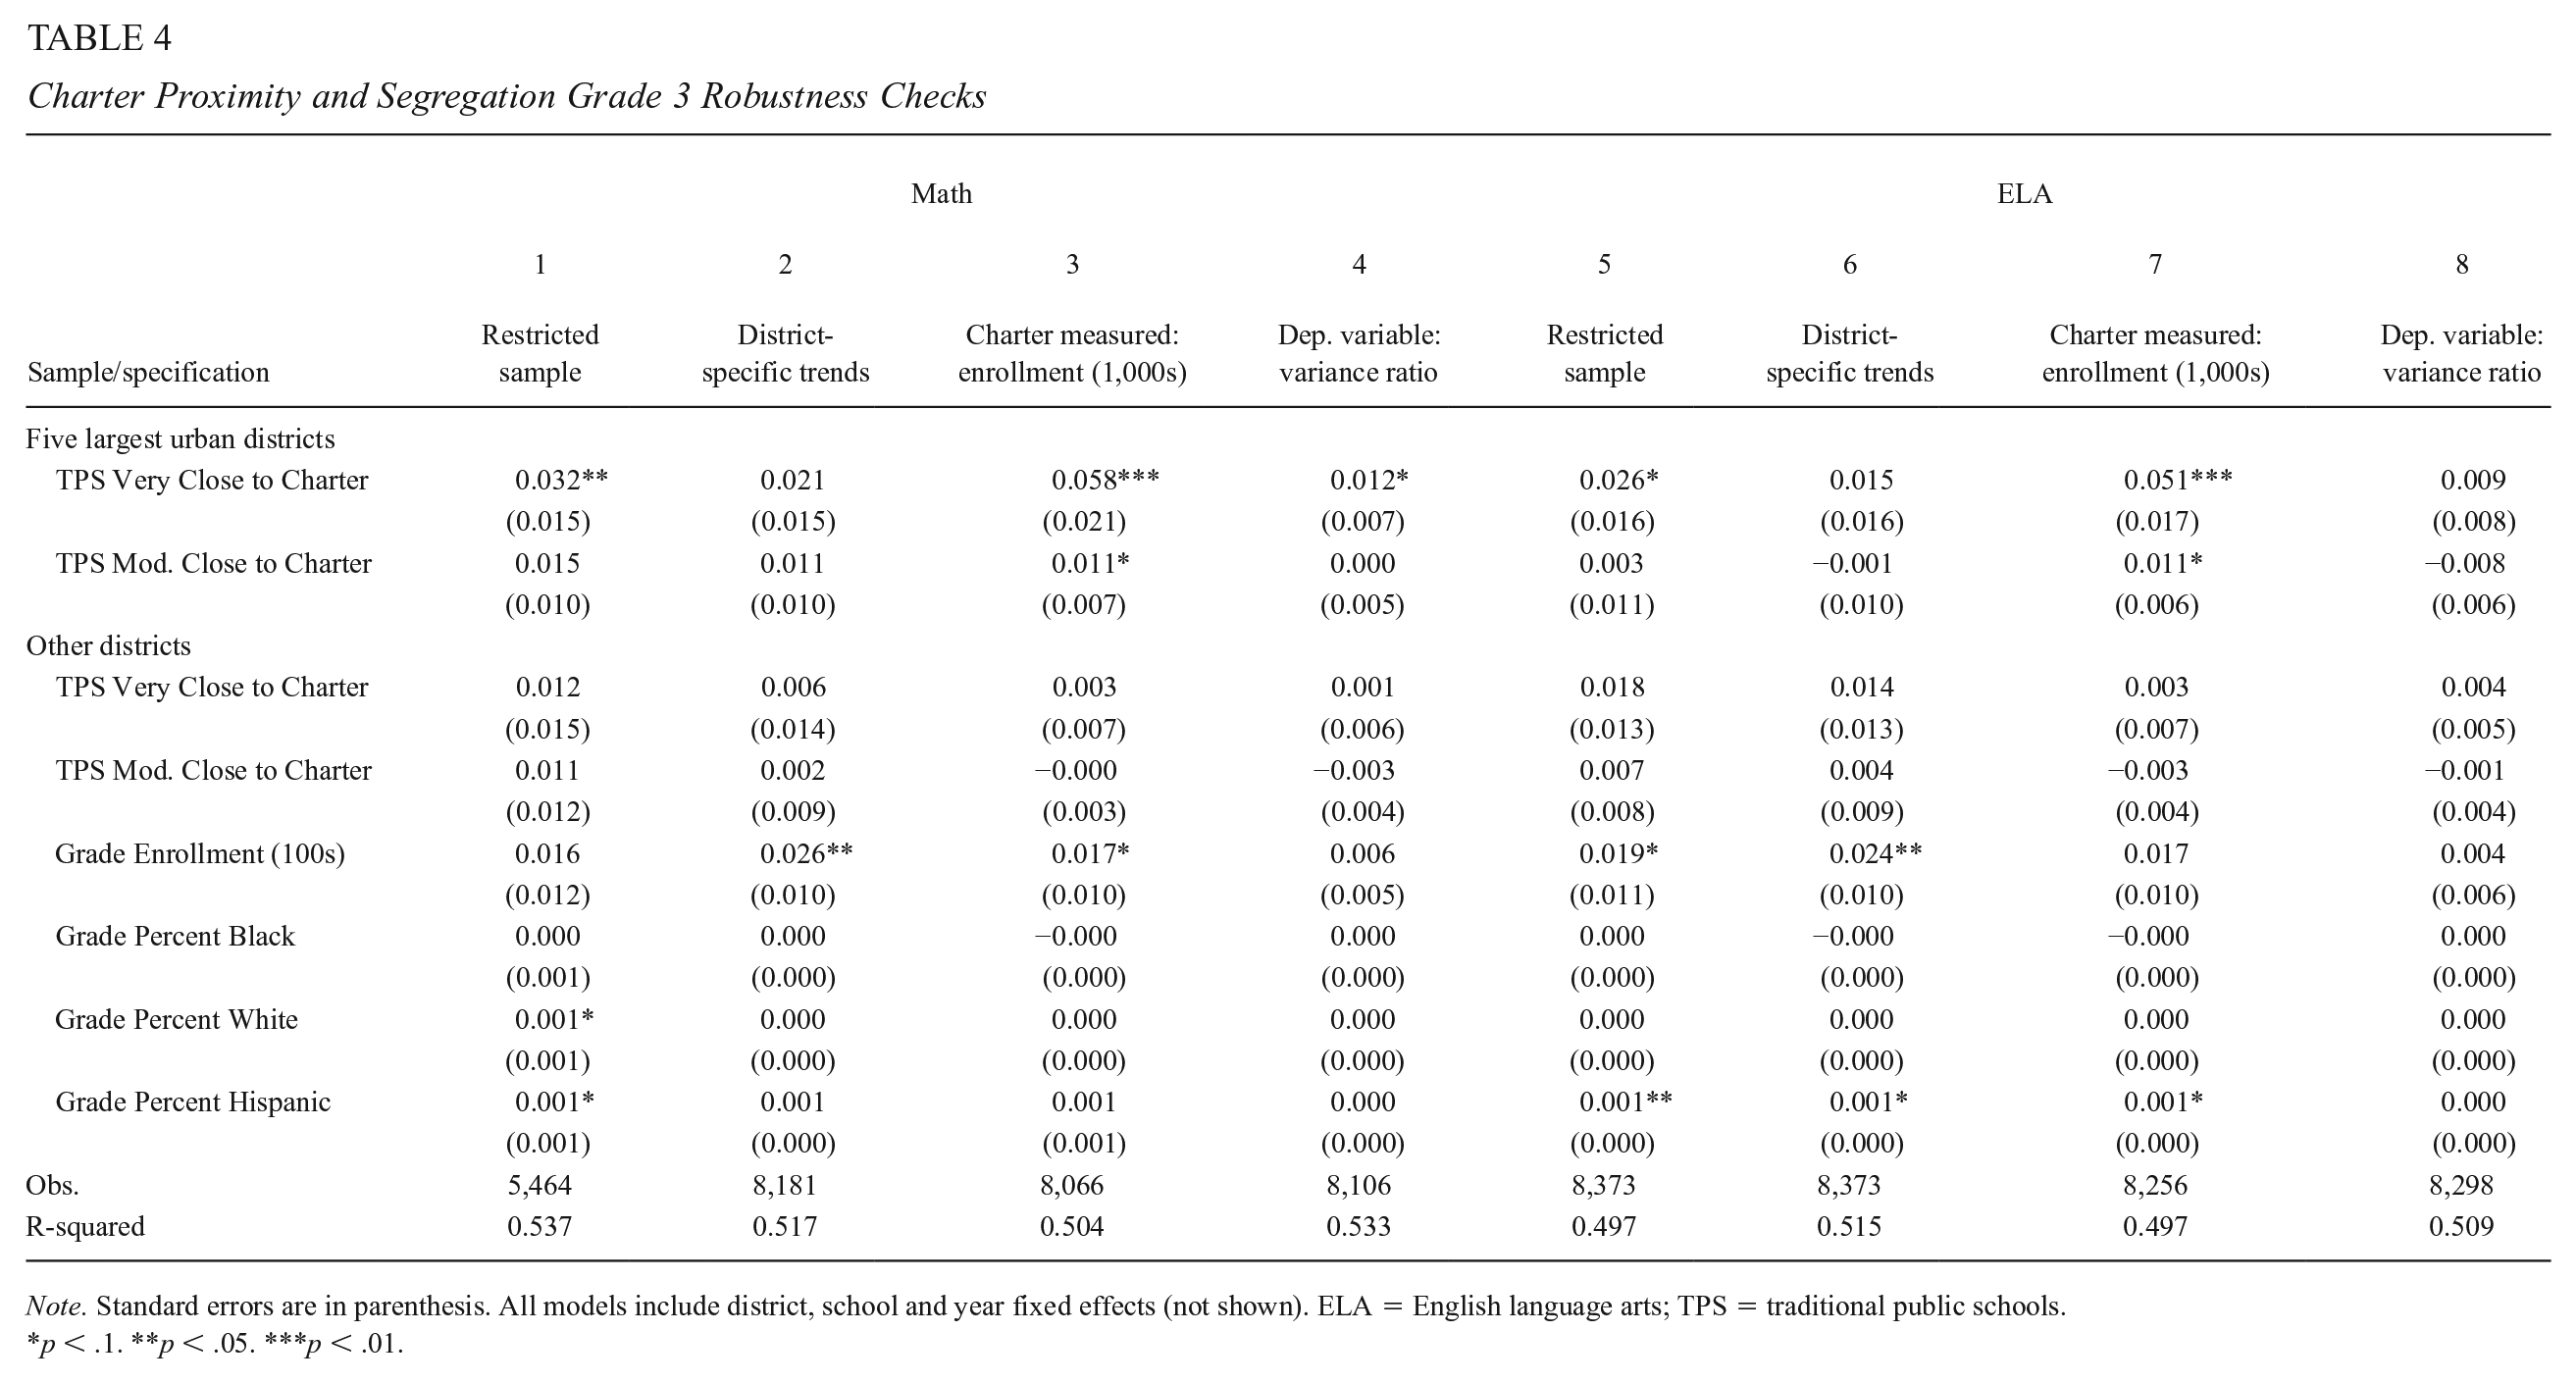
In Table 4, we present results of each of these robustness checks for ED segregation in third grade math and ELA courses. In Columns 1 and 5, we restrict the sample to schools in districts where a charter school opened during the panel. Consistent with our results in Tables 2 and 3, ED segregation is significantly affected only in TPS schools sited within two miles of a new charter in urban districts. Our estimates from the restricted sample are nearly identical to the estimates from the full sample. We estimate the average nearby TPS saw ED segregation increase by 0.032 in its third grade math classes (compared to 0.035 for the full sample) and by 0.026 in its third grade ELA classes (identical to the full sample estimate). We conclude that our results are not affected by including a broader set of schools and districts in our analysis. In addition to providing information useful for estimating year effects, including these schools has the further advantage of retaining TPS that are in districts where charters never open, but are sited proximate to charters in neighboring districts. Since enrollment in charters is not constrained by district of residence in North Carolina, charters can have the same effect on these schools as on TPS in the district where the charter school is located. For example, several schools in the research triangle area of Raleigh-Durham-Chapel Hill are not in either the Wake or Durham LEAs, but are proximate to charters sited in those districts.
Charter Proximity and Segregation Grade 3 Robustness Checks
Note. Standard errors are in parenthesis. All models include district, school and year fixed effects (not shown). ELA = English language arts; TPS = traditional public schools.
p < .1. **p < .05. ***p < .01.
In Columns 2 and 6 of Table 4, we turn to the results of our next robustness check for third grade math and ELA classes, respectively. Here, we augment our model on the full sample, but control for underlying changes using district-specific linear trends rather than common year fixed effects. In Columns 2 and 6, the coefficients on exposure to charter schools on math and ELA segregation are no longer statistically significant, regardless of proximity or whether or not a TPS is in a large urban district. Once we include district-specific trends, the point estimates on charter exposure for the most proximate TPS falls from 0.035 (full sample) to 0.021 for math, and 0.026 to 0.015 for ELA. This suggests that some of the increase in ED segregation occurring for TPS near charters is common to all schools in the district, even if larger near the most proximate schools. We conclude that our main results are sensitive to how we model underlying trends, and discuss implications below.
We turn next to assessing the sensitivity of our findings to how we measure exposure of TPS to charters, and how we measure ED segregation. In columns 3 and 7 of Table 4, we measure exposure as the total enrollment in charters that are sited very close or moderately close to TPS. We estimate that an increase in charter enrollment of 1,000 students within 2 miles of a school in a large district increases the ED dissimilarity index for third grade by 0.058 in math classes and 0.051 in ELA classes. These are both significant at the 1% level and larger in magnitude than the coefficients in our preferred models. To interpret the magnitudes of these coefficients, the average TPS in large districts operated in an area with 72 students (per grade) enrolled in charters within two-miles, with a standard deviation of 295. By the end of the panel, one TPS elementary school operated within 2 miles of charter schools that served 4,489 students. The coefficients here suggest that a one-standard deviation increase in charter enrollment increases math and English as second language (ELS) segregation by more than a full standard deviation. Moreover, we estimate that enrollment growth of charters affects ED segregation in TPS farther away, by about 0.011 in both math and ELA classes at TPS 2 to 5 miles away. The larger and broader effects as measured by enrollment suggests that a 0/1 indicator may underestimate effects of charters on TPS by ignoring the intensive margin.
Finally, we consider the sensitivity of our results to the use of the dissimilarity index as a measure of ED segregation. In Columns 4 and 8, we report results from a model using the full sample and our preferred specification for the right-hand-side of Equation 2, but in which we measure grade/subject specific segregation using the variance ratio. 14 One advantage of the variance ratio is that it adjusts for compositional changes in enrollment by ED status, so it provides a direct test of the assignment mechanism. We estimate that ED segregation as measured by the variance ratio increases by 0.012 in grade math classes, but by an insignificant 0.009 in ELA classrooms. For math, an increase of .012 represents an increase of about 0.15 standard deviations, or 20% of the mean. This is an increase very similar in magnitude to the increase we see in our main model with the math dissimilarity index as the outcome.
To further examine whether changes in classroom assignments or ED composition are driving the increases in segregation in Grade 3, we assess how charter school growth impacts enrollments by ED status in nearby TPS. To do this, we change our main estimating equation by switching the dependent variables from the grade-specific dissimilarity indexes to grade-specific enrollments of ED and non-ED students. The thought experiment here is to see if increasing charter enrollments nearby to a TPS causes ED and non-ED students to sort out at differential rates, which would suggest that the composition effect could be a mechanism through which charter penetration increases within school segregation.
We present the results from these models in Figure 4. The figure shows the point estimates and confidence intervals for the marginal effect of each 1,000 students enrolled within 2 miles of a TPS in a large urban district on ED and non-ED student enrollment, separately by grade. We find evidence that non-ED students are sorting out of TPS at higher rates than ED students in middle school grades. This is consistent with the findings of (Ni, 2012), who studies the effects of charter school transfers on ED and non-ED enrollments in TPS in Michigan. However, the point estimates for ED and non-ED enrollments in elementary school grades are all centered on 0 with very tight confidence intervals. We find no evidence that ED and non-ED elementary school students are differentially sorting out of TPS when charter school enrollments nearby increase, suggesting the composition effect is not the mechanism through which socioeconomic segregation is increasing in Grades 3 and 4 when charter schools open. Since the composition effect cannot be driving the increases in within school segregation we find, this pattern is more consistent with changes due the assignment mechanism.
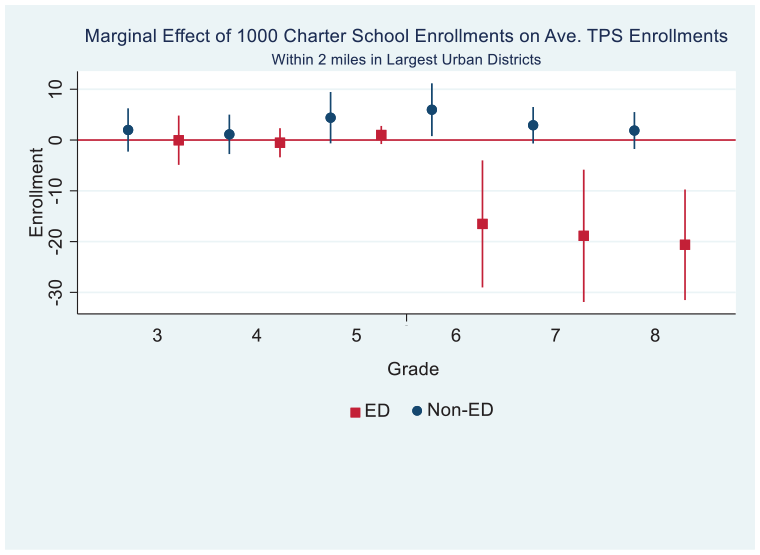
Impact of charter enrollments on TPS enrollments for ED and non-ED students, by grade.
Conclusions
Charter schools play a growing role in the landscape of U.S. public education. Previous research has found that charter school growth increases between-school segregation of students. Our study is the first to date to assess the impact of charter school growth on another important component of segregation: within-school segregation by classroom. We find that when charter schools open nearby, segregation among students by economic disadvantage status increases in TPS math and ELA classes in Grade 3 and math classes in Grade 4. However, we do not find evidence that within-school segregation is increasing in higher grades when charter schools open.
Overall, charter growth played a small and limited role in shaping segregation at the classroom level within TPS in North Carolina. The growth of charter schools was modest in the state during this period because of a cap on the number of charters. We find that the increase in segregation related to charters was limited to the large urban districts where charters were concentrated. It is an open question whether this relationship would be larger or smaller for TPS near charters in other states where the growth of charter schools has been more rapid.
Where we do see growth in nearby charters in our panel, the subsequent increases in ED segregation for early grades are not trivial, but only in TPS that were within 2 miles of a new charter. 15 Our findings imply that the effect of having a same-grade charter school within 2 miles increases the dissimilarity index by .035 in math and .026 in in ELA in grade 3, and by .037 in math in grade 4. To put the magnitude of these effects in context, consider that the mean math dissimilarity index in third grade in large urban districts is .286 with a standard deviation of .16. An increase of .035 represents an approximately 12% increase of the mean, or 0.2 of a standard deviation.
We have attempted to provide insight into whether the increases in within-school segregation we find in third and fourth grade were driven primarily by changes in enrollments of students by ED status, or by changes in how students are assigned to classrooms. We find that charter school growth had negligible effects on the relative enrollment of students by ED status in TPS at the elementary level, where we find impacts of charter school growth on within-school segregation. This suggests changes in how students are sorted into classrooms by ED status has had the biggest effect on socioeconomic segregation.
Our findings of relatively small impact on segregation at the classroom level differ from prior research finding more consistent effects of charter school openings on the segregation of students between schools, both by race and income (Bifulco & Ladd, 2007; Marcotte & Dalane, 2019; Monarrez et al., 2020). The prior research on the impact of charter schools on academic achievement is mixed (Epple et al., 2016). Segregation, both between and within schools, can impact the achievement of different groups. A fruitful direction for future research would be to examine the mediating role that segregation both between and within schools might play in explaining the impact of charter school growth on achievement. There also remains much more to be understood about the factors driving the growth of segregation within TPS schools by ED status and race and how they affect one another.
Of particular importance is clarifying the roles education policy can play in shaping future trends. Among the understudied policy questions are how patterns of educational tracking are changing, and whether these shape segregation by ED status. The growth in ED segregation within schools identified in previous studies could be due to higher levels of enrollment in gifted/talented programs by non-ED students, regardless of competition from charter schools. If so, efforts to address within school segregation would require more concerted effort to identify ED students for higher level tracks, or to bring attention to unintended consequences of tracking efforts generally.
Footnotes
Declaration of Conflicting Interests
The author(s) declared no potential conflicts of interest with respect to the research, authorship, and/or publication of this article.
Funding
The author(s) disclosed receipt of the following financial support for the research, authorship, and/or publication of this article: We thank Emma Hall for excellent research assistance and gratefully acknowledge funding from the Smith Richardson Foundation. The authors alone are responsible for all interpretations and any errors.
Notes
Authors
KARI DALANE, PhD, is a data analyst at the New Jersey Department of Education. Her research focuses on equity in K–12 education.
DAVE E. MARCOTTE, PhD, is a professor at the School of Public Affairs, American University. His research interests include educational policy, equity and achievement.