
Abstract
Clearinghouses set standards of scientific quality to vet existing research to determine how “evidence-based” an intervention is. This paper examines 12 educational clearinghouses to describe their effectiveness criteria, to estimate how
Keywords
“Evidence-based” is a concept currently in vogue under the assumption that high-quality scientific studies can identify interventions with valid positive results whose dissemination will improve educational outcomes on a broad scale. Clearinghouses (CHs) play an important role in this process by (1) specifying their preferred scientific criteria for identifying valid causal effects; (2) searching out studies of the required quality; (3) evaluating each of these studies; (4) synthesizing all the results over studies to assess if a given program, policy, or procedure can be recommended; and then (5) disseminating the recommendations to interested researchers, policy-makers, teachers, school administrators, parents, and even the general public to inform them whether a given program is effective, promising, unclear in its effects, ineffective, or even directly harmful. This paper describes how consistent CH standards are for concluding that an educational intervention is evidence-based, how consistent program recommendations are when more than one CH evaluates the same program, and why CH judgments might differ. The goal is to examine the reliability of “evidence-based” judgments in the very CH domain that claims to generate and disseminate valid information about interventions that scientific evidence indicates to have positive effects.
Over the last few decades, the evidence-based policy movement has grown steadily. One area where it has become institutionalized is in clearinghouses. Clearinghouses collect all the studies evaluating a given program before vetting them for their relevance and technical quality, synthesizing the study-specific results into an overall finding about program effectiveness, and disseminating the finding in hopes that all interested stakeholders can access it (Gough et al., 2021; White, 2019). Many novel ways of synthesizing evidence for policy relevance also continue to emerge (see overviews/meta-syntheses in Polanin et al., 2017).
In scientific discourse, “evidence-based” refers to using a particular set of warranted scientific standards to justify claims about program effectiveness. In public discourse, evidence-based implies that a program has been shown to have positive impacts, and no reference is required to the quality of the research practices underpinning this verdict. As a result, if a well-evaluated program had no demonstrable effects, it could be simultaneously judged as evidence-based because of the design but also as not evidence-based because of the absence of evidence of effectiveness. This paper uses “evidence-based” in both senses, relying on context to make the difference clear.
Seen from a multitrait-multimethod perspective (Campbell & Fiske, 1959), the paper can be interpreted as exploring the construct validity of “evidence-based” as it is practiced in educational science. The emphasis is on convergent rather than discriminant validity, reliability being a necessary condition for construct validity. Concretely, we ask: How well do judgments about the effectiveness of a given program converge across CHs? If they converge well, this indicates that CHs agree on what constitutes evidence-based practice and that stakeholders can rely on the conclusions presented. If they do not agree, this indicates that the conception or implementation of evidence-based practice differs so much between CHs that each program effectiveness rating offered should be treated with caution as a guide to better educational practice.
Specifically, this paper answers three main questions. First, how variable are CHs in the scientific standards they use to attribute effectiveness? To this end, we describe 12 CHs dealing with education interventions, illustrating how heterogeneous they are in their institutional features, in the program and study inclusion criteria they use, and in the causal identification criteria they espouse. The intent is to describe the landscape of CHs, so we do not offer a normative analysis of what constitutes an ideal clearinghouse or of differences in clearinghouse quality. The second question is: How well do different CHs converge on the same finding about program effectiveness? There are many reasons why perfect replication is impossible, including: (1) sampling and measurement errors that affect causal estimates even when the same research team evaluates two identical versions of the same program at the same time using the same random assignment design and outcome measures; (2) within- and between-study differences in the human populations, settings, and times examined as well as in the intervention and outcome particulars studied; and (3) the fact that there is not yet scientific consensus about the validity of some research procedures whose use varies over CHs. All this makes it impossible for researchers to know in advance how much consistency in program judgments to expect over CHs. The third section of this paper takes the results from the second section and asks why effectiveness ratings of the same program differ. Four explanations are explored: (1) CHs have different decision rules for including studies in a review; (2) they describe different variants of the same program; (3) they examine different outcomes; and (4) they differ in the standards of evidence they apply to single studies and/or to the research synthesis they conduct.
A Description of the 12 Education Clearinghouses
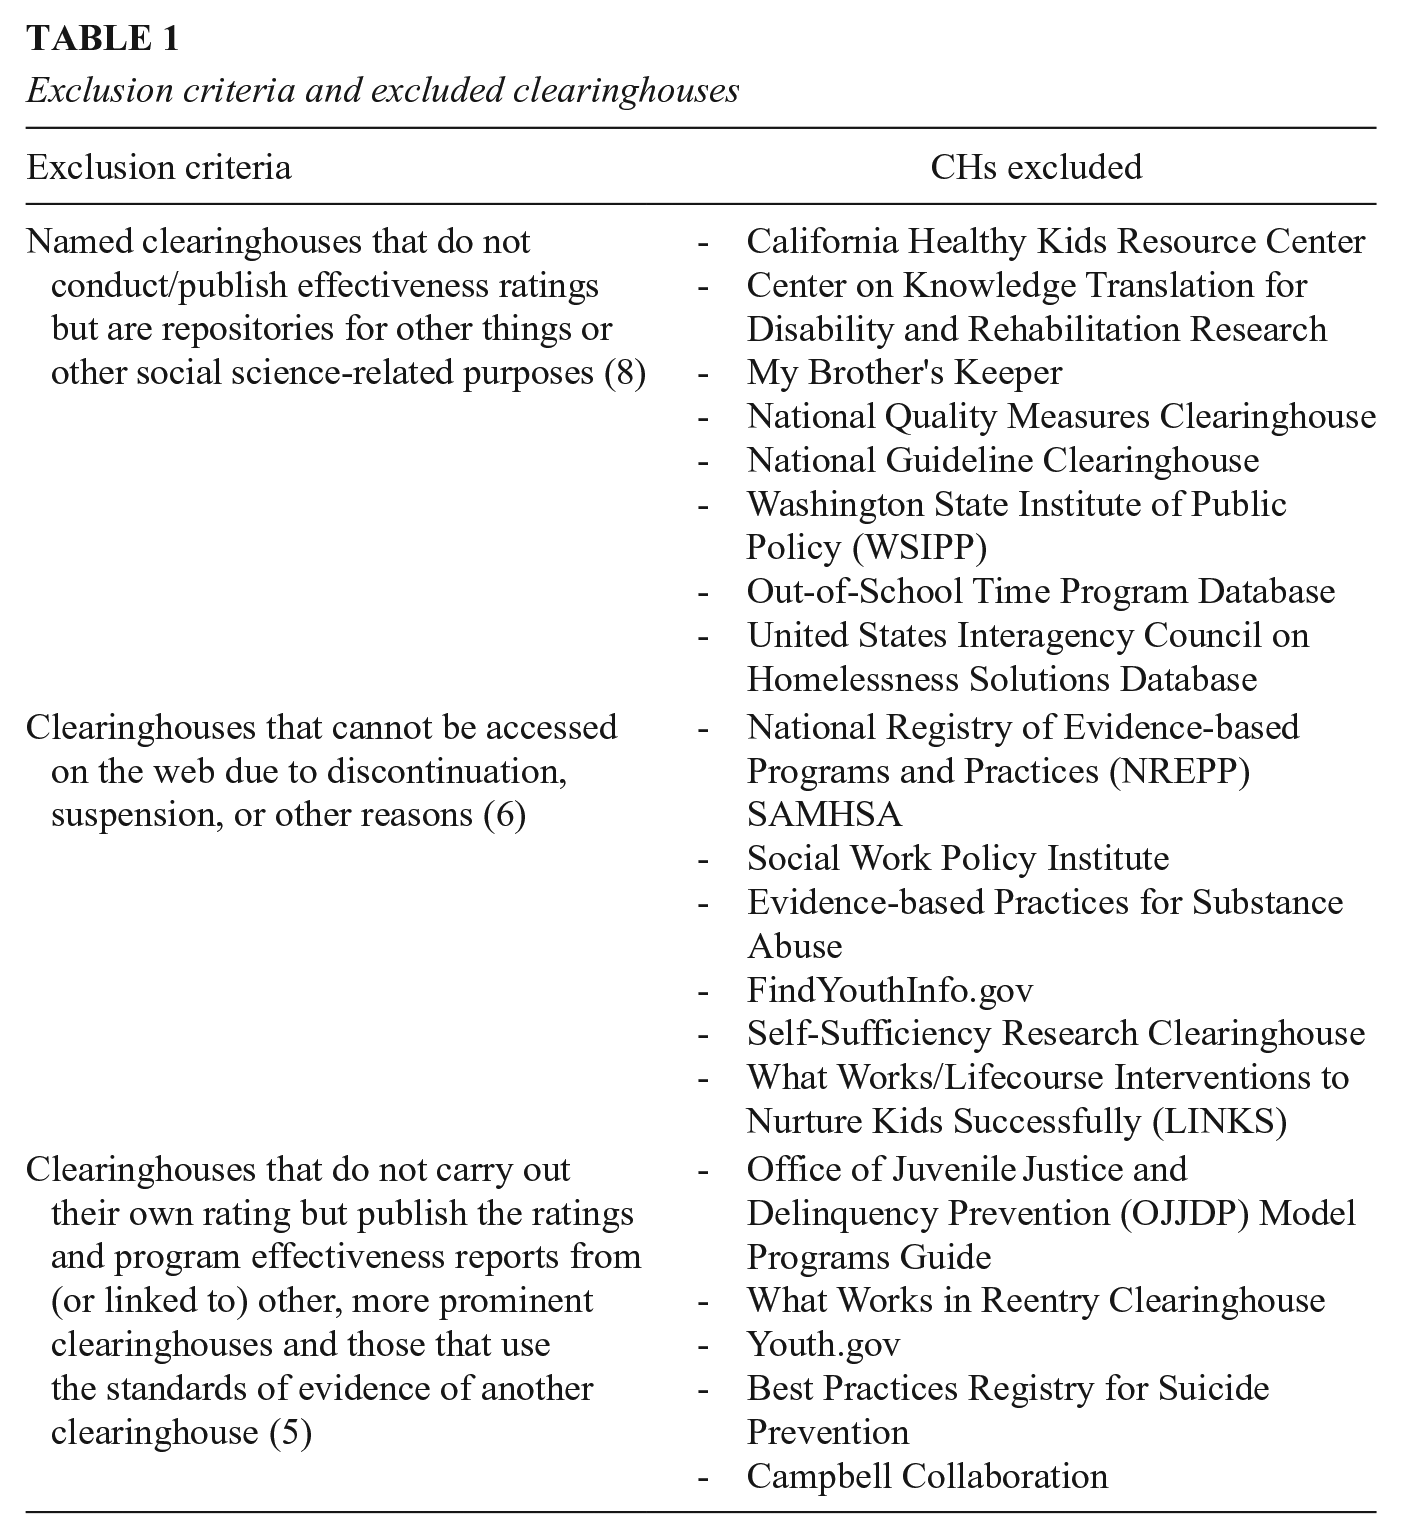
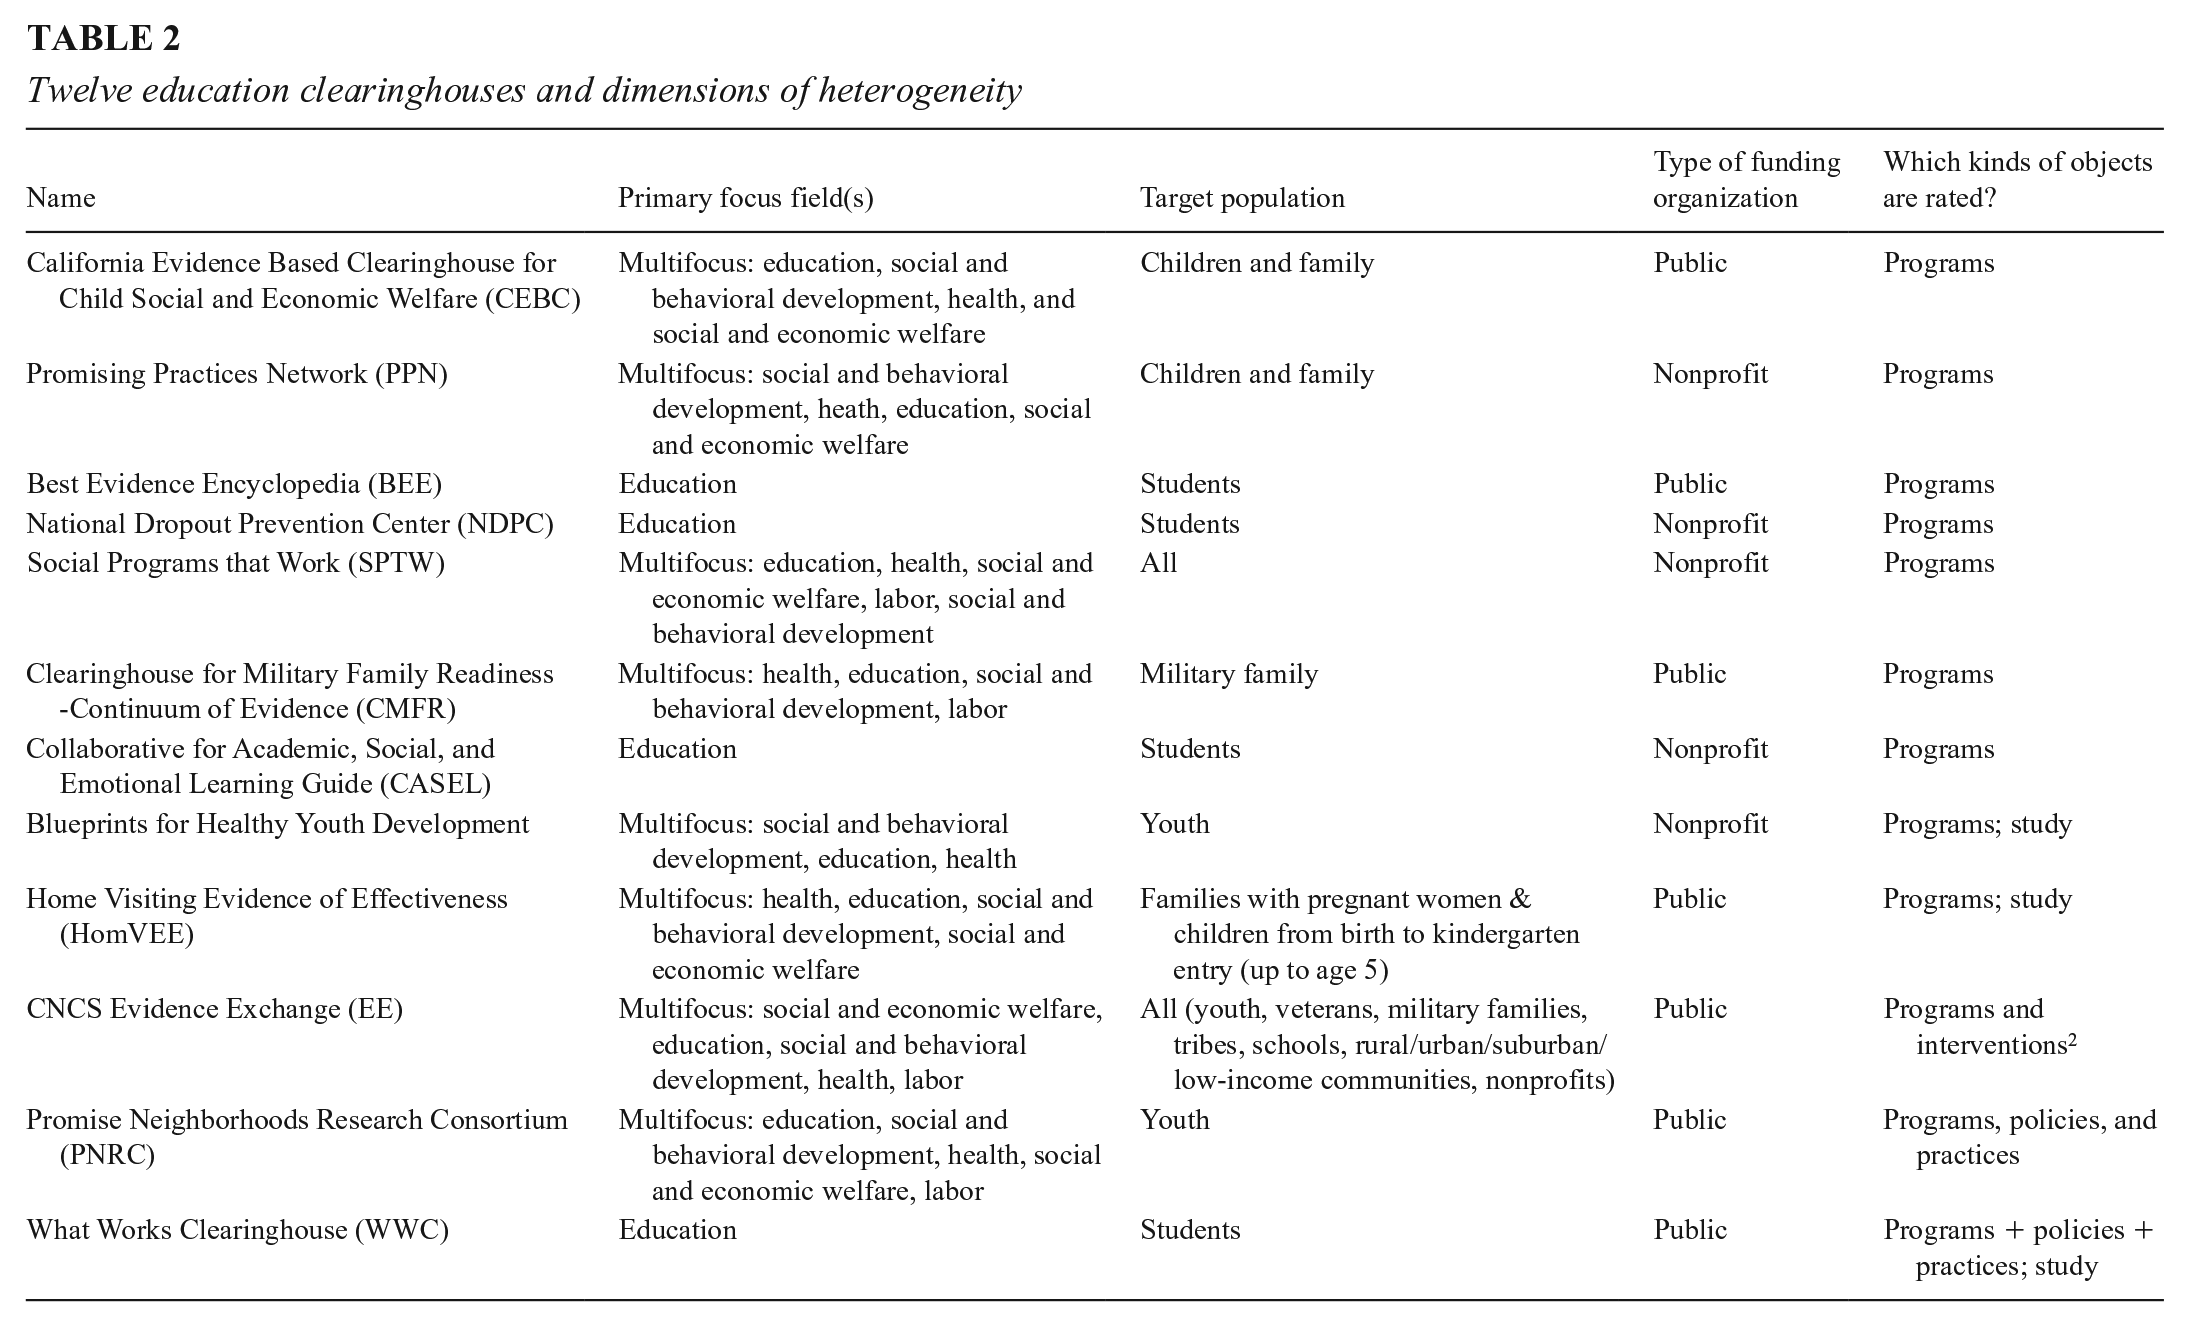
CHs are entities that review the research studies analyzing the effects of education programs in order to publish a rating of how effective the program is. We identified 43 CHs in the United States and United Kingdom after (1) consulting three repositories of study results (CNCS Evidence Exchange, 2016; Neuhoff et al., 2015; Pew-McArthur Results First Initiative, 2015), (2) conducting our own online search, and (3) soliciting suggestions from other researchers. We compared the resulting lists against each other to identify the unique CHs. From this list, we select those that conduct program effectiveness ratings, do not borrow their rating schemes from other CHs, and are accessible on the web. Nineteen CHs were excluded for these reasons as of May 2019, and these are listed in Table 1. Of the remaining 24, we selected those that focus on educational interventions from pre-K to college and that examine educational outcomes like academic achievement, school readiness, graduation, and preventing school-based social problems. Twelve such CHs were identified, and Table 2 lists some characteristics of them. Some CHs have long names, and we will henceforth refer to them by the acronyms in Table 1.
Exclusion criteria and excluded clearinghouses
Twelve education clearinghouses and dimensions of heterogeneity
Between June 2019 and August 2020, we collected and coded data from the 12 relevant CH websites, describing their target populations, policy foci, public/nonprofit or private funding source, the types of intervention evaluated, the study rating process, and the standards of evidence used for assessing both the quality of individual studies and overall program effectiveness. We also detailed each CH’s criteria for including programs in a review, and the methodological and background factors they emphasize when rating individual studies and the programs they evaluate.
Topic area: Of the 12 education CHs, four focus exclusively on education and eight include education along with other fields of enquiry. The thematic focus of CHs varies, including in breadth. For example, NDPC focuses on dropout prevention and CASEL on social and emotional learning, whereas CHs like the WWC and BEE cover a broader spectrum of outcomes and thus a broader range of interventions (Best Evidence Encyclopedia, n.d.; Collaborative for Academic, Social and Emotional Learning, 2012; National Dropout Prevention Center, n.d.; What Works Clearinghouse, 2017a).
Target population: Some CHs also specify target populations: four focus on students only, two on children and families, two on youth, and one each on military families and families with pregnant women. The remaining two do not specify a target group or set of targets.
Funding sources: Seven CHs are funded and supported either by a U.S. government department and its evaluation/research arm or by partnerships between government and a university. The remaining five are financed by foundations or by universities and research institutes that largely depend on government and foundation grants and contracts. CHs also vary in how well they are funded. We do not have reliable information about funding levels for each CH, but two senior officials at the U.S. Department of Education confirmed to us in writing in May 2021 that the department has spent more than $100M supporting WWC. Other CHs operate on much smaller budgets.
Object of rating: CHs also vary in the objects they rate. Seven CHs give effectiveness ratings only to educational programs that have a name or some other unique identifying label. The remaining CHs rate combinations of named programs, policies, and practices, sometimes with separate standards for each.
Program and Study Inclusion Criteria
Most CHs publish explicit requirements for program inclusion, but resource and other limitations may determine how extensive program and study searches can be, how detailed each study review can be, and how often a program review can be updated. Consequently, CHs vary not just in the programs they examine but also in the sample of studies they analyze for any one program. Nine CHs describe their process for determining which programs to include. To illustrate the range, the California Evidence-Based Clearinghouse (CEBC) employs a combination of expert advice and extensive literature search; the What Works Clearinghouse (WWC) and associated experts identify relevant programs on the basis of a review protocol that outlines the process and criteria for a systematic review; and the Corporation for National and Community Service (CNCS) Evidence Exchange reviews only programs and interventions that CNCS has itself funded. Each CH also targets specific outcomes or interventions related to their organizational mandate so that, for example, the Home Visiting Evidence of Effectiveness (HomVEE) focuses only on home visiting models designed to improve child development and school readiness (California Evidence-Based Clearinghouse, n.d.a; CNCS Evidence Exchange, n.d.; Home Visiting Evidence of Effectiveness, 2020).
CHs also vary in study entry requirements relating to research design, publication date, geographic setting, sample size, outcome measures, target population, language used, and whether a study is peer-reviewed or not. The Clearinghouse for Military Family Readiness (CMFR) and CEBC include only peer-reviewed studies, but many other CHs do not. HomVEE’s search is limited to studies conducted after 1989, whereas the WWC’s cutoff is 20 years prior to the review start date. CHs may also specify preferred study sample sizes—HomVEE prefers studies with more than 250 individual participants. The WWC’s topic-specific review protocol specifies the set of outcome domains around which the review is organized; the study focus (impact only); sample characteristics (e.g., age, gender, grades and English learner status); a publication lag period of 20 years; study settings (schools predominantly); intervention characteristics (vary by topic); study report language (English only); and study designs limited to randomized control trials (RCTs), regression-discontinuity designs (RDDs), single case designs (SCDs), and quasi-experimental designs (QEDs). Inevitably, CHs will vary in how many, and which, studies are approved to contribute to their review of an intervention.
Causal Identification and Estimation
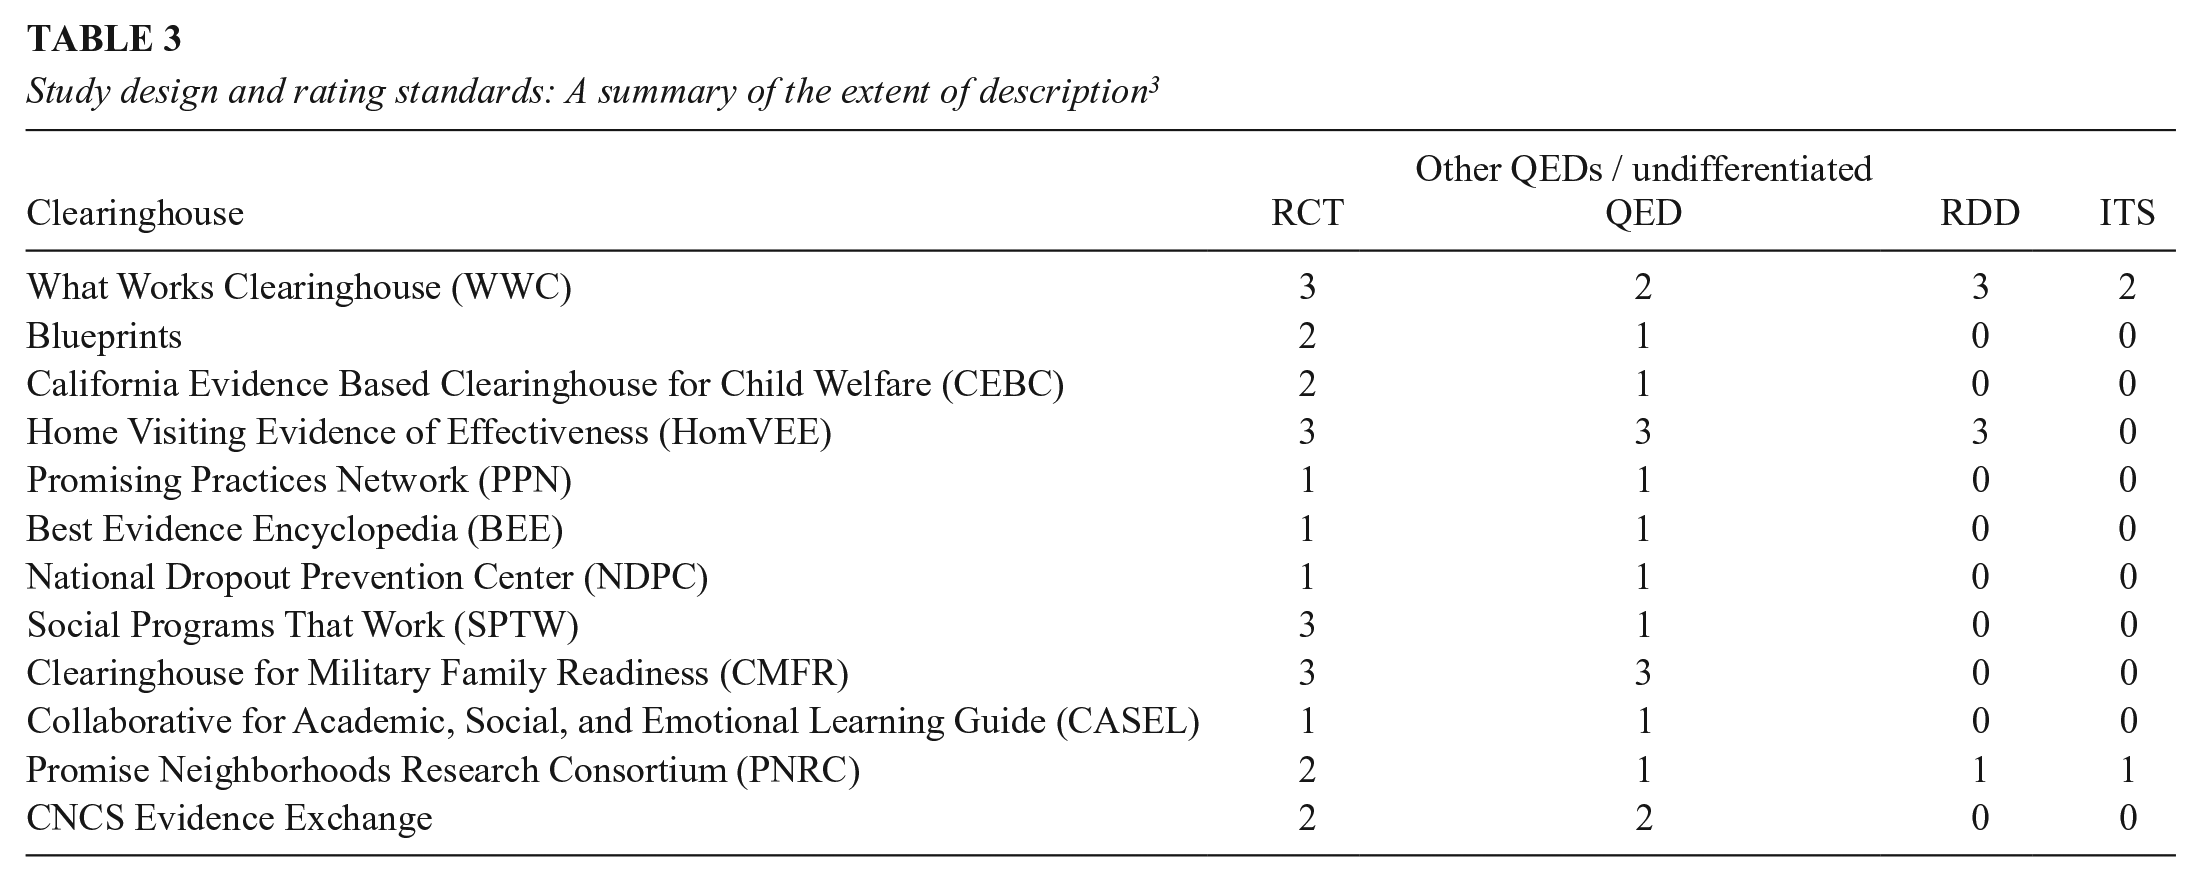
CHs test whether an intervention affects a designated outcome, and so they must specify their causal design and analysis preferences and outline how they deal with the reality that most single causal tests are embedded within person, setting, time, intervention, and outcome variants that are so local that they preclude easy generalization. Table 3 outlines the causal designs listed across all 12 CHs. We rated each CH zero if its requirements do not mention a given experimental design type; one if it is only briefly mentioned and no design implementation standards are given; two if the design is described, but no design-specific implementation standards are provided; and three if the CH details design-specific standards for causal inference and quality implementation. It is clear that: (1) each CH invokes RCTs as the preferred design; (2) each treats the implementation and analysis more comprehensively for RCTs than any QED; (3) all CHs include a generic QED design characterized by initially nonequivalent treatment and comparison groups; and (4) two more specific QED types are intermittently examined—RDD and interrupted time series (ITS).
Study design and rating standards: A summary of the extent of description 3
RCT implementation and quality standards: Table 3 also shows that CHs vary in how they assess RCT study quality. Most use standard terminology to describe attrition patterns and baseline group equivalence tests, but they vary in the implementation details emphasized and how the integrity of the RCT is tested. Five CHs require random assignment be conducted and analyzed at the appropriate level, but only the WWC provides an in-depth description of cluster-level random assignment. Three CHs (Blueprints for Healthy Youth Development, Social Programs That Work [SPTW], and Promising Neighborhoods Research Consortium [PNRC]) require intent-to-treat (ITT) analysis, whereas WWC also allows calculating Complier Average Causal Effects (CACE) under specific conditions. Treatment-related attrition is important for RCT implementation quality, and seven CHs have explicit guidelines for attrition, though HomVEE and Collaborative for Academic, Social and Emotional Learning (CASEL) follow WWC guidelines in this. The WWC guidelines specify combinations of overall and differential attrition. If the expected bias created by attrition is under the tolerable level (0.05 SD or less), then the highest study rating can be achieved. Greater attrition prevents this highest study rating but lesser positive ratings are still possible based on the size of the group baseline difference. If this group baseline difference is less than 0.05 standard deviations, then a positive study rating is possible and no statistical adjustment tests are required; if it is between 0.05 and 0.25 SD, then a statistical adjustment for group nonequivalence is required; and if it is over 0.25 SD, the study cannot meet WWC quality standards (What Works Clearinghouse, 2017a). Other CHs handle attrition differently. CMFR and SPTW accept overall attrition under 20 percent; Blueprints requires statistical examination of baseline differences in outcomes and sociodemographic characteristics, comparing both those who dropped out of the study with those who stayed and also those who dropped out from the treatment group with those who dropped out from the control group (Blueprints for Healthy Youth Development, n.d.; Clearinghouse for Military Family Readiness n.d.; Social Programs That Work, n.d.).
CHs also vary in how they test for group equivalence by posttest time. Some check the equivalence of demographic variables in addition to the pretest values of the outcome—for example, HomVEE requires baseline equivalence for traditional demographic variables only, Blueprints adds that the baseline value of the outcome must also not differ, and the WWC’s topic-specific review protocol lists the specific set of variables for which baseline equivalence is required. All CHs agree on assigning superior value to well-implemented RCTs, but they differ in how they test that an RCT is implemented well enough to deserve the site’s highest study quality ranking.
Standards for QEDs: CHs treat QEDs even more variably than RCTs. All CHs consider a generic class of QED with selection bias due to recruiting the treatment groups from different populations, engendering the need to justify how the choice of comparison groups and of data analysis methods might “somehow” eliminate selection bias. Only HomVEE and CMFR have distinct standards for appraising the quality of such studies. HomVEE has separate standards for matched comparison and single case designs, and CMFR applies different standards to matched and statistically controlled comparison group designs. However, all CHs except CMFR agree that the maximum rating for such QEDs should be lower than for RCTs. As for more specific QED designs, only WWC and PNRC explicitly mention ITS studies. They can only meet WWC criteria if baseline equivalence is established for multiple time periods before treatment, whereas PNRC provides a more general guideline that favors ITS studies with long but not necessarily overlapping baselines and sizable effects (Clearinghouse for Military Family Readiness, n.d.; Flay et. al., 2005; Home Visiting Evidence of Effectiveness, 2020; Promise Neighborhoods Research Consortium, n.d.; What Works Clearinghouse, 2017a).
As for RDD, three CHs explicitly mention it, but only WWC and HomVEE provide a detailed description of its implementation and analysis standards. Each allows RDD studies to attain its most favorable rating level if evidence is convincing about the integrity of the forcing variable, the continuity of the relationship between the outcome and forcing variable, and the viability of whatever functional form or bandwidth assumptions are made. The main conclusion is that CHs see only RCTs and a generic QED as broadly relevant to causal identification; they assign higher value to RCTs than to any QED other than RDD; and they do not generally see any version of ITS, or even RDD, as especially important for practical causal identification. The main exception here is the WWC that considers both quasi-experimental designs as important for causal inference and also lays down standards for each of them.
Estimate-conditioning factors: Many factors can condition research-based conclusions about effectiveness. One is that effects replicate, and seven CHs invoke a replication standard. CEBC and HomVEE consider replication demonstrated if similar results are achieved in two nonoverlapping samples, whereas PNRC, SPTW, and CNCS Evidence Exchange emphasize multisite studies and effects that replicate across locations and cultural contexts. To award a program its highest rating, Blueprints and CMFR require at least one independent replication conducted by an entity external of the program. Other CHs also assign higher ratings to independent evaluations (National Dropout Prevention Centre [NDPC], CNCS Evidence Exchange), defining this in terms of researcher independence from program administrators and implementers. However, Blueprints further requires that the entities conducting the replication have no financial stake in the program, whereas CMFR requires that the replications must entail only minor adaptations of program modalities and involve no major changes in the sample studied.
CHs also vary in the minimal post-intervention follow-up period within which effects must be demonstrated. Four CHs specify such a period, but three require it to attain high ratings. The most frequent follow-up period is 12 months or more after the intervention has ceased, but a period between 6 and 12 months is sometimes accepted, albeit with a lower study quality rating. CHs also differ in how they deal with the size, statistical significance, and direction of effects. Five websites report only on programs with positive effects (Blueprints, Promising Practices Network [PPN], BEE, CASEL and SPTW). Three CHs (e.g., WWC, CMFR, CEBC) distinguish between ineffective programs versus those with indeterminate effects. And while all invoke the statistical significance of causal findings, many also require minimal effect sizes—PPN requires a difference of at least 0.25 SD for its highest rating, and BEE requires an impact of at least 0.20 SD (Best Evidence Encyclopedia, n.d.; Blueprints, n.d.; California Evidence-Based Clearinghouse, n.d.b; Coalition for Evidence-Based Policy, 2010; Collaborative for Academic, Social and Emotional Learning; 2012; Kilburn et. al., 2014; What Works Clearinghouse, 2017b).
The estimate-conditioning factors considered above contribute to an intervention’s ultimate effectiveness rating along with the criteria for causal identification and estimation. The result is that two CHs can consider the very same causal studies but still differ in how evidence-based they judge a program to be. One might claim it is evidence-based due to a single statistically significant impact, whereas another might require the same effect to attain a specific size, to persist for over a year after treatment, and to be multiply and independently replicated. Obviously, hurdles of quite different height exist for claiming program success over and above the traditional issues of causal identification and estimation that have been linked to RCTs and QEDs.
Comparing evidence standards across CHs: To examine the joint influence of all these factors, we now describe four CHs that vary in the ways depicted in Table 4. WWC analyzes and reports results for educational interventions, but it does so separately for each outcome domain considered. So, no intervention rating is aggregated over the different outcomes considered. The three other CHs—Blueprints, NDPC, and CEBC—explicitly assign values to programs based on one or more than one outcome, though they allow careful readers to learn about outcome-specific impacts on the websites. Although each CH makes program judgments that correspond to “no discernible positive effects” and to “promising effects,” they differ in how interventions better than promising are labelled. WWC uses “positive” and “potentially positive”; Blueprints uses “model programs” and “model plus programs”—a distinction that largely depends on fully independent replication. NDPC uses “strong evidence of effectiveness,” and CEBC “well supported by research evidence.” The evidence for these summary judgments comes from individual studies and/or syntheses thereof, but only WWC and Blueprints provide explicit ratings of each study. WWC designates each single study as “meeting WWC evidence standards without reservations,” or meeting them “with reservations,” or “not meeting” them. These single study ratings then determine how much weight each study is given in the final outcome-specific intervention appraisal. Blueprints designates each study as “certified” or not, depending on how well it meets the site’s criteria of methodological quality. CEBC provides a summary of each study, but no rating of each; and NDPC provides neither a rating nor summary of the studies it bases its recommendations on.
Diversity in some study and program attributes: Comparison of WWC, Blueprints, NDPC, and CEBC
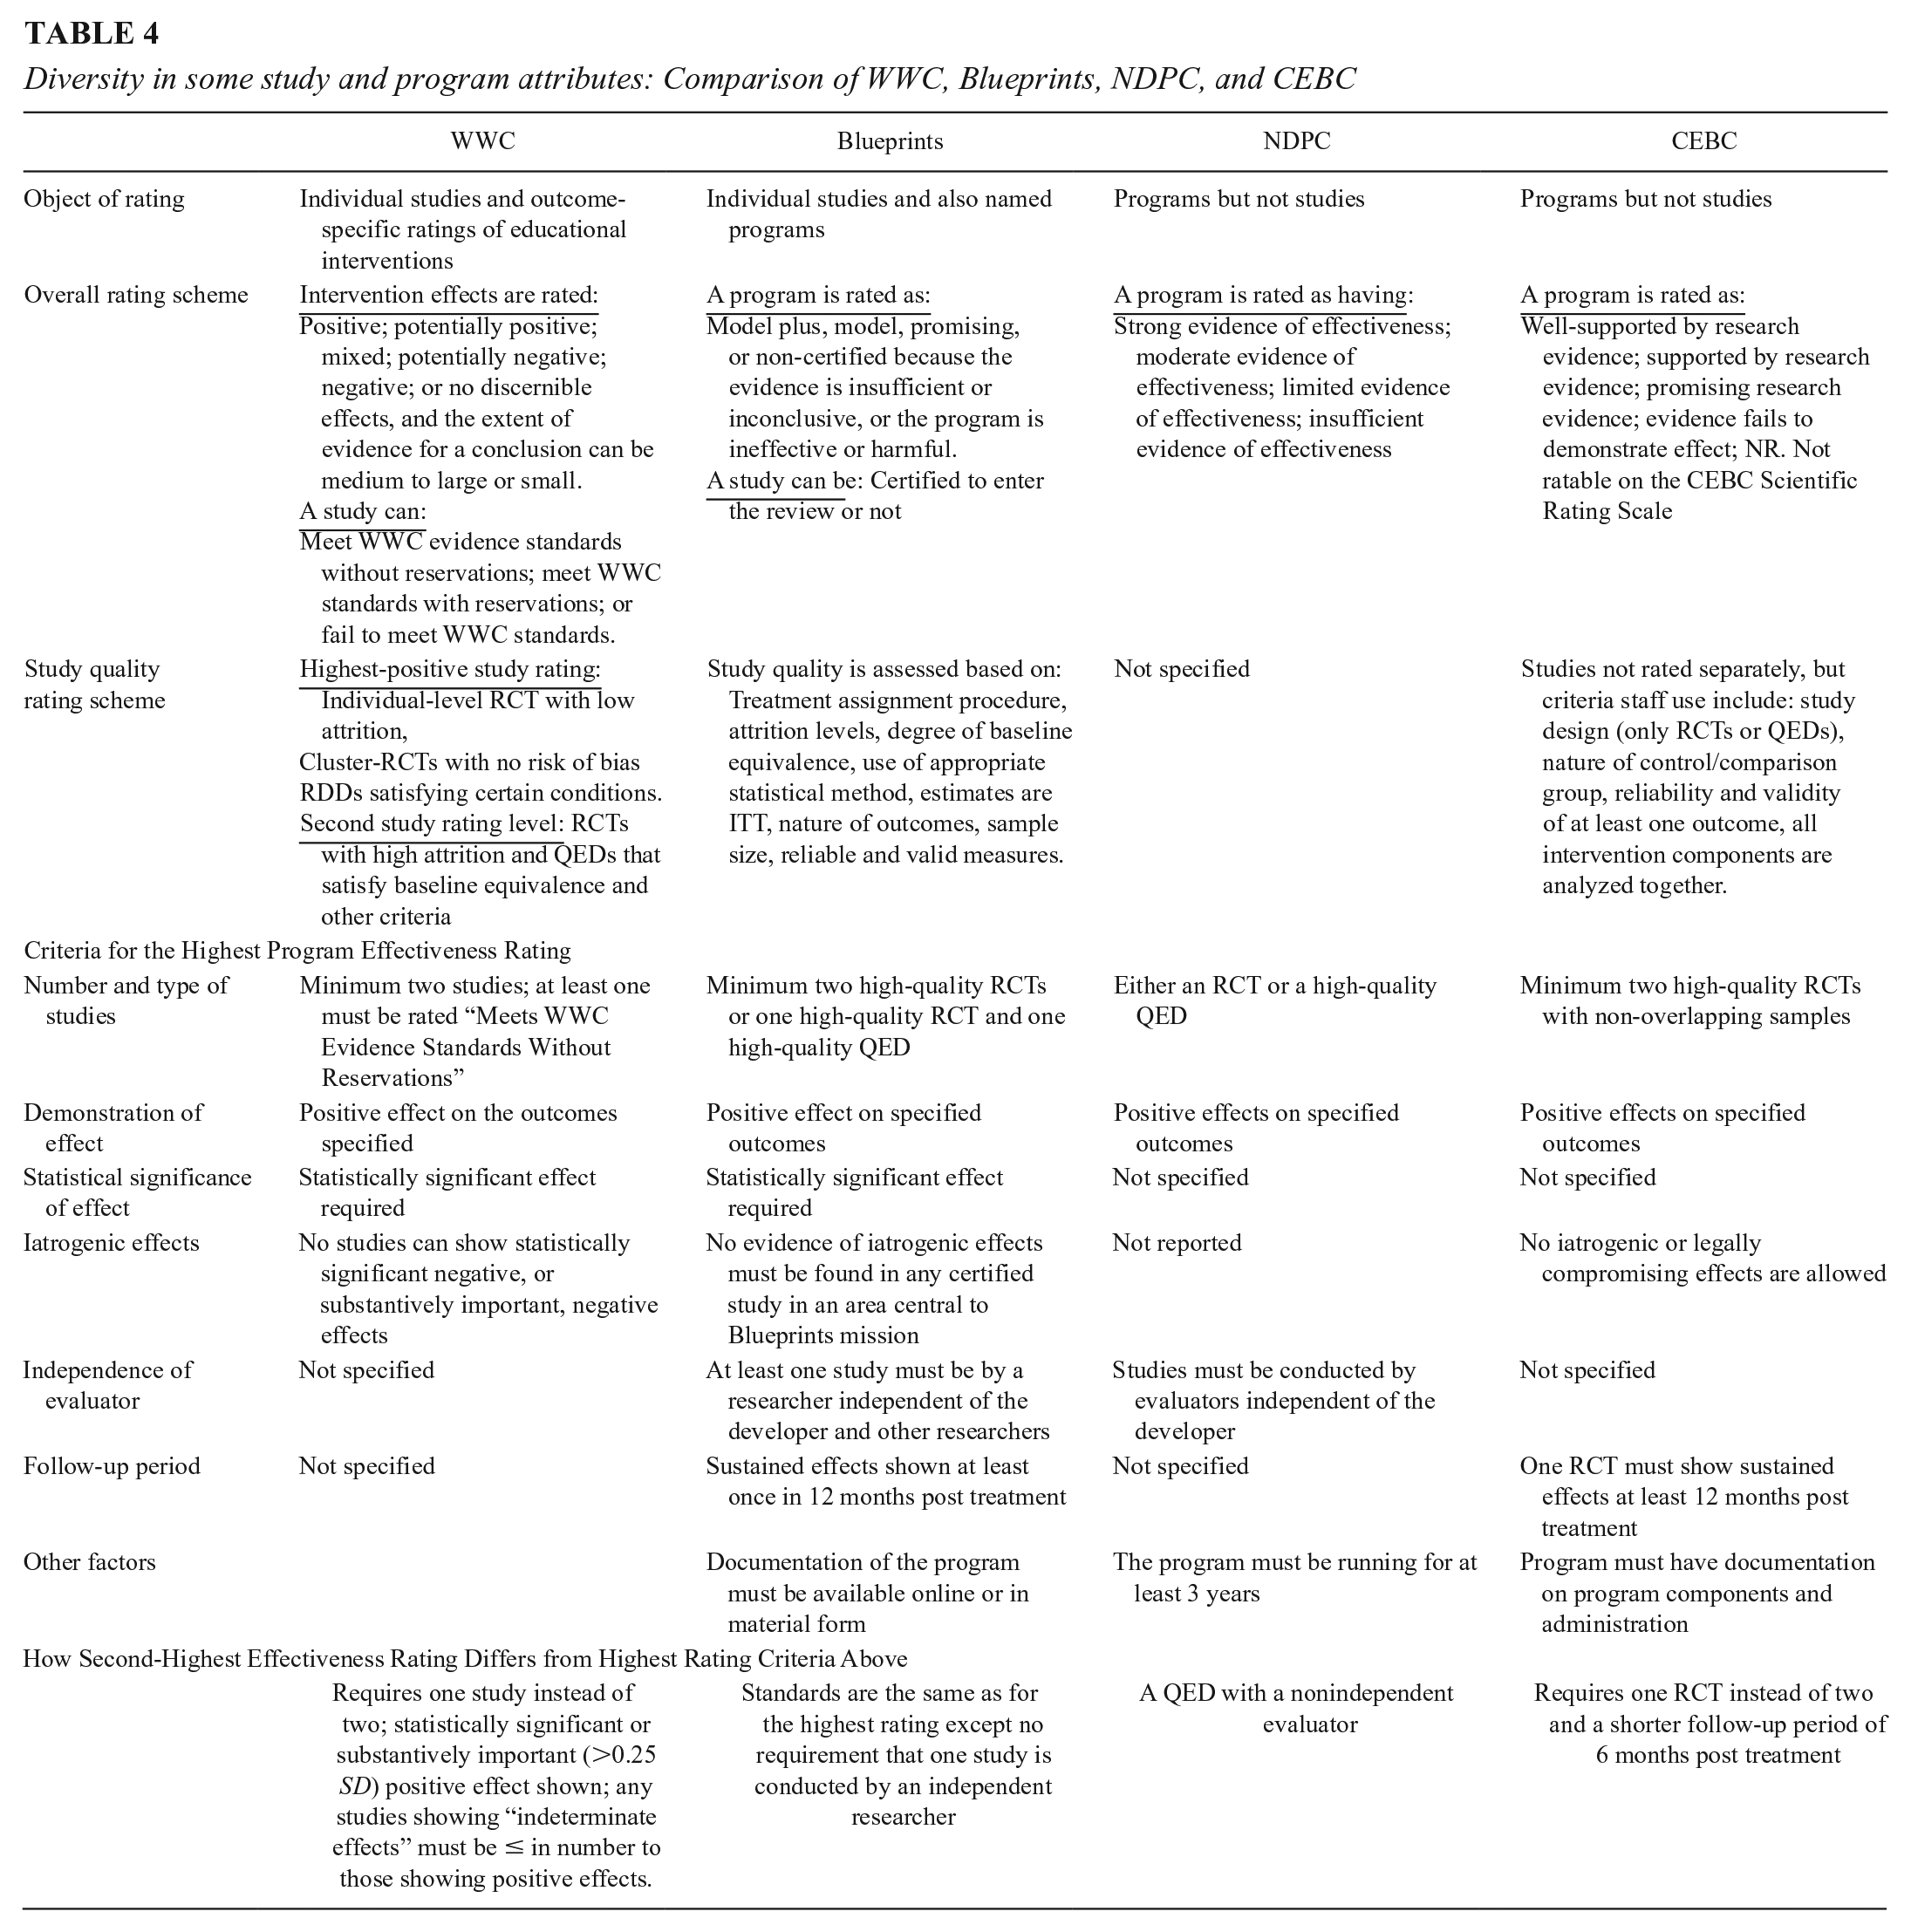
To get the highest effectiveness rating, WWC requires two studies with statistically significant impacts on specified outcomes, and one of these studies must meet WWC’s standards without reservations. No requirements are made about the size of the average effect, or the effect still being manifest a year after treatment has ceased, or researchers being independent of the program developers or being independent of each other over studies. For its Model Plus designation, Blueprints also stipulates a minimum of two studies that have statistically significant, positive results that meet its implementation and analysis requirements. One must be an RCT, but the other can be a QED. Blueprints further requires the effect to be demonstrated over 12 months and the various researcher teams be independent of the developer and each other. NDPC needs only one study with positive results that can be either an RCT or a high-quality QED as judged by reviewers. However, the program in question cannot be a pilot; it must have been in the field at least 3 years. CEBC’s highest rating requires positive results from at least two well-implemented RCT studies, one of which must show persisting effects for at least 12 months after the end of treatment. It seems, then, that Blueprints and CEBC have the highest standards, mostly due to their stipulation of the necessity of long-term effects (and independent replication in Blueprint’s case). NDPC has the lowest standards in requiring a single study that need not be an RCT or have sustained effects over time, or be independently replicated, though it rules out all pilot programs. At issue here are not the standards traditionally associated with causal identification and estimation; rather, the standards speak to the context in which any causal demonstration, or set of demonstrations, is inevitably embedded.
How Consistent Are Clearinghouse Ratings of the Same Program?
Introduction and Method
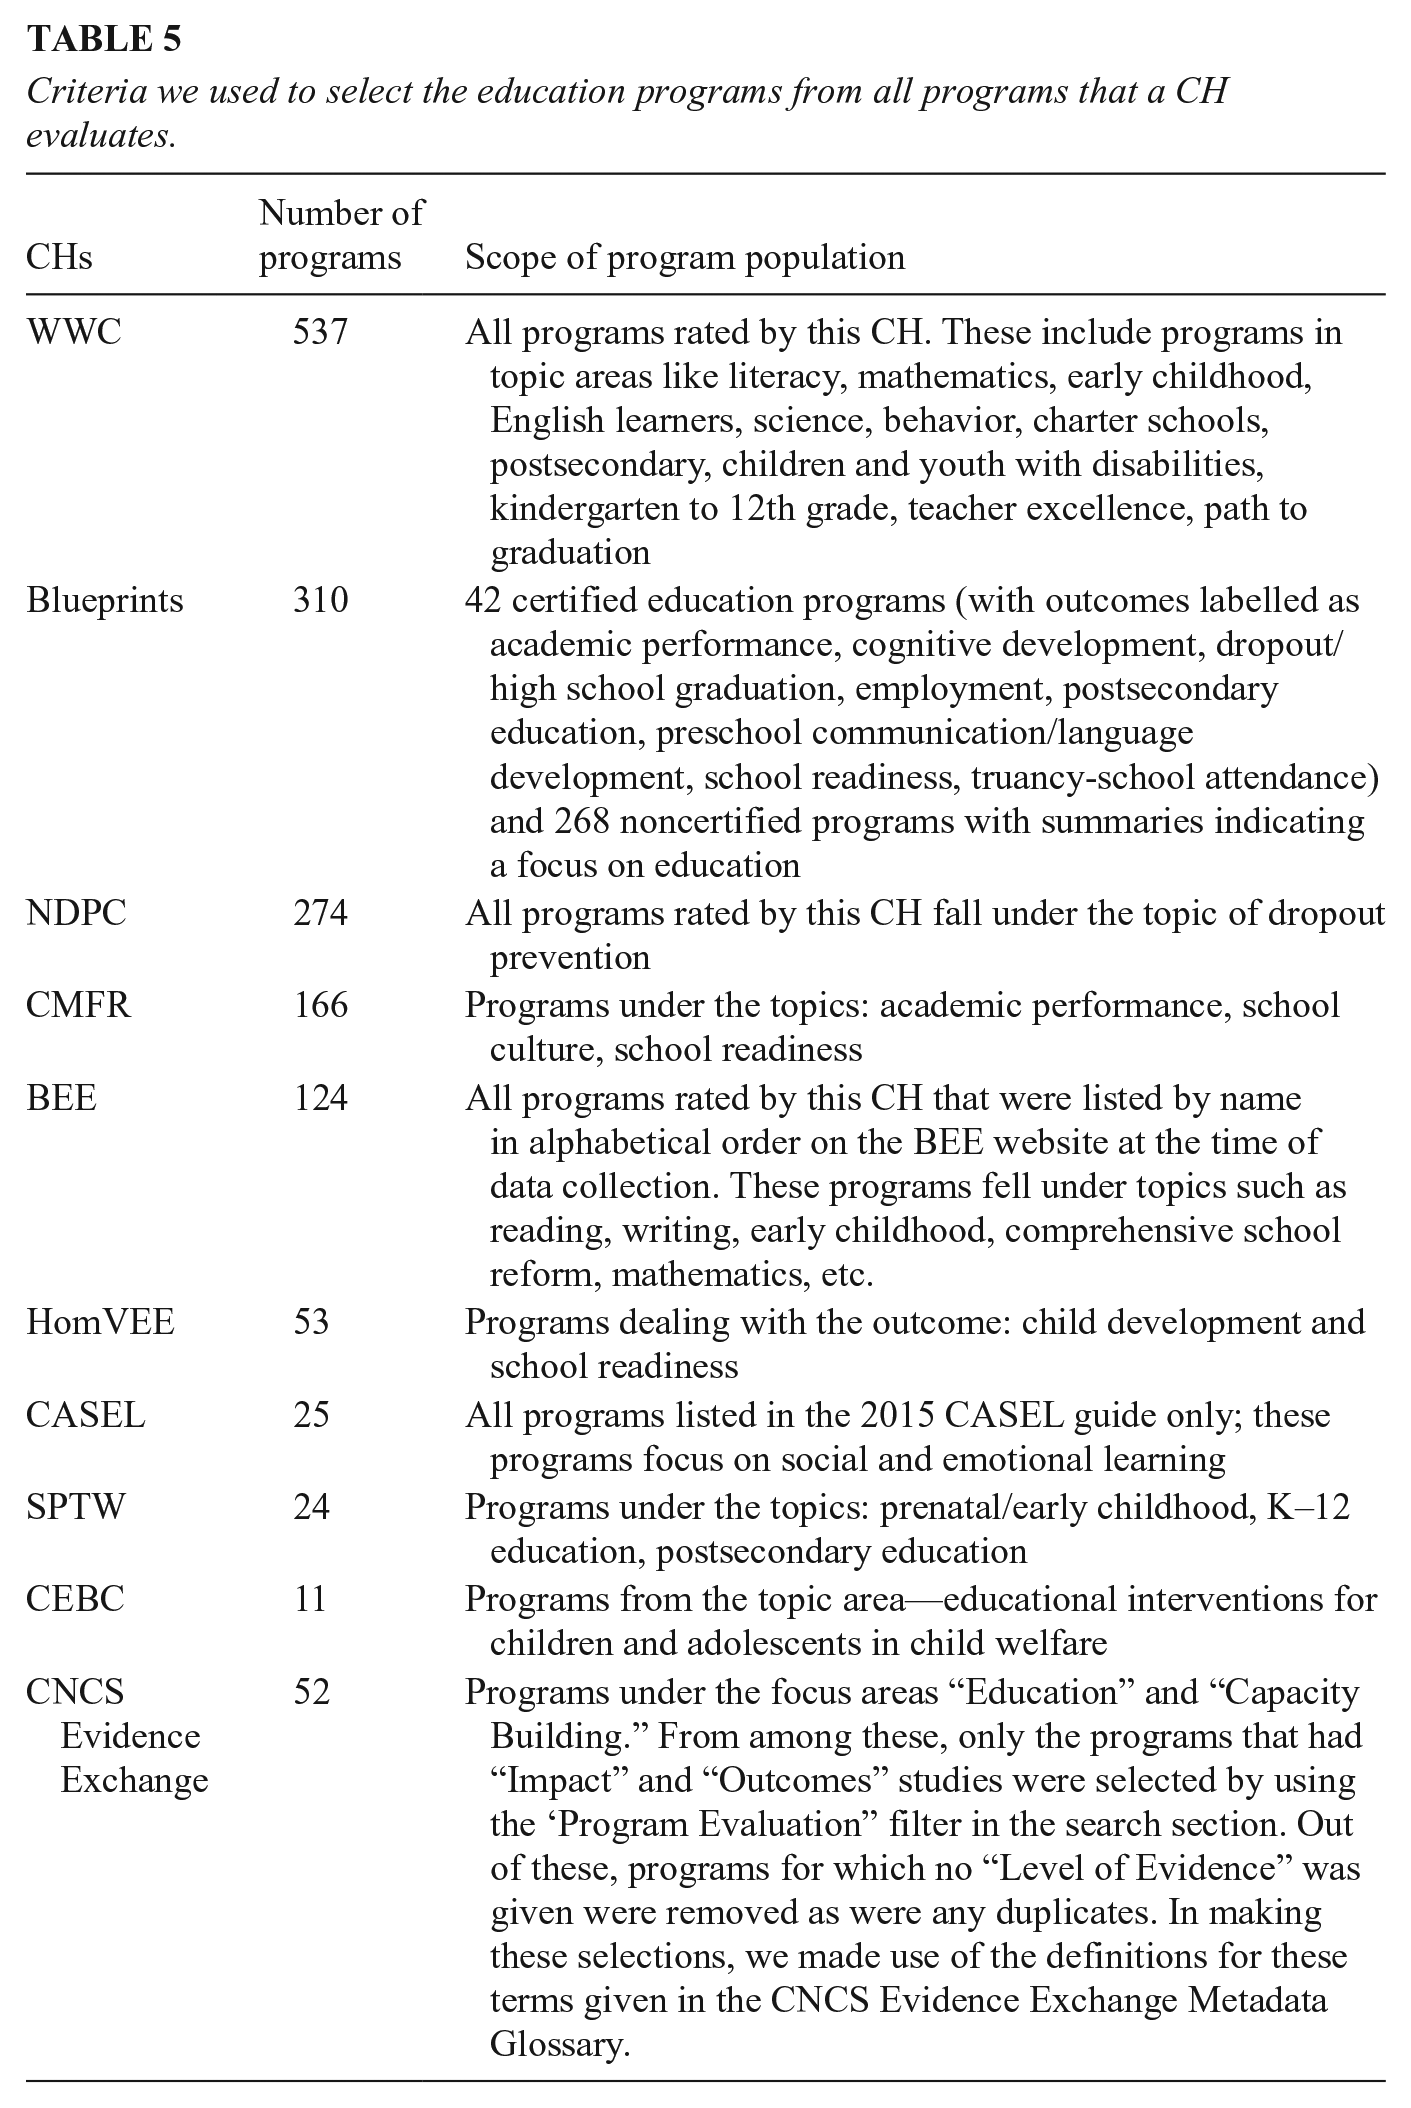
We sought to identify every educational intervention rated across the 12 CHs. This is needed to describe which programs are rated by more than one CH and then to estimate how consistent evidence-based judgements about multiply evaluated programs/interventions are. Such an analysis is only possible with CHs that provide a summary rating of program effectiveness, so we exclude PNRC as it does not conduct tier-wise ratings of programs for effectiveness and PPN since it ceased functioning by mid-2020, though the RAND Corporation website still makes some of its material available. Seventeen programs that were under review at Blueprints and were not rated by any other CH were also dropped from the final sample (Blueprints for Healthy Youth Development, n.d.; Kilburn et. al., 2014; Promise Neighborhoods Research Consortium, n.d.). Table 5 lists the criteria and process used to compile this list of programs from these CHs. The resulting CH sample consists of 1,359 education programs from 10 CHs. Some classification issues mildly complicate the analysis. As the case studies later make clear, some CHs use the same core name to refer to a somewhat different set of program components due to program modifications that take place over time. Also, the same program might be listed under different names in different CHs. Estimating this last requires an in-depth examination of 1,300+ programs, but we judge such misidentification to be rare in light of the proprietary interest program developers have in attaching a unique brand name to a given intervention.
Criteria we used to select the education programs from all programs that a CH evaluates.
To estimate the consistency of program ratings requires rescaling the information from each CH due to difference in the rating scales used. We collapse their summary judgments onto a three-point scale, scoring as 1 (= recommended) any rating that explicitly judges a program to be effective based on the evidence reviewed. For some CHs, this means collapsing different categories of effectiveness. Thus, we assign a score of 1 to Blueprints’s Model and Model Plus ratings and do the same with the CBEC judgments of: Well-supported by Research Evidence and Supported by Research Evidence. We score as 2 (= promising) all ratings where some positive study results are judged to be relevant and methodologically justified, but where the design or results cast plausible doubt on a clear judgment of effectiveness. Many CHs invoke their own promising category, and we use that. Finally, we score as 3 (= not recommended) all ratings indicating inconclusive or negative effects.
For any rated program, the overall effectiveness judgment is clear when CHs agree on a score of 1, 2, or 3. Also clear is when a program achieves ratings of 1 and 3, indicating diametrically opposed CH judgments about how evidence-based a program is. Differences between 1 and 2 are somewhat less clear. While each judgment is positive, CHs differ in how certain they judge the positive evidence base to be. Evidence base here refers to the set of studies used to make program effectiveness judgments. Differences between 2 and 3 are especially problematic because, on the one hand, some promising information about a program is available, but on the other hand, there are some null or negative findings and never a positive claim of 1. We estimate the consistency in evidence-based judgments across each CH rating pair that judges the same program. When just two CHs rate a program, only one rating pair is possible; but when four do, six (partially dependent) rating pairs are possible. We analyze the percentage of such pairs that are (a) fully consistent because they have the same score—1, 2, or 3—though we analyze each of these separately; (b) moderately consistent, with scores of 1 and 2; (c) moderately inconsistent, with scores of 2 and 3; and (d) fully inconsistent with scores of 1 and 3.
Results
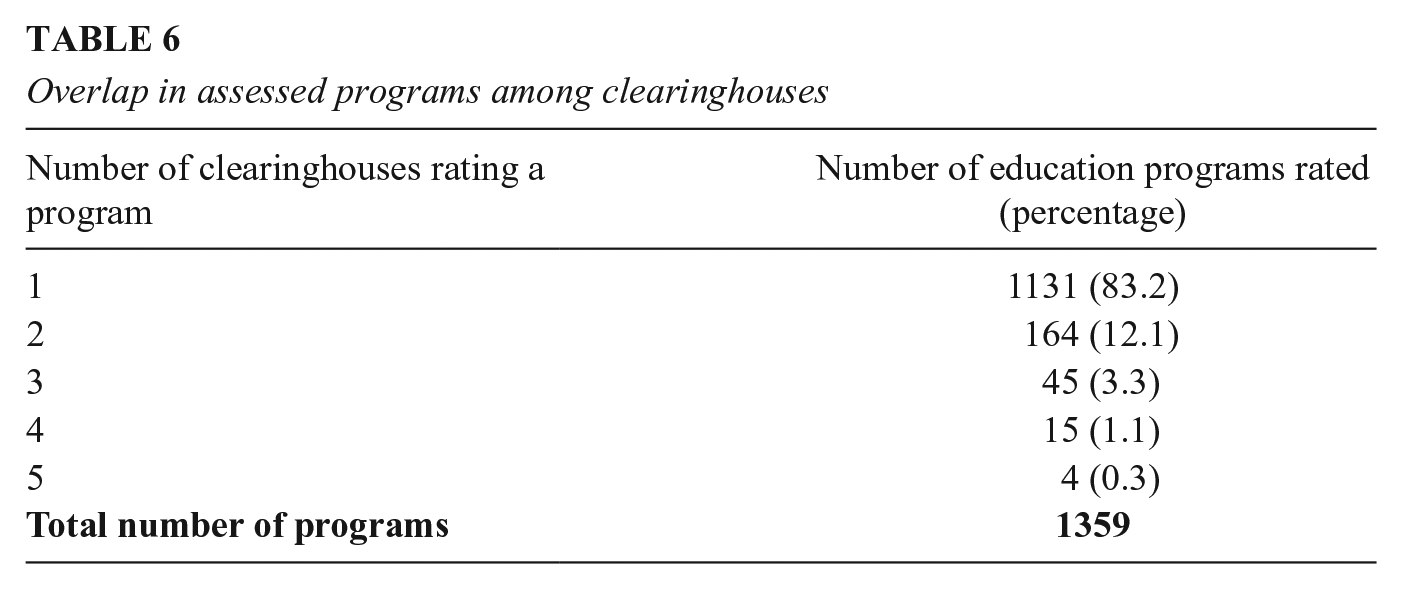
How many CHs evaluate a given program? Table 6 shows how many CHs rate a specific education program; 83% of programs are rated by a single CH, 12% by two, 3.3% by three, and fewer than 2% are rated by four or five CHs. No program is rated by more than five CHs. Thus, only 17 percent of programs have multiply replicated judgments about how evidence-based they are that CH consumers can assess. However, the names of these programs strongly suggest that they are among the better known in education, suggesting that CH users seeking multiply replicated information are most likely to achieve this for more established programs, some of which we later discuss as case studies.
Overlap in assessed programs among clearinghouses
How consistent are the between-CH ratings? Table 7 shows the percentage of programs rated effective (i.e., ratings of either recommended or promising). When two CHs rate the same program (n = 164 programs), approximately 18% of the programs in question are rated as effective because either both CH scores are 1 or both are 2 or the scores are 1 and 2 with no 3s. The remaining 82% of programs are not rated as effective because each gives a 3 rating, or the CH scores are moderately inconsistent (2 and 3), or they are fully inconsistent (1 and 3).
Percentage of effective and not effective programs when rated by two or more clearinghouses
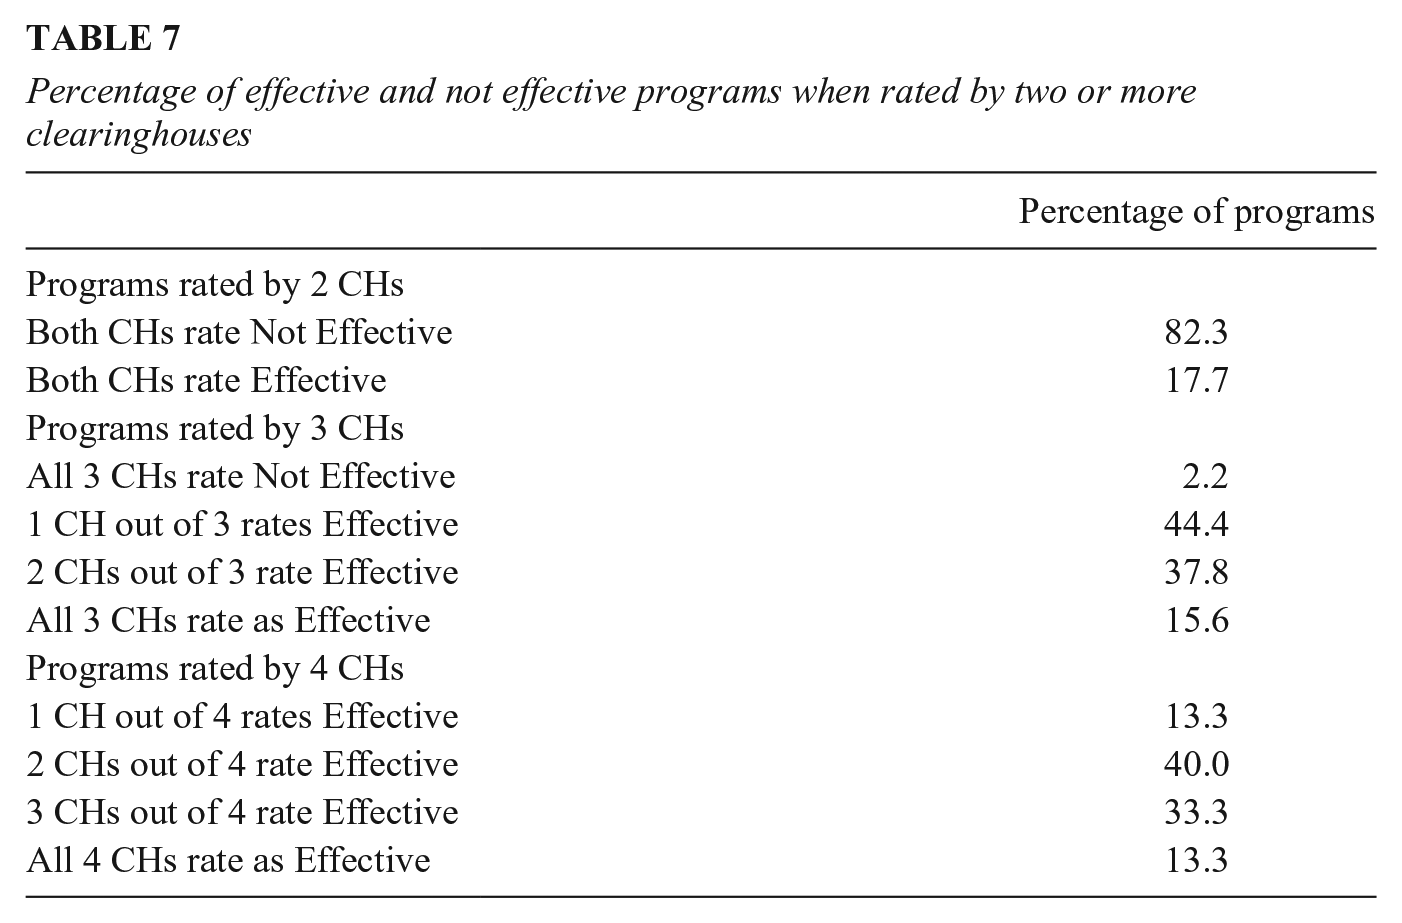
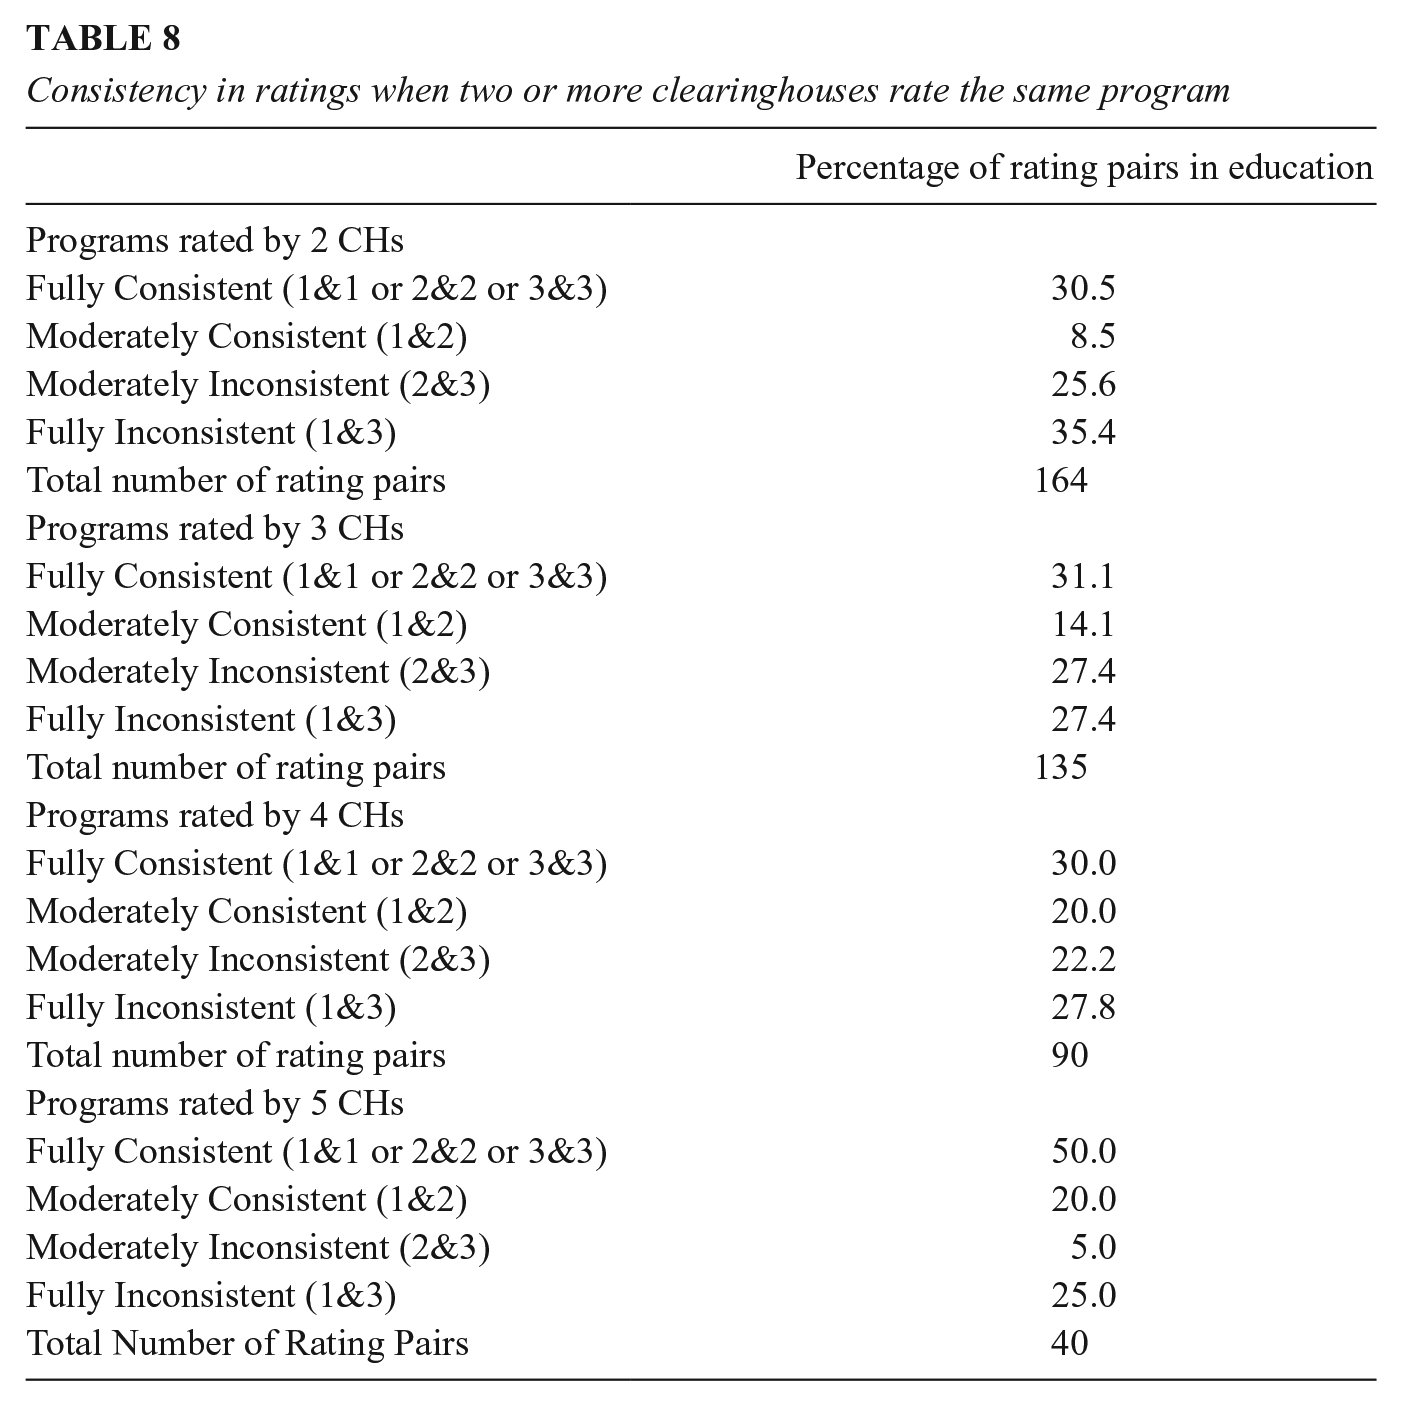
Table 8 displays additional findings. For programs rated by four CHs (n = 15 programs), full consistency among rating pairs stands at 30%, whether for scores of 1, 2, or 3. Only for the very few programs rated by 5 CHs (n = 4 programs) is this level higher, at 50%. However, Figure 1 shows that most of these agreements for programs rated by two CHs are about a program not being recommended (a score of 3), next most for promising (2), and least of all for the recommended and most-desired rating of all 1s. A conscientious consumer of multiple CHs will find that they most agree on the programs not worth adopting and least agree on those with a consistently positive evidence base. Figure 1 also reveals that when two CHs rate the same program the most frequent disagreement is full inconsistency (scores of 1 and 3), and this frequent disagreement is also seen over different numbers of CHs. Maximal disagreement is 35.4% for programs rated twice, 27.4% for programs with three CH ratings, 27.8% for programs with four CH ratings, and 25% for programs with five ratings. So, stakeholders browsing different CHs will encounter some starkly conflicting judgments of a program’s worth. For about a third of all programs evaluated more than once they will find one CH concluding that a program is recommended whereas another concludes that it is not even promising.
Consistency in ratings when two or more clearinghouses rate the same program
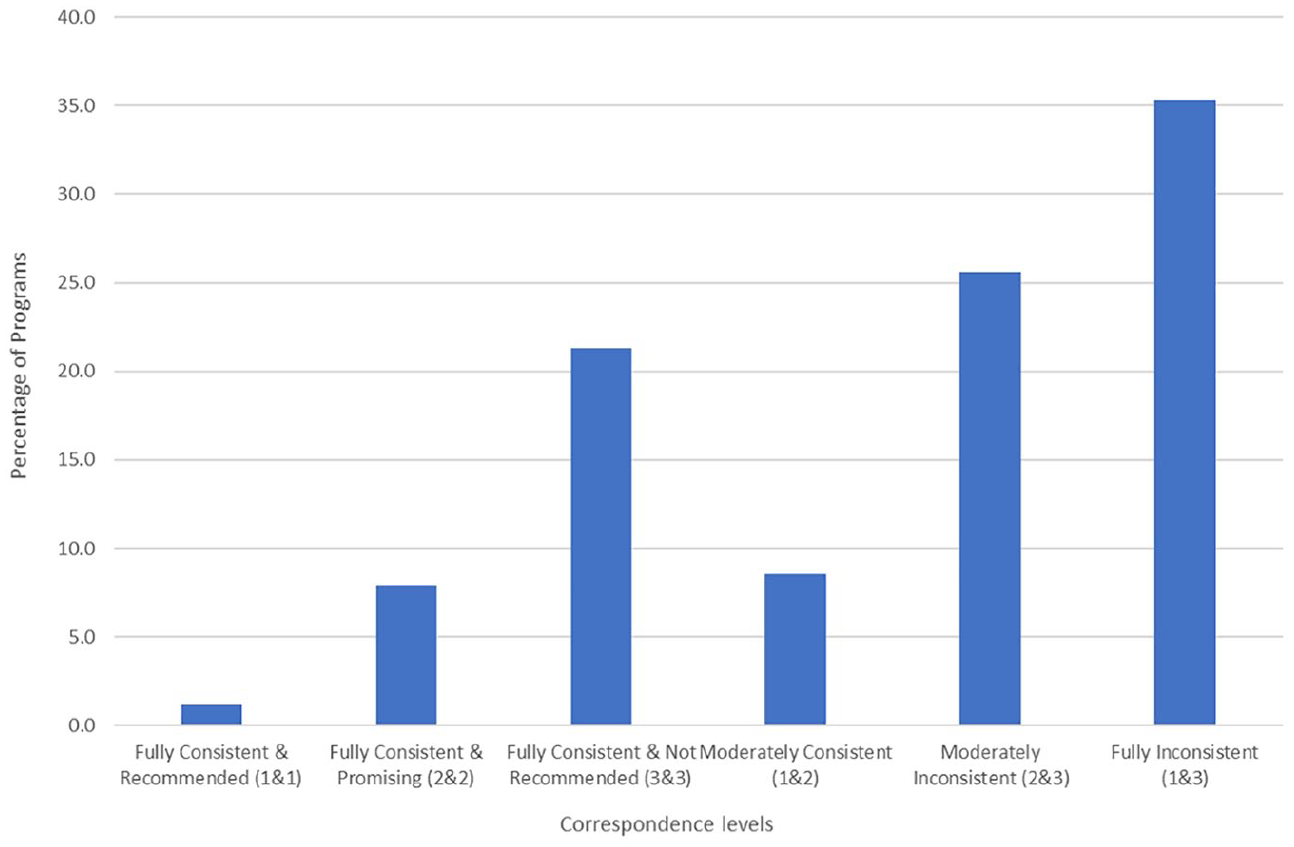
Correspondence in rating for education programs rated by two clearinghouses.
Moderate consistency is when ratings are 1 and 2. The probability of this is low, but it increases with the number of CHs rating a program. With two CHs, 8.5% of rating pairs are moderately consistent; with three they are 14.1%; and with four or five they are 20% each. For consumers willing to tolerate the difference between recommended and promising, these percentages indicate a consistently low level of positive evaluations of the same program. However, if the more stringent criterion is invoked of all scores being 1, then the already-low consistency level drops even further.
How should these estimates of the consistency of program endorsements be interpreted? Figures 1 and 2 reprise the findings visually; Figure 1 for programs rated by two CHs. It shows that (1) the modal rating pair entails maximal disagreement, and (2) consistency is least for programs that are recommended by both CHs. Figure 2 is for programs evaluated more often, and again we find that the most common disagreement, accounting for at least a quarter of all CH differences, is between ratings of recommended and not even promising—the pattern of results most likely to lead to inappropriate program adoption. The least likely disagreement is between ratings of promising and recommended, the very disagreement that most advocates of evidence-based practice would be most willing to tolerate. We now turn to trying to explain this surprisingly high level of diversity.
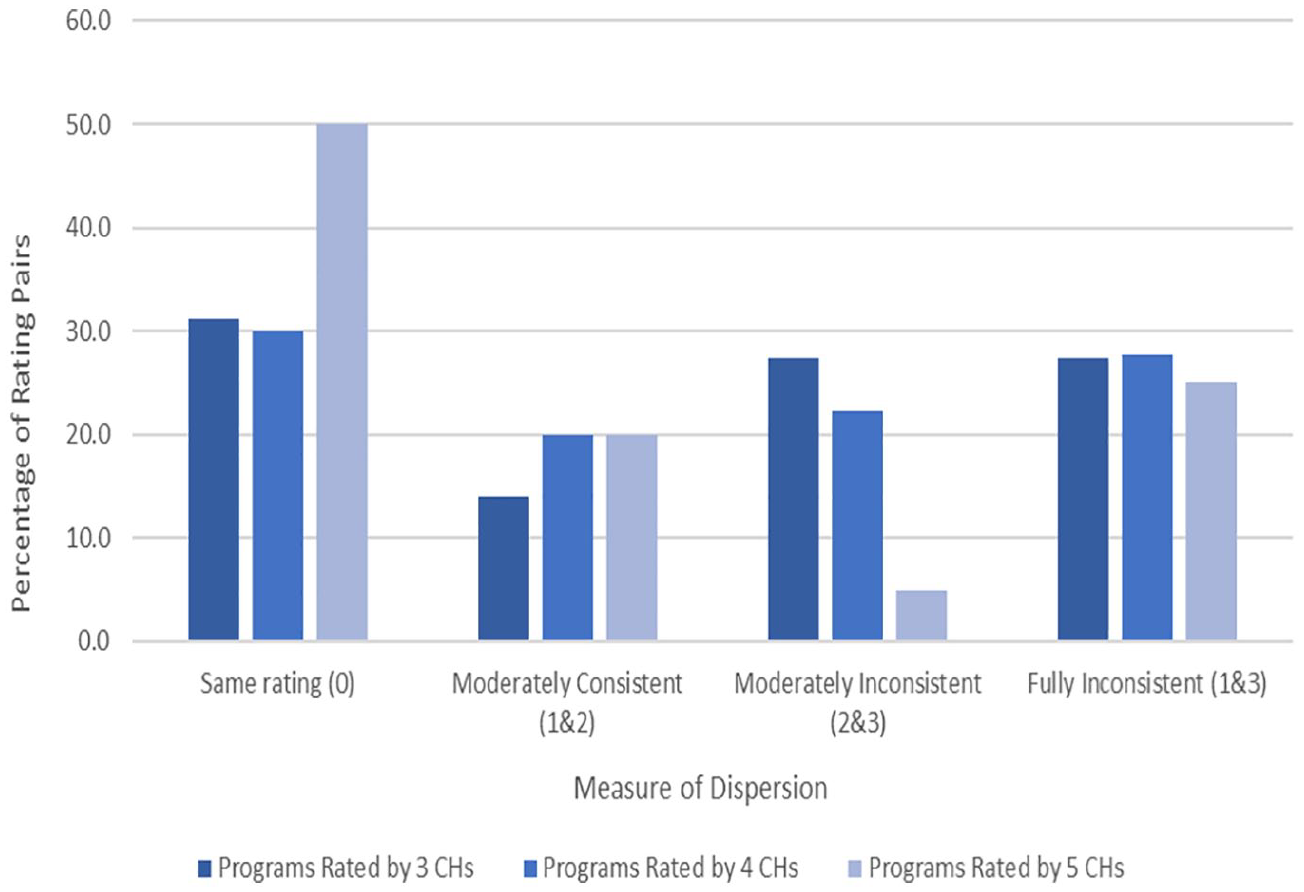
Dispersion in evaluative ratings of education programs rated by 3, 4, and 5 clearinghouses.
Case Studies of Clearinghouse Agreement and Disagreement
Using the results of the description of CH differences and of the consistency estimates just presented, we chose to examine four hypotheses for why CHs might differ in their evidence-based program ratings: (1) they vary in the studies included, (2) they examine different versions of the same-named program, (3) they analyze different outcomes for the same program, and (4) they use different methodological standards to warrant judgments about how evidence-based a study or program is. Because these explanations are not fully exclusive and the number of programs for in-depth examination is limited, we claim only to probe these hypotheses rather than formally test them.
Five programs were examined as individual cases. One was consistently rated as promising; another program involved modest agreement; two programs involved modest disagreement; and the remaining program showed maximal disagreement—that is, at least one CH fully endorses the program but others conclude it is not even promising. When we had a choice among programs in any one of these agreement/disagreement categories, we chose the better-known program on the grounds that CH users are most likely to seek information about these programs. They also tend to be more mature, with effectiveness first claimed decades ago and the program content having been in continuous development since then. When we encounter different variants of the same program, we examine each by means of data from program assessment reports published on CH websites. When no justification is offered for the program rating given, we offer our own interpretation based on website information about the standards used. Inevitably, all interpretations of why CHs differ in their rating of the same program are our own.
(1)
Still, CHs differ in the standards used. WWC and Blueprints differ in their interpretation of the effect sizes in Borman et al. (2008), with Blueprints declaring them to be “very small” 1 while also invoking other limitations related to possible baseline group differences and the quality of the differential attrition tests used. WWC reviewed Open Court under two separate topic areas, each with its own evidence review protocol. Under Adolescent Literacy, WWC finds the Borman et al. effect size to be statistically significant, but under the Beginning Reading protocol the objection is raised that statistical significance was not computed for the student sample WWC preferred, though the average effect size was judged to be above 0.25 SD, thus meeting the website’s standard of substantive importance (What Works Clearinghouse, 2014). BEE reviewed the Borman et al. study as part of two systematic reviews. For beginning reading, it was called a “randomized quasi-experiment” (Slavin et al., 2009a) rather than an RCT, because there were only nine treatment and seven control classes in first grade. But for upper elementary grade reading, the same study was reviewed as an RCT (Slavin et al., 2009b). Both reviews judged the effect sizes between +0.10 and +0.19 SD to be “modest,” and each pointed to a possible confounding because the classes employing Open Court were taught for 2.5 hours per day whereas the control classes had only 90 minutes of regular reading time. We see here one CH identifying possible study limitations to which no other CHs drew attention.
Skindrud and Gersten (2006) is a quasi-experimental study of Open Court, and both WWC and Blueprints agree on its failure to account for clustering. WWC applied a correction and discovered that the results, although no longer statistically significant, were nonetheless substantively important enough to be worth adding to the evidence of Open Court’s promise. However, Blueprints rejected the study from its review, citing the clustering issue, baseline treatment group differences after excluding program dropouts, and a study sample that was geographically limited (Blueprints for Healthy Youth Development, n.d.; What Works Clearinghouse, 2014). So, the Blueprints program rating depended on a single RCT. WWC and BEE added a QED to this, but none of these CH differences were enough to affect the bottom-line evaluation of Open Court. All three CHs rated it as promising, but none fully recommend it. All examine the same program variant, they substantially overlap in the reading outcomes examined, and they closely agree on the number and identity of the studies worth reviewing. Even so, their interpretation of the same study slightly differs due to different evidence standards being used.
(2)
The number of studies used to assess the basic SFA program varies greatly. SPTW uses 6, CMFR 8, WWC 9, and Blueprints considers 16 studies but certifies only 1. Borman et al. (2007) plays a core role as the only RCT that four CHs review, but they modestly differ in their appraisal of it. Blueprints certifies it as meeting its standards for inclusion, but its review indicates the absence of a long-term follow-up and questionable baseline equivalence for race/ethnicity. However, SPTW reviewers do not question equivalence and accept the study’s follow-up period. This study also met WWC’s highest study quality criteria, showing positive effects on the alphabetics outcome domain but indeterminate effects on comprehension. Overall, for alphabetics in grades K–4, WWC rates SFA as recommended, but for the more complex skill of reading fluency, it rates SFA as promising, and for comprehension and general reading achievement, SFA is judged as not recommended. WWC’s nuanced differences by outcome domains mean that stakeholders interested in SFA will have to examine that site very carefully. But aside from the one finding about comprehension and reading achievement, the SFA ratings indicate a strong consensus that it is not ineffective, even if confidence varies about how evidence-based it is. BEE uses differences in standardized effect sizes to decide which options are superior to others. In its review of beginning reading programs, BEE gives the highest rating to SFA for its weighted mean effect size of +0.29 SD based on 23 qualifying studies, whereas the lowest rating goes to the Transition Program for children in grades 2 to 5 who move from Spanish to English instruction where the median effect size based on a single qualifying study is +0.16 SD—just below the 0.2 criterion for BEE’s highest rating. Overall, the CHs vary in the number of studies used; they rate SFA over different outcomes and versions of the same program, but they still arrive at relatively consistent judgments of SFA’s effectiveness.
(3)
The studies of this program hardly overlap between CHs. Blueprints and BEE use a single study; WWC uses from one to three depending on the outcome, all of which examine unique outcomes; NDPC uses an unknown number of studies but does not cite them; and CMFR uses 10 studies for PALS Reading and two for PALS Math. CMFR and WWC share two studies (Fuchs et al., 2002; Saenz et al., 2005), though no other CH includes them (except NDPC, as it does not publish which exact studies they use). The base of studies contributing evidence is clearly quite disparate, and rating differences from this source are possible. The variability is partly due to CHs choosing to evaluate unique components or outcomes of PALS. Blueprints and NDPC generalize over the reading and mathematics outcomes, but CMFR rates PALS Math and different variants of PALS Reading separately, whereas BEE reviews PALS for elementary and middle/high school math separately and WWC rates PALS on five topic areas, each guided by its own review protocol—beginning reading, adolescent literacy, English language learners, elementary school mathematics, and students with learning disabilities. Mostly, WWC finds stronger evidence for reading than math gains.
The summary ratings each CH provides also correspond with their different evidence standards. NDPC’s requirement of an RCT or strong QED was apparently fulfilled by the set of studies they reviewed, although they do not describe them. Only one RCT study was certified by Blueprints, though it reviewed 17 other causal studies that could not be certified due to limitations related to differential attrition, no long-term follow-up of the effect, data analysis conducted at the wrong level, and lack of clarity about the intent-to-treat estimation. For Blueprints, a rating of promising followed, because a higher rating requires at least one more rigorous study. CMFR found that the evidence for both the reading and math versions of PALS was unclear, absent a demonstration of sustained effects at 6 months post program completion.
(4)
The disagreements are largely due to the different studies used. NDPC’s promising rating of QOP relies on two multisite RCTs that, at one site, demonstrated positive effects on academic skills, high school graduation, and postsecondary schooling, but the studies are not cited. WWC examined two studies of QOP, but only Schirm et al. (2006) met the website’s quality standards. However, no statistically significant or substantively important effects were shown on school progress or school completion. Although Blueprints did not find any positive evidence for QOP at all, the modified version, Eisenhower QOP, fared better and attained a promising rating on the basis of a single study with limitations such as no testing of group outcome differences at baseline and no adjustments for clustering. This single study showed that EQOP increased high school GPA, college acceptance, and college persistence, etc. (Curtis & Bandy, 2015, 2016). However, CMFR could not rate it even promising because, by early 2019, they found no relevant published studies.
(5)
The sole full endorsement by NDPC rests upon an unknown number of RCTs at the student level and one school-level QED, all of which are reported as showing one or more positive effects on outcomes such as high school dropout, graduation, GPA, credit completion, attendance, eighth-grade math and reading. However, the studies cannot be identified. Of the CHs with a promising rating, PPN came to this conclusion in May 2009 based on a single QED (Rossman & Morley, 1995) that compared a multisite sample of intervention and comparison youths who were not matched in any way. Using two evaluation reports (Parise et al., 2017; Somers and Haider, 2017), CNCS Evidence Exchange rated the program as moderately supported. This judgment was based on one 2-year RCT that positively affected nonacademic school outcomes, and on one ITS study that showed absolute improvements in graduation and dropout rates in the treatment group 3 years post-intervention. But this increase did not surpass what spontaneously occurred in the comparison group. Other CHs did not find CIS to be even promising. Blueprints considers the evidence “inconclusive” due to either a lack of enough RCT/QED studies or severe methodological limitations in those available. CMFR reached the same conclusion because, by February 2018, they could not find any peer-reviewed publication evaluating CIS, and peer review is necessary for CMFR. Stakeholders interested in learning how evidence-based CIS is will find divergent conclusions across CHs, largely due to variation in the evaluative standards applied and the studies available when a review was conducted.
These five case studies illustrate once again that CHs are at best only modestly reliable in the consistency of their evidence-based ratings. Also, although each of the four explanations for this unreliability probably plays some role in explaining the variation, the likely primary explanation is that the CHs vary in the design features a study must include to achieve a CH’s highest rating and in how much replicated evidence of what kind is needed for higher rankings. To require a single RCT or QED with a statistically significant finding is a much lower hurdle than requiring two RCTs with positive findings that are of a given size, that are observed 12 months after the intervention has ended, and that are in studies conducted by researchers who are independent of the program developers and even of prior researchers of the program in question. Also important is CH variation in the number and type of studies of the same intervention that a review includes. Some of this variation may be due to when the program review was last updated and to the availability of funds to conduct a thorough literature search. But some of it is also due to internal decisions about which studies meet the CH’s minimal standards of methodological adequacy for including a study in the program review and determining what weight it should be assigned in that review. Of lesser importance are hypotheses about CH differences in (1) the outcomes analyzed to evaluate a program, and (2) the version of the same-named program that is examined. Of course, stakeholders can be led astray if they confuse variants of the same program; but with care, they can navigate between variants if they are attuned to the issue that often arises because a positive evaluation has enabled the program developers to acquire funding to modify the original program.
Discussion
This paper is concerned with the practical construct validity of the term “evidence-based,” albeit in the special context of CHs that were specifically established to determine which social programs are evidence-based because justified and codified procedures were used to examine effectiveness and warrant conclusions about whether a given program is effective rather than ineffective, inconclusive, or never appraised. If CHs rarely agree in their evidence-based conclusions about the same program, this will surely puzzle most consumers of research. Discrepant recommendations can be due to many factors and, of the four plausible explanations examined here, the most likely is that CHs vary in the standards used to assess how evidence-based a program is. Among the most important differences in standards for attaining a high effectiveness rating are whether initial positive program effects need to be demonstrably replicated or not and whether they need to be demonstrably persisting or not. Because CHs do not agree on such criteria for acceptable evidence, and because they are important enough to lead to different judgments about program effectiveness, “evidence-based” seems to be an idea with modest construct validity despite CHs being funded precisely to identify which programs are most evidence-based. At a minimum, high construct validity requires CHs to converge on the same conclusion (Campbell & Fiske, 1959), but because they only do so modestly, we conclude that “evidence-based” has limited practical construct validity in the CH context.
This conclusion might bewilder potential consumers of evidence-based knowledge who expect CHs to generate certified knowledge about what does and does not work. Sophisticated methodologists will surely be less puzzled because they will probably anticipate all the many design and analysis decisions required for evidence-based conclusions, and they might also realize that professional consensus does not exist about how important they all are, about how seriously they might bias causal estimates, and about how successful ameliorative procedures can be in reducing bias. So, methodologists might anticipate only a modest level of between-CH agreement. But would that level be as modest as obtained here? And if only modest agreement should be expected, then should we not appraise all consumers of CH of this so that they can set their expectations of CH ratings accordingly, treating any CH’s recommendations with caution rather than as certified knowledge of high validity and relevance? Needed is some mechanism for generating more discussion of how CHs might agree to handle their major sources of difference, including whether positive results need to be replicated, or be independently replicated, or to persist over time after treatment withdrawal.
Of all the educational interventions considered here, only 17% were rated by more than one CH. So, stakeholders interested in learning about the consequences of a specific education program will usually have no choice about which CHs to use or prefer; they must accept whatever is available and the assumptions/standards that go with it. But the programs rated more often are those with greater visibility within the educational research and policy communities. For this 17% of programs, disagreements in program recommendations were common, even including the most extreme level of disagreement between a program judged worth recommending versus not even promising. We do not know how much CH consistency stakeholder groups expect or are prepared to tolerate, but we surmise that it would be higher than obtained here. This is troubling because evidence-based language is now widely used in scientific, policy, and media circles, leading us to ask: Does it reflect a shared aspiration among all stakeholder groups that is still not linked to a shared understanding of what constitutes trustworthy evidence? Is the rhetoric surrounding “evidence-based” currently more prevalent than scientific consensus about the very broad set of methods needed to underwrite conclusions about program effectiveness? We reluctantly suspect that “evidence-based” needs to be treated with more skepticism than is common at present.
How might the gap between hope and reality be narrowed? The major obstacle to improvement seems to lie in the different standards of evidence CHs have adopted for assigning program ratings of promising or higher. To explain these CH differences, traditional concerns with causal identification and estimation seem to be of lesser importance more ancillary design features like the need for replication, for effects of a required size, and for persisting post-treatment effects. None of these are issues that can be easily resolved within the community of education stakeholders. For instance, is replication enough if it only occurs across sites in a single multisite study? Should two or more RCTs be required, or is a single RCT and a single QED enough? Is independent replication by different investigators required? And how should an overall conclusion be reached if some studies indicate a positive result for a given outcome but others do not? Which methodological features should determine the weight given to individual studies in a program review? No professional consensus currently exists on most of these issues, and so disagreements about them are legitimate and worth serious discussion.
How similar are these education results presented here to those in related fields? Education has as many as 12 CHs assessing program effectiveness, whereas there are 13 that deal with the social and behavioral prevention domain. There, the level of agreement between CHs is higher than in education by about 20 percent (Zheng et al., 2022). Although the present study does not seek to explain such a domain difference in between-CH consistency, one difference stands out across the two domains—the way in which the What Works Clearinghouse dominates over the other CHs in education. WWC also features in the synthesis of CHs dealing with social and behavioral programs, but because it predominantly addresses studies of academic achievement, its role is more central in education writ large than it is in the social and behavioral domain. In education, WWC’s combination of longevity, high funding level, clarity and justification of standards, number of programs rated, relative rapid updating of results, and promotion by the United States Office of Education and the way its use is mandated for various research and practice decisions all combine to give WWC great visibility in education. Indeed, some CHs (e.g., HomVEE) even base their standards on its criteria. Nonetheless, WWC is not the only CH in education, and its standards are not the only ones viable and in use. This paper does not examine WWC’s domain dominance and its possible consequences, because its scientific purpose depends on comparing the standards of evidence and other assumptions that different CHs make. This comparative research strategy does not require examining any one CH in special detail or trying to crown the assumptions built into any CH as superior for warranting acceptable knowledge of program effectiveness.
The present paper has some obvious limitations. First, we have not examined the extent to which policymakers use the recommendations CHs make. That question is beyond the scope of this paper, though Nakajima (2021) shows that policymakers are open to incorporating research evidence into their decision-making and prefer research findings from large samples, multiple testing sites, and contextual settings similar to their own. However, policymakers were not shown to prefer experimental studies over observational ones, a finding that is at odds with the preference universally built into the educational CHs studied here. Further research is needed to explore how policy-makers use the program recommendations from CHs (Hedges & Waddington, 1993). Second, more descriptive work is also needed to compare CHs in other domains to learn whether there is something stably unique about education that leads to greater disagreement among CHs than occurs in other fields, such as social and behavioral intervention (Zheng et al., 2022). A third challenge is that we only have access to evidence standards and program effectiveness profiles that CHs publish on their web portals. But some decision rules might be used in CH practice that are not documented online; they need to be documented and appraised. Likewise, some CHs publish their rationale for program endorsements but do not document how they assess the quality of the individual studies on which their final judgements depend. Fourth, our analysis is limited to CHs whose mandate is to certify interventions as effective or not; it is unclear how well the findings transfer to evidence-based practices that summarize survey data or qualitative studies. And finally, the landscape of CHs is a dynamic one. CHs continually rate new programs; they can update the ratings of existing programs. Some CHs update their evidence standards in line with relevant methodological developments, whereas others are slower to do so. The content, design and structure of CH websites changes over time, and our paper is but a snapshot of a continually evolving landscape.
The findings reported here lead to questions that a body with more authority than a single research team might profitably address. Do we need so many CHs in education? How can the number be reduced and other CHs be better supported? How can we maintain or increase the heterogeneity in evaluative criteria where no scientific consensus currently exists while reducing the heterogeneity where consensus exists? Can a modest-sized list of consensually validated causal contingencies be developed for increasing the level of between-CH standardization with respect to requirements about desired replication, effect sizes, and the length of persisting effects? Specifying such things would even allow CHs to test and publicize contingent conclusions of the form: Program X is rated as evidence-based only if immediate effects are examined and no independent replication is required, or Program Y is evidence-based so long as effects larger than .20 SD are tolerated and the replicated evidence is from at least two RCTs. With enough time and detail in reports, sophisticated methodologists might be able to work out such causal contingencies for themselves. But we cannot expect this from other potential CH consumers who have been promised simplifying recommendations from CHs and for whom the communication of contingencies might bespeak more complication than clarification. Nonetheless, even partial agreement about the most important causal contingencies should help. The current universe of educational CHs has grown in topsy-turvy fashion, and some official body—is needed to review the informal system of CHs we now have in education and to make suggestions about how the system might be improved.
Supplemental Material
sj-docx-1-rer-10.3102_00346543231152262 – Supplemental material for How Consistent Are Meanings of “Evidence-Based”? A Comparative Review of 12 Clearinghouses that Rate the Effectiveness of Educational Programs
Supplemental material, sj-docx-1-rer-10.3102_00346543231152262 for How Consistent Are Meanings of “Evidence-Based”? A Comparative Review of 12 Clearinghouses that Rate the Effectiveness of Educational Programs by Mansi Wadhwa, Jingwen Zheng and Thomas D. Cook in Review of Educational Research
Footnotes
Notes
Authors
THOMAS D. COOK is the Joan and Serepta Harrison Emeritus Professor of Ethics and Justice at Northwestern University, where he is also Professor Emeritus of Sociology, Psychology, Education and Social Policy. He is currently a research professor at George Washington University in Washington, DC; email:
MANSI WADHWA is a PhD candidate at the Trachtenberg School of Public Policy, George Washington University, email:
JINGWEN ZHENG is a PhD candidate at the Trachtenberg School of Public Policy, George Washington University, email:
References
Supplementary Material
Please find the following supplemental material available below.
For Open Access articles published under a Creative Commons License, all supplemental material carries the same license as the article it is associated with.
For non-Open Access articles published, all supplemental material carries a non-exclusive license, and permission requests for re-use of supplemental material or any part of supplemental material shall be sent directly to the copyright owner as specified in the copyright notice associated with the article.