
Abstract
Scholars emphasize the mismatch between state and federal initiatives and the operational realities of rural education. This study uses 2023–2024 data from the National Center for Education Statistics Common Core and Education Demographics and Geographic Estimates program to describe variation in the organizational size of rural-serving districts in the United States. Most are small, with 75% enrolling fewer than 1,990 students. Some districts are especially small and operate only one school or employ a single administrator. Conversely, rural schools are also located in very large districts. The largest rural-serving districts also enroll the highest percentage of rural students who are Black and Hispanic.
Keywords
School districts are critical organizational actors in the implementation of state and federal education initiatives and the development of local instructional and student support practices. Existing research on policy implementation has primarily been conducted in districts with large horizontally fragmented central offices in which specialized professionals oversee policy within their domain and have a hierarchical relationship with schools (e.g., Daly & Finnigan, 2011). In contrast, case studies of rural schools describe small district administrative teams and superintendents frequently engaged in day-to-day school operations. Rural education scholars have long emphasized the mismatch between federal and state policies and the operational realities of rural education, particularly in regards to compensatory educational services and test-based accountability (Sutherland & Seelig, 2021).
Many approaches to educational improvement rest on assumptions about districts’ organizational structures that may not hold true for all rural areas: (a) Districts enroll a substantial number of students, (b) districts serve many schools, and (c) district central offices are composed of staff with specialized expertise. District enrollment may influence the costs of implementation, particularly for programs with substantial fixed costs (Kolbe et al., 2021). The number of schools in a district determines the viability of improvement strategies, such as principal professional learning communities or multitiered school discipline reform (Welsh, 2025), which group schools based on shared characteristics to provide targeted support. The availability of specialized central office staff can influence how districts allocate responsibility for policy implementation. For example, smaller rural districts in New York depended on teacher leadership when implementing a new curriculum under Race to the Top, whereas larger districts relied on central office staff (Zuckerman et al., 2018). Understanding the district organizational contexts in which rural schools operate can help inform asset-oriented and locally feasible policy designs and implementation strategies.
Rural schools are defined by the National Center for Education Statistics (NCES) as those located outside of a census-defined urban area. Schools are also assigned sublocale codes (fringe, distant, remote) based on their distance to the nearest urban area. District-level locale codes are based on school-level locales weighted by enrollment (Geverdt & Maselli, 2024). I use the term “rural-serving” districts to refer to all local education agencies that operate at least one NCES-rural school and thus serve as an organizational context for rural education.
Topography and histories of consolidation, decentralization, segregation, and resegregation shape the geographic boundaries of school districts throughout the United States (Tieken & Auldridge-Revels, 2019). Although rural education scholarship often emphasizes the small size of districts (Sutherland & Seelig, 2021), there is no existing study that describes the variation in the organizational size of rural-serving districts nationally. In one report, Gutierrez and Terrones (2023) identified districts as small if their enrollment was under half their states’ average and found that 70% of NCES-defined rural districts met this definition. In this article, I describe the student enrollment, central office staffing, and number of operated schools in rural-serving districts in order to understand variation in organizational structure that may influence policy enactment.
Data and Sample
I use the 2023–2024 Public Elementary/Secondary School Universe Survey to identify 26,218 NCES-classified rural public schools in the United States. I connect each school with an operating district using the 2023–2024 Local Education Agency Universe Survey. In total, I identify 9,296 rural-serving districts across all 50 states. Tables describing district size by sublocale code and region, state-by-state summaries, an additional description of study methods, and Stata replication files are available on the journal website.
Key Findings
Most rural-serving districts are quite small, as shown in Table 1. On average, they enroll 2,935 students, employ 24 central office staff, and operate six schools total, three of which are rural. However, the distribution in district size is highly right skewed, with many small districts and a few much larger districts. Seventy-five percent of rural-serving districts enroll fewer than 1,990 students.
Organizational Size and Rural Student Demographics of Rural-Serving Districts: Overall and by Enrollment Quintile
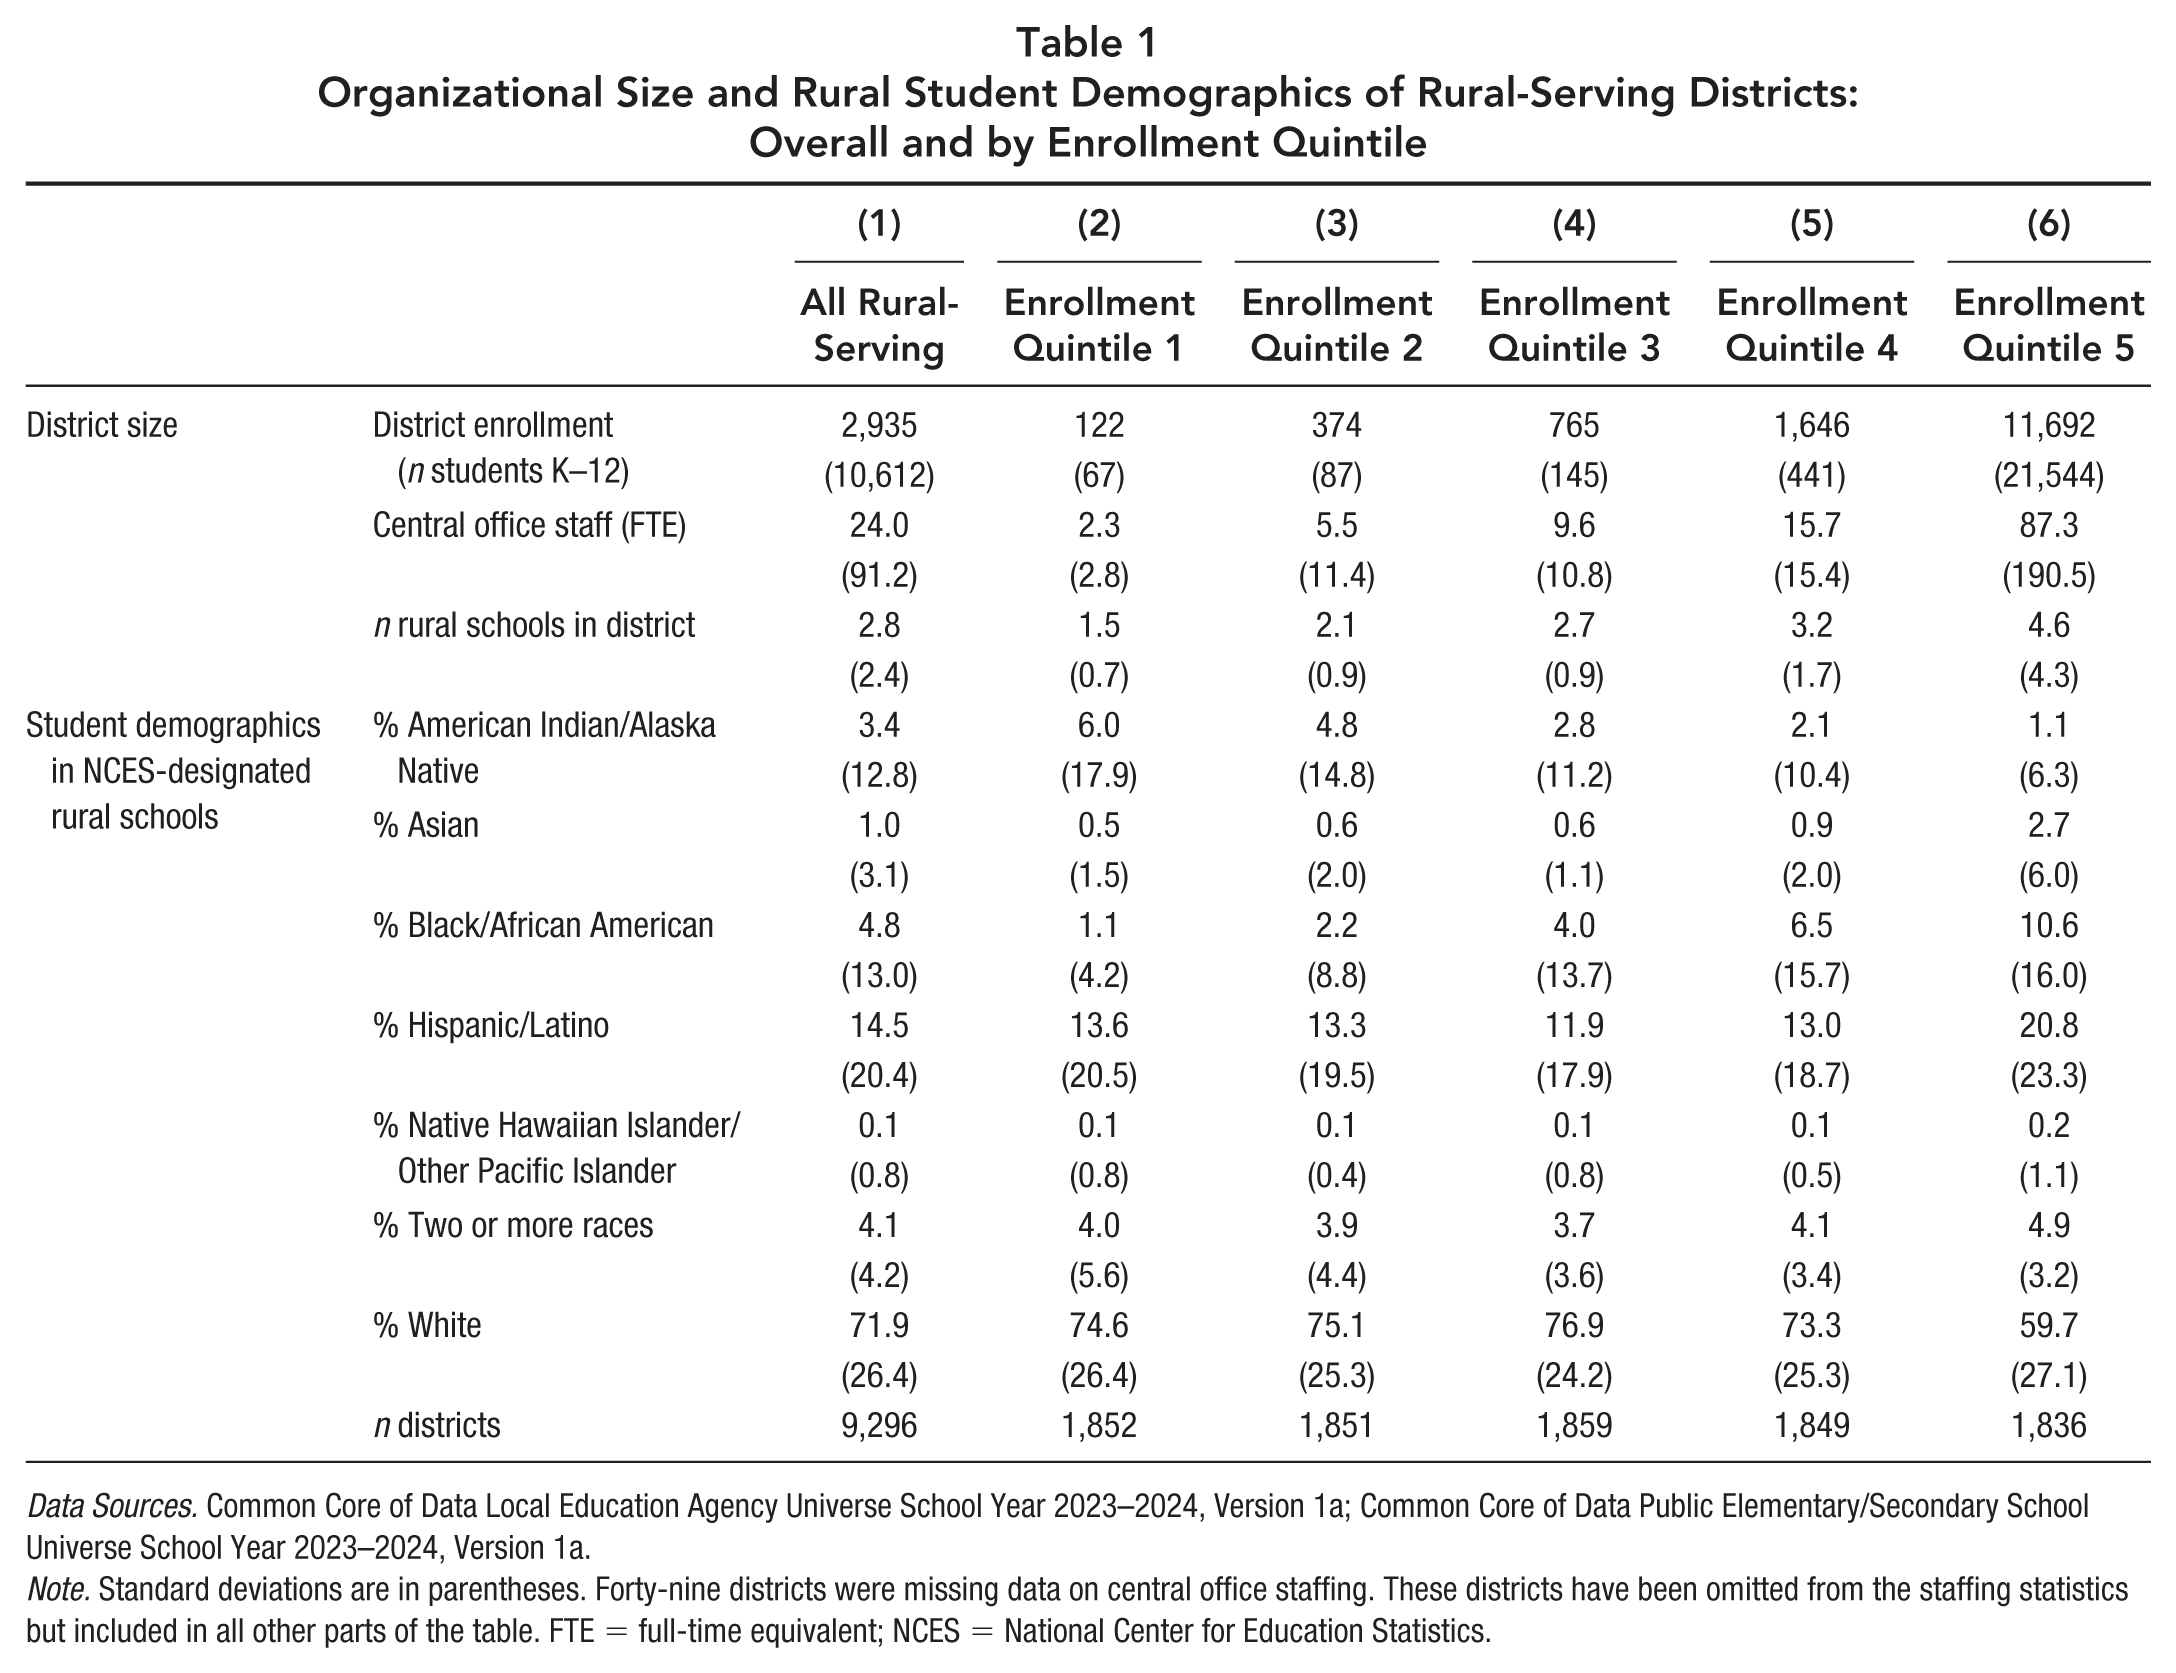
Data Sources. Common Core of Data Local Education Agency Universe School Year 2023–2024, Version 1a; Common Core of Data Public Elementary/Secondary School Universe School Year 2023–2024, Version 1a.
Note. Standard deviations are in parentheses. Forty-nine districts were missing data on central office staffing. These districts have been omitted from the staffing statistics but included in all other parts of the table. FTE = full-time equivalent; NCES = National Center for Education Statistics.
Rural-serving district size varies within and between NCES sublocales, as shown in Figure 1. On average, district enrollment and central office staffing levels tend to be lower in rural-remote and rural-distant districts and slightly higher in rural-fringe districts. Rural-serving districts that are not categorized as rural at the district level tend to be the largest. On average, districts operate around three rural schools, regardless of sublocale. Rural-serving districts tend to be bigger in the South. However, there is also substantial variation within each region.
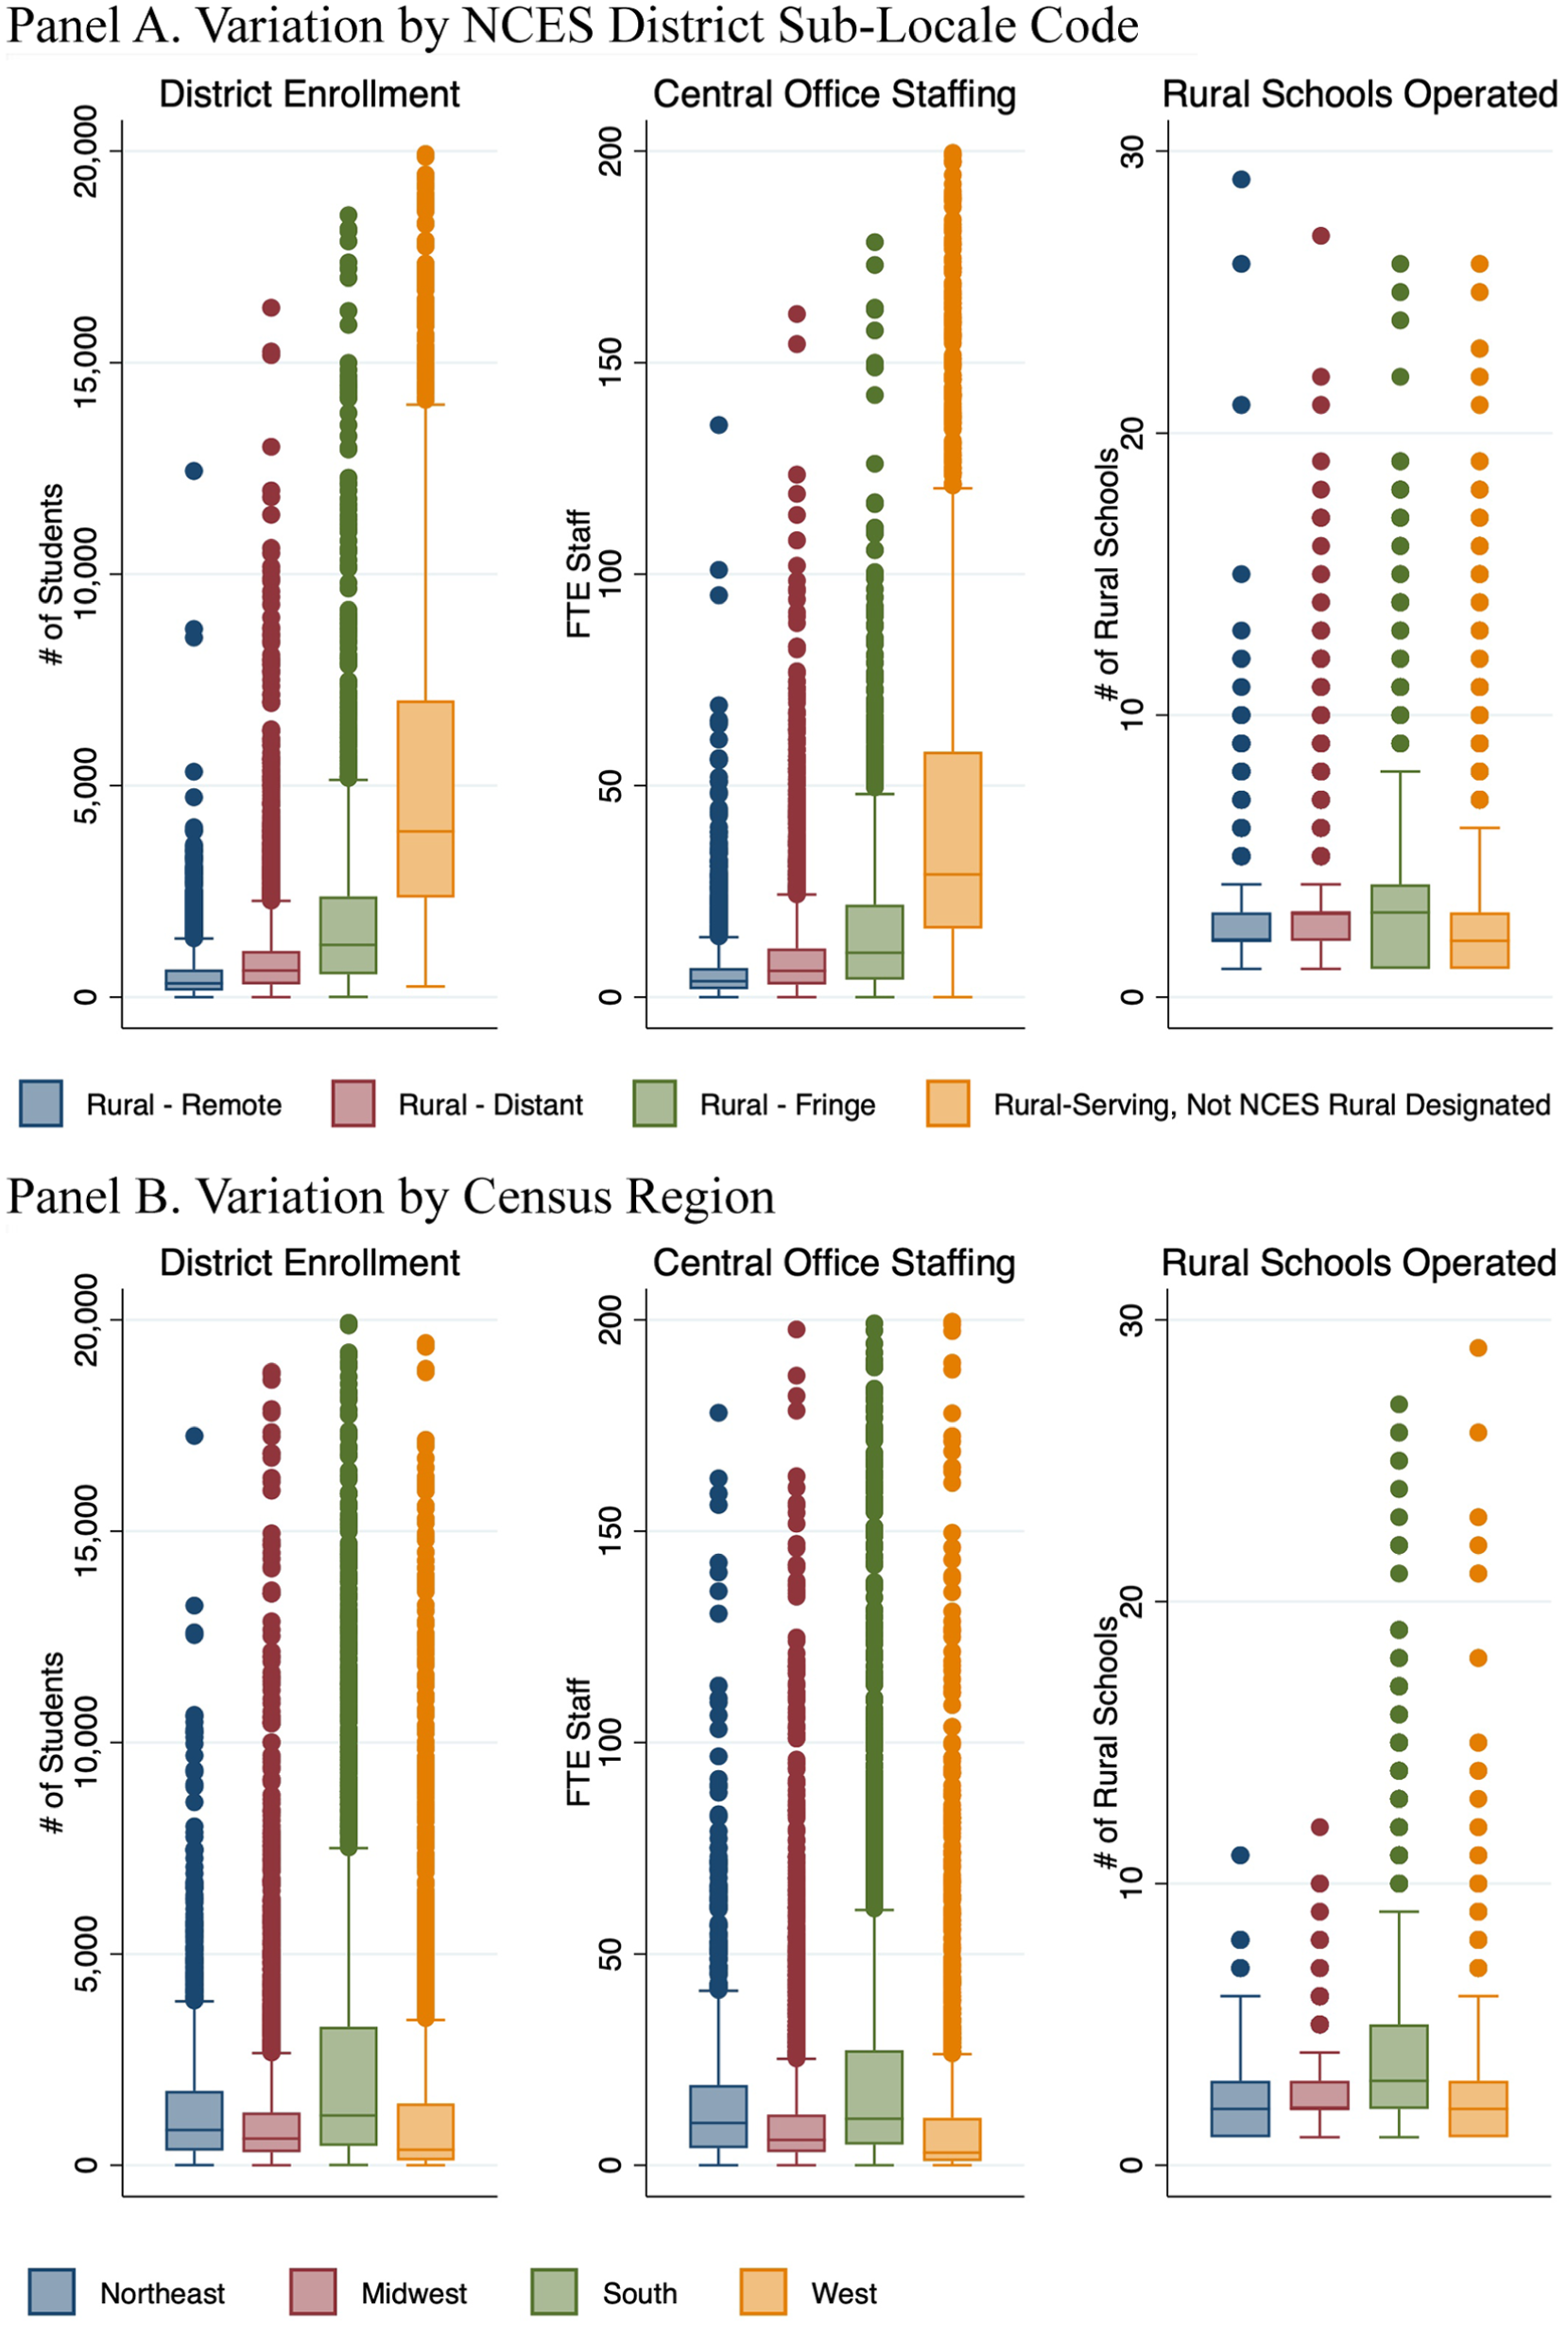
Organizational size of rural-serving districts.
Nationally, 17% of rural-serving districts are so small that they operate only one school and violate our common conceptions of schools and districts as distinct entities. This percentage is much higher in Vermont (45%), Montana (47%), Maine (46%), and New Hampshire (57%). Seventy-three percent of single-school districts serve only a subset of grades. Additionally, 33% of rural-serving districts have one or fewer district-level administrators. A district may have less than one administrator full-time equivalent if a staff member splits their time between superintendent, principal, and teaching roles. One-administrator districts are especially common in New Mexico (82%), Idaho (83%), Louisiana (97%), and Vermont (100%). Smaller districts serve the highest proportion of students identified as American Indian or Alaskan Native.
Conversely, 21 rural-serving districts enroll over 100,000 students. Collectively, these very large districts serve 196 rural schools and tend to include large urban areas such as Houston Independent School District, Gwinnet County in Georgia, and Cypress-Fairbanks in Alaska. Hawaii Department of Education is also a special case because the state is organized as a single district. Notably, these districts have very large central offices, which may parallel more of the research on fragmentation and specialization at the district level. However, they are still operating rural schools who are interfacing with these large district structures while situated within their own rural context.
Although predominantly White rural areas loom large in the public imagination, rural schools serve students from a range of racial and ethnic backgrounds. The largest rural-serving districts also enroll the highest percentage of Hispanic, Black, and Asian student in their rural schools. As shown in Table 1, in rural-serving districts in the fifth enrollment quintile (>2,645 students), 20.8% of rural students are Hispanic, and 10.6% of rural students are Black. Rural schools in South Carolina (36%), Louisiana (38%), and Mississippi (51%) serve the highest percentage of Black students. Meanwhile, Texas (40%), Arizona (41%), California (47%), and New Mexico (58%) serve the highest percentage of Hispanic students.
Discussion
With roughly 9.5 million students attending rural schools (Showalter et al., 2023), it is important to understand how education policy can better support students in their local areas. Now more than ever, rural districts need access to contextually relevant support as they face an increasing uncertainty landscape of school choice, rapid development of artificial intelligence technology, unstable federal funding, and climate change. This snapshot of rural-serving districts provides a starting point for revising our key assumptions about district organizational structures (many students, many schools, specialized district staff) to inform policy design and implementation.
Most rural-serving districts are in fact small and thus require educational improvement strategies that can be facilitated by a few central office employees in collaboration with, at most, a handful of schools. How might policies leverage the multiple roles individual district staff inhabit in order to promote cohesion across instructional, operational, and student support initiatives? Small districts may not have central office staff designated as experts in curriculum, technology, attendance, and so on. How can small districts enable their existing school-level staff to access specialized support when it is most applicable to their practice? Relatedly, educational service agencies may facilitate access to resources beyond what can be supported in small district offices.
In contrast, rural schools in large districts may benefit from the specialized expertise of central office staff, particularly if those staff are also familiar with their local context and differentiate support accordingly. However, there is very limited existing research on the interactions between rural schools and central offices in large districts. Sutherland and Seelig (2021) posited that it may be difficult for rural populations to gain political representation in “larger, nonrural school districts,” which may “compound urban-centric education policies” (p. 98). Conversely, Sampson and Diem (2022) described rural coalitions in Clark County, Nevada, exerting political power to strengthen their control over educational resources at the expense of marginalized communities.
There are many dimensions of rurality that may influence education policy implementation and effectiveness, including but not limited to local social and economic conditions, teacher labor markets, and districts’ geographic size. Multiple factors likely interact to shape policy enactment in rural schools given that, for example, Bickel and Howley (2000) found school and district sizes jointly influenced performance. Both quantitative and qualitative research would benefit from explicitly identifying mechanisms through which rurality influences policy enactment. Quantitative analysis should include measures that match proposed mechanisms rather than rely solely on NCES locales. NCES locale codes, by construction, measure population sparsity and distance to an urban center. In particular, NCES sublocales capture only a small proportion of the variation in rural-serving district size. Qualitative studies can benefit from explicitly noting districts’ organizational structures, information that is often overlooked when describing samples but aligns with best practices for rural definition triangulation (Grant et al., 2024).
Supplemental Material
sj-pdf-1-edr-10.3102_0013189X261427450 – Supplemental material for Describing Variation in the Size of Rural-Serving Districts
Supplemental material, sj-pdf-1-edr-10.3102_0013189X261427450 for Describing Variation in the Size of Rural-Serving Districts by Sara May White in Educational Researcher