
Abstract
Non-teaching staff comprise over half of all school employees, and their turnover may be consequential for school operation, culture, and student success, yet we lack evidence documenting their attrition. We use 17 years (2007–2023) of administrative data from Oregon to examine mobility and exit among teachers, administrators, paraprofessionals, licensed staff, and non-licensed staff. Although teacher turnover dominates turnover conversations, teachers are consistently the most stable employee group, even as turnover surged following the COVID-19 pandemic. School factors, such as colleague experience, predict turnover rates for all employees, but within-school turnover between staff groups is not highly correlated, and associations with some school context factors vary by employee groups. Results suggest that employee turnover is not a homogeneous phenomenon across staffing groups.
Keywords
Teacher turnover is a persistent, widespread concern due to its potential cost to student experiences and learning (Ingersoll, 2001; Ronfeldt et al., 2013). Several states experienced dramatic fluctuations in teacher turnover following the COVID-19 pandemic, amplifying concerns about the contribution of staff instability to unfinished student learning (Bastian & Fuller, 2023; Goldhaber & Theobald, 2023; Hamidu, 2023). Yet teachers comprise only 45% of employees working in K–12 schools (Bureau of Labor Statistics, 2021). Although teachers are consequential for student outcomes, there are many other adults working in various roles in public education to promote student success.
Teachers, principals, and staff together constitute the institutional structures of schools that are intended to support students. Evidence increasingly suggests that school non-teaching staff also affect student outcomes (Aurora & Farkas, 2023; Hemelt et al., 2021; Mulhern, 2023; Reback, 2010). Routine staff turnover may adversely impact colleagues, alter adult-student relationships, and ultimately degrade student learning environments (Camburn et al, 2010; Guin, 2004). Although teacher turnover and its implications for student learning and inequality are well documented (Lankford et al., 2002) and research consistently finds higher rates of turnover among school administrators compared to teachers (Bartanen et al., 2021), less is known about the prevalence and ramifications of turnover among other staff (but see Kaler et al., 2025).
The COVID-19 pandemic heightened the salience of school staff turnover; media detailed how school operations suffered when essential non-teaching personnel were lacking and attributed these changes to worsening working conditions and a strong labor market outside of the education field (Lieberman, 2021). However, interpreting the extent of these challenges is difficult because we lack research characterizing the labor markets and typical mobility patterns of non-teaching staff. Moreover, while teacher and principal turnover is correlated (DeMatthews et al., 2022), we do not know if staff mobility patterns mirror those of their school colleagues and how these patterns together shape school employee turnover overall.
In this paper, we use 17 years of administrative data to characterize the exit and mobility patterns of all public school employees working in the state of Oregon, their co-occurrence across employee groups within schools, and their relationship to school- and staff-level predictors. Turnover of all types was relatively stable over time across five broad staff groups (teachers, paraprofessionals, administrators, licensed staff, and non-licensed staff) pre-pandemic but declined and then surged to their highest levels recorded after the onset of the pandemic. Teachers consistently have the lowest turnover of any of the staff groups working in public education in the state. Turnover across staff types within a school is only moderately correlated but is related to several dimensions of the school context. However, few characteristics consistently correlate with turnover across groups, and sometimes, these factors have countervailing relationships with turnover for different types of employees. By analyzing turnover patterns for the universe of public school employees in a state, we provide the first comprehensive examination of employee turnover in public schools and demonstrate the substantial variability that exists across different staff groups.
Literature Review
Teacher turnover is a long-standing policy concern and the primary focus of the staff turnover literature (Hanushek et al., 2004; Murnane & Olsen, 1989). Teacher turnover has been linked to negative impacts on student achievement and learning, school climate, and staff cohesion (Guin, 2004; Hanselman et al., 2016; Ronfeldt et al., 2013); however, low-performing teacher turnover can improve student achievement (Adnot et al., 2017). Many studies have investigated the causes of teacher turnover, finding that a variety of issues, including compensation, work location preferences, and student populations, contribute to teachers’ mobility and exit (Nguyen et al., 2020, summarized this work). For decades, scholars have also highlighted the ways that school context and working conditions influence educator career longevity (Ingersoll, 2001; Johnson et al., 2012; Ladd, 2011; Loeb et al., 2005; Miller et al., 2025; Nguyen et al., 2020; Viano et al., 2021). Teacher turnover further relates to other axes of inequality. It is often higher in schools with greater proportions of students of color and low-income students and among teachers of color who are disproportionately concentrated in such schools, hindering efforts to improve teacher quality and diversity and opportunities to learn for minoritized and historically marginalized students (Grooms et al., 2021). Working conditions can have an especially important impact on the turnover of educators of color (Bristol, 2020), and their relative isolation in schools is an important dimension of these working conditions and their turnover (Kemper Patrick & Arturo Santelli, 2022; Xu et al., 2024). In addition, although relatively stable over time, teacher turnover is responsive to broader social and economic conditions, with fluctuations during the Great Recession and the COVID-19 pandemic (Bacher-Hicks et al., 2023; Bastian & Fuller, 2023; Brummet et al., 2025; Camp et al., 2024a; Goldhaber & Theobald, 2022, 2023).
School leader turnover is also increasingly being studied. About one in five principals and one in four assistant principals leave their schools each year on average, but rates vary substantially within states (Bartanen et al., 2021; Grissom & Bartanen, 2019). The vast majority of this mobility is due to movement between schools and districts in ways that often exacerbate inequities and lead less effective leaders to be concentrated in lower performing, higher poverty schools (Grissom et al., 2019). The degree to which principal effects on student outcomes can be measured is debated (Bartanen et al., 2024); however, research has linked principal turnover to declines in student achievement, increases in turnover among teachers and assistant principals, and declines in school climate and instructional quality (Bartanen et al., 2019; DeMatthews et al., 2022; Henry & Harbatkin, 2019; Mascall & Leithwood, 2010; Winters et al., 2023). Leadership instability may also reduce the ability of schools to recruit and retain staff in the longer term (DeMatthews et al., 2022).
Although research routinely considers the prevalence, causes, and consequences of teacher and administrator turnover, the same cannot be said for other school staff. As of 2021, there were over 4 million employees in K–12 schools in roles other than teaching or administration across the United States, and their growth has far outpaced growth in the teacher workforce over the past 30 years (Bisht et al., 2021; Bureau of Labor Statistics, 2021), yet our understanding of their impacts on students is still developing. Mounting evidence points to the importance of paraeducators (Aurora & Farkas, 2023; Hemelt et al., 2021), counselors (Mulhern, 2023; Reback, 2010), and nurses (Best et al., 2018) for promoting student success and supportive learning environments. If non-teaching staff are indeed important educational inputs, then their turnover may result in students receiving services from less effective and experienced staff or in some cases, no services at all, which could hamper student learning and progress.
Staff turnover may also adversely affect colleagues and the school environment more generally. Schools are organizational units that depend on cooperation among its actors (Penuel et al., 2009). Turnover among staff may disrupt efforts to build trusting, positive relationships between students and adults and among colleagues that are critical to providing quality instructional experiences (Coburn et al., 2012; Frank et al., 2004; Holme & Rangel, 2012). Furthermore, staff turnover could increase teacher and administrator workload through needing to train new employees or to assume vacant specialized staff roles themselves (Lieberman, 2021). In fact, teachers value access to some support staff more than a 10% increase in salary (Lovison & Hyunjung Mo, 2024), indicating that teachers view staff as an important aspect of their working conditions. Moreover, Reback (2010) found that the addition of school counselors improves teachers’ perceptions of school climate, with fewer reporting that student behavior interferes with instruction. Thus, even absent direct effects of staff turnover on students, the attrition of other school employees could reduce teacher and administrator effectiveness and create working conditions that might precipitate their turnover, escalating churn among all adults in the building.
Although states increasingly report attrition rates for teachers, they rarely do so for other employees. The few studies that have examined non-teaching staff turnover are often limited to studying a single staff group in a single district (Robert, 2022) or over short time periods (Lipscomb et al., 2022). Notable exceptions include Theobald et al. (2025), who examined nearly 30 years of special education paraprofessional turnover in Washington state, and Gilmour et al. (2024), who tracked turnover among special education licensed staff in Pennsylvania before and after the onset of the pandemic. Using the same Washington data, Kaler et al. (2025) also examined the impact of paraprofessional turnover on student achievement. Together, this evidence suggests that lower-paid employees, such as paraprofessionals or secretaries, turn over at higher rates than teachers and that licensed staff, such as nurses or counselors, have similar rates to teachers. It also suggests that paraprofessional turnover does not impact school-level student achievement. Open questions remain, however, about the nature of turnover patterns for non-teaching school staff more broadly and their similarity to teacher and administrator attrition patterns. Limited evidence from a small number of staff groups is mixed (Bastian & Fuller, 2023; Gilmour et al., 2024; Theobald et al., 2025). No studies to date have simultaneously examined turnover patterns across a broad set of employees to characterize school- and system-wide labor market dynamics. Thus, to deepen our understanding of employee turnover in schools across time, we ask the following research questions:
Research Question 1: How do mobility patterns vary among teachers, administrators, paraprofessionals, and support staff across years?
Research Question 2: To what extent does teacher, principal, paraprofessional, and support staff turnover co-occur within schools?
Research Question 3: To what extent do school, educator, and student characteristics predict staff turnover?
Data and Measures
Data and Sample
We use statewide longitudinal administrative data containing records for all public school employees who worked in the Oregon public school system during the 2006–2007 to 2022–2023 school years. These records include information about employees’ institutional assignments as well as their personal and professional characteristics. In addition, we use statewide student-level data to generate school- and district-level covariates, which provide information about educators’ working environments and district contexts.
We use the detailed position codes provided in the administrative data to identify 13 smaller staff groups based on the similarity of job types, necessary qualifications, pay, and demographics. We then further combine these more detailed staff groups into five simplified groups, namely, teachers, administrators, paraprofessionals, licensed staff, and non-licensed staff (for a list of positions and groups, see Appendix A, available on the journal website). In the simplified groups, teachers include both those working in the general education (GenEd) and special education (SpEd) fields. Administrators include both school- (e.g., principal) and district-level (e.g., superintendent) leaders and SpEd administrators. Paraprofessionals work to support teachers and students in classrooms for both GenEd and SpED settings. Finally, we group the remaining employees into either licensed or non-licensed staff. As a result, these two staff categories are the broadest and include a diverse array of workers, from school psychologists and nurses for licensed staff to library assistants and administrative secretaries for non-licensed staff. 1 To develop a complete picture of the state education workforce, we include all of these employees in our analysis of turnover patterns by staff groups (Research Question 1: N = 1,273,002 person-year observations). To further examine educator turnover patterns within different school contexts (Research Questions 2 and 3), we restrict the sample to employees working at the school—as opposed to district—level and in schools with at least five employees (N = 962,738 person-year observations).
Appendix Table B1, available on the journal website, presents descriptive statistics on the demographic and professional backgrounds for the five employee groups in the full sample. Appendix Tables B2 and B3, available on the journal website, present analogous information for the school sample and detailed staff groups. Overall, teachers are the largest group. The entire workforce is predominantly White and female, with teachers having the lowest proportion of employees of color and paraprofessionals and non-licensed staff having the highest. Appendix Figures B1 and B2, available on the journal website, display average inflation-adjusted salaries by employee group over the years. 2 Administrators, teachers, and licensed staff tend to have higher salaries, which have remained relatively stable over time. In contrast, non-licensed staff and paraprofessionals have the lowest average salaries, and their earnings have fluctuated more compared to other staff groups.
Appendix Table B4, available on the journal website, presents descriptive statistics for school-level characteristics. The average school has about 24 teachers, 1.5 administrators, 10 paraprofessionals, 2.5 licensed staff, and 9.5 non-licensed staff, serving roughly 454 students. Slightly less than half of all school-level employees are not teachers, suggesting the potential for these groups to contribute substantially to the total levels of turnover that schools experience.
Turnover Measures
For each employee, we create annual and long-term measures of turnover by comparing their institutional assignments in year t with those in subsequent years t + 1, t + 3, t + 5, and t + 10. Turnover status is categorized into four types: (a) “stayed in the same school,” where employees remained in the same school; (2) “switched schools,” where employees moved to another school within the same district; (3) “switched districts,” where employees relocated to a different district within the state; and (4) “left workforce,” where employees exited the state public education system. For employees who work in multiple schools or districts, their movements are determined based on all their institutional assignments – if employees’ schools or districts in one year match any in the following year(s), they are classified as stayers in those locations. With this classification scheme, employees could also switch position types when moving schools or districts and be counted as having turned over but would not be counted in turnover if they stayed in the same school but switched positions (a more comprehensive turnover measure, which also considers position switching, is provided in the Appendix available on the journal website). We also test the importance of considering full-time equivalents (FTE) by replicating analyses in the Appendix, available on the journal website, for employees with at least 0.5 FTE across all of their position types.
Additionally, we developed school-level turnover rates for teachers, administrators, paraprofessionals, licensed staff, and non-licensed staff. For each school, we calculated the percentage of employees in each employee group who were not present in the same school from year t to year t + 1.
Methods
We use a variety of descriptive approaches to detail several features of staff turnover. To compare turnover and mobility across staff types over time (Research Question 1), we plot the proportion of different groups of employees who switched schools, changed districts, or exited the state public school system each year during the study period. To formally test for differences in turnover rates, we directly compare the average annual turnover of GenEd teachers to that of the other 12 detailed staff groups by regressing a binary turnover variable on indicators for the other groups with GenEd teachers as the omitted category. To examine the longitudinal nature of turnover differences between groups, for each cohort of employees, we also plot the proportion of teachers, administrators, paraprofessionals, and other staff that remain in the education system, in their same district, and in their same school 3 years, 5 years, and 10 years later. Detailed model specifications for all analytic approaches are included in Appendix C, available on the journal website.
Next, to assess the extent to which turnover among different employee groups co-occurs in schools (Research Question 2), we first calculate Pearson correlation coefficients for school-level turnover rates across these groups. We then conduct regression analyses where the school-level teacher turnover rate is regressed separately and then simultaneously against the turnover rates for administrators, paraprofessionals, and licensed and non-licensed staff. We consider both 1-year and 3-year rolling average turnover rates in our analysis and also examine lagged turnover rates from previous years. 3 Our regression models include year and district fixed effects to address common year shocks and to more closely examine school—as opposed to district— turnover processes. For comparison, we also conduct analyses at the individual level, predicting teacher turnover based on turnover rates of other staff in their schools, using a discrete-time logistic hazard model and a linear probability model.
Lastly, we explore whether school-level employee turnover rates vary across different types of school contexts and staff characteristics (Research Question 3). For teachers, administrators, paraprofessionals, and other staff, we report the average annual turnover rate for schools in the top and bottom quartiles of the proportion of students of color, proportion of students in poverty, levels of school-wide academic achievement, and proportion of novice teachers with fewer than 3 years of experience. Academic achievement is measured as the average standardized test score from both English language arts and math state tests for all tested grades in the school. We report the annual turnover rates for each of the employee groups based on the level of urbanicity as defined by the National Center for Education Statistics, whether the school is elementary or secondary, whether the school is a traditional public or charter school, and whether the school had a new principal in that academic year. 4 For employees of color, we examine turnover rates for those with at least 15% co-racial colleagues versus those with fewer than 15% (Xu et al., 2024). Furthermore, we also test differences by racial/ethnic identity, gender identity, age, and whether an employee works in a SpED role. We employ independent samples t-tests to formally test differences in the turnover rate for employees in each school type. To guard against multiple hypothesis testing, we control for the family-wise error rate (FWER) using the Hommel adjustment to produce more conservative estimates of significant differences. This approach controls the FWER or the probability of rejecting at least one true null hypothesis by sequentially adjusting p-values through a modified Bonferroni-type approach (see Blakesley et al., 2009). We implement this adjustment using the p.adj command in R. Additionally, we estimate linear probability models, logistic regression models, and multinomial logistic regression models to test which factors are correlated with employee turnover after accounting for a host of other school and individual characteristics.
Results
Turnover Pattern Comparison Across Staff Groups
We present staff turnover descriptive results at three levels—within-district school switches, district switches, and exits from Oregon public schools—across the main text and in the appendices, available on the journal website, to provide nuanced information relevant to policy at multiple levels. However, the primary focus of this article is to examine staff turnover from the school’s perspective, which is likely less concerned about the type of turnover than the need to replace a staff member for the coming year in the first place. Therefore, our discussion centers on total turnover, which combines all three forms. We refer to disaggregated turnover measures when relevant.
To compare turnover across the five major employee groups, in Figure 1 we plot the proportion of employees that switch schools within district, switch districts, or exit Oregon public schools going into the following year between 2006–2007 and 2021–2022. 5 For example, the teacher turnover rate of 19.5% in 2007 indicates that 19.5% of teachers observed in 2006–2007 turned over going into the 2007–2008 school year. Of these, 5.6% switched schools within the same district, 2.9% switched districts, and 11.0% exited Oregon public schools entirely. Employee turnover appears to fluctuate with broader economic conditions. Turnover rates were comparably high in 2007’s relatively strong labor market, declined through the onset of the Great Recession, and increased in 2011, when school budgets in the state were strained. Rates stabilized after 2011 until declining slightly in the 2019–2020 school year, followed by surging turnover for all groups as the COVID-19 pandemic expanded. By the 2021–2022 school year, turnover reached its highest recorded rates for all groups except non-licensed staff: 21.3% for teachers, 26.1% for administrators, 30.7% for paraprofessionals, and 25.9% for licensed staff.
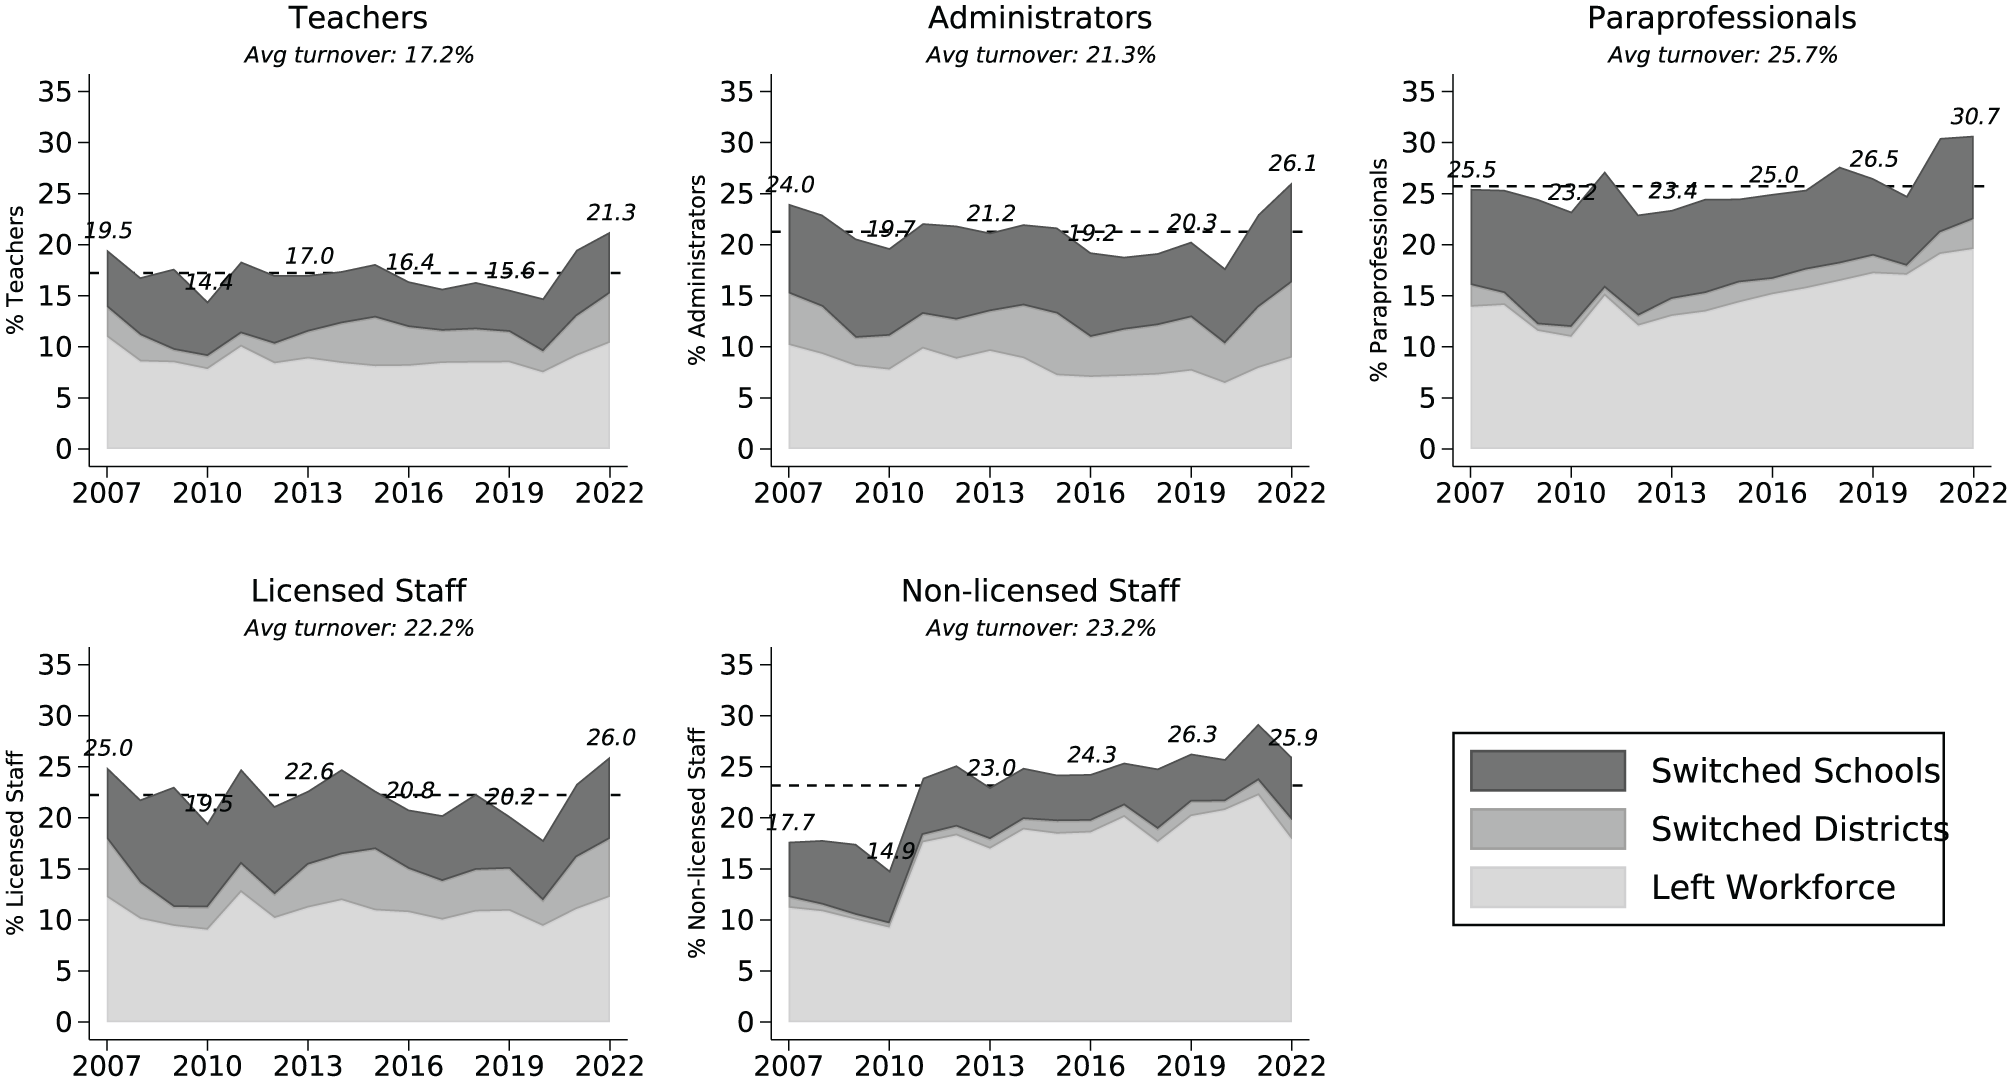
Educator attrition and mobility by staff group, 2006–2007 to 2021–2022.
Across varied economic conditions, teachers are comparatively the most stable group, with an average annual turnover rate of 17.2%. In part, this is because teachers have lower exit rates than paraprofessionals and staff and lower school and district mobility rates compared to administrators. However, the five employee groups compared in Figure 1 are somewhat broad and may obscure important differences by types of employees within these groups.
Figure 2 directly compares turnover across the 13 detailed staff groups by presenting average annual turnover rates with GenEd teachers as the reference category. 6 The GenEd teacher turnover rate is represented by the black vertical line with 95% confidence intervals testing the differences in turnover between GenEd teachers and each specific employee group. In the pre-pandemic period (2007–2019), GenEd teachers had the lowest turnover rate of all employees, as indicated by none of the confidence intervals overlapping with the black vertical line representing the GenEd teacher rate of 16.1%. Annual turnover rates were at least 2.2 percentage points higher for other employee groups, ranging from 18.3% among top district-level administrators (superintendents and assistant superintendents) to 26.2% among SpEd paraprofessionals. Although the types of turnover (i.e., moving or exiting) vary by group (for Figure 2 analogues disaggregated by turnover type and a version considering only district movement and exit, see Appendix Figures D5 and D6, available on the journal website), GenEd teachers were still the most stable group overall. 7 In fact, even compared to all 36 other position codes recorded in the administrative data, only two (district support staff and library support staff) had lower overall turnover rates than GenEd teachers (see Appendix Figures D7 and D8, available on the journal website). 8
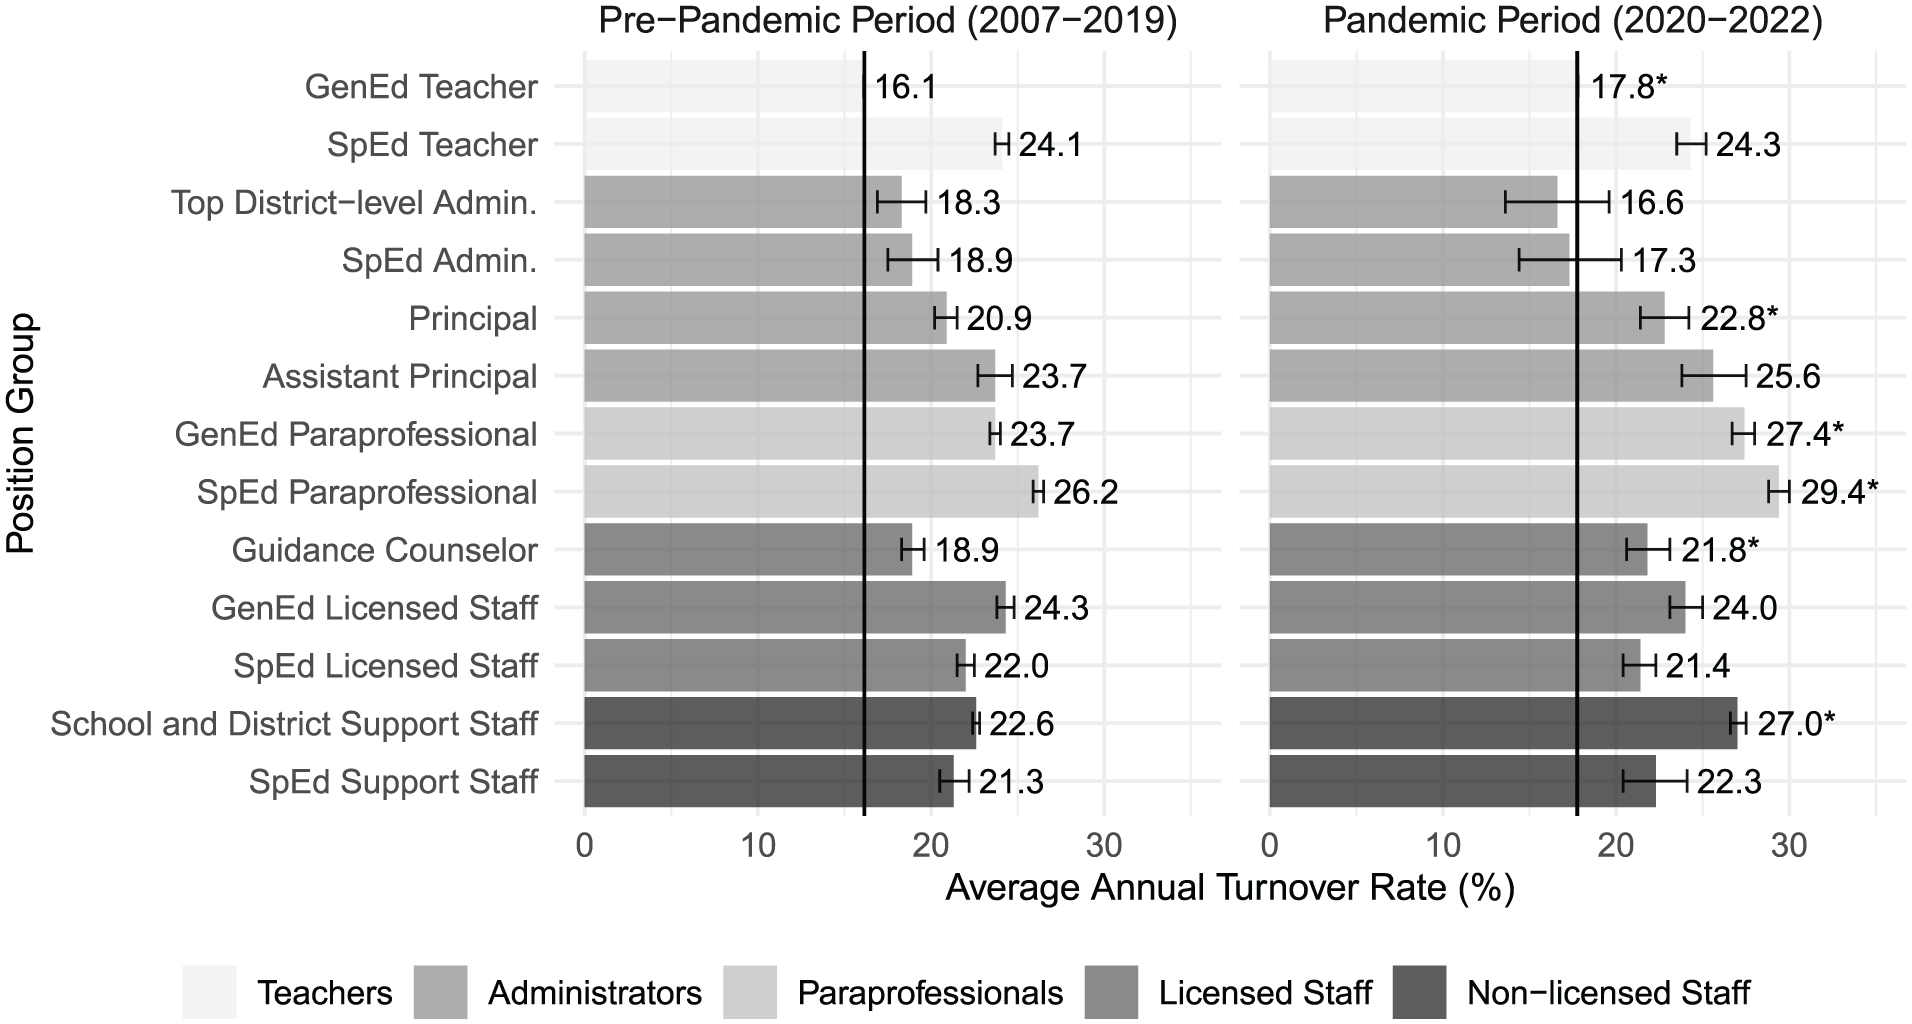
Differences in mean annual turnover relative to general education teachers by staff group before and after the pandemic.
For the pandemic period, the relative picture remains largely unchanged. Although GenEd teachers experienced statistically significant increases in turnover (as indicated by the asterisks next to the labeled pandemic rate in Figure 2), most other employee groups also experienced increases. Top district-level administrators and SpED administrators are the exception; they had lower turnover rates during the pandemic compared to before, which makes their turnover statistically indistinguishable from the GenEd teacher rate of 17.8%. For the other employee groups, the turnover rate is significantly higher than the GenEd teacher rate, ranging from 21.4% for SpEd licensed staff to 29.4% for SpEd paraprofessionals. Thus, both before and during the pandemic, GenEd teachers remain among the most stable groups of employees in the state’s public education system. 9
So far, we have presented all turnover rates as 1-year averages, examining whether employees show up in the same school from one year to the next. In Figure 3, we explore longitudinal turnover patterns for each of the five broad employee groups. For each school year, we examine the proportion of employees still working in Oregon public schools after 3, 5, and 10 years. For example, of all the teachers observed working in Oregon in 2008, 71.4% of them were still working at a public school in Oregon 5 years later.
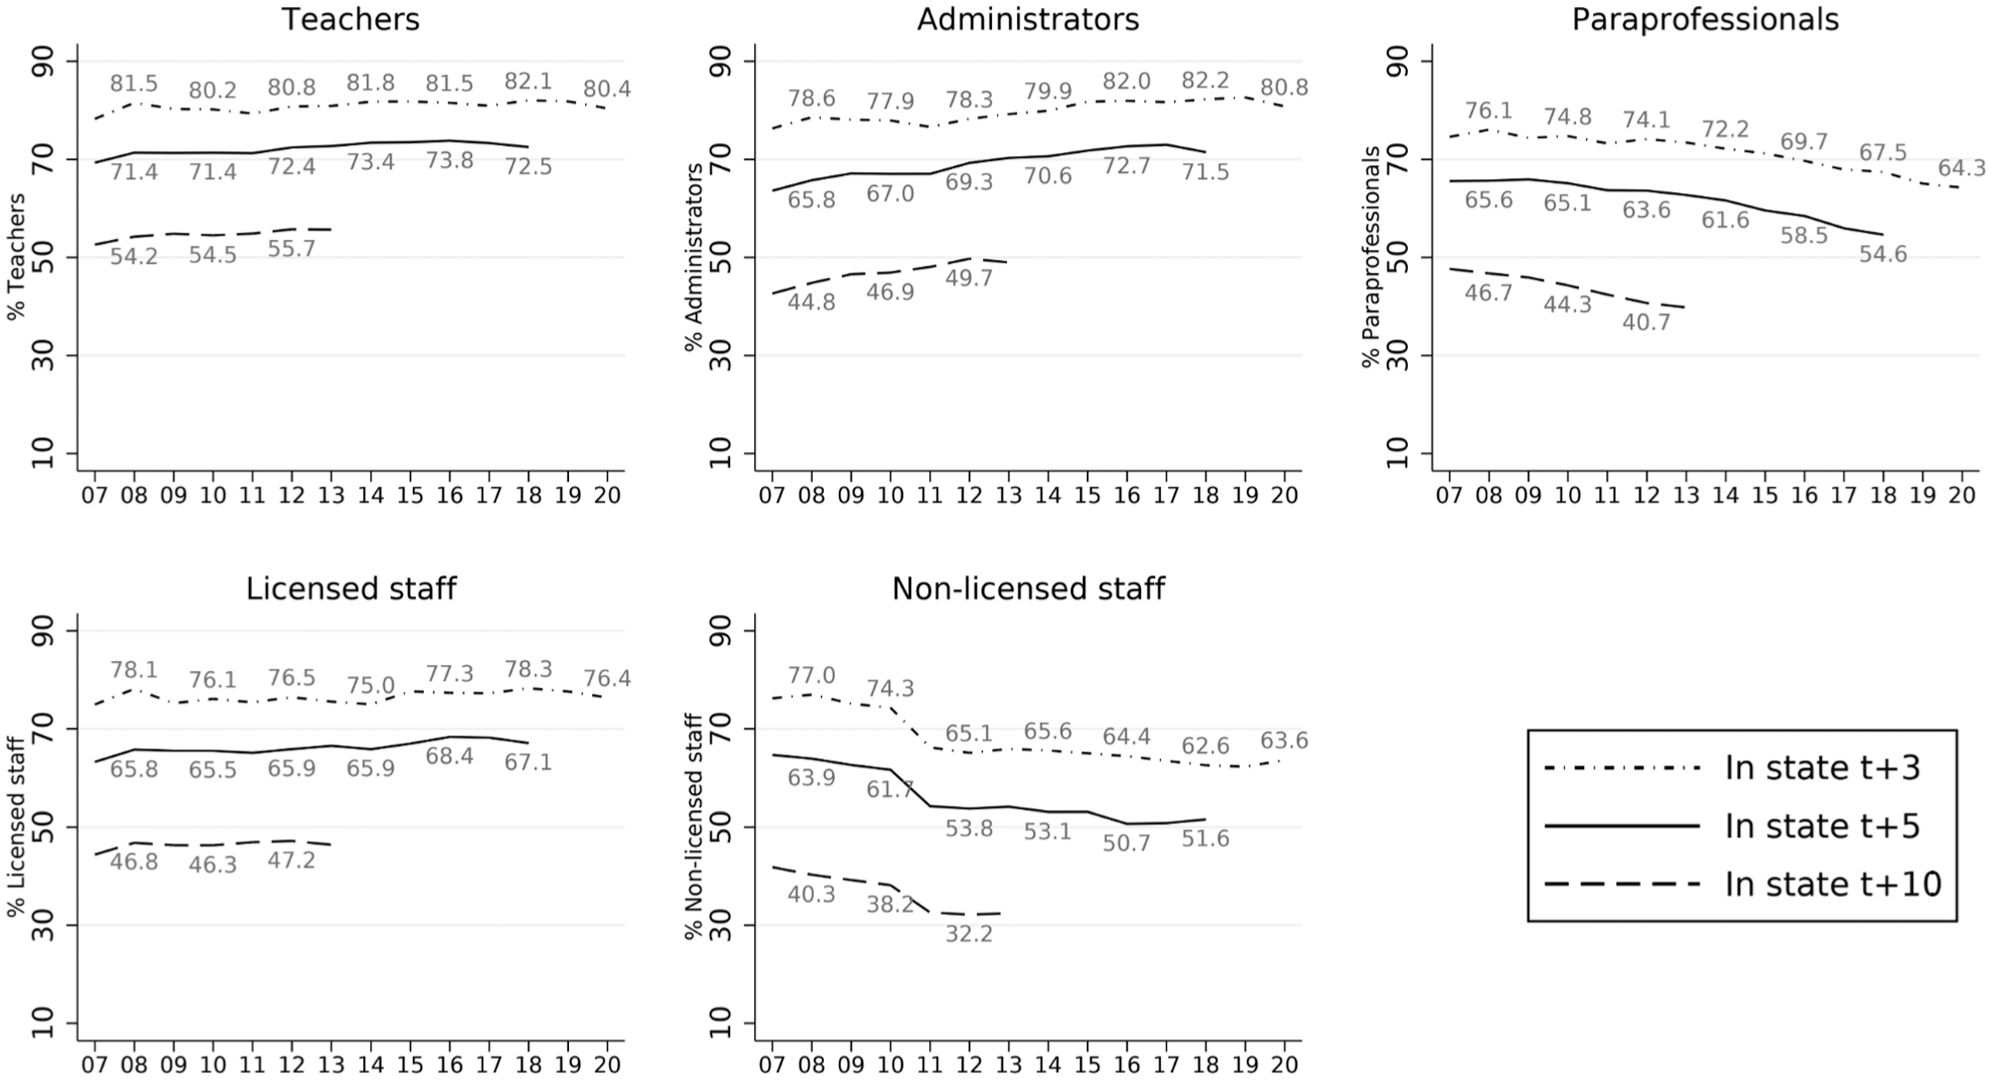
Proportion of employees that remain in the state public education system in t + 3, t + 5, and t + 10, 2006–2007 to 2019–2020.
As Figure 3 demonstrates, teachers are the most stable employees not only on an annual basis but also when looking at longer time horizons. The longer-term retention rates for teachers are relatively consistent over time, with about 80% of teachers remaining in Oregon public schools 3 years later, 70% remaining 5 years later, and 54% remaining 10 years later. Administrators have longer-term retention rates that are slightly below those of teachers but that have been increasing steadily over time. For example, 66% of Oregon’s administrators in 2008 remained in the state 5 years later. By 2016, 5-year administrator retention rates grew to 73%. However, long-term administrator retention is substantially lower than it is for teachers at the school or district level, which aligns with the fact that many administrators take on these roles at later career stages and ages that are closer to retirement than other types of educators and often change locations to do so (see Appendix Figures D12 and D13, available on the journal website). Long-term retention among licensed staff is similarly stable compared to teachers, albeit at slightly lower levels (about 76% remaining after 3 years, 66% after 5 years, and 46% after 10 years).
For paraprofessionals and non-licensed staff, on the other hand, their longer-term retention is not only substantially lower than it is for teachers, but their retention rates have also declined over time. Between 2008 and 2020, the 3-year retention rate declined from 76% to 64% for paraprofessionals and from 77% to 64% for non-licensed staff. The 5-year and 10-year rates also declined fairly sharply over time. By 2012, although more than half of teachers working that year were still observed in Oregon public schools in 2022, only 41% of paraprofessionals and 32% of non-licensed staff still worked in the state’s public schools 10 years later. 10 This pattern of lower and declining retention remains the same when looking at retention at the school or district level (Appendix Figures D12 and D13, available on the journal website) or when considering retention and movement across the five position types (Appendix Table D2, available on the journal website). Thus, whether looking year to year or over longer time spans, teachers are more likely to remain in the state’s public schools than other groups of employees.
School-Level Turnover for Different Groups
Next, we examine the co-occurrence of turnover among these various employee groups within schools. Pearson correlation coefficients for school-level turnover rates among various employee groups indicate small to moderate relationships (rs = .06 –.24) across different measures and school years (see Appendix Table E1, available on the journal website).
Table 1 presents model-based results examining the relationship between a school’s teacher turnover rate and the turnover rates of administrators, paraprofessionals, licensed staff, and non-licensed staff. The findings suggest that teacher turnover is only modestly related to the turnover of other employees within the same school. For example, as shown in Model 6, when comparing turnover rates within the same districts and years and controlling for other employee turnover, a 1 SD increase in paraprofessional turnover corresponds to a 0.12 SD increase in teacher turnover, and a 1 SD increase in administrator turnover corresponds to a 0.07 SD increase in teacher turnover. This translates to a 10 percentage point increase in paraprofessional turnover being associated with a 0.73 percentage point increase in teacher turnover and a 100 percentage point increase in administrator turnover being associated with a 2.4 percentage point increase in teacher turnover (unstandardized, or percentage point changes, are shown in Appendix Table E2, available on the journal website). 11 Furthermore, we analyzed school-level models using rolling 3-year averages and 1-year lagged turnover as outcomes and individual-level models employing linear probability models and logit-based discrete-time hazard models to examine the relationship between turnover among staff groups (see Appendix Tables E3–E5, available on the journal website). The results from these additional models show consistent patterns. Across various specifications, we find only a modest relationship between teacher turnover and turnover among the other four staff groups. Generally, lagged turnover rates are less predictive, and 3-year rolling averages are most predictive (but still reach a maximum association of a 0.2 SD increase in teacher turnover for a 1 SD increase in paraprofessional turnover). Together, these results suggest that the schools that have higher teacher turnover are not necessarily experiencing higher turnover for other employees at the same time. This raises the question of what factors predict turnover for these different groups and whether they are shared across staff categories.
Associations in School-Level Turnover Across Staff Groups
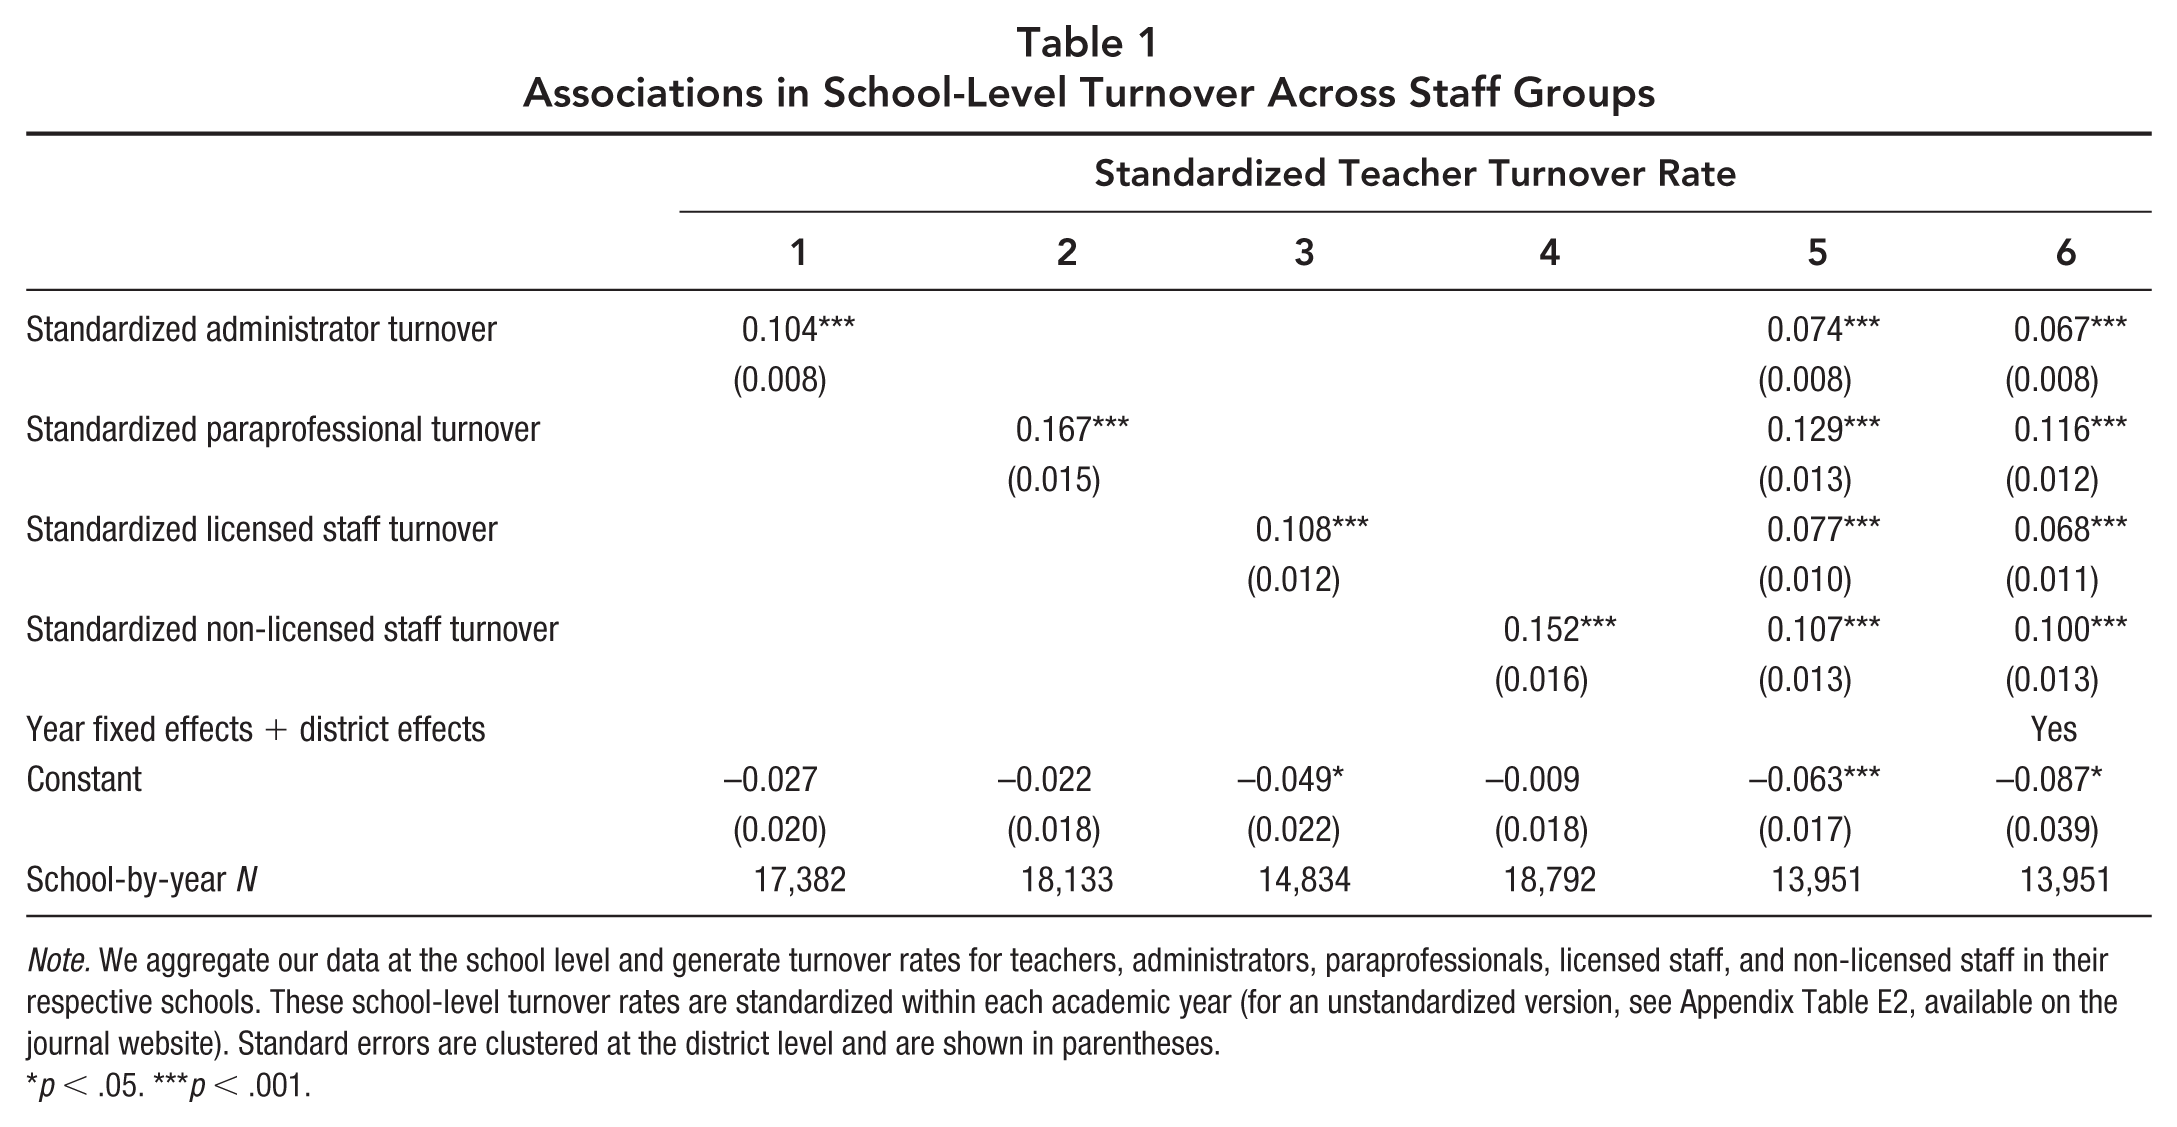
Note. We aggregate our data at the school level and generate turnover rates for teachers, administrators, paraprofessionals, licensed staff, and non-licensed staff in their respective schools. These school-level turnover rates are standardized within each academic year (for an unstandardized version, see Appendix Table E2, available on the journal website). Standard errors are clustered at the district level and are shown in parentheses.
p < .05. ***p < .001.
School Context, Staff Characteristics, and Turnover
We consider the relationship between employee turnover and context by examining turnover in schools with distinct student and staff populations. 12 Table 2 displays these percentages for teachers, administrators, paraprofessionals, licensed, and non-licensed staff separately and reports whether any differences by type of school are statistically significant after adjusting for multiple hypothesis testing. For teachers, we replicate previous work demonstrating that higher turnover is more common in schools with more historically underserved students. For example, the teacher turnover rate for schools in the top quartile of student poverty is 18.0%, compared to 15.2% for schools in the bottom quartile of student poverty. A similar pattern also holds relative to the proportion of students of color in the school. 13 Teacher turnover is also substantially higher in the lowest achieving schools (18.9% vs. 14.8% in the highest achieving schools). Because the average school has about 25 teachers, this implies that lower achieving schools lose one more teacher per year compared to higher achieving schools. Unsurprisingly, given the relationship between experience and turnover, schools with the most novice teachers have significantly higher turnover than schools with the fewest novices (19.9% vs. 13.8%). Teacher turnover is also higher in elementary and charter schools and in schools that had a new principal.
Turnover Rates by School and Employee Characteristics by Staff Group
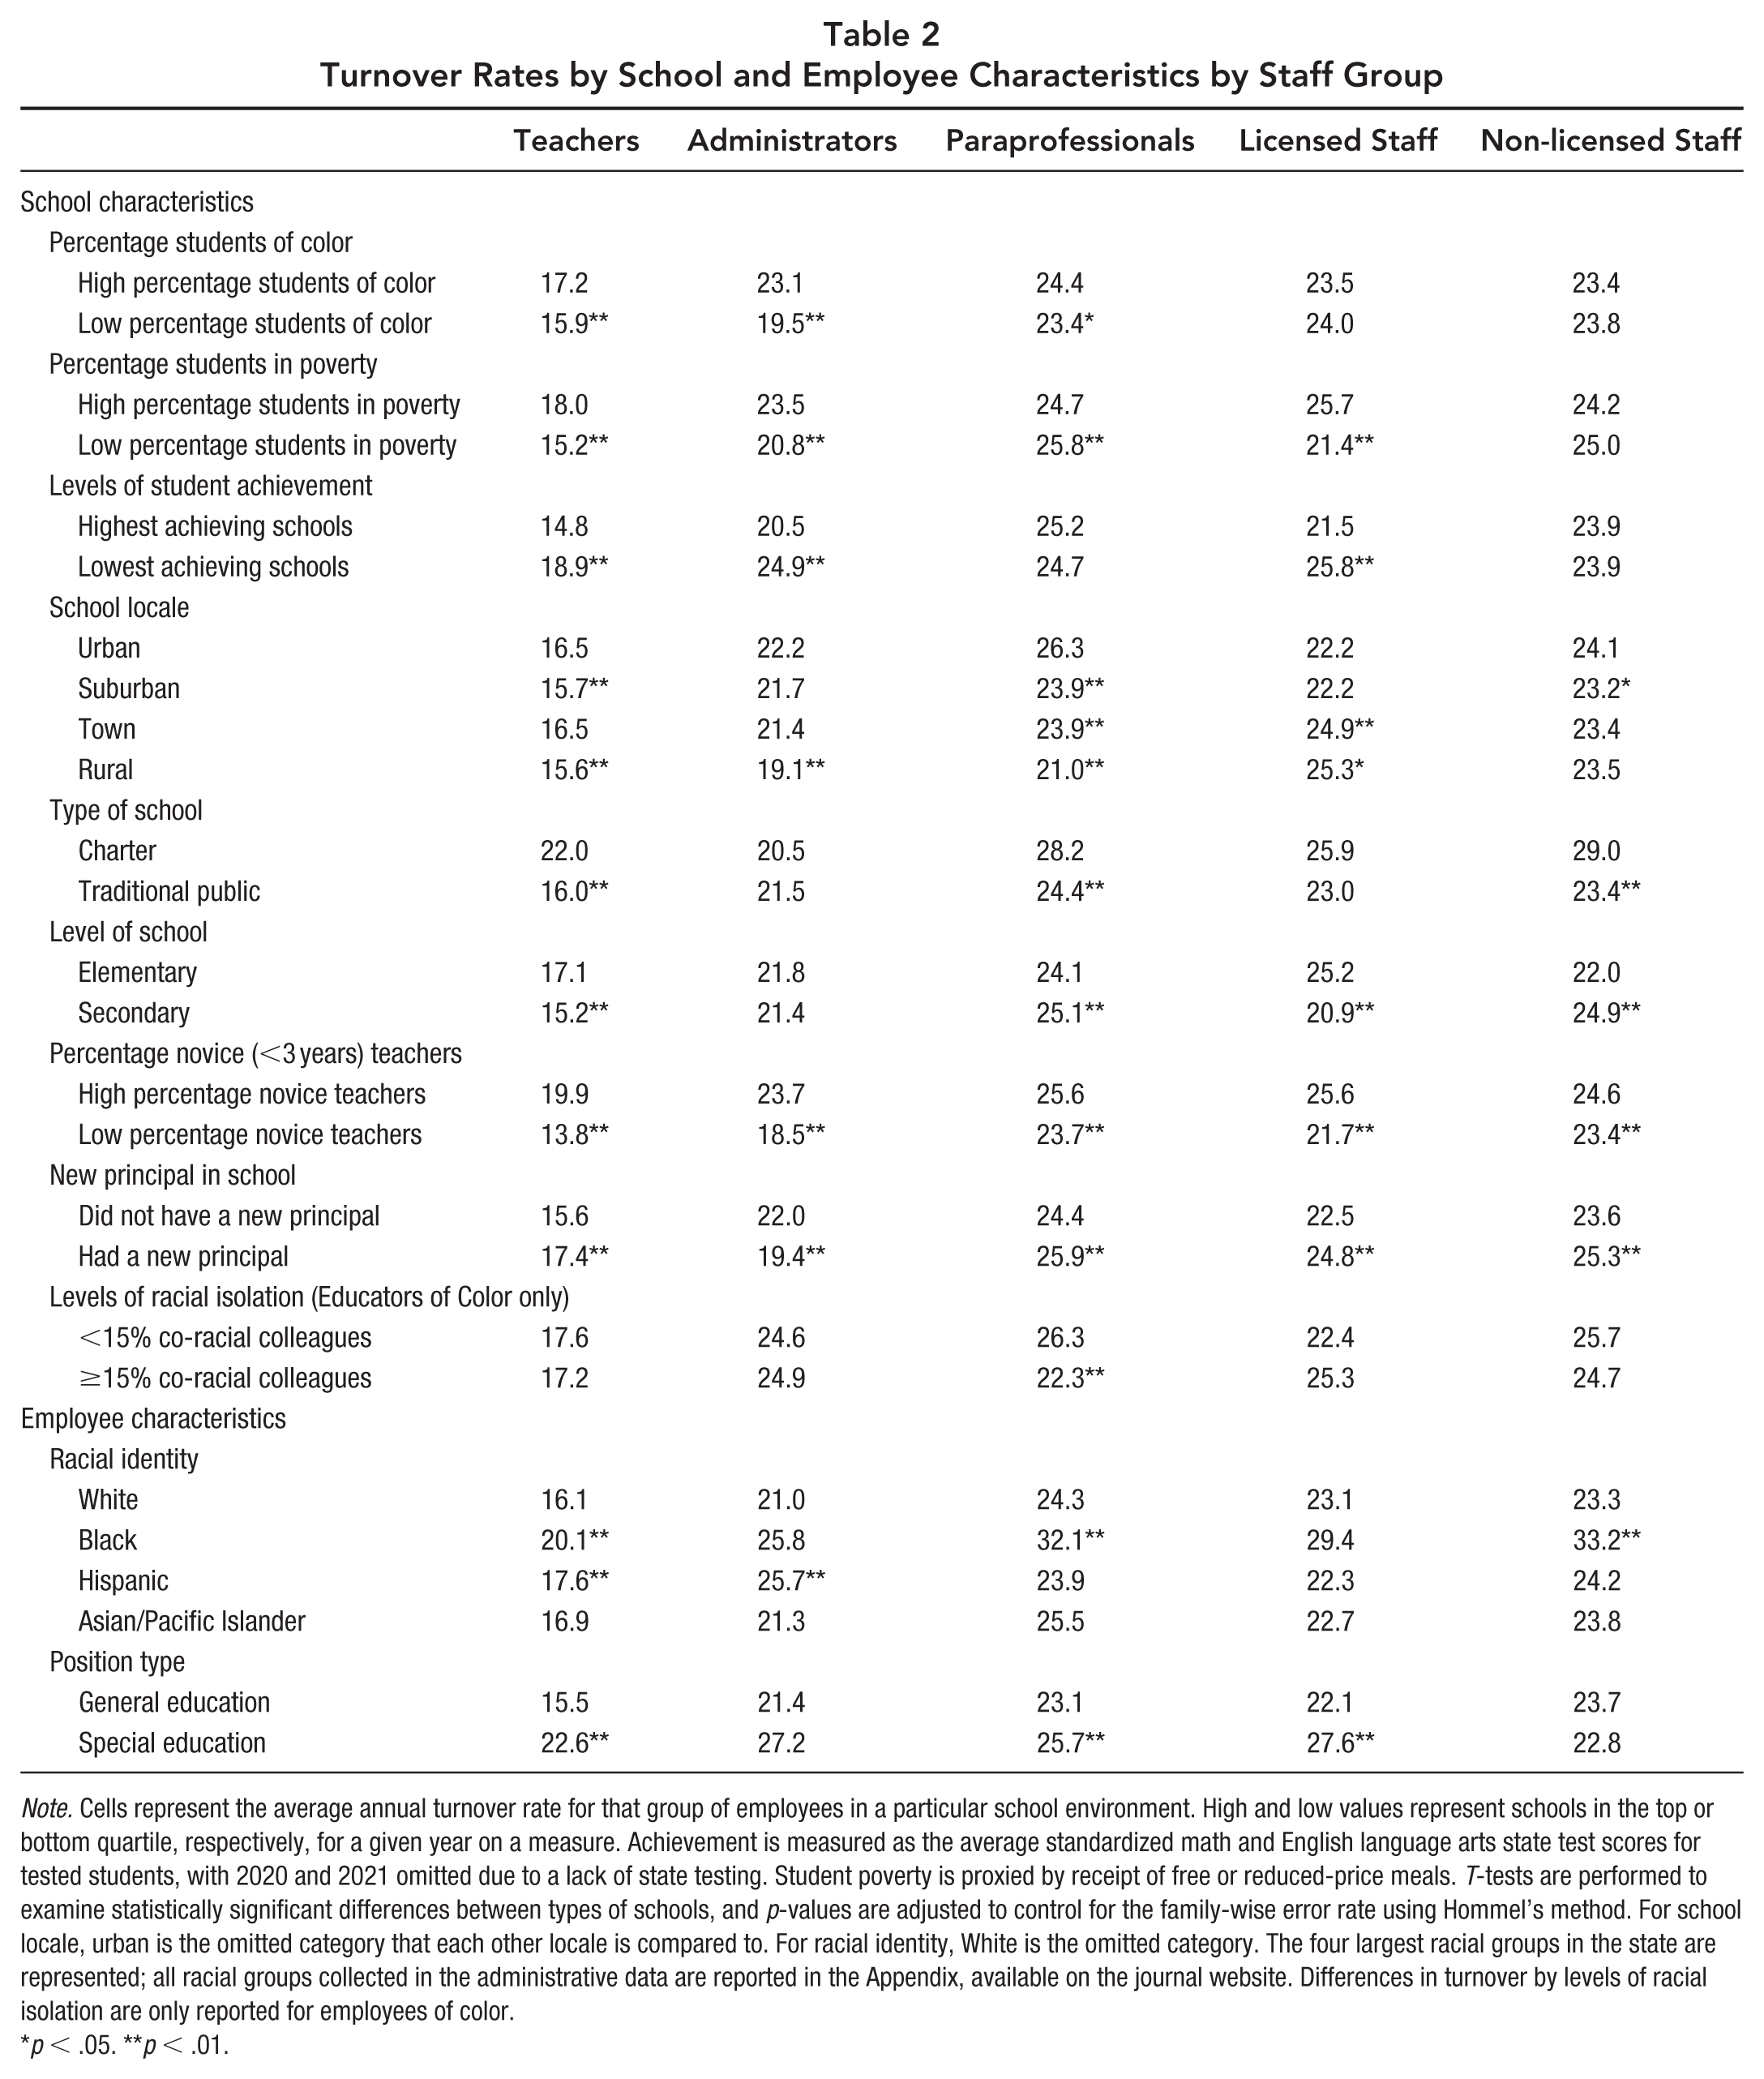
Note. Cells represent the average annual turnover rate for that group of employees in a particular school environment. High and low values represent schools in the top or bottom quartile, respectively, for a given year on a measure. Achievement is measured as the average standardized math and English language arts state test scores for tested students, with 2020 and 2021 omitted due to a lack of state testing. Student poverty is proxied by receipt of free or reduced-price meals. T-tests are performed to examine statistically significant differences between types of schools, and p-values are adjusted to control for the family-wise error rate using Hommel’s method. For school locale, urban is the omitted category that each other locale is compared to. For racial identity, White is the omitted category. The four largest racial groups in the state are represented; all racial groups collected in the administrative data are reported in the Appendix, available on the journal website. Differences in turnover by levels of racial isolation are only reported for employees of color.
p < .05. **p < .01.
The relationship between school context and turnover does not always follow the same pattern across other employee groups. For example, administrator turnover is also highest in schools with more students of color, higher levels of student poverty, and lower achievement. The same is true for licensed staff, with higher turnover in higher poverty and lower achieving schools. However, for non-licensed staff, there are no statistically significant differences in turnover rates by student poverty, race, or achievement. Among paraprofessionals, turnover is not different by levels of student achievement and is actually higher in lower poverty schools.
There are some areas where there is more consistency in turnover patterns across the staff groups. Similar to teachers, turnover is higher in charter schools among paraprofessionals and non-licensed staff, but for administrators, it is no different. One school factor that is consistently significantly associated with elevated turnover for all groups is the proportion of novice teachers (ranging from 2 to 5 percentage points higher depending on the group). Relatedly, turnover is about 1.5 percentage points higher for teachers, paraprofessionals, and other staff working in schools that had a new principal. 14
Another consistency across the groups is that employees of color tend to have higher turnover rates. Turnover is higher among Black and Hispanic teachers and administrators (although the difference is not statistically significant for Black administrators after adjusting for multiple hypothesis testing). For paraprofessionals and staff, turnover is similar among groups with the exception of Black employees, who have turnover rates that are nearly 10 percentage points higher. Being surrounded by more co-racial colleagues is associated with lower turnover among paraprofessionals of color but not for any of the other employees of color.
Regression models examining the relationship between school and individual characteristics and staff turnover (shown in Appendix Table F2.1, available on the journal website) show that after accounting for other school and individual characteristics, some relationships discussed previously remain consistent. 15 For example, having a new principal is positively associated with turnover among teachers, paraprofessionals, licensed staff, and non-licensed staff. However, some relationships change when controlling for correlated school and individual factors. For example, the percentage of novice teachers is positively associated with teacher and administrator turnover but not with the turnover of other employee groups. Additionally, after accounting for other factors, employees of color tend to have a lower likelihood of turnover, particularly among teachers, paraprofessionals, and non-licensed staff.
Appendix Table F3.1, available on the journal website, presents results from multinomial logistic regression models, highlighting how these relationships vary across different types of employee turnover. 16 For example, having a new principal is significantly associated with a higher likelihood of school switching across all employee groups but is not correlated with district switching for any group. Additionally, it is associated with a higher likelihood of leaving the state for teachers and non-licensed staff but not for paraprofessionals or licensed staff. Instead, features of the school geography are associated with district switching but not school switching or state exit.
In Appendix Table F4, available on the journal website, we examine turnover patterns by school context and staff characteristics before and after the onset of the pandemic. Although turnover increased for all employees in almost all types of schools, general patterns by school context are preserved, with a few notable exceptions, such as a surge in turnover among suburban schools.
Discussion and Conclusion
Millions of adults who are not teachers work in U.S. public schools. This rapidly increasing workforce represents a substantial societal investment in students’ academic and social development (Bisht et al., 2021), yet little research investigates the continuity of these employees on a broad scale. Given the well-documented concerns about teacher turnover (Ingersoll, 2001; Ronfeldt et al., 2013), it is important to understand the extent and nature of turnover for all public education employees, particularly as disappointing pandemic recovery efforts have raised concerns about the potential harms of staff churn (Lieberman, 2021). Schools, as organizations, fundamentally depend on the mutual cooperation of their various actors to achieve success in serving students (Frank et al., 2004), which regular employee turnover may disrupt. Our results using nearly 2 decades of public school employee data in Oregon reveal meaningful differences in attrition and mobility between the various kinds of educators serving students in schools that previous research has not fully documented.
Despite the considerable focus on teacher turnover in research and media (Goldhaber & Theobald, 2022, 2023; Ingersoll, 2001), teachers are the least likely to leave their jobs in Oregon, and their turnover has been relatively stable over time, mirroring patterns in stability found in other states, such as Washington (Goldhaber & Theobald, 2022). All other employee groups had annual turnover rates that were at least 2.5 percentage points higher, which, when scaled up across the state, translates to thousands more non-teaching employees leaving or moving each year. Moreover, turnover is only modestly correlated between employee groups within a school, and patterns of turnover by school context are not consistent across groups. However, turnover is higher for all groups in schools with many novice teachers or a new principal. That paraprofessionals and non-licensed staff are more racially diverse and, unlike teachers and administrators, generally have similar or lower turnover rates in more historically underserved schools should be encouraging to states and districts pursuing grow-your-own programs looking to transition these employees into teaching roles (Camp et al., 2024b; Gist et al., 2019). This variability in turnover also suggests that different policy solutions are needed to increase retention of different types of staff and that these solutions may be sensitive to varied economic conditions in different regions of the state. An important limitation of our study is that we lack direct working-condition measures that could better inform such retention policy efforts.
Nearly all of Oregon’s employee groups experienced 20-year highs in turnover between 2022 and 2023. This suggests that surging post-pandemic turnover documented among teachers across states may apply to school employees more broadly (Bastian & Fuller, 2023; Gilmour et al., 2024; Goldhaber & Theobald, 2023). Thus, as schools are working to help students make up for unfinished learning after the pandemic and grappling with soaring absenteeism (Dee, 2024), they may also be experiencing unprecedented levels of churn among all different types of employees, further frustrating learning recovery efforts. Whether these elevated levels of churn will persist is an open question. Initial evidence suggests that teacher turnover is still higher than prior to the pandemic (Camp et al., 2024a), although it is worth noting that the education field still has substantially lower churn than almost every other sector (Bureau of Labor Statistics, as cited in Aldeman, 2025).
Recent levels of school employee turnover raise questions about how schools might improve retention for a broad set of staff. Although turnover sometimes includes removing undesired employees or responses to budget shortfalls, school leaders would like to reduce turnover where possible. A large body of work examines the efficacy of interventions, mostly surrounding financial compensation, aimed at improving retention among teachers (e.g., Adnot et al., 2017) but not other school employees. More research is needed to understand the interventions and conditions that best promote school employee retention and the economic alternatives they face (cf. Brummet et al., 2025).
Our nation’s schools rely on many adults to promote student success, an increasing number of whom are not teachers. Yet their contributions to school environments are rarely visible in research. Our findings make clear that staff turnover is not teacher turnover; patterns meaningfully vary by groups even within the same school. Understanding the variation within this vast sector will be key to supporting them in their service of our students.
Supplemental Material
sj-pdf-1-edr-10.3102_0013189X261419503 – Supplemental material for Revolving School Doors? A Longitudinal Examination of Teacher, Administrator, and Staff Contributions to School Churn
Supplemental material, sj-pdf-1-edr-10.3102_0013189X261419503 for Revolving School Doors? A Longitudinal Examination of Teacher, Administrator, and Staff Contributions to School Churn by Emily K. Penner, Yujia Liu and Aaron J. Ainsworth in Educational Researcher
Footnotes
This research was supported by the National Institute of Child Health and Human Development (Grant No. R01HD094007), the Institute of Education Sciences (Award No. R305C180025), and the National Academy of Education (the National Academy of Education/Spencer Dissertation Fellowship Program). The authors would like to thank seminar and conference participants from University of California, Irvine’s Center for Administrative Data Analysis, University of California, Irvine’s Education Policy and Social Context Lab, the Association of Education Finance and Policy, and the Association of Public Policy Analysis and Management for their feedback and the Oregon Educator Advancement Council for their partnership and support of this research.
Notes
Authors
EMILY K. PENNER, PhD, is associate professor of education policy and social context in the School of Education at the University of California, Irvine, 3200 Education Bldg., Irvine, CA 92697;
YUJIA LIU, PhD, is a postdoctoral fellow in the Department of Educational Leadership and Policy Analysis at the University of Missouri, 118 Hill Hall, Columbia, MO 65211;
AARON J. AINSWORTH, MEd, is a PhD student in education policy at the University of California, Irvine, 3200 Education Bldg., Irvine, CA 92697;