
Abstract
We examine effects of the pandemic on student attendance, course grades, and grade retention in North Carolina in 2020–2021 and 2021–2022 using descriptive and regression analyses. We find each outcome worsened on average in 2020–2021, with larger changes at the high end of the absence distribution, the low end of the grade distribution, and among historically marginalized student groups. In 2021–2022, grade and retention outcomes recovered, but attendance worsened. Furthermore, gaps between students narrowed, driven by greater recovery in grades for students who were initially most negatively impacted but worsening absenteeism among students who initially maintained high attendance. These findings highlight the substantial variation in impacts of the pandemic across students and differing patterns of impact and recovery across outcomes.
Keywords
In March 2020, schools across the United States closed their doors and pivoted to remote learning in response to the COVID-19 pandemic. Students experienced economic upheaval, isolation, a public health crisis, and a mixture of remote, hybrid, and in-person instruction. Research has begun to provide a clearer picture of the impact of the pandemic on students’ learning. Several studies have documented lower test scores and reduced growth in scores across tested grades and subjects, with larger impacts for vulnerable groups (Goldhaber et al., 2022; Irwin et al., 2022; Kuhfield et al., 2022; Kwakye & Kibort-Crocker, 2021; Lipscomb et al., 2023; Miller & Schueler, 2022; North Carolina Department of Public Instruction [NCDPI], 2022).
Test scores are an important measure of academic progress, but they also have limitations. Test scores are available for limited grades and subjects—often, primary grades reading and math and selected subjects in high school. They also provide only a snapshot of students’ learning and can be affected by test preparation, test anxiety, and student well-being on the day of the test (Figlio & Winicki, 2005; Heissel et al., 2021). Other outcomes are often equally important. For example, course grades are used in college admissions and can be better predictors of postsecondary success (Allensworth & Clark, 2020; Bowers et al., 2013; Easton et al., 2017; Galla et al., 2019).
A comprehensive understanding of the impact of the pandemic requires examining a range of education outcomes. To complement the existing literature around pandemic effects on test scores, we focus on three sets of outcomes that offer insight into students’ engagement with school and opportunity to learn—attendance, course grades, and grade retention. Our primary aims are to identify how the pandemic shaped these measures of engagement and opportunity overall, the extent to which impacts were distributed unevenly across the student population, and how these outcomes evolved over the first 2 postpandemic years. To do so, we examine changes in the means and distributions of these outcomes using data on all students attending traditional public schools in North Carolina from 2015–2016 to 2021–2022.
We first find a large and statistically significant average effect of the pandemic on all measured outcomes in 2020–2021. During this year, absences increased, average grades fell, and course failures and grade retention became more common. Second, we find that existing gaps in these outcomes grew, with the largest impacts concentrated at the top of the absence distribution, the bottom of the grade distribution, and among historically marginalized groups of students. Third, we find that these outcomes evolved differently over time. By 2021–2022, grades, course failures, and grade retention returned to close to prepandemic levels, but measures of absenteeism continued to worsen, on average. Furthermore, gaps in impacts across groups narrowed in 2021–2022 compared to 2020–2021 for all outcomes. For grades, failures, and retention, this narrowing was driven by larger recovery for student groups that had been most negatively affected in 2020–2021. By contrast, for absences, the narrowing of gaps was driven largely by increases in absences among student groups that had maintained high attendance rates in 2020–2021.
Background
Pandemic-Related Disruptions
The scale of the pandemic is beyond anything in the experience of modern educational systems. The acute effects of the COVID-19 pandemic include direct disruption of schooling due to school closures and moves to hybrid or remote schooling. Students also missed school due directly to illness, quarantine, and isolation periods from COVID-19. Data show that on average, students had fewer hours of schooling (Esposito & Principi, 2020; Kwakye & Kibort-Crocker, 2021; U.S. Department of Education, 2022). In addition, students experienced other acute impacts of the COVID-19 pandemic, including social isolation, loss of family income, illness and deaths in the family, and increased family responsibilities. These acute impacts may have indirectly affected student engagement with and success in school.
Longer-term impacts of the COVID-19 pandemic may also affect educational outcomes. These impacts may include mental health impacts, disengagement from school, changing norms around school attendance, increased use of technology, and impacts on educators. The extent and prevalence of long-term effects is more challenging to measure. However, evidence shows that children and adolescents suffered increased mental health concerns (Viner et al., 2022). Educators expressed concerns about student disengagement from school (Guillaume et al., 2022; Kwakye & Kibort-Crocker, 2021). Educator attrition also increased in some places (Bastian & Fuller, 2023). In addition, schools continued to grapple with the need to remediate learning loss accumulated during the most acute part of the pandemic.
The relative prevalence of acute versus long-term effects from the pandemic changed over time, with acute effects most prevalent in 2019–2020 and 2020–2021. In spring 2020, all but two states closed public schools for in-person learning for the remainder of the school year (Education Week Staff, 2021). In 2020–2021, approximately 80% of students nationwide began the school year in remote or hybrid learning (Burbio, n.d.). During this same period, unemployment spiked, and death rates from COVID-19 were high. From 2021–2022 onward, the acute impacts of the pandemic became more limited, and longer-term effects became more primary concerns. Nearly all schools returned to in-person schooling by fall 2021 (Burbio, n.d.). Although individual quarantines or COVID-19-related school closures continued, this impact was more limited.
Both acute and long-term impacts were not distributed equally. Economically disadvantaged students (EDSs) and students of color (SOC) were more likely to be exposed to COVID-19 and job loss or death in the family and to lack access to reliable internet for remote learning (Gemelas et al., 2022; Mackey et al., 2021; Stelitano et al., 2020). Different groups of students also had different levels of exposure to remote or hybrid learning (Esposito & Principi, 2020; Goldhaber et al., 2022). These differences across students, communities, and schools have evolved over time and call for a nuanced approach to understanding pandemic effects on education.
Pandemic Impacts on Outcomes
Pandemic effects on student test scores have received the most research focus. Nationwide and state-specific studies have documented substantially lower test scores in the 2020–2021 school year (Goldhaber et al., 2022; Irwin et al., 2022; Kuhfield et al., 2022; Kwakye & Kibort-Crocker, 2021; Lipscomb et al., 2023; Miller & Schueler, 2022; NCDPI, 2022). These studies also found that test score losses were larger for vulnerable groups, including high-poverty schools and SOC. Additionally, some studies show that the bottom end of the test score distribution dropped more significantly than the upper end (Kuhfield et al., 2022). Research that followed test scores into subsequent years has shown test scores closer to prepandemic norms (Halloran et al., 2023; Kuhfield et al., 2022), although most studies show that scores remain lower than before the pandemic.
Following test scores, attendance is one of the most studied student outcomes in the wake of the pandemic. Although attendance was more challenging to track during remote learning, reports from across the country have identified increases in chronic absenteeism rates in 2021–2022 and 2022–2023 (Chang et al., 2022; Dee, 2024; Gee et al., 2023; Lenhoff & Singer, 2022). A few studies also note that absences increased more among marginalized groups, including Black and Hispanic students (Fuller et al., 2023; Ohio DOEW, 2021). However, evidence for how the overall attendance distribution changed is limited. For example, it is unclear whether increased chronic absences represent a general increase in absences or more limited changes.
Evidence on other outcomes is limited. A small number of studies on student grades produced mixed evidence, with some studies finding increases in failure and others finding stable grades in 2020–2021 (Gwynne et al., 2022; Kwakye & Kibort-Crocker, 2021). More recent studies have provided evidence that as schools have returned to regular instruction, student grade point averages (GPAs) have either risen or remained relatively stable on average despite continued achievement losses (Goldhaber & Young, 2023; Sanchez, 2023; Swiderski & Fuller, 2023).
There is much more to be learned about pandemic impacts across different student outcomes and how those impacts vary across student subgroups and over time. This is especially true given that most studies focus on a single outcome, leaving questions about how different outcomes may tell different stories in the same population of students.
About This Study
This study adds to the literature by looking at a set of related outcomes—attendance, grades, and grade retention—that provide insight into students’ experiences, opportunities to learn, and performance in school. We focus on these outcomes because they measure distinct aspects of schooling relative to test scores, and by illuminating these measures and comparing across them, we can increase our understanding of students’ experiences during the pandemic.
Student attendance is often used as a proxy for engagement, but lower attendance can also reflect barriers to access. When pandemic effects were most acute (2020–2021), attendance was likely affected directly by illness and indirectly by remote learning situations. Remote learning may have had mixed effects on attendance. For example, poor internet connectivity and disengagement from virtual learning may have decreased attendance, but the ability to attend school while mildly ill may have increased attendance. Continuing changes in attendance as students returned to in-person learning may reflect student illnesses, disengagement from school, changing social norms around schooling, increased utilization of virtual options, or economic hardship.
Meanwhile, grades are influenced by a combination of students’ engagement with school, participation in classes, and learning (Galla et al., 2019; Gwynne et al., 2022). Learning loss induced by the pandemic would be expected to decrease students’ grades. Furthermore, many of the disruptions caused by the pandemic could also decrease students’ engagement and participation. However, changes, such as slower instructional pacing, access to free meals, and less exposure to peer conflicts, may have increased grades (Bacher-Hicks, et al., 2022; Fuller et al., 2021). Furthermore, teachers might adjust their grading expectations (Goldhaber & Young, 2023; Sanchez, 2023; Swiderski & Fuller, 2023). Negative impacts on grades may also lead students to fail courses. Failing grades impede students’ ability to make progress and be promoted in school. An increase in course failures and grade retention would mean that a set of students may no longer be on track to complete school as previously expected.
These measures are important in their own right, and by comparing these measures to each other and to student test scores, which have been examined by other researchers (NCDPI, 2022), we can learn more about the pandemic period. In particular, test scores are cumulative (i.e., learning loss may continue to influence test scores in subsequent years), absences in a given school year are not at all directly affected by impacts in prior years, and grades may be less affected. These differences can help to distinguish lingering acute effects from which students have not yet recovered versus longer-term effects that continue to affect school performance.
In combination, through these outcomes, we aim to provide a clearer picture of students’ diverse engagement and learning experiences in 2020–2021 and 2021–2022. We specifically answer the following research questions:
Research Question 1: How did pandemic-related disruptions affect student attendance, course grades, and grade retention in 2020–2021 and 2021–2022?
Research Question 2: How did impacts vary across different subgroups of students?
Research Question 3: How did impacts change from 2020–2021 to 2021–2022?
Data
Our data come from a longitudinal database of student-level administrative data provided by the NCDPI. The data include student demographics, enrollments, attendance, test scores, course grades, and program participation and school characteristics, including the average number of days students attended remotely in 2020–2021. We focus on students enrolled in North Carolina traditional public schools (NC TPS) between 2015–2016 and 2021–2022. 1 This includes more than 1.5 million students annually across the 5 years. We drop less than 2% of students who are missing data on any covariate.
North Carolina is an ideal setting for this study. It is a large state with a diverse population by race/ethnicity, urbanicity, and economic status (for summary statistics, see Appendix Table 1 available on the journal website). The state also mirrored much of the country in pandemic response policies. For example, all students were eligible to receive free school meals in 2020–2021 and 2021–2022, and schools began the 2020–2021 year in remote or hybrid instruction, with more in-person instruction as the year progressed. As in other states, districts in North Carolina took different approaches to instruction and recovery.
We compare outcomes in 2020–2021 and 2021–2022 to the prepandemic years of 2015–2016 through 2018–2019. We omit 2019–2020 because emergency response measures in spring 2020 (e.g., pass/fail grading) resulted in outcomes that are not comparable to other years. Appendix Table 1 (available on the journal website) shows descriptive statistics, including average outcomes, for students in our sample during the prepandemic period, 2020–2021, and 2021–2022. Similar to prior research (Fuller & Bastian, 2021), we see a small reduction in the percentage of students in grades K–5 and White students between the prepandemic period and 2020–2021, but other characteristics remain relatively stable. 2 The percentage of students in grades K–5 rebounded slightly in 2021–2022, whereas the percentage of White students fell slightly.
Our outcomes of interest are attendance, course grades, and grade retention. We measured attendance in two ways: (a) the percentage of days the student was absent of total days enrolled and (b) an indicator of whether the student was chronically absent—missing 10% or more of total days enrolled. We examined absence outcomes for students at all grade levels with at least 80 days enrolled (97.5% of all students). We used two measures of course grades: (a) the annual unweighted GPA the student earned across all courses taken in a given year, where a student earns 4 points for an “A,” 3 for a “B,” 2 for a “C,” 1 for a “D,” and 0 for an “F,” 3 and (b) an indicator of whether the student failed one or more courses during the school year. Course failures and GPAs are available for middle and high school students (sixth grade and above). Finally, we used a single measure of grade retention—an indicator for whether a student in a particular grade appeared in the same grade the subsequent year.
One limitation of this study is potential changes in the measurement of absences and grades in the 2020–2021 and/or the 2021–2022 school year. The collection of attendance data during remote learning, in particular, may have been approached differently than during in-person schooling and differently between schools. Grade measurement may also have been influenced by policies at the school, district, or individual teacher levels intended to provide leniency to students during the pandemic. Using data from the 2020–2021 school year, we identify approximately 4.4% and 1.3% of schools as outliers that reported atypically low absences or atypically high grades, respectively. 4 To the extent that these changes occurred, our estimates may represent an underestimation of the true impact of the pandemic on student outcomes.
A second limitation is that the pandemic directly affected some key measures, including economic disadvantage, which was measured less consistently in 2020–2021 due to a universal free lunch policy. We examined different approaches to measuring economic disadvantage, but all yielded substantively similar outcomes. In addition, regression results are very similar to descriptive differences across time (see Appendix Tables 1 and 2 available on the journal website).
Methods
We employed a combination of descriptive and regression analyses to assess pandemic-related impacts on attendance, course grades, and grade retention. First, we calculated the statewide average for each outcome in 2020–2021 and 2021–2022 compared to prepandemic averages. This basic examination of overall changes is a simple but powerful way to begin to understand changes relative to prepandemic baselines, variation across outcomes, and variation between 2020–2021 and 2021–2022.
Second, we focused on changes in the distribution of our two continuous outcomes—percent of days absent and GPA. We generated quantile plots of each outcome in 2018–2019, 2020–2021, and 2021–2022. This analysis allows us to identify whether average changes represent general shifts cross the distribution or were more concentrated. We also looked at changes in the joint distribution of absences and grades by dividing each outcome into categories. We grouped annual GPAs into three categories, with the highest category corresponding to a letter grade of “A,” the second category encompassing letter grades “B” and “C,” and the third category encompassing letter grades “D” and “F.” For absences, we created five categories: less than 2.5% of days absent, 2.5% to 5% of days absent, 5% to 7.5% of days absent, 7.5% to 10% of days absent, and greater than 10% of days absent. We then calculated the percentage of students in each combination of GPA and absence categories.
To account for modest shifts in the composition of students enrolled in the NC TPS, we validated the patterns of changes we observe descriptively using regression analyses. We estimated ordinary least squares (OLS) regressions for each outcome and quantile regressions for the two continuous outcomes. These models control for (a) student-level background variables, including sex, race/ethnicity, economic disadvantage status interacted with school Community Eligibility Provision status, disability status, English learner (EL) status, and grade level; (b) school-level urbanicity and percentage non-White; and (c) a linear time trend to account for preexisting patterns of growth or decline in outcomes over time (e.g., GPA inflation). 5 Specifically, for student i in school s and year t, we estimated:

where PERIODist is a categorical variable indicating whether the observation is pre-COVID (2015–2016 through 2018–2019), in 2020–2021, or in 2021–2022; Xist represents the vector of student-level background covariates; Schoolist is a vector of characteristics of the student’s school; Timet represents the linear time trend; and εit is an error term. The coefficients on PERIODist identify the deviation from prepandemic in the pandemic-impacted years of 2020–2021 and 2021–2022 net of the effects of changes in student composition or time trends across time. Coefficients from OLS regressions provide changes in the mean of each outcome, and quantile regressions estimate changes at the 10th, 25th, 50th, 75th, and 90th percentiles. We adjust standard errors to account for clustering within schools. These analyses (shown in Appendix Tables 3 and 4 available on the journal website) show that introducing controls produces estimates that are only minimally different from descriptive results.
For the final section of our analyses, we further explore how changes in outcomes were distributed across students and schools with different characteristics. We examine changes in means across student subgroups defined by race/ethnicity, economic disadvantage, EL status, disability status, and grade level and across school subgroups defined by school urbanicity, school percentage SOC, and school percentages of days in remote learning in 2020–2021. We dichotomize school percentage SOC and school days remote into low and high groups, defined as being above or below the median in 2018–2019 for SOC and in 2020–2021 for days remote (for descriptive means and quantiles by subgroup and time period, see Appendix Tables 3, 5, and 6 available on the journal website). 6
For each subgroup, we repeated the models described in Equation 1 with the sample restricted to members of the focal subgroup. 7 For example, we reestimated Equation 1 once restricted to only Black students, then restricted to only Hispanic students, and then restricted to only White students. In each model, we include all other student-level covariates represented by the Xist vector, the Schoolist vector, and the linear time trend (e.g., when estimating impacts for Black students, we include controls for sex, economic disadvantage status, etc.). 8 Coefficient estimates shown in the coefficient plots in the following and in Appendix Table 4 available on the journal website refer to estimates on the β1 term from separate models for each group.
Results
Statewide Average Effects
Figure 1 shows the unadjusted statewide average for each outcome for prepandemic (2018–2019), 2020–2021, and 2021–2022. In 2020–2021, all outcomes worsened from prepandemic. The average percentage of days absent increased more than 50%, from 5.59% of days to 8.34%, and the percentage of students chronically absent nearly doubled, from 13.4% to 23.8%. At the same time, annual GPAs in 2020–2021 were nearly half a point lower, moving from a “B” average to between a “C+” and a “B–.” The percentage of students who failed at least one course more than doubled, from 18.5% to 37.7%, and the percentage who were retained in grade increased nearly 50%.
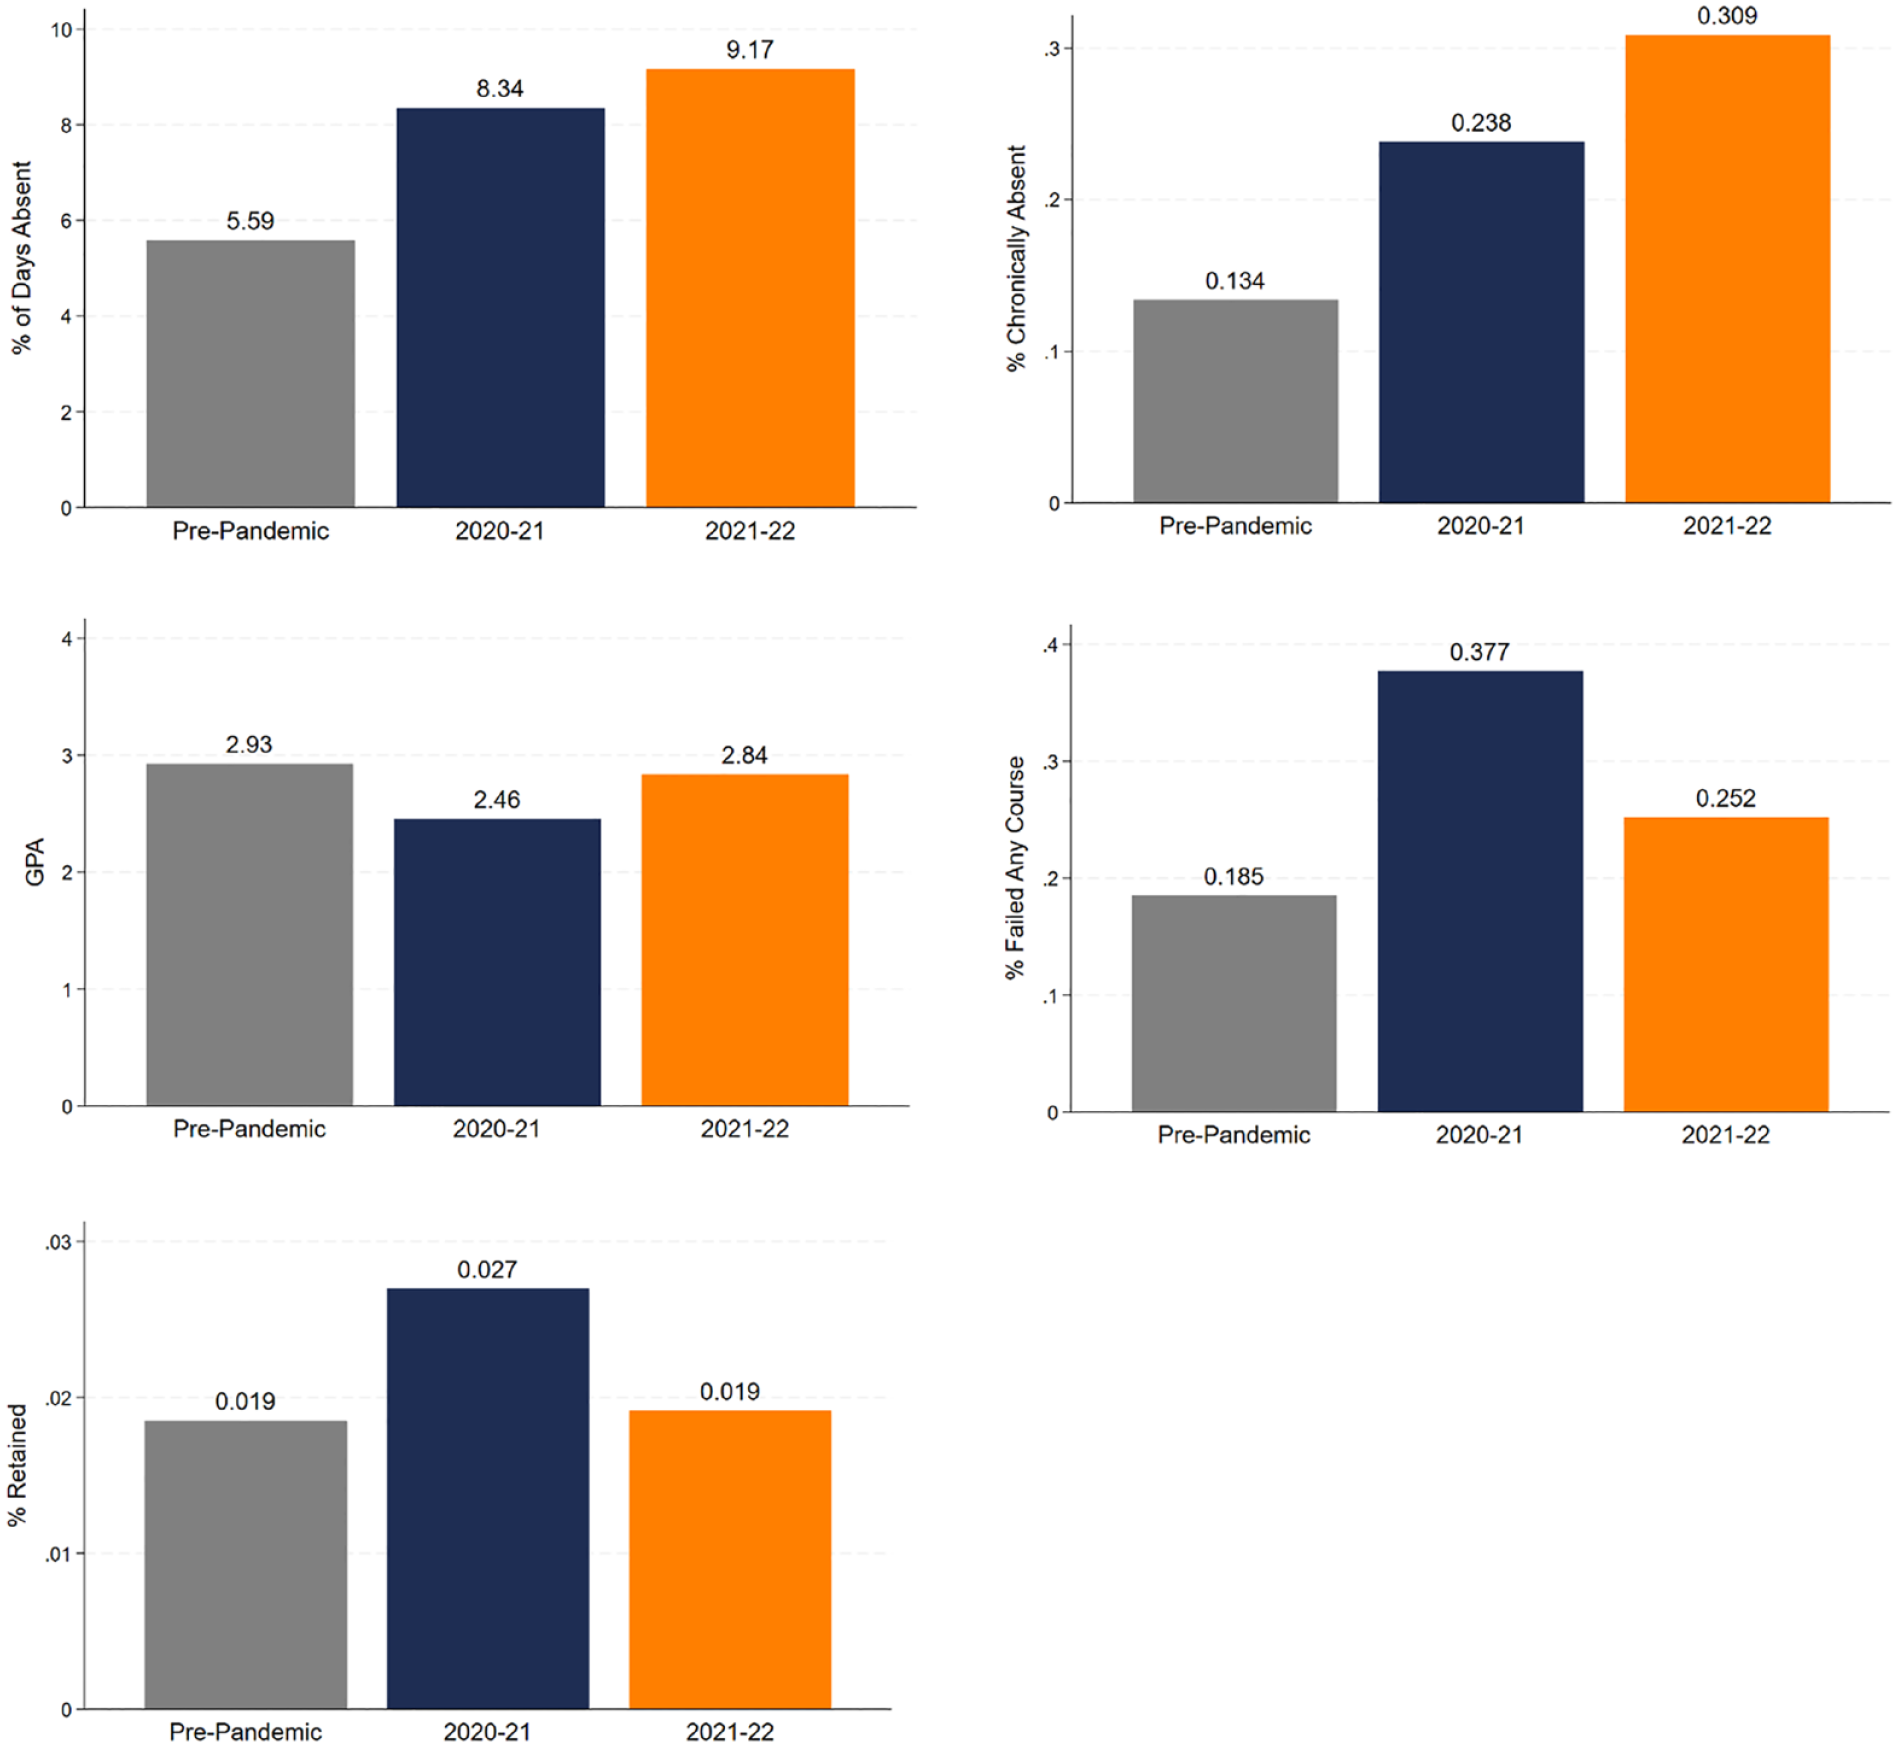
Change in absences, chronic absences, grade point averages, course failures, and grade retention from 2018–2019 to 2020–2021 and 2021–2022.
In contrast, the changes in 2021–2022 compared to prepandemic were more mixed. In 2021–2022, the percentage of days absent and the rate of chronic absences were very high compared to prepandemic—9.17% and 31.9%, respectively—and showed additional increases from 2020–2021. Conversely, GPAs, course failures, and grade retention all showed improvements between 2020–2021 and 2021–2022. Average GPAs remained 0.10 points below prepandemic levels, and the percentage of students failing at least one class was 6.7 percentage points higher than prepandemic. Grade retention, however, had returned to prepandemic levels of 1.9%. Compared to the consistent changes in 2020–2021, descriptive results for 2021–2022 portray recovery for some outcomes and continued decline for others. The remainder of our analyses more deeply explore these divergent patterns across years and outcomes.
Effects Across the Distribution of Outcomes
Figure 2 plots every fifth quantile from the fifth through 95th percentiles of percentage of days absent (top) and GPA (bottom) in 2018–2019, 2020–2021, and 2021–2022 (see also Appendix Table 6 available on the journal website). The top panel shows that the average increase in percentage of days absent from 2018–2019 to 2020–2021 was driven by large increases at the high end of the distribution. From 2018–2019 to 2020–2021, the 75th percentile of days absent increased 2.4 percentage points, and the 90th percentile doubled from a baseline of 11.5% of days missed. By contrast, the percentage of days absent at the 10th, 25th, and 50th percentiles decreased by small amounts. Thus, during the 2020–2021 school year, most students were in attendance as much or more than prepandemic, and a small number of students missed much more school.
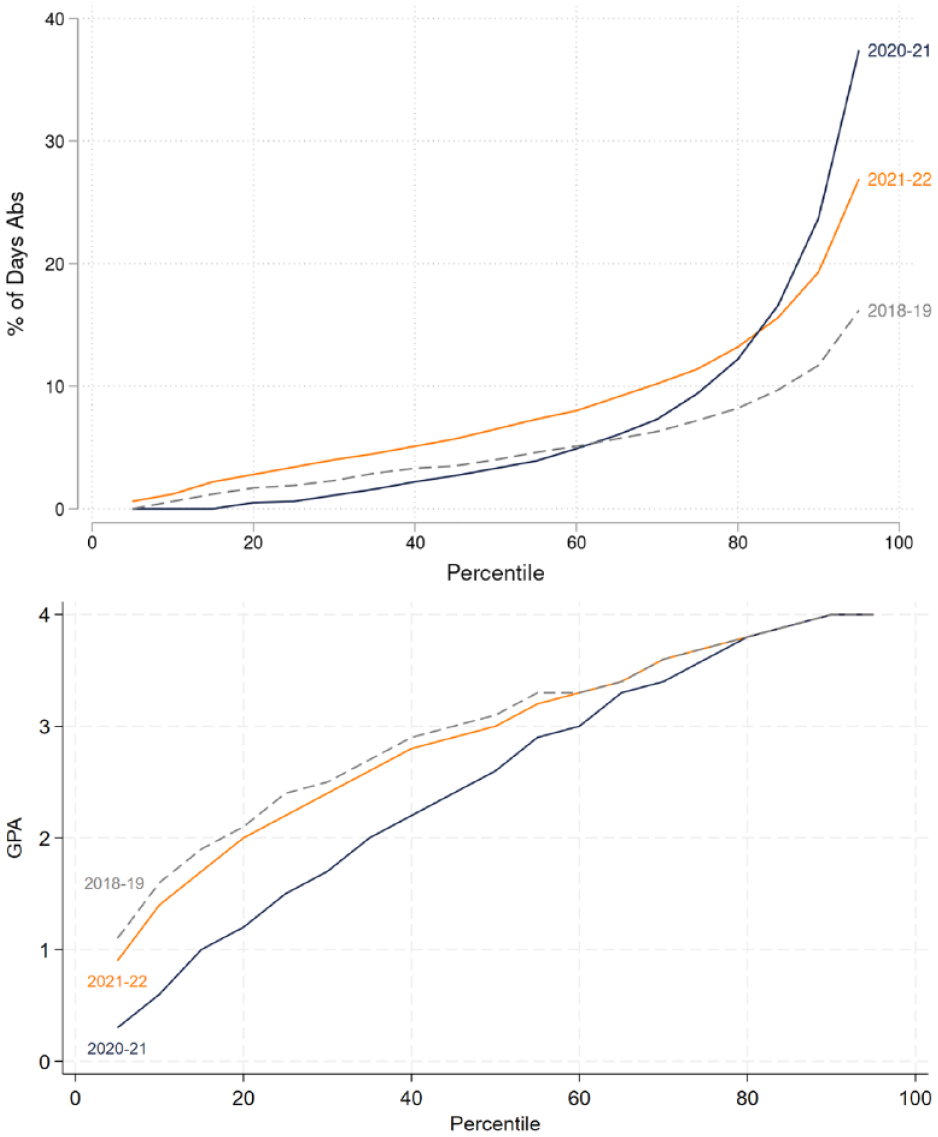
Descriptive quantiles of percentage of days absent and grade point average (GPA), 2018–2019 versus 2020–2021 and 2021–2022.
In 2021–2022, the distribution narrowed from the prior school year. The percentage of school days missed by students at the 10th, 25th, and 50th percentiles increased between 1.2 and 3.2 percentage points to above prepandemic levels. The 75th percentile also increased in 2021–2022 to 11.4%, a 4.4 percentage point increase from prepandemic. In contrast, the percentage of days absent at the 90th percentile decreased by 4.4 percentage points from 2020–2021 to 2021–2022 but remained elevated relative to prepandemic. Compared to prepandemic, students at every point in the distribution were absent more in 2021–2022.
Changes in the distribution of GPAs (Figure 2, bottom) in 2020–2021 were also concentrated at one end of the distribution. At the median (50th percentile), GPAs fell 0.5 points in 2020–2021, roughly the difference between a “B” and a “B–” average. At the 25th and 10th percentiles, the change in GPAs in 2020–2021 was even larger, equivalent to a decrease of a letter grade on average. The reduction in grades resulted in average grades equivalent to a “D+” for students at the 25th percentile and an “F” for students at the 10th percentile. However, changes compared to prepandemic at the 75th and 90th percentiles—the highest course grades—were very small in 2020–2021. In 2021–2022, the 75th and 90th percentiles again remained virtually unchanged from prepandemic, whereas grades at the 10th, 25th, and 50th percentiles rebounded to near prepandemic levels.
Although we have discussed them separately to this point, grades and absences are often correlated because students who attend more often are better able to participate in class, complete assignments, and learn the material. Figure 3 shows how students are distributed across joint categories of absences and grades in 2018–2019 (top), 2020–2021 (middle), and 2021–2022 (bottom). In each panel, the five clusters of bars represent different categories of days absent, and the individual bars in each cluster represent GPA categories.
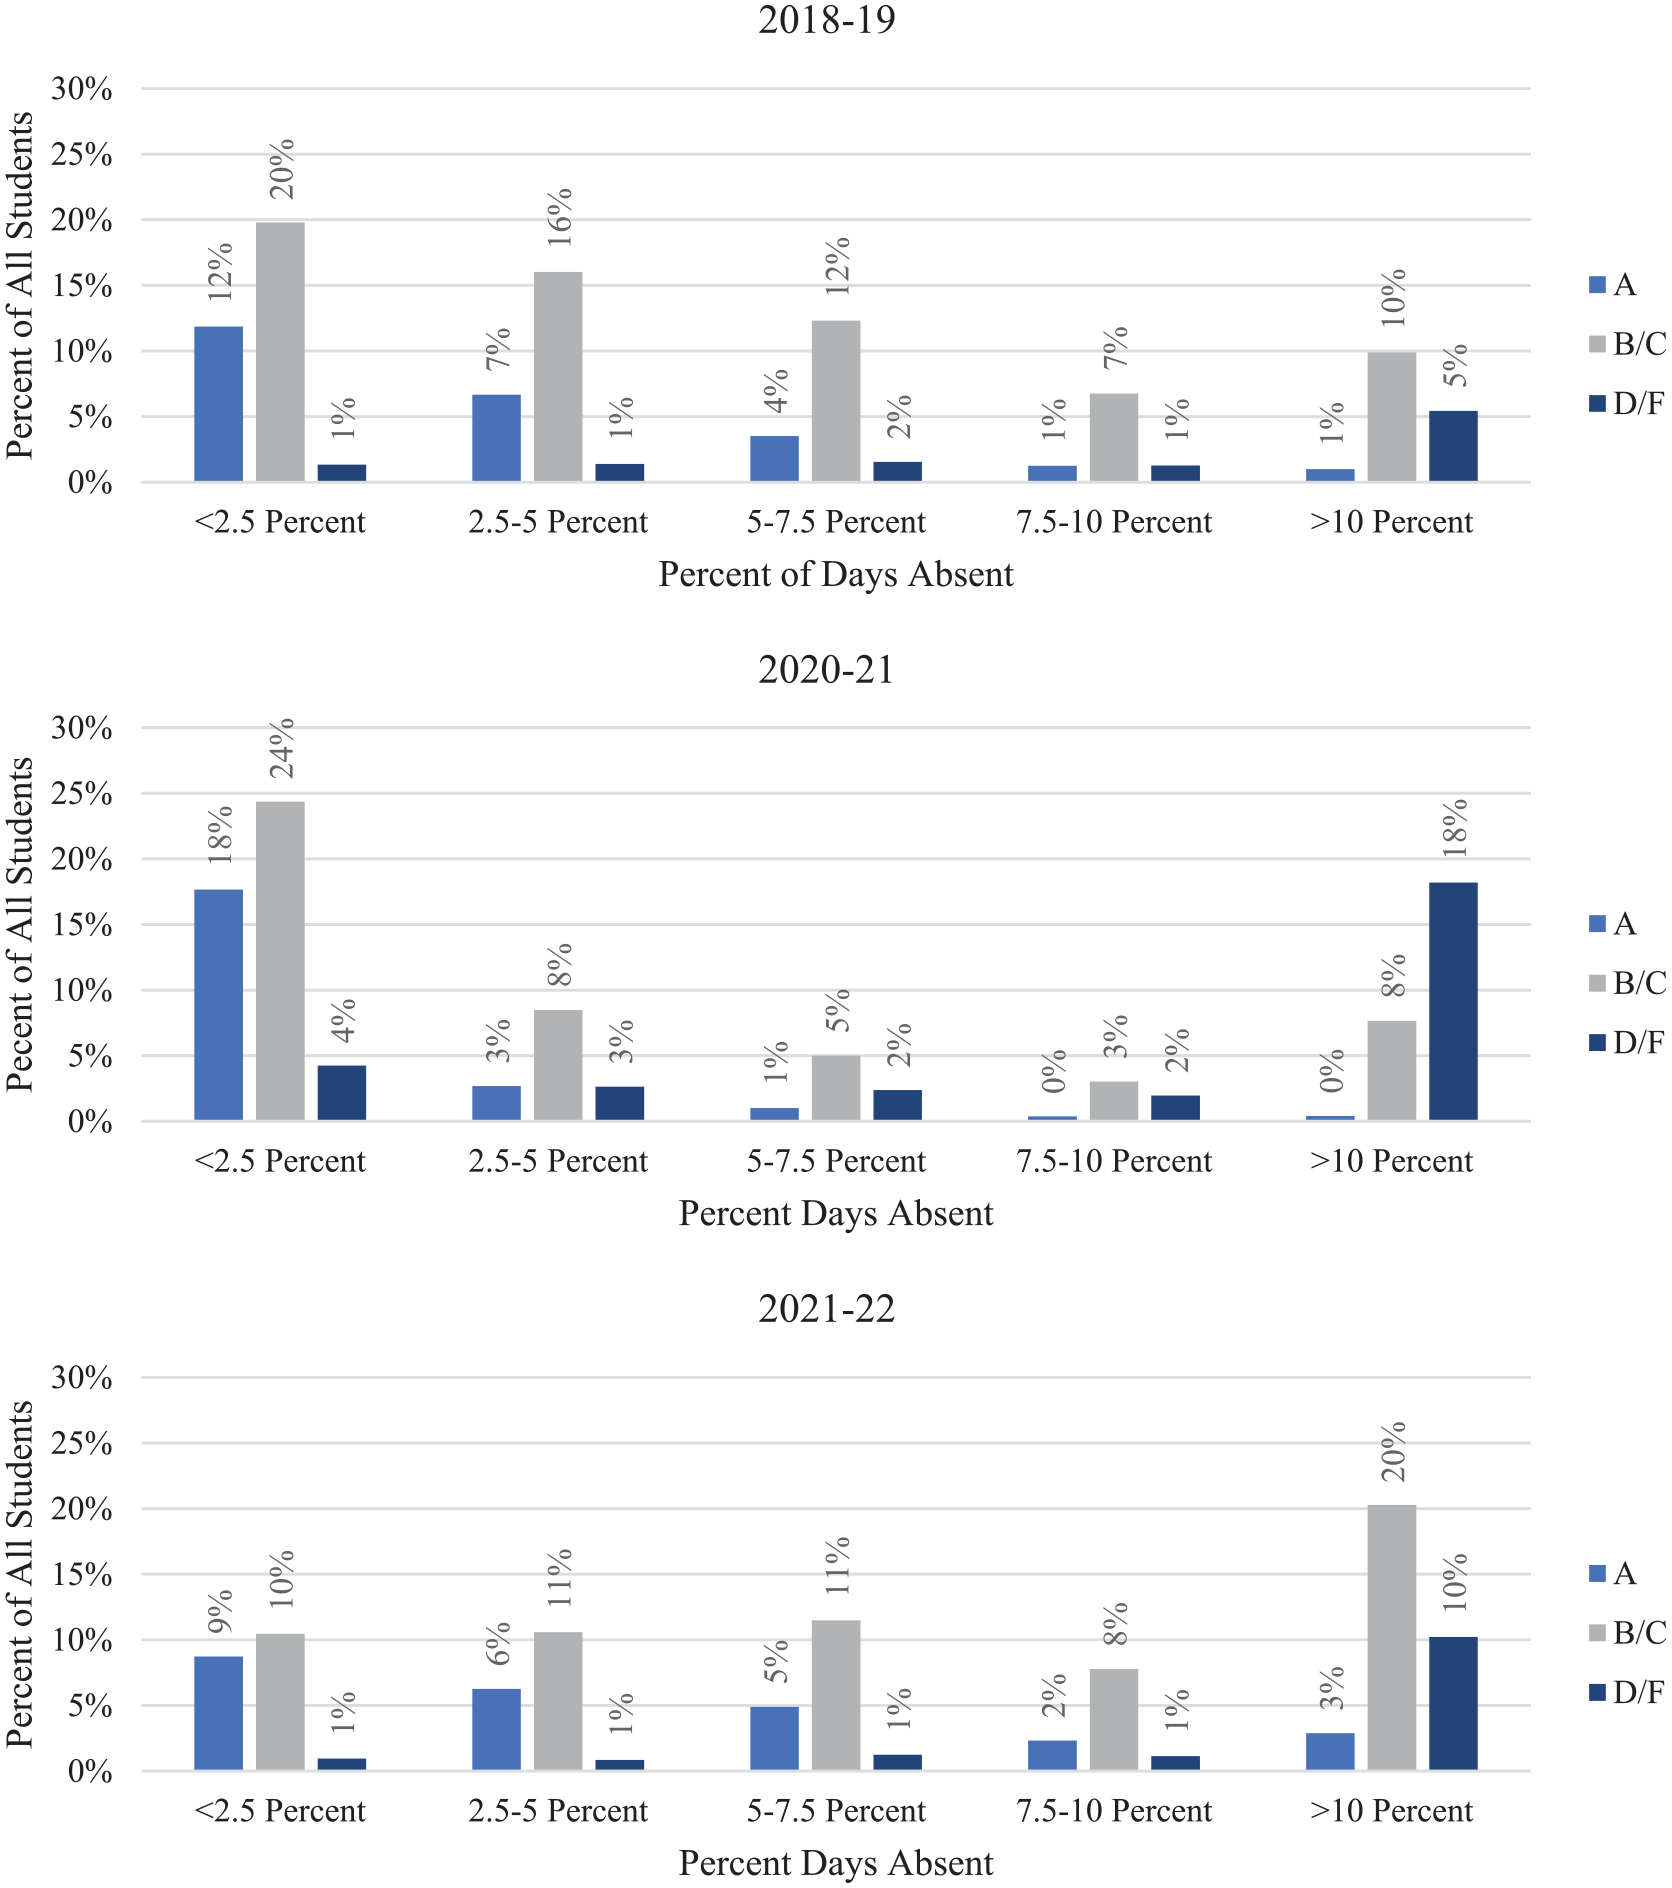
Distribution of students by annual grade point average (GPA) and percentage days absent in 2018–2019, 2020–2021, and 2021–2022.
The top panel of Figure 3 shows that prepandemic (2018–2019), students with few absences were far more likely to have “A” averages compared to students who attended less, and half of students with an “F” or “D” GPA were chronically absent (greater than 10% of days absent). However, most students who were chronically absent had GPAs of “C” or better. The middle panel of Figure 3 shows a widening of the absence distribution, with more students in both the highest and the lowest absence categories relative to prepandemic. In 2020–2021, grades and absences also became more correlated relative to prepandemic—the correlation coefficient between absences and grades in 2020–2021 was –0.60 compared to –0.44 in 2018–2019. Figure 3 shows both more students in the highest and lowest absences categories and a higher percentage of students in the lowest absence category earning “A” GPAs and a higher percentage of students in the highest absence category earning “D” or “F” GPAs.
The bottom panel of Figure 3 shows the general increase in the percentage of days absent in 2021–2022. The percentage of students in the lowest absence category decreased by about a third, and the percentage in higher absence categories increased. However, grades and absences became less correlated (correlation coefficient of –0.52) because students across the GPA distribution had higher percentages of days absent compared to previous years. Overall, these analyses indicate that in 2020–2021, a small portion of students suffered significantly worse outcomes in terms of both attendance in grades, whereas in 2021–2022, many students had higher absences, but far fewer received low grades.
Student and School Subgroup Effects
To better understand which students struggled with which outcomes in each year, the next stage of our analyses examines pandemic effects across selected student and school subgroups. Figure 4 shows estimated mean impacts on percentage of days absent (left) and chronic absenteeism (right) as estimated using OLS regression models (for all OLS results, see Table A6 available on the journal website).10 Recall that each point on these plots refers to the coefficient estimates on the β1 term from Equation 1 from a model restricted to members of the focal subgroup (e.g., the points labeled “Elem” refer to estimates obtained by running Equation 1 with only elementary school students).
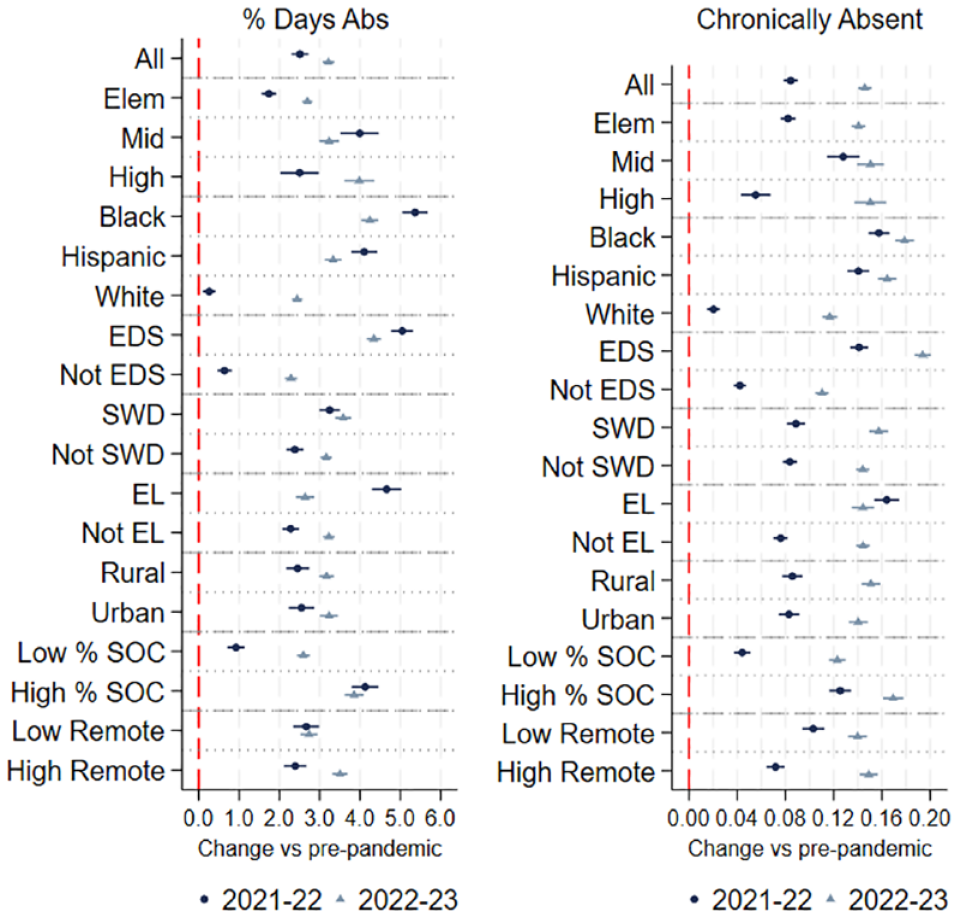
Subgroup Coefficients for the 2020–2021 and 2021–2022 Cohort in Regression Models on Percentage of Days Absent and Chronic Absences.
In 2020–2021, the magnitude of the impacts varied considerably across groups, with middle schoolers and traditionally disadvantaged groups experiencing the largest increases in absences and chronic absenteeism. The variation in impacts across groups was reduced in 2021–2022, although this was primarily driven by increased absences among groups that had been less affected in 2020–2021.
For example, middle schoolers experienced the largest increases in absences in 2020–2021 with increases of 4.0 percentage points in percentage of days absent and 13 percentage points in chronic absenteeism. Compared to prepandemic, elementary schoolers saw increases in the percentage of days absent of 1.7 percentage points and increases in chronic absenteeism of 8 percentage points, while high schoolers’ rates increased by 2.5 and 6 percentage points, respectively. The size of the increases in absences was much more similar across school-level groups in 2021–2022. Chronic absences for all three school levels increased by 14 to 15 percentage points in 2021–2022 relative to prepandemic levels, whereas percentage of days absent increased 2.7, 3.2, and 4.0 percentage points for elementary, middle, and high schoolers, respectively.
Turning to differences across student subgroups, Black and Hispanic students experienced larger increases than White students in both measures of absenteeism in 2020–2021. Moving to 2021–2022, the impact was smaller for Black and Hispanic students than in the prior year, whereas the impact for White students increased substantially. Chronic absenteeism followed a similar pattern with racial/ethnic gaps widening in 2020–2021 and closing in 2021–2022 due to elevated rates for White students, although chronic absenteeism rates continued to worsen for all student subgroups through 2021–2022.
As for other student subgroups, ELs and EDSs also experienced much larger increases in absences and chronic absenteeism than their counterparts in 2020–2021. In 2021–2022, these gaps narrowed as non-EL students and non-EDSs saw large increases in absenteeism, whereas EL students and EDSs had fewer absences than the prior year. Differences by disability status were less pronounced, but students with disabilities (SWD) experienced greater increases in each absence outcome than their counterparts in 2020–2021 and very similar impacts in 2021–2022.
Differences in impacts by school characteristics were generally smaller than the differences by student subgroups. Rural and urban schools saw very similar increases in the percentage of days absent in both pandemic school years, whereas rural schools had slightly larger increases in chronic absenteeism than urban schools in 2021–2022. Similar to differences by student race/ethnicity, schools with higher concentrations of SOC had larger impacts on percentage days absent and chronic absences in 2020–2021 than their counterparts, but these gaps narrowed in 2021–2022. Comparing schools with fewer remote learning days in 2020–2021 to those with more remote days, the impacts on percentage of days absent were similar in 2020–2021, although schools with fewer remote days saw somewhat greater increases in chronic absenteeism. In 2021–2022, students in schools with more remote days in the prior year experienced greater increases in percentage days absent and chronic absenteeism compared to schools with fewer remote days.
For course grades, Figure 5 displays the estimated mean effects of the pandemic on annual GPAs (right) and the percentage of students who failed at least one course (left) across student subgroups in 2020–2021 and 2021–2022. As with absences, middle schoolers in 2020–2021 experienced larger changes than high schoolers in grades and failure rates. However, in 2021–2022, middle schoolers had recovered on grade outcomes to a greater extent than high schoolers, with similar small negative effects on GPAs and smaller effects on course failure rates. Although the recovery by 2021–2022 is encouraging, more than a quarter of high schoolers and more than a fifth of middle schoolers still failed at least one course in 2021–2022.
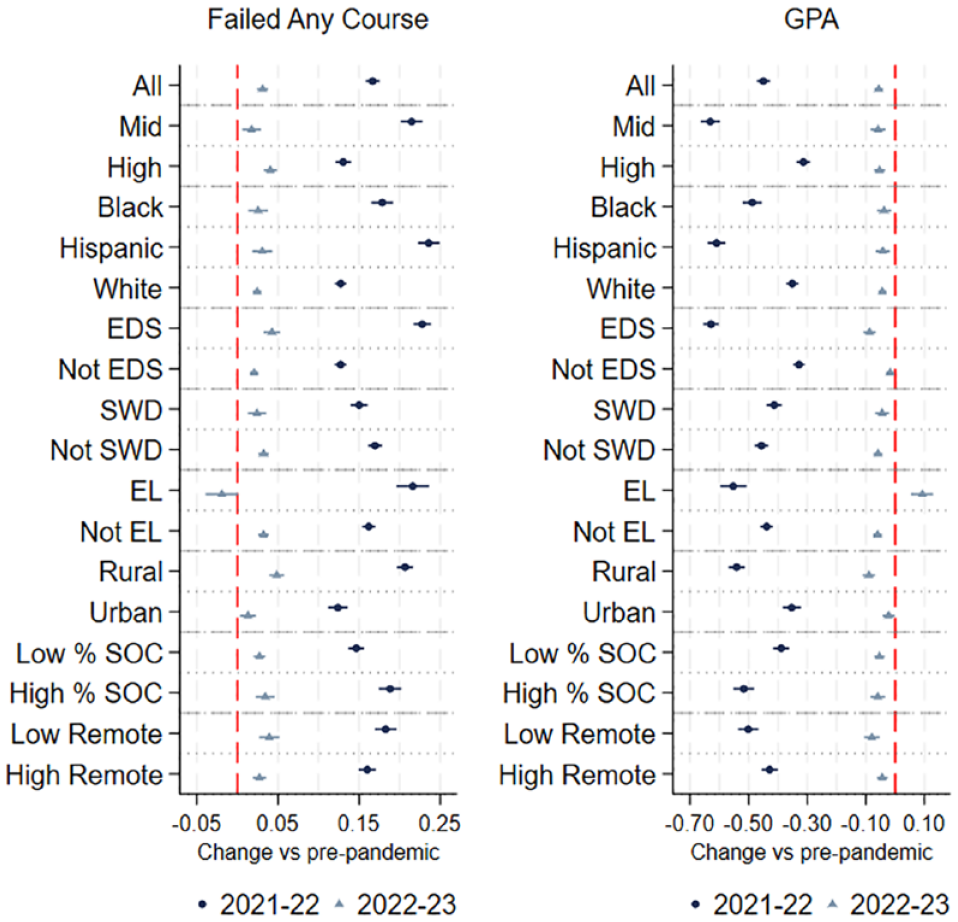
Subgroup Coefficients for the 2020–2021 and 2021–2022 Cohort in Regression Models of Course Grade Averages and Course Failures.
Among student subgroups, Hispanic and Black students saw greater initial decreases in GPAs compared to their White peers, although all three groups saw meaningful decreases in 2020–2021. In 2021–2022, students in all racial/ethnic groups had GPAs that were nearly as high (within 0.05 points) of their prepandemic averages. For rates of course failure, disparities in impacts by race/ethnicity persisted into 2021–2022, although the magnitude was much reduced. In 2020–2021, Hispanic students, for example, saw an increase in course failure rates of 24 percentage points, which was reduced to an increase of just 3.1 percentage points above prepandemic averages in 2021–2022. Other student subgroups followed similar patterns, with EDSs and EL students experiencing larger decreases in GPAs and increases in course failure rates in 2020–2021 compared to their counterparts and then recovering to near prepandemic levels in 2021–2022. This difference in impacts for SWD and the recovery by EL students may indicate special emphasis on serving these populations, such as an earlier return to in-person schooling.
Turning to school-level subgroups, rural schools saw larger initial reductions in course grades compared to urban schools and remained further below prepandemic levels in 2021–2022. Rural schools also had substantially larger increases in course failures in 2020–2021 compared to urban schools, and the rate of course failures in rural schools remained 4.9 percentage points above prepandemic levels in 2021–2022. Schools serving high percentages of SOC also experienced larger impacts on grades in 2020–2021, but impacts were similar to schools with low percentage SOC as of 2021–2022. Students at schools with fewer remote days in 2020–2021 experienced slightly larger impacts on GPAs and course failures compared to schools with more remote days, but the differences were relatively small and became smaller in 2021–2022.
Finally, Figure 6 displays regression coefficients for 2020–2021 and 2021–2022 on rates of grade retention. For racial/ethnic subgroups, White students had lower increases in grade retention in 2020–2021 compared to Black and Hispanic students, but rates were similar across subgroups in 2021–2022. Because the effects were concentrated among high schoolers, Black and Hispanic high schoolers were retained at rates of 8.0% and 8.9% in 2020–2021 and at rates of 5.7% and 5.2% in 2021–2022.
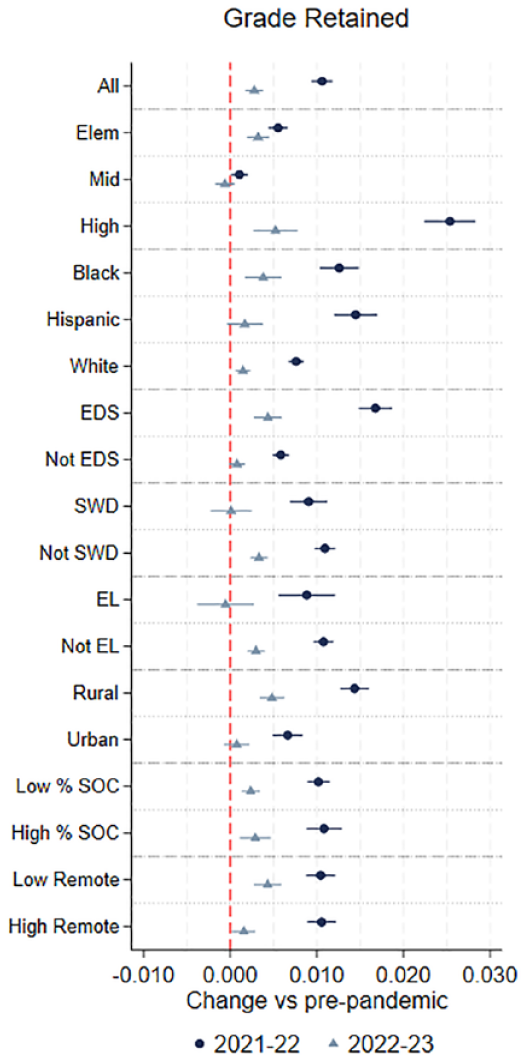
Subgroup Coefficients for the 2020–2021 and 2021–2022 Cohort in Regression Models of Grade Retention.
Among other student subgroups, EDSs experienced larger increases in grade retention than non-EDSs in 2020–2021 and remained somewhat higher in 2021–2022. In contrast to other outcomes, rates of grade retention were not significantly different for EL and non-EL students in either school year. Finally, SWD experienced nonsignificantly but somewhat smaller increases in grade retention than students without disabilities in 2020–2021, and this gap increased in 2021–2022, although the rates of grade retention fell for both groups.
For school subgroups, effects on grade retention were similar in 2020–2021 for schools with differing percentages of SOC and numbers of remote days. However, rural schools had significantly larger increases in grade retention compared to urban schools in 2020–2021. This gap between the effects on rural and urban schools narrowed but was not eliminated in 2021–2022.
Discussion
Key Findings
This study examined the effect of the pandemic on three sets of educational outcomes—absences, course grades, and grade retention. We began this article with three key aims: to identify how these outcomes were affected by the pandemic overall, understand the extent of variation in impacts on these outcomes across students, and explore how these outcomes evolved across the first 2 postpandemic years. Our analysis reveals first, that all of these outcomes were significantly negatively affected during the 2020–2021 school year, but second, the extent of those impacts varied substantially across students. In 2020–2021, absence rates rose on average, but this was driven by large increases in absences at the high end of the absence distribution, whereas the median and bottom of the distribution declined. For GPAs, negative impacts were more consistently observed throughout the distribution, but students at the top of the GPA distribution still experienced lesser declines than those at the bottom.
Third, these outcomes evolved very differently between 2020–2021 and 2021–2022. Grades, failures, and grade retention rates quickly returned to close to prepandemic norms, and gaps narrowed as student groups that were most negatively affected in 2020–2021 experienced greater recovery in 2021–2022. By contrast, absenteeism rates worsened. By 2021–2022, the entire absence distribution had shifted upward relative to prepandemic. Gaps between students narrowed, but this was driven by worsening attendance among student groups that had maintained high attendance in 2020–2021.
We highlight three key takeaways from these results. First, the pandemic significantly shaped not only students’ achievement but also their engagement with school. Second, individual students were affected in varied ways, particularly in 2020–2021, given that outcome distributions and gaps between student subgroups widened substantially. Finally, educational outcomes changed in different ways as the acute pandemic impacts lessened. Although test scores may be slowly recovering and students’ grades recovered quickly, absenteeism rates actually worsened between 2020–2021 and 2021–2022. Because absences are not a cumulative outcome, these continuing impacts suggest that long-term effects of the pandemic are still influencing schooling. In addition, the across-the-board increases in absences in 2021–2022 relative to more limited impacts in 2020–2021 suggest that families, communities, and schools with greater resources may have been more effective in buffering their students from the acute impacts of the pandemic (e.g., providing technology for effective remote learning) but are less successful at buffering long-term impacts.
Implications
In 2021–2022, course grades, course failures, and grade retention all rebounded toward prepandemic levels, but absences continued to worsen. For policymakers and educators, this indicates a need to focus particular attention on increasing efforts to reengage students with school and to encourage better attendance, particularly because increased absenteeism may cut against efforts to remediate learning loss. However, the reasons for increased absenteeism in the postpandemic period remain unclear (Saavedra et al., 2024). More research is therefore needed to better understand the causes of these changes so that educators and policymakers can more effectively design interventions to address postpandemic absenteeism.
In addition, although students’ grades have recovered, the effects of lost instruction and prior failures will linger. The consequences of falling behind may be most acute in high school when students must pass certain courses to be promoted. Retention in grade is associated with reduced motivation and increased likelihood of dropping out (Cockx et al., 2019; Kretschmann et al., 2019). In addition, students may be moving toward postsecondary education with lower GPAs, which could create barriers in access to college. Furthermore, the reasons for and implications of the quick recovery of GPAs, despite continued achievement losses, remain unclear (Goldhaber & Young, 2023; Sanchez, 2023; Swiderski & Fuller, 2023). Therefore, additional resources for remediation and acceleration may still be needed to keep students on track in high school even though GPAs appear to be relatively high.
Additionally, especially in 2020–2021, worsening outcomes were concentrated among a small group of students (about 18%) who were chronically absent and had very low grades. Subgroup analyses show that historically marginalized groups, including Black and Hispanic students, EDSs, and EL students, were much more likely to experience these severe negative effects. These marginalized students were also more likely to be exposed to COVID-19, job loss or death in the family, and lack access to reliable internet for remote learning (Gemelas et al., 2022; Mackey et al., 2021; Stelitano et al., 2020). These results suggest a need for targeted interventions toward the students and communities that were most negatively affected by the pandemic.
Overall, as initial impacts of the pandemic continue to linger, administrators and policymakers will need to continue to implement tiered, targeted interventions to provide appropriate supports for students with different needs. The uniqueness of students’ pandemic experiences makes it difficult to predict how individual students or groups of students will progress in the future. Students who performed well initially may experience later challenges, whereas other students may rapidly catch up. Some students may have already recovered, whereas others continue to experience multiple school and home-based challenges that contribute to their disengagement from school and limitations to their opportunity to learn. Students will continue to need different supports from their schools and communities to achieve a full recovery.
Limitations
There are several key limitations to this study that are important to note. First, although we document effects across a diverse set of students and a range of outcomes, we are not able to directly distinguish mechanisms driving the effects. Differences in patterns for subgroups of students suggest places where policies—both existing and new pandemic policies—may have influenced outcomes for students. For example, middle schoolers in 2020–2021 were less likely to be retained in grade than high schoolers despite larger negative impacts on course grades. These differences may reflect differences in grade retention policies, where high schoolers are retained in grade based on credit accumulation and middle schoolers are not. Similarly, SWD and EL students may have benefited from policies designed to protect these groups from course failures and/or grade retention. They may also have been more likely to have benefited from extra resources or earlier returns to in-person schooling during the pandemic.
Second, outcomes that rely on specific measurement practices, such as grades and attendance, may not have the same meaning during or postpandemic. For example, teachers may have employed more lenient grading practices, and “logging on” to online learning may have been a different kind of attendance than being in school in person. However, to the extent that these measures continue to be used by parents, teachers, administrators, and policymakers in interpreting individual- and population-level education outcomes, it is important to understand how they have changed over time. Researchers and policymakers should continue to evaluate the meaning and usefulness of these measures.
Future Directions
Overall, the results of the current study highlight that the pandemic affected a range of educational outcomes in different ways across student subgroups and across time, shedding new light on the extent to which the education system was and continues to be affected by the pandemic. The results reveal a need for future research to explore the causes of key changes, the potential role that specific pandemic-era and existing prepandemic policies and practices played in shaping initial impacts on the education system and on specific student subgroups, and new interventions that can help students and schools to achieve recovery across the full range of educational outcomes. This work will remain vital as the complex effects of the pandemic continue to affect students and schools.
Supplemental Material
sj-pdf-1-edr-10.3102_0013189X241299397 – Supplemental material for In School, Engaged, on Track? The Effect of the Pandemic on Student Attendance, Course Grades, and Grade Retention in North Carolina
Supplemental material, sj-pdf-1-edr-10.3102_0013189X241299397 for In School, Engaged, on Track? The Effect of the Pandemic on Student Attendance, Course Grades, and Grade Retention in North Carolina by Sarah Crittenden Fuller, Tom Swiderski, Camille Mikkelsen and Kevin C. Bastian in Educational Researcher
Footnotes
Acknowledgements
The research reported here was supported by the Institute of Education Sciences, U.S. Department of Education, through Grant No. R305S220003 to the North Carolina Department of Public Instruction. The opinions expressed are those of the authors and do not represent views of the Institute or the U.S. Department of Education. The research reported in this article was also made possible in part by a grant from the Spencer Foundation (No. 202200138). The views expressed are those of the authors and do not necessarily reflect the views of the Spencer Foundation.
Notes
Authors
References
Supplementary Material
Please find the following supplemental material available below.
For Open Access articles published under a Creative Commons License, all supplemental material carries the same license as the article it is associated with.
For non-Open Access articles published, all supplemental material carries a non-exclusive license, and permission requests for re-use of supplemental material or any part of supplemental material shall be sent directly to the copyright owner as specified in the copyright notice associated with the article.