
Abstract
This article used a rich longitudinal data set from four school districts in California to study absenteeism patterns among students classified as an English learner (EL). We looked at absence patterns overall and disaggregated by EL classification, grade level, and pre/post COVID-19. When their demographic and school-level factors are considered, ELs have fewer absences and are less likely to be chronically absent than non-EL students. This finding is evident for all EL classified groups, although the differences in absenteeism for long-term EL (LTEL) and newcomer EL students are markedly smaller than for other EL subgroups. The negative absenteeism patterns for ELs shifted after the COVID-19 pandemic. EL-classified students experienced higher absenteeism rates during the pandemic even when holding other factors constant. This rising absenteeism trend is most evident for current ELs and LTELs.
Keywords
A significant and growing proportion of students in the nation are classified as English learners (ELs)—about 5 million students, according to the latest national figures (National Center for Educational Statistics, 2021). EL-classified students report some of the lowest performance metrics of any student subgroup. For example, in California—the site of our present investigation—in 2021–2022, only 9.7% exceeded standards in mathematics (compared to 37.8% of non-EL students), 1 and their 5-year graduation rate was more than 15 percentage points below that of non-EL students. 2
Among the factors that may contribute to these academic disparities are a lack of demonstrated proficiency in English language assessments, low-income status, curricular tracking into remedial and lower rigor courses, and most recently, the COVID-19 pandemic (Reed et al., 2022; Santibañez & Umansky, 2018). At the national level, a survey of teachers by the United States Government Accountability Office (GAO; 2022) found that teachers with more than 20% ELs in their classroom were facing greater challenges to engage and meet the needs of EL-classified students than teachers with fewer ELs in their classroom (US Government Accountability Office, 2022).
Another key factor—and the focus of this study—is absenteeism. Before the COVID-19 pandemic, chronic absenteeism among ELs was around the statewide average, but it grew significantly worse after the pandemic. The most recent data from California (2022–2023) show that the chronic absenteeism rate among EL-classified students was close to 28% and that the rate for non-ELs was 24%. 3 Chronic absenteeism is defined as missing at least 10% of the school year (Jordan & Miller, 2017). The existing literature establishes a clear link between absenteeism and student performance (Aucejo & Romano, 2016; Gershenson et al., 2017; Gottfried, 2009, 2011; Liu et al., 2021). In the GAO (2022) survey, teachers of ELs were also more likely to report their students had inconsistent participation in online learning and were absent more often than non-ELs. Numerous reports across the country suggest increased absenteeism for EL-classified students continued well into the 2022–2023 school year. 4
Although not many studies focus on ELs specifically, there are at least two studies using different data that found that the effect of absences on EL students’ achievement is larger than the effect of absences on non-EL test scores in reading (Gershenson et al., 2017) and math (Gottfried & Kirksey, 2017). Given these well-documented negative ramifications, much of the attendance literature has turned toward understanding who is absent to address who is at the greatest risk. Over the past decade, specific attention has been paid to disparities that exist across different demographic subgroups of students because data describing patterns in the general population often obscure disproportionately high rates of absenteeism (Stiefel et al., 2018). Our study follows in this direction.
Current Study
In this article, we focus on five different subgroups of current and former EL-classified students: current ELs, long-term ELs (LTELs), newcomer ELs, reclassified ELs, and ever ELs. These subgroups have varying educational experiences and trajectories and encounter different perceptions about their status as learners (Lee & Soland, 2023; Santibañez & Umansky, 2018; Umansky & Avelar, 2023). Our study is the first to disaggregate this group to understand patterns of absences. Doing so will help us not only compare EL and non-EL students but also identify which EL students are at the greatest risk of engaging in absenteeism behavior. In this study, we used a large, rich data set from four school districts in California to answer the following research questions:
Research Question 1: What are the absence patterns of EL students?
Research Question 2: Do patterns vary by elementary versus secondary grades?
Research Question 3: Do patterns vary by EL classification?
Research Question 4: How did absence patterns change during the COVID-19 pandemic?
Our research questions address whether absence patterns for EL students varied by grade level. Although all ELs are entitled to language development services, most will exit this designation before finishing elementary school; consequently, their educational experiences will be very different in elementary than secondary school. We follow California Department of Education (CDE) definitions and the literature to consider five commonly accepted groups of EL-classified students 5 : (a) “Current EL classified” students are currently in EL status 6 and represent 19% of K–12 public school student enrollment in California. Most of these students are in the elementary grades in mainstream classrooms and should be receiving English language development services. (b) “Reclassified fluent English proficient” (RFEP) students are those who had an EL designation and subsequently demonstrated proficiency in an English language assessment and passed any other benchmarks to exit the designation. About 16% of students in California are designated as RFEPs. (c) “Newcomer ELs” are foreign-born students who have been enrolled in U.S. schools for fewer than 3 years and are designated as ELs due to their lack of demonstrated English language proficiency. The CDE does not publish data for newcomer ELs, but it is estimated that around 14% of total EL-classified enrollment is made up of newcomer ELs (Finn, 2023). (d) “LTELs” are students who remain classified as an EL for 6 or more years (meaning all LTELs are in the secondary grades). About 4% of students in California are LTELs, but they represent 11% of all EL-classified students and close to 17% of all EL students in high school. 7 Students labeled “LTELs” will likely be tracked into different kinds of courses and have a less rigorous and more remedial secondary school experience than non-ELs (Estrada, 2014; Kanno & Kangas, 2014; Thompson, 2017; Umanksy, 2016; Umansky & Avelar, 2023). (e) “Ever ELs” are those who were classified as an EL at any point in their student histories regardless of current status. Ever ELs currently represent about 35% of all public school K–12 enrollment in California.
Examining absenteeism rates among LTEL and newcomer EL subgroups is essential because in addition to the usual factors affecting absences across the K–12 span (i.e., illness, change of residence, lack of academic motivation, etc.), absenteeism for these subgroups in secondary school could reflect a generalized disconnect between needs and services (Finn, 2023; Kim & García, 2014; Shin, 2020; Thompson, 2015; Umansky & Avelar, 2023).
EL Students and Absenteeism
EL-classified students are absent from school at similar rates than non-ELs, but there are differences by grade level: EL absenteeism rates are lower in elementary and higher in secondary. 8 The factors that predict absenteeism among ELs also affect other students (i.e., poverty), but there are some EL-specific factors. First, EL-classified students live in socioeconomic contexts that are associated with more absences: poverty, food insecurity, less parental supervision, frequent health issues, transportation issues, or familial or other obligations that necessitate students—especially older students—to stay at home and care for other children or family members, for example (Attendance Works and Everyone Graduates Center, 2017). One study using national data from the Medical Expenditure Panel Survey of 2008–2013 showed that when socioeconomic status and other characteristics are considered, ELs actually have lower absenteeism rates than non-ELs (Lim et al., 2019).
Second, EL-classified children also tend to attend schools that are underresourced or perceived as unsafe—a notorious driver of chronic absenteeism (Attendance Works, 2023). EL students also face a more restrictive and exclusionary school/curricular experience than non-ELs, particularly in secondary schools. Many scholars have convincingly argued that secondary EL students face persistent barriers to educational success, stemming from lack of services (including English language development and special education), deficit-laden instructional practices (including more negative teacher perceptions of ELs literacy and math), and reclassification practices that would have reclassified an EL in one district but not in another one, among other exclusionary practices. (Brooks, 2018; Estrada & Wang, 2018; Shin, 2020; Umansky & Avelar, 2023; Umansky & Dumont, 2021). Additionally, EL-classified students are at risk of being both over- and underidentified for special education services (Carnock & Silva, 2019). When ELs are underidentified in special education, something that happens more often in elementary school, they could miss out on important services that would better support and enable their school trajectory (Umansky et al., 2017). When ELs are overidentified, which often happens in secondary school, schools may struggle to adequately support them and often prioritize special education services over English language development programming (Kangas, 2014, 2018).
Third, although some EL students are immigrants themselves, the majority of ELs are the children of immigrants (Calderón et al, 2011). By some estimates, around one-quarter of all U.S.-born Latino children in the United States have at least one parent who is undocumented (Clarke et al., 2017) and are potentially subject to harsh immigration enforcement practices. Some research suggests that immigration enforcement may deter students from coming to school (Kirksey, 2020). In a study of immigration enforcement in seven large California districts during 2014–2018, Kirksey and Sattin-Bajaj (2021) found that Latinx EL student absenteeism rose with increased immigration arrests in their school communities (a pattern not found for non-EL students or non-Latinx EL students). Other studies using different data have confirmed this finding (Ee & Gándara, 2020; Meadows, 2021). On the other hand, other traits associated with immigrants would support more consistent school attendance. A large body of research shows that on average, first-generation and second-generation immigrant parents (those born outside of the country or the children of foreign-born parents) have higher educational aspirations and expectations for their children than their U.S. native-born counterparts (Feliciano & Lanuza, 2017; Freeman & Kirksey, 2023; Kao & Tienda, 1998; Portes & Rivas, 2011; M. Suárez-Orozco & Suárez-Orozco, 2015) and place a high value on education for their children (Colón & Sánchez, 2010; Goldenberg et al., 2001; Poza et al., 2014). In addition, residential mobility (and consequent school mobility) tends to be low for recent immigrants, particularly if they are low income and speak a language other than English (South et al., 2005). There is no consensus in the literature about the direction in which immigration affects attendance—and many analyses of Latinx immigrant children or children of immigrant parents and attendance may confound immigration with socioeconomic status and other characteristics.
The three mechanisms described previously (socioeconomic context, underresourced schools and curricular exclusion, and immigration) may explain absenteeism patterns among EL-classified students. After the onset of the COVID-19 pandemic, absenteeism among EL students rose disproportionately as additional factors came into play. Nationwide survey results suggest that as many as 40% of ELs participating in online instruction during COVID-19 were not receiving the designated services and support they needed (Reed et al., 2022). Other research suggested that in California, schools failed to reach students, and non-English speaking parents struggled to support their children with schoolwork and communicate effectively with schools—and schools with them (GAO, 2022; Reed et al., 2022; Sugarman & Lazarín, 2020; Uro et al., 2020; C. P. Williams & Buenrostro, 2021).
Our analysis focuses on the five non-mutually exclusive groups of EL-classified students defined previously: (a) ELs, (b) RFEPs, (c) newcomer ELs, (d) LTELs, and (e) ever ELs. As mentioned, we know little about absenteeism patterns among different types of EL classifications and formerly classified students, but we know their educational experiences vary enough to potentially drive differences in attendance rates (Saunders & Marcelletti, 2013). We expect absenteeism to be lower among RFEP students than ELs because their educational experience is more mainstream, that is, they are less likely to face curricular tracking, labeling, and other exclusionary practices that are consistent with the EL designation. Moreover, academic achievement is higher among RFEPs than ELs because students must achieve basic or proficient scores on standardized tests to reclassify—among other factors. Although not all studies show positive effects of reclassification on student outcomes, a robust body of evidence indicates that reclassification has a positive impact on academic outcomes (Carlson & Knowles, 2016; Chin, 2021; Pope, 2016).
On the flip side, we expect absenteeism among LTELs to be higher than RFEPs or students who have been EL-designated for fewer than 6 years because, as previously explained, they face persistent barriers to educational success, which would lower their overall engagement with school (K. J. Williams et al., 2023). We also expect absenteeism among newcomer EL students to be higher given they are potentially exposed to greater immigration enforcement and also because they face linguistic and other challenges (i.e., interrupted schooling, inappropriate grade placement, etc.) that may not be adequately addressed by the schools they attend (Finn, 2023).
Lastly, we look at ever-EL absenteeism to understand whether the label in itself may be related to differences in absenteeism. Other scholars have found that labeling students as ELs negatively affects their test scores even after exiting the designation (Umansky, 2016). Even though other studies have not confirmed this finding (Shin, 2018), there is enough evidence to suggest the EL label has direct, long-lasting effects on student outcomes through the mechanisms already discussed to look at this group separately from the others.
Data and Methods
We used administrative, longitudinal student-level data from the California CORE districts. Currently, eight districts serving more than 1 million students in 1,800 schools participate in the collaborative. 9 CORE district data include student-level information on demographics, academics, attendance, school climate, and school characteristics for students in K–12 who enrolled in these four districts from the 2014–2015 to the 2021–2022 school years. The total number of student-year observations is 1.6 million, representing over 440,000 unique students.
Absenteeism
Our first key outcome—days absent—was a continuous variable that captures the total number of days of school a student missed in a given school year. Our second key outcome—chronic absenteeism—was a binary measure indicating whether a student is chronically absent in a given school year (i.e., at least 10% of the school year). Our data include 2 years heavily impacted by the COVID-19 pandemic: 2020–2021 and 2021–2022. 10 During 2020–2021, the CDE required that all attendance, regardless of learning mode (i.e., virtual or hybrid), be taken and verified. Districts in our data delivered instruction primarily through virtual (distance) learning modes during this academic year. 11 Districts could use various methods to record participation, such as tracking online participation through their learning management system (Google Classroom, Schoology, etc.), taking attendance during Zoom sessions, using assignments as evidence, contacting students or their parents/guardians, and so on. 12
EL Classification
As previously described, we use five EL subgroups in our analysis. (a) Current ELs (22% of our sample) and (b) RFEPs (24% of our sample) are identified using district-generated flags that capture current designation. (c) Students classified as newcomer EL (4% of our sample) are identified using a district-generated newcomer flag for students who have been in the United States for fewer than 3 years and the “current EL” designation flag. (d) We do not have an LTEL flag or designation in our data. To generate one, we take advantage of the newcomer flag and the fact that we can see students for up to 8 years. 13 We designate LTELs (7% of our sample) as students who we first see in kindergarten or first grade who remain classified as ELs 6 years later (regardless of newcomer status), newcomer students (regardless of grade we first see them) who are in EL status for 6 or more years in our data, and non-newcomer students who are classified as ELs in Grades 6 and above (secondary school). Although some students in this group are observed for fewer than 6 years, we assume they have been in EL status for all the grades before we first see them—because they are not newcomers to U.S. schools. Lastly, (d) ever ELs (46% of our sample) are identified by selecting students who, at any point in our data, were identified as an EL-classified student. It is important to note that these groups are not mutually exclusive; for example, LTELs and newcomer ELs are also classified as ELs, and ELs and RFEPs are part of the ever-EL group. We used binary indicators set to 1 if a student belonged to one of these key subgroups in a given year and 0 otherwise.
Student Characteristics
Table 1 presents the descriptive statistics for the variables we used in this study, disaggregated by grade level (i.e., elementary school, secondary school). These variables included gender, race/ethnicity, income proxied by free and reduced-price lunch (FRPL), disability status (SWD), whether a student is a foster youth (FST), whether a student is homeless (HL), and an indicator for whether a student experienced a change of schools during the year or in the previous summer.
Descriptive Statistics by Grade Level
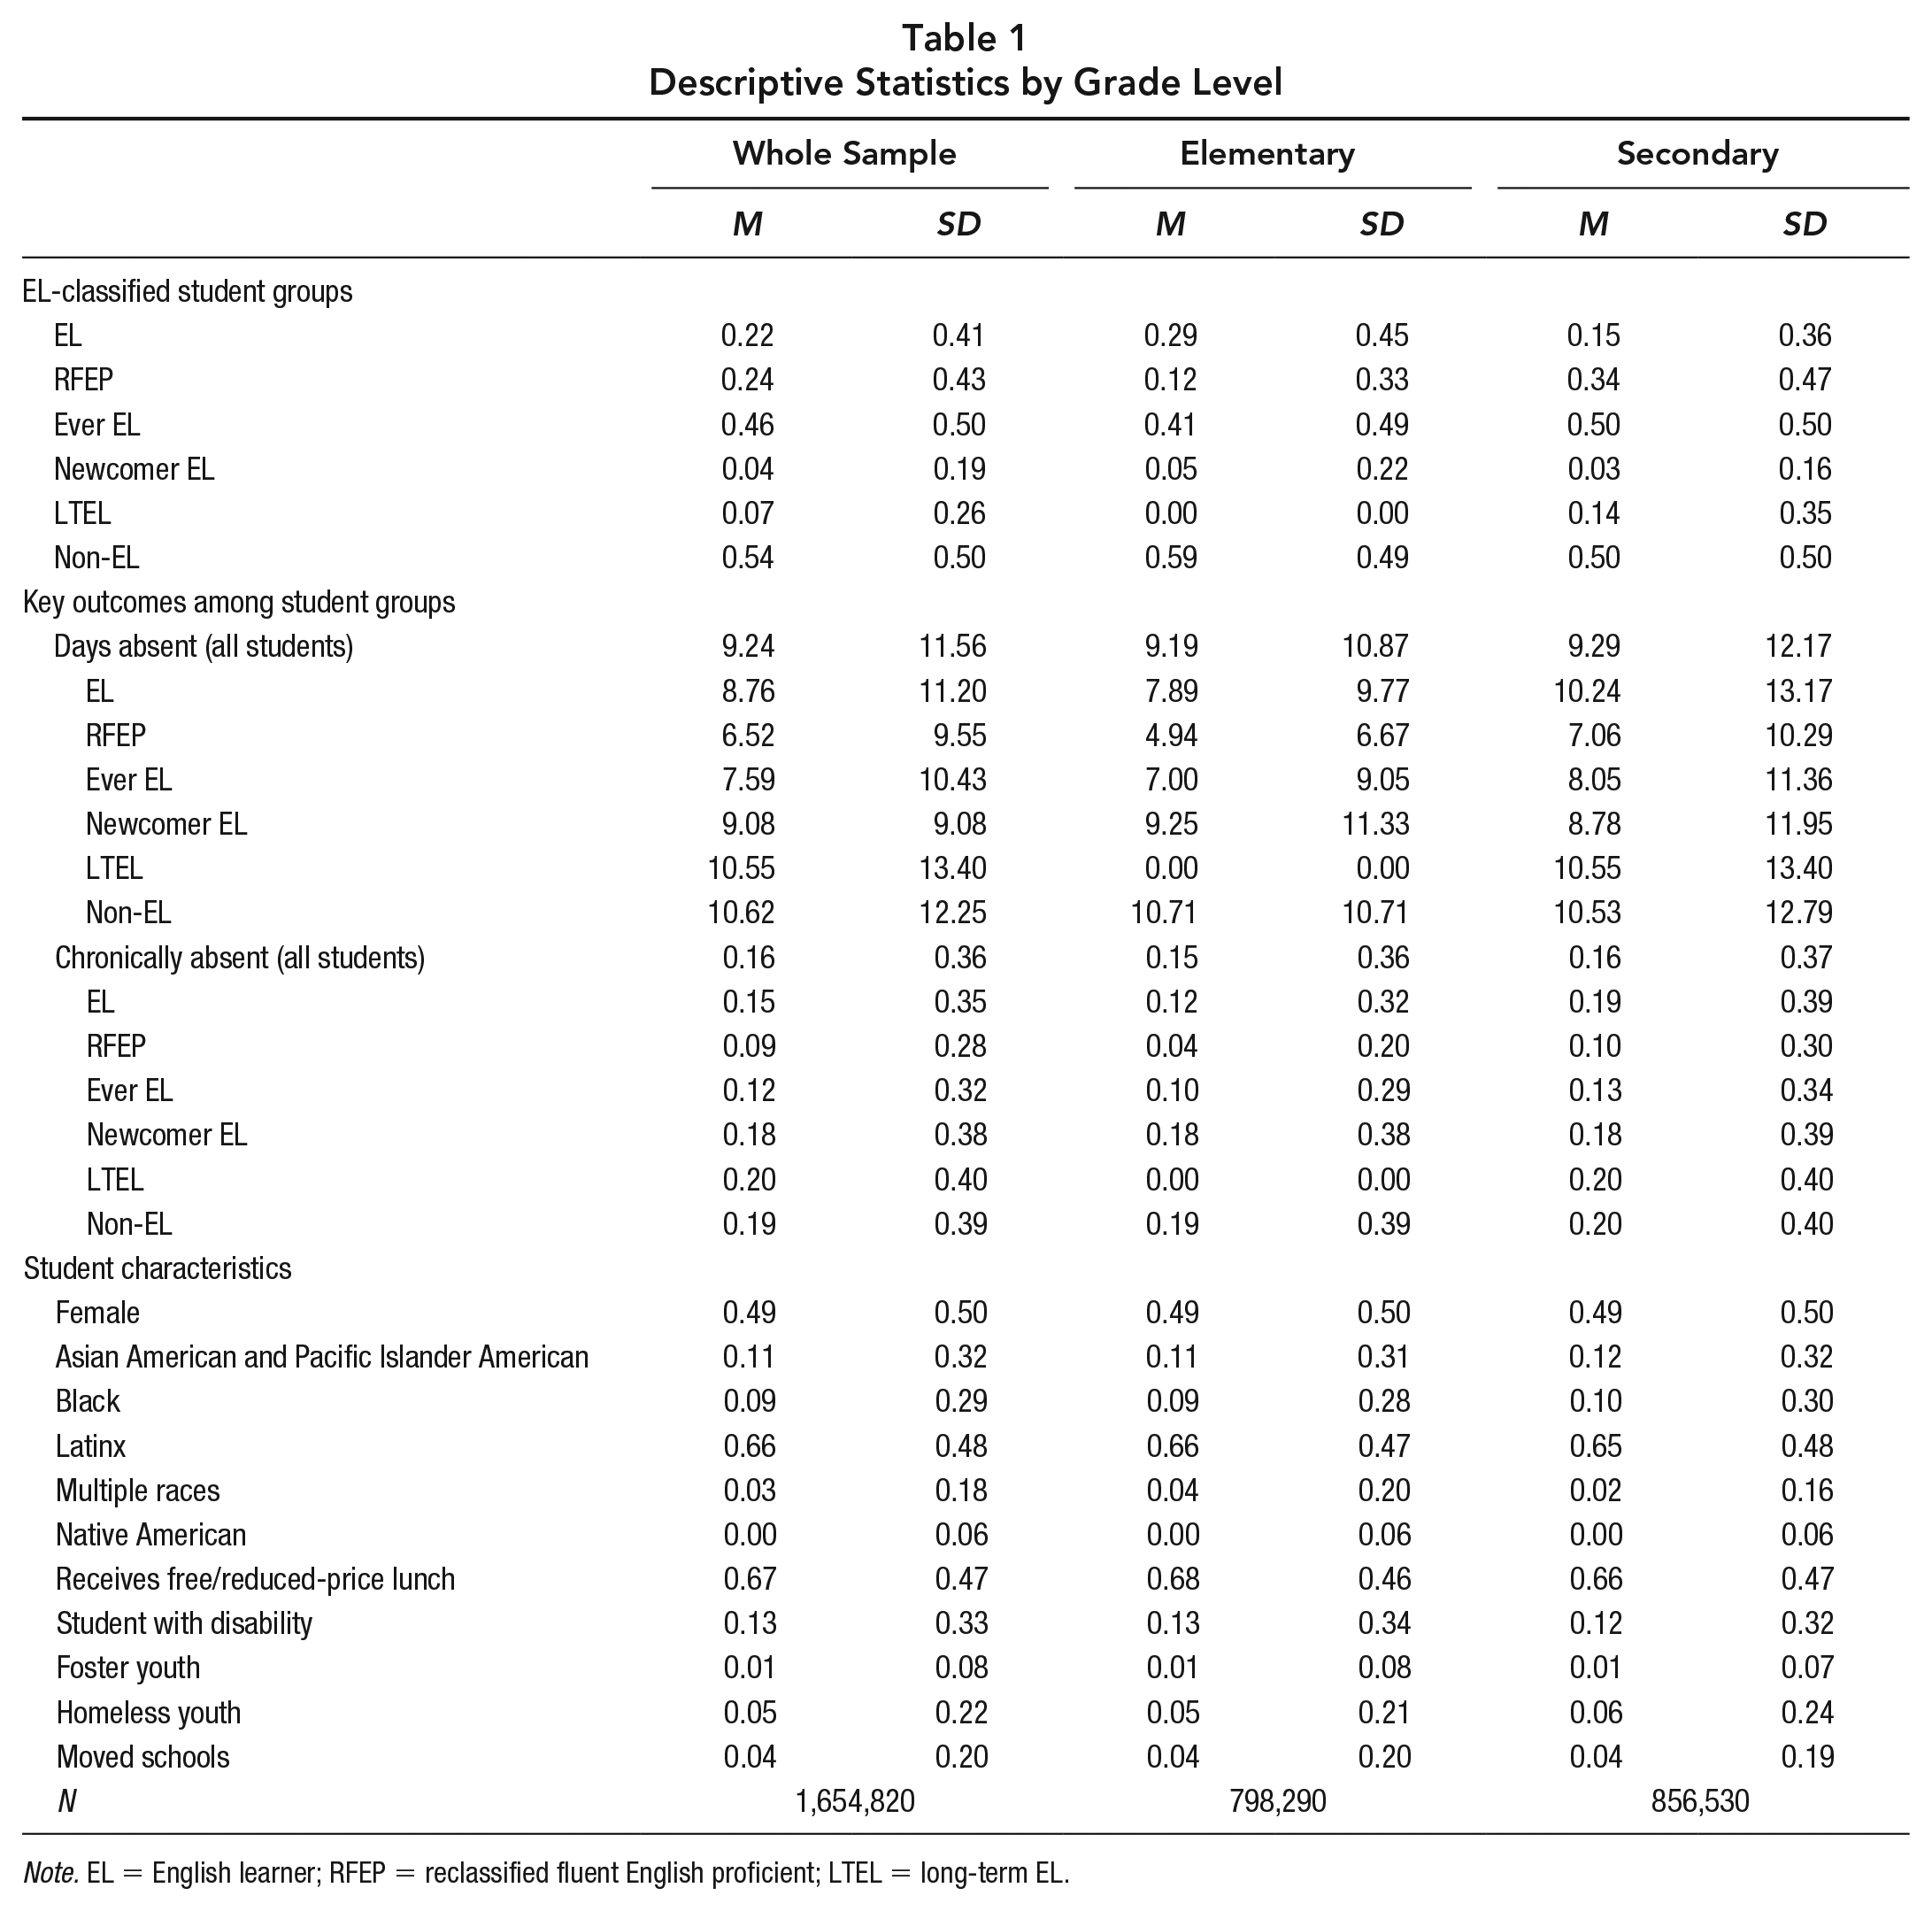
Note. EL = English learner; RFEP = reclassified fluent English proficient; LTEL = long-term EL.
Analysis Plan
Research Question 1
We estimated the following baseline model linking absenteeism to EL status:

Here, Yijt is our outcome of interest for student i attending school j in year t. Note that when Y is the number of days absent, the model is linear, where the coefficients represent an increase or decrease in the number of days absent. When Y is chronic absenteeism, we chose linear probability models over logistic regressions given recent research (Gomila, 2021), and the coefficients represent a percentage point increase or decrease in the likelihood of a student being chronically absent.
As for other indicators in the model, ELit is an indicator for whether student i is classified as an EL in the current year t (i.e., current EL). Xit is a vector of student-level characteristics, some of which are time-varying (SWD, FRPL, FST, HL, and whether a student moved schools from one year to the next), and demographic characteristics, which we consider invariant for purposes of this analysis (female, race/ethnicity), presented in Table 1. Finally, the error term is clustered at the school level to account for the nesting of students within schools. In all models, the sample is restricted to only include ELs and those identified as non-ELs so that β1 captures conditional differences in absenteeism between EL and non-EL students.
When considering the Equation 1, one issue that could arise when comparing students across schools is the presence of unobserved school-level differences. The omission of the nuances of the school environment as it relates to the common influences of schools (e.g., leadership, school neighborhood, curriculum) or the context-specific experiences of EL students in schools (e.g., support services, school climate) may cause bias in the estimation of how absence patterns vary for EL students. To address this, we add school fixed effects so that students are compared to others within the same school, thereby controlling for any omitted time-invariant school-specific factors. For similar reasons, we include grade-specific and year fixed effects. Another potential source of bias arises if a student’s attendance during year t is confounded with omitted prior characteristics. To address this concern, we supplemented this model with a 1-year lagged measure of our outcomes of interest. Including the lagged measure of the outcome allowed us to control for time-varying student-specific variation that may influence patterns of absenteeism in the subsequent year.
Although the previous model is the most rigorous of all specifications presented in the study thus far, given that most ELs in California are Latinx (with the next most frequent group being Asian American), we were worried about any heterogeneity due to race/ethnicity. To take this into account, we supplemented our models with an interaction between indicators for EL status and Latinx (given that they represent the vast majority of ELs in California). The interpretation of this interaction is the increase (or decrease) in the number of days absent for current ELs who also identify as Latinx.
Even with all adjustments, our work is descriptive. We do not claim that being classified as an EL is the cause of attendance patterns. The value of the work is to identify whether students classified as ELs exhibit different attendance patterns from other students, adjusting for important school- and student-level characteristics that allow us to go beyond absolute or raw differences in attendance—and to investigate patterns among different types of EL classifications.
Research Question 2
The second research question addresses whether absence patterns for EL-classified student groups vary in elementary and secondary grades. We replicated the analyses from our first research question but conducted two separate analyses. First, we restricted our sample only to include students in elementary grades. In the second, we restricted our sample only to include students in secondary grades.
Research Question 3
Our third research question asks whether patterns of absenteeism vary across different groups of EL-classified students (LTELs, newcomer ELs), RFEPs, and ever ELs by grade level. The analytic approach was analogous to the first two research questions; however, we modified the approach for each group of EL-classified students by replacing our key independent variable, ELit, with an indicator for the respective subgroup. In each analysis, we restricted our sample to include the respective subgroup of interest and non-EL students, ensuring that non-ELs consistently serve as the comparison group.
Research Question 4
For this question, we ask whether absenteeism patterns changed before and during COVID. For each subgroup of interest, we modified Equation 1 to include an interaction between the year and the respective subgroup indicator using a sample comprising only the specific subgroup and non-EL students to estimate changes in absenteeism over time.
Findings
Research Question 1: Absence Patterns of EL students
Table 2 presents patterns of absenteeism for EL and non-EL students across our entire sample. First, once we adjust for individual and other characteristics, EL students had fewer absences than non-EL students. Moving from Columns 1 through 4 provides consistent findings that EL students missed about 2.5 fewer days of school compared to non-EL students. Including school, grade, and year fixed effects did not meaningfully alter the size of the estimate. Including a lagged absence measure reduced the estimate by about half (Table 2, Columns 5 and 6). This is consistent with other research finding that absence behavior is not only affected by a one-time external shock (i.e., change of residence, parental divorce, etc.) but also by factors that constantly affect absenteeism year after year (Gottfried, 2010). Finally, the interaction between EL and Latinx itself is not significant, suggesting that there is no statistically evident marginal relationship for EL Latinx students and absenteeism versus non-ELs, non-Latinx students.
Predicting Patterns of Absenteeism Among EL Students
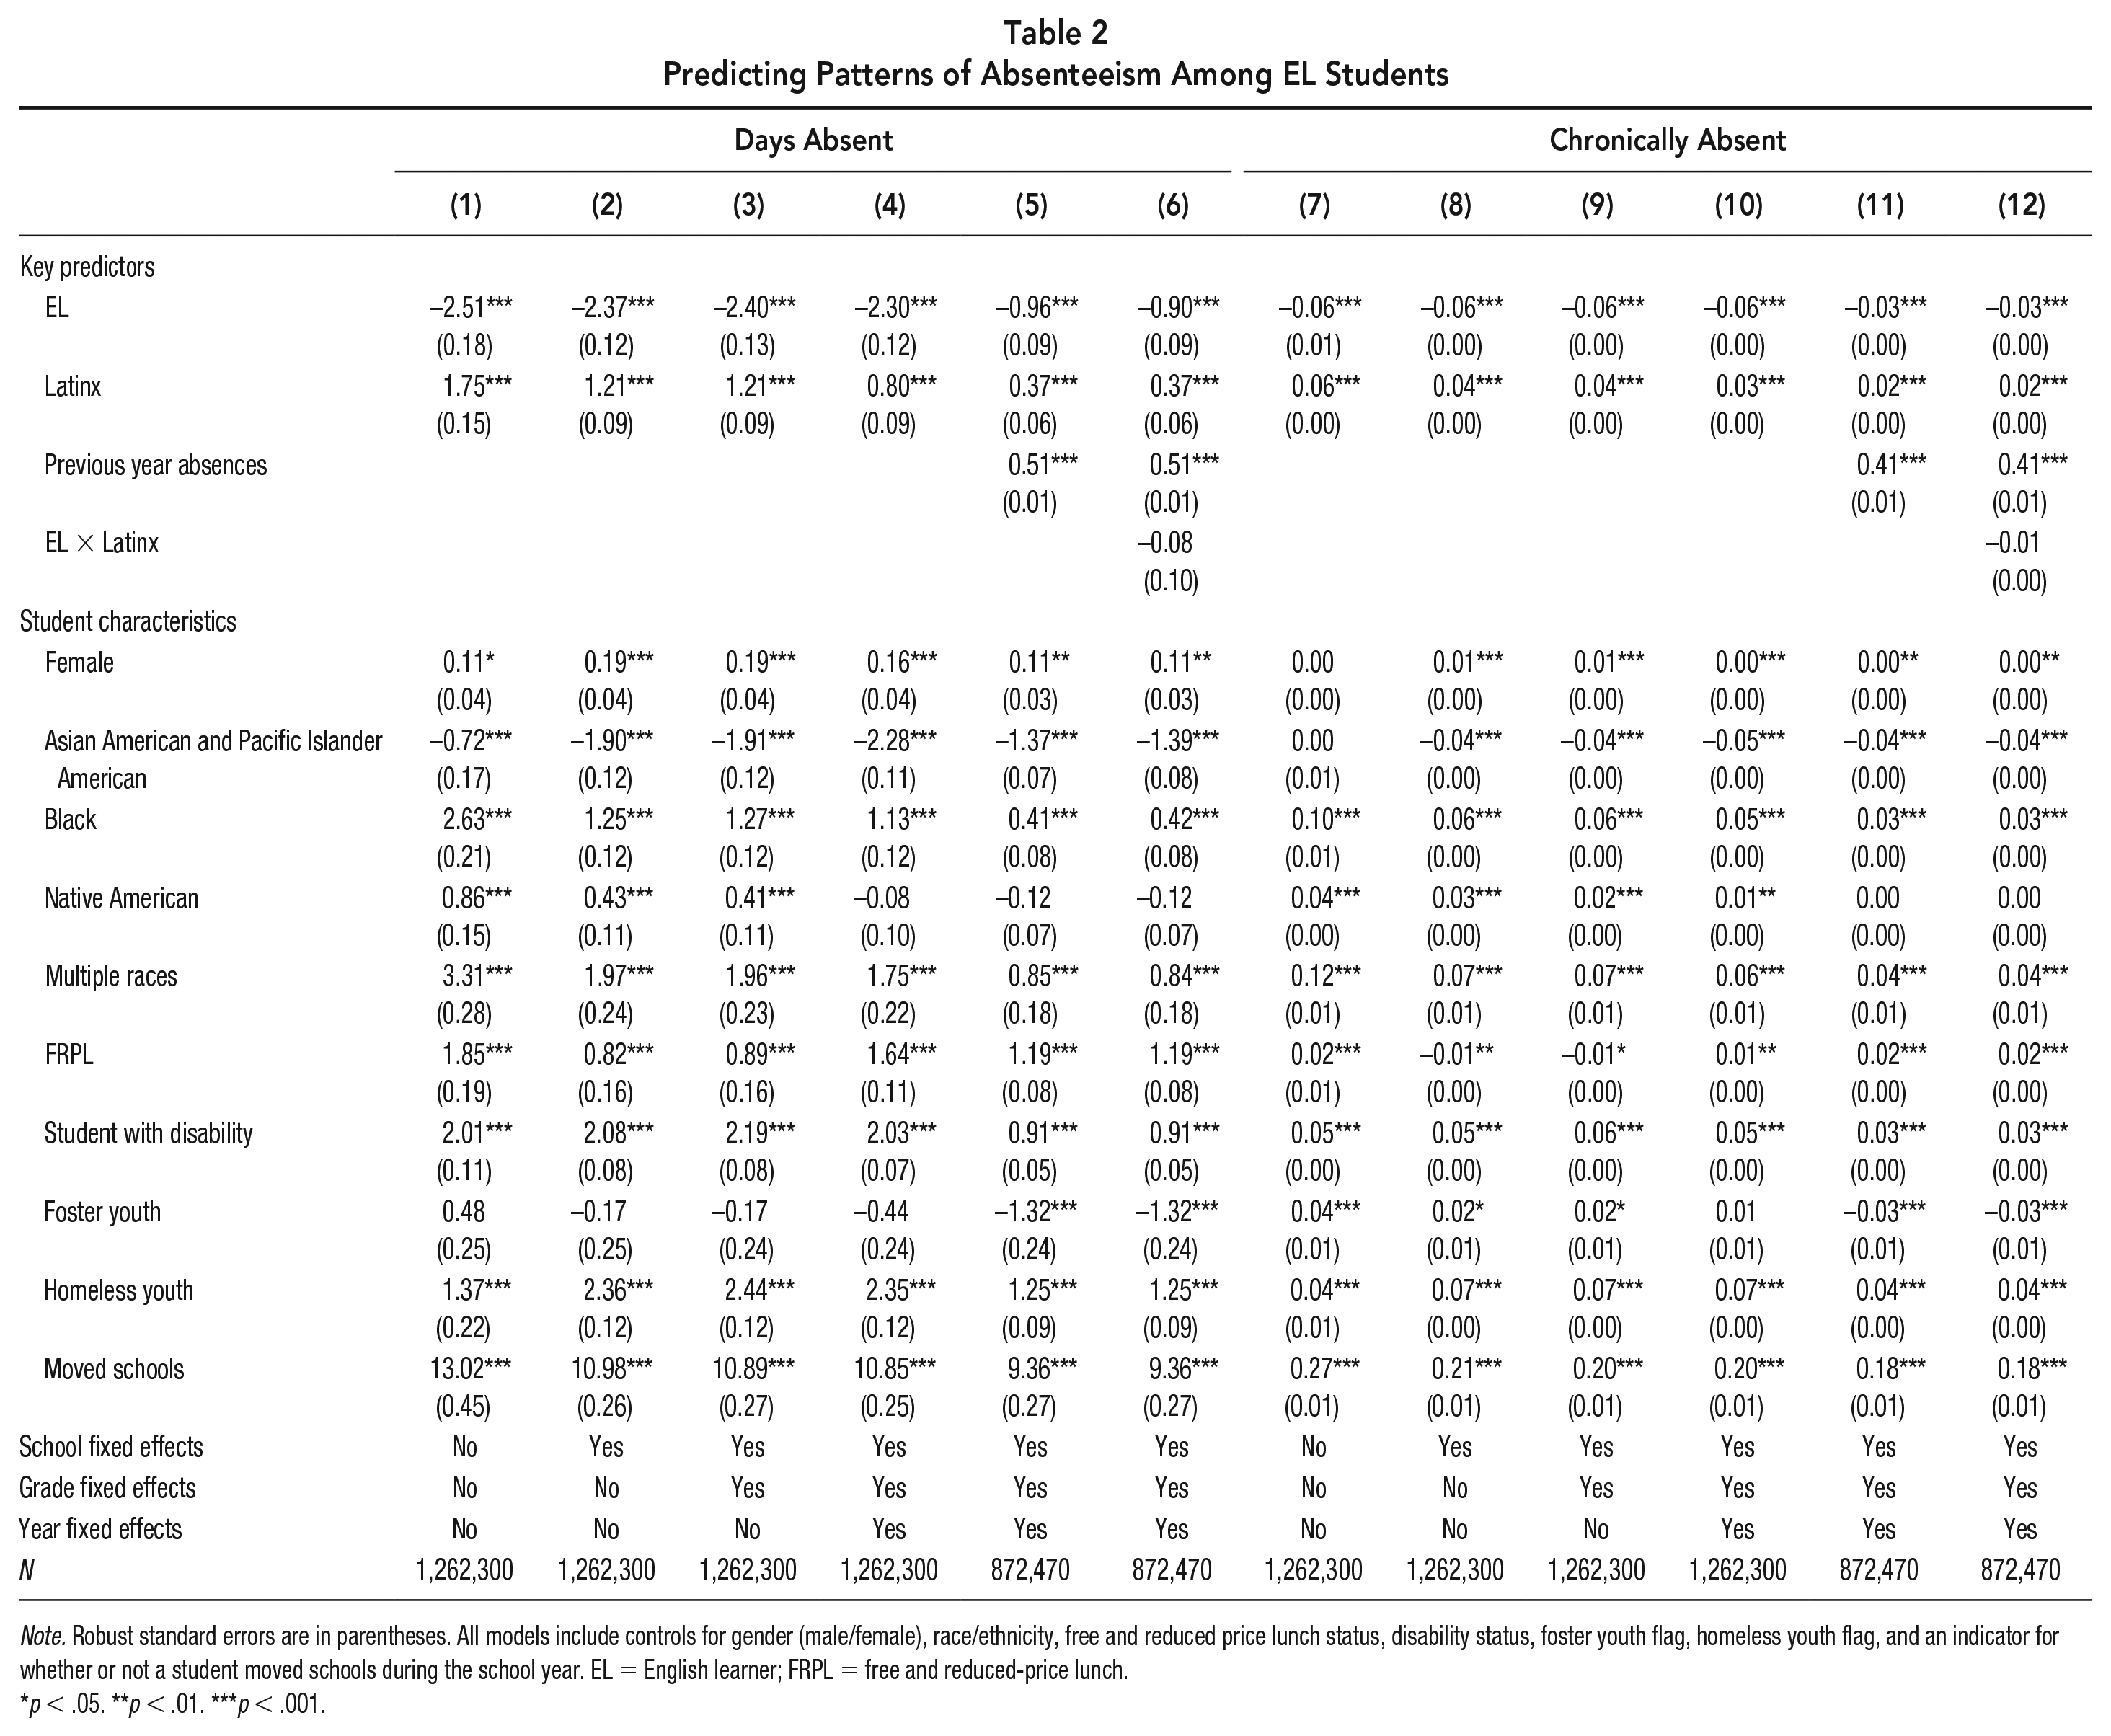
Note. Robust standard errors are in parentheses. All models include controls for gender (male/female), race/ethnicity, free and reduced price lunch status, disability status, foster youth flag, homeless youth flag, and an indicator for whether or not a student moved schools during the school year. EL = English learner; FRPL = free and reduced-price lunch.
p < .05. **p < .01. ***p < .001.
As for the second grouping of findings where chronic absenteeism was the (binary) outcome, EL students were less likely to be chronically absent compared to non-EL students. As with the days absent models, Columns 7 through 10 in Table 2 provide consistent findings that EL students were less likely to be chronically absent by 6 percentage points compared to EL peers overall and in the same school, grade, and year. Like the days absent analysis, the model that included a lagged measure of absenteeism reduced our estimate in half. The EL × Latinx interaction coefficient was not significant at conventional levels for this outcome.
Research Question 2: Absence Patterns by Grade Level
Across all grade levels, EL students were absent from school for fewer days and are less likely to be chronically absent when controlling for individual and other characteristics—this holds true for both elementary and secondary school samples of students (see Table 3). The sizes of the coefficients are larger in the elementary school sample compared to the secondary school sample across both outcomes, suggesting that the negative relationship between ELs and absenteeism is stronger at the elementary level.
Predicting Patterns of Absenteeism Among EL Students by Grade Level
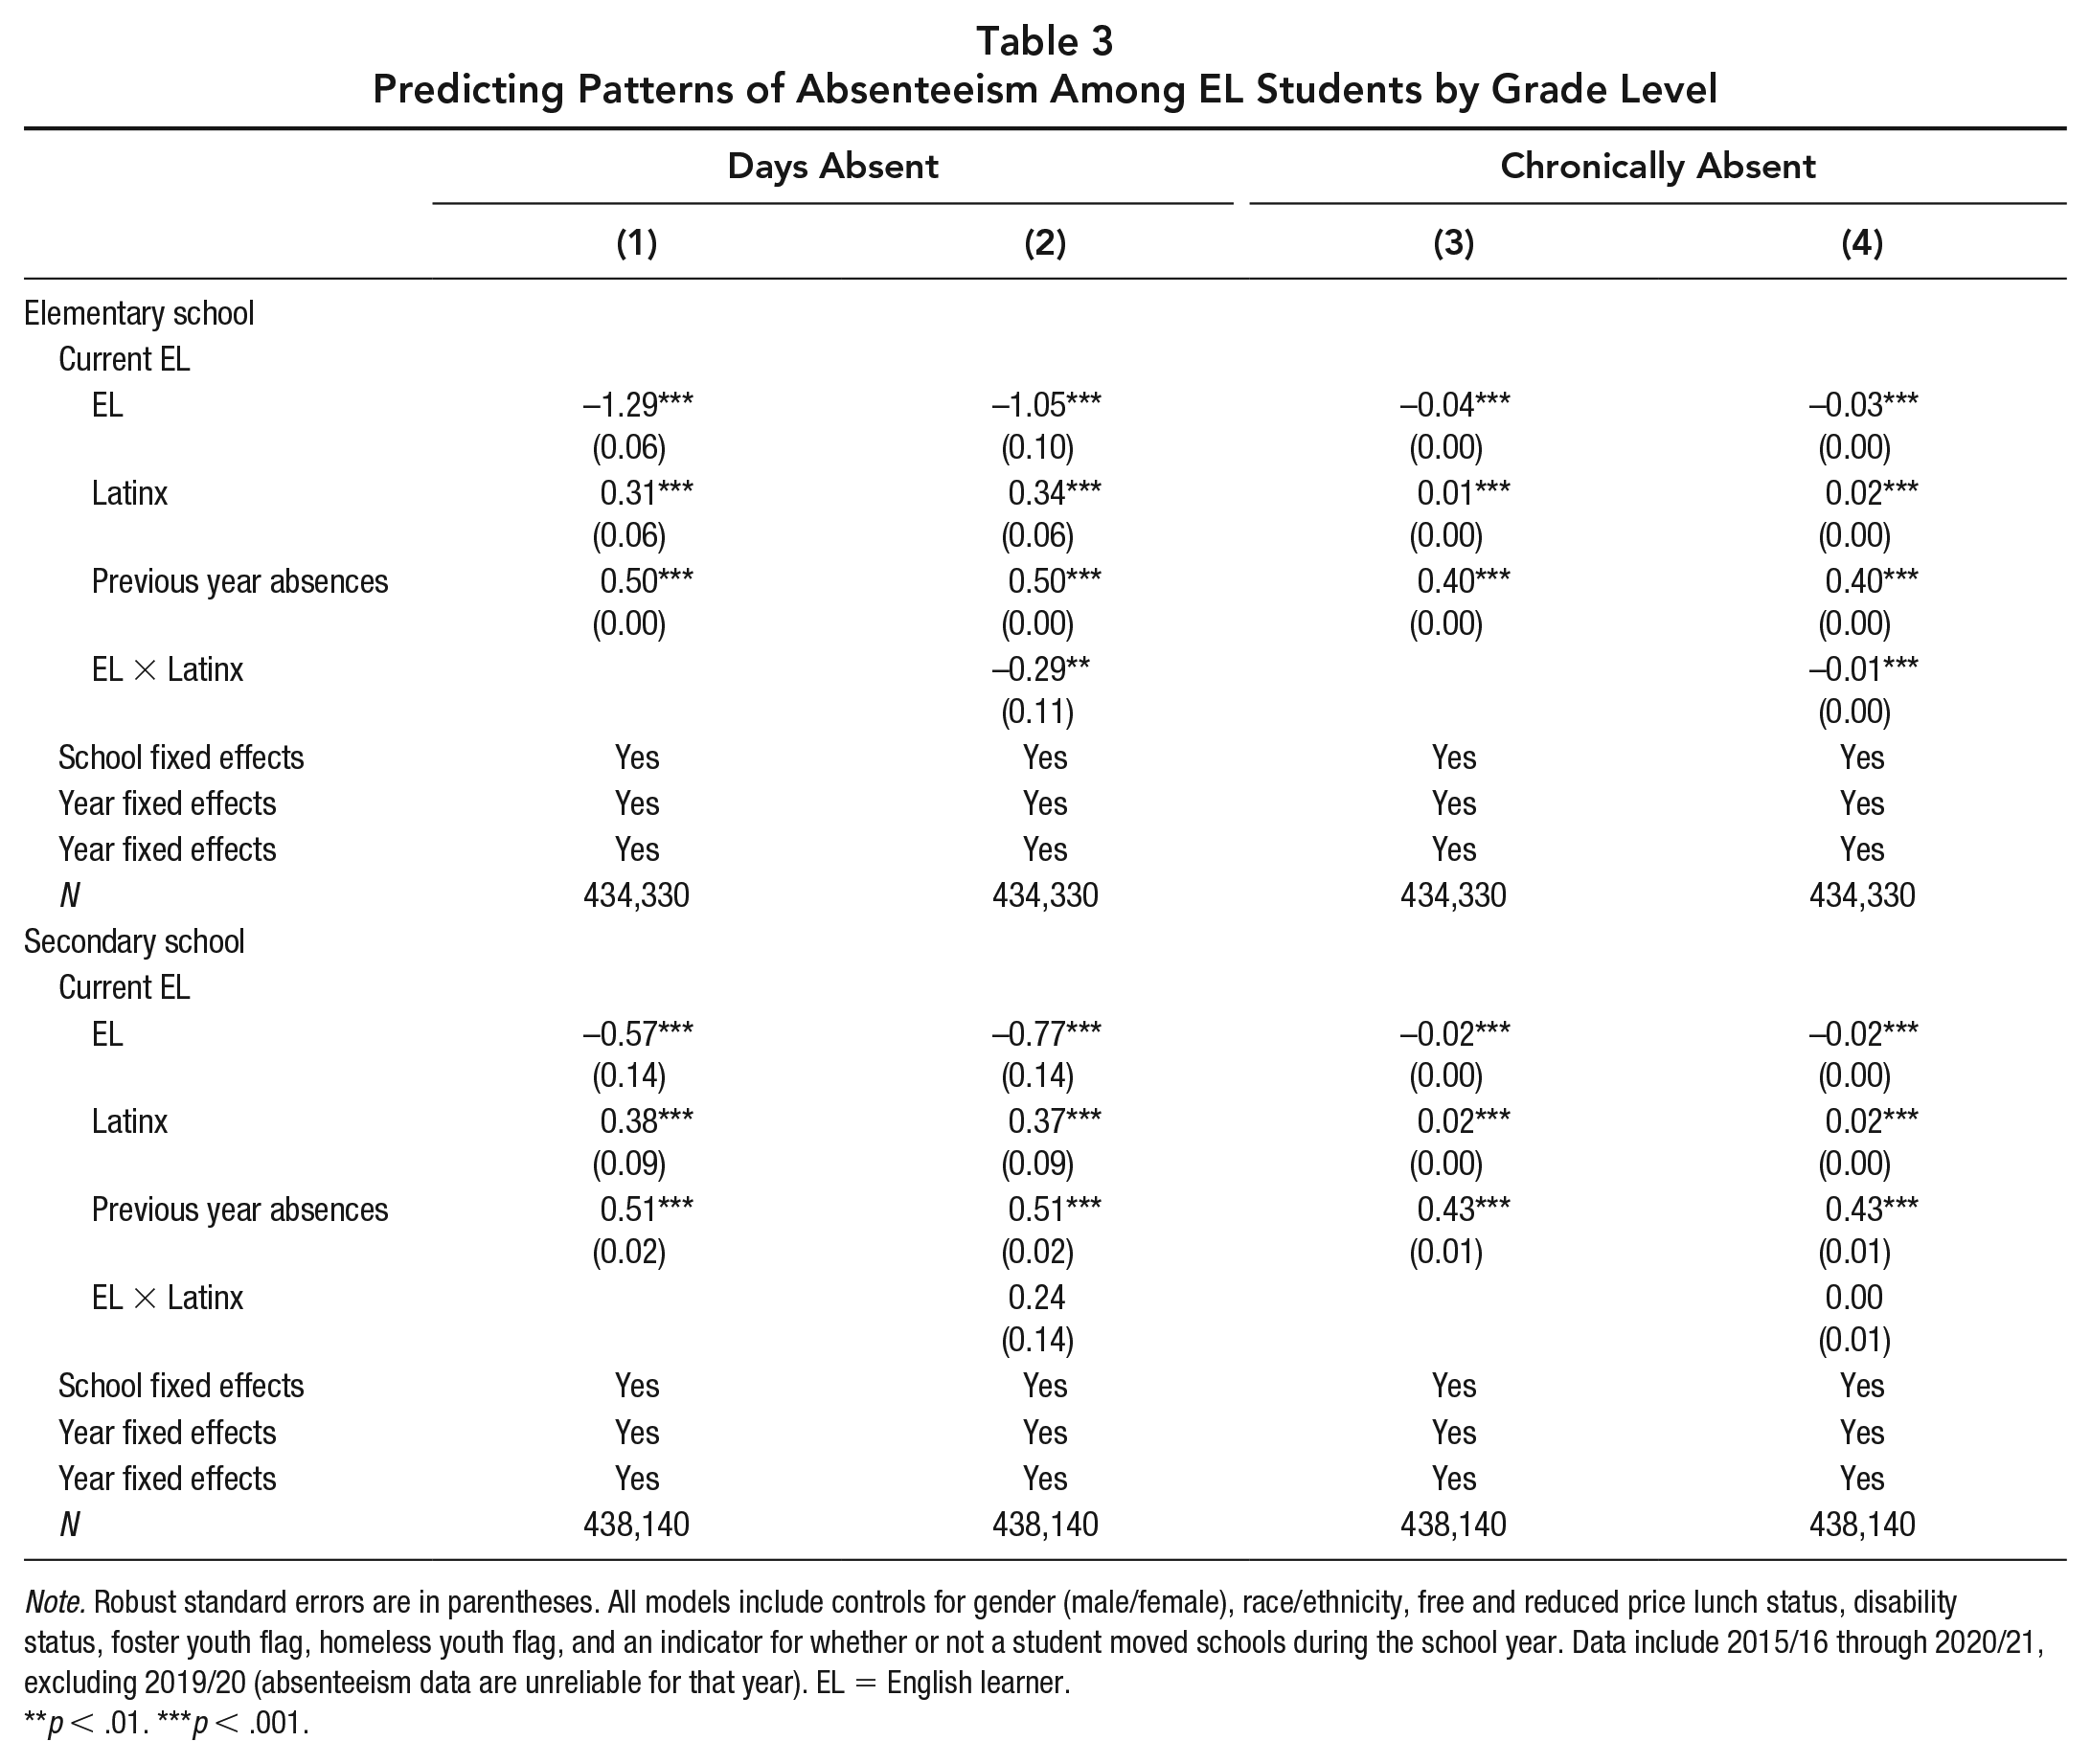
Note. Robust standard errors are in parentheses. All models include controls for gender (male/female), race/ethnicity, free and reduced price lunch status, disability status, foster youth flag, homeless youth flag, and an indicator for whether or not a student moved schools during the school year. Data include 2015/16 through 2020/21, excluding 2019/20 (absenteeism data are unreliable for that year). EL = English learner.
p < .01. ***p < .001.
Research Question 3: Absence Patterns by EL Classification
All EL student subgroups have fewer days absent and are less likely to be chronically absent than non-ELs (see Table 4). That said, the largest (negative) coefficients were for RFEP students. This was not entirely surprising given that RFEPs usually overperform non-ELs on standardized test scores and other measures of school achievement that are usually correlated with lower absenteeism rates (Gándara & Rumberger, 2006; Hill et al., 2014). The one exception to this pattern is newcomer ELs at the secondary level, whose coefficient is close to zero and not statistically significant, suggesting that, other things equal, there isn’t a “protective” EL-related factor for this group.
Predicting Patterns of Absenteeism Among English Learner Classified Student Groups by Grade Level
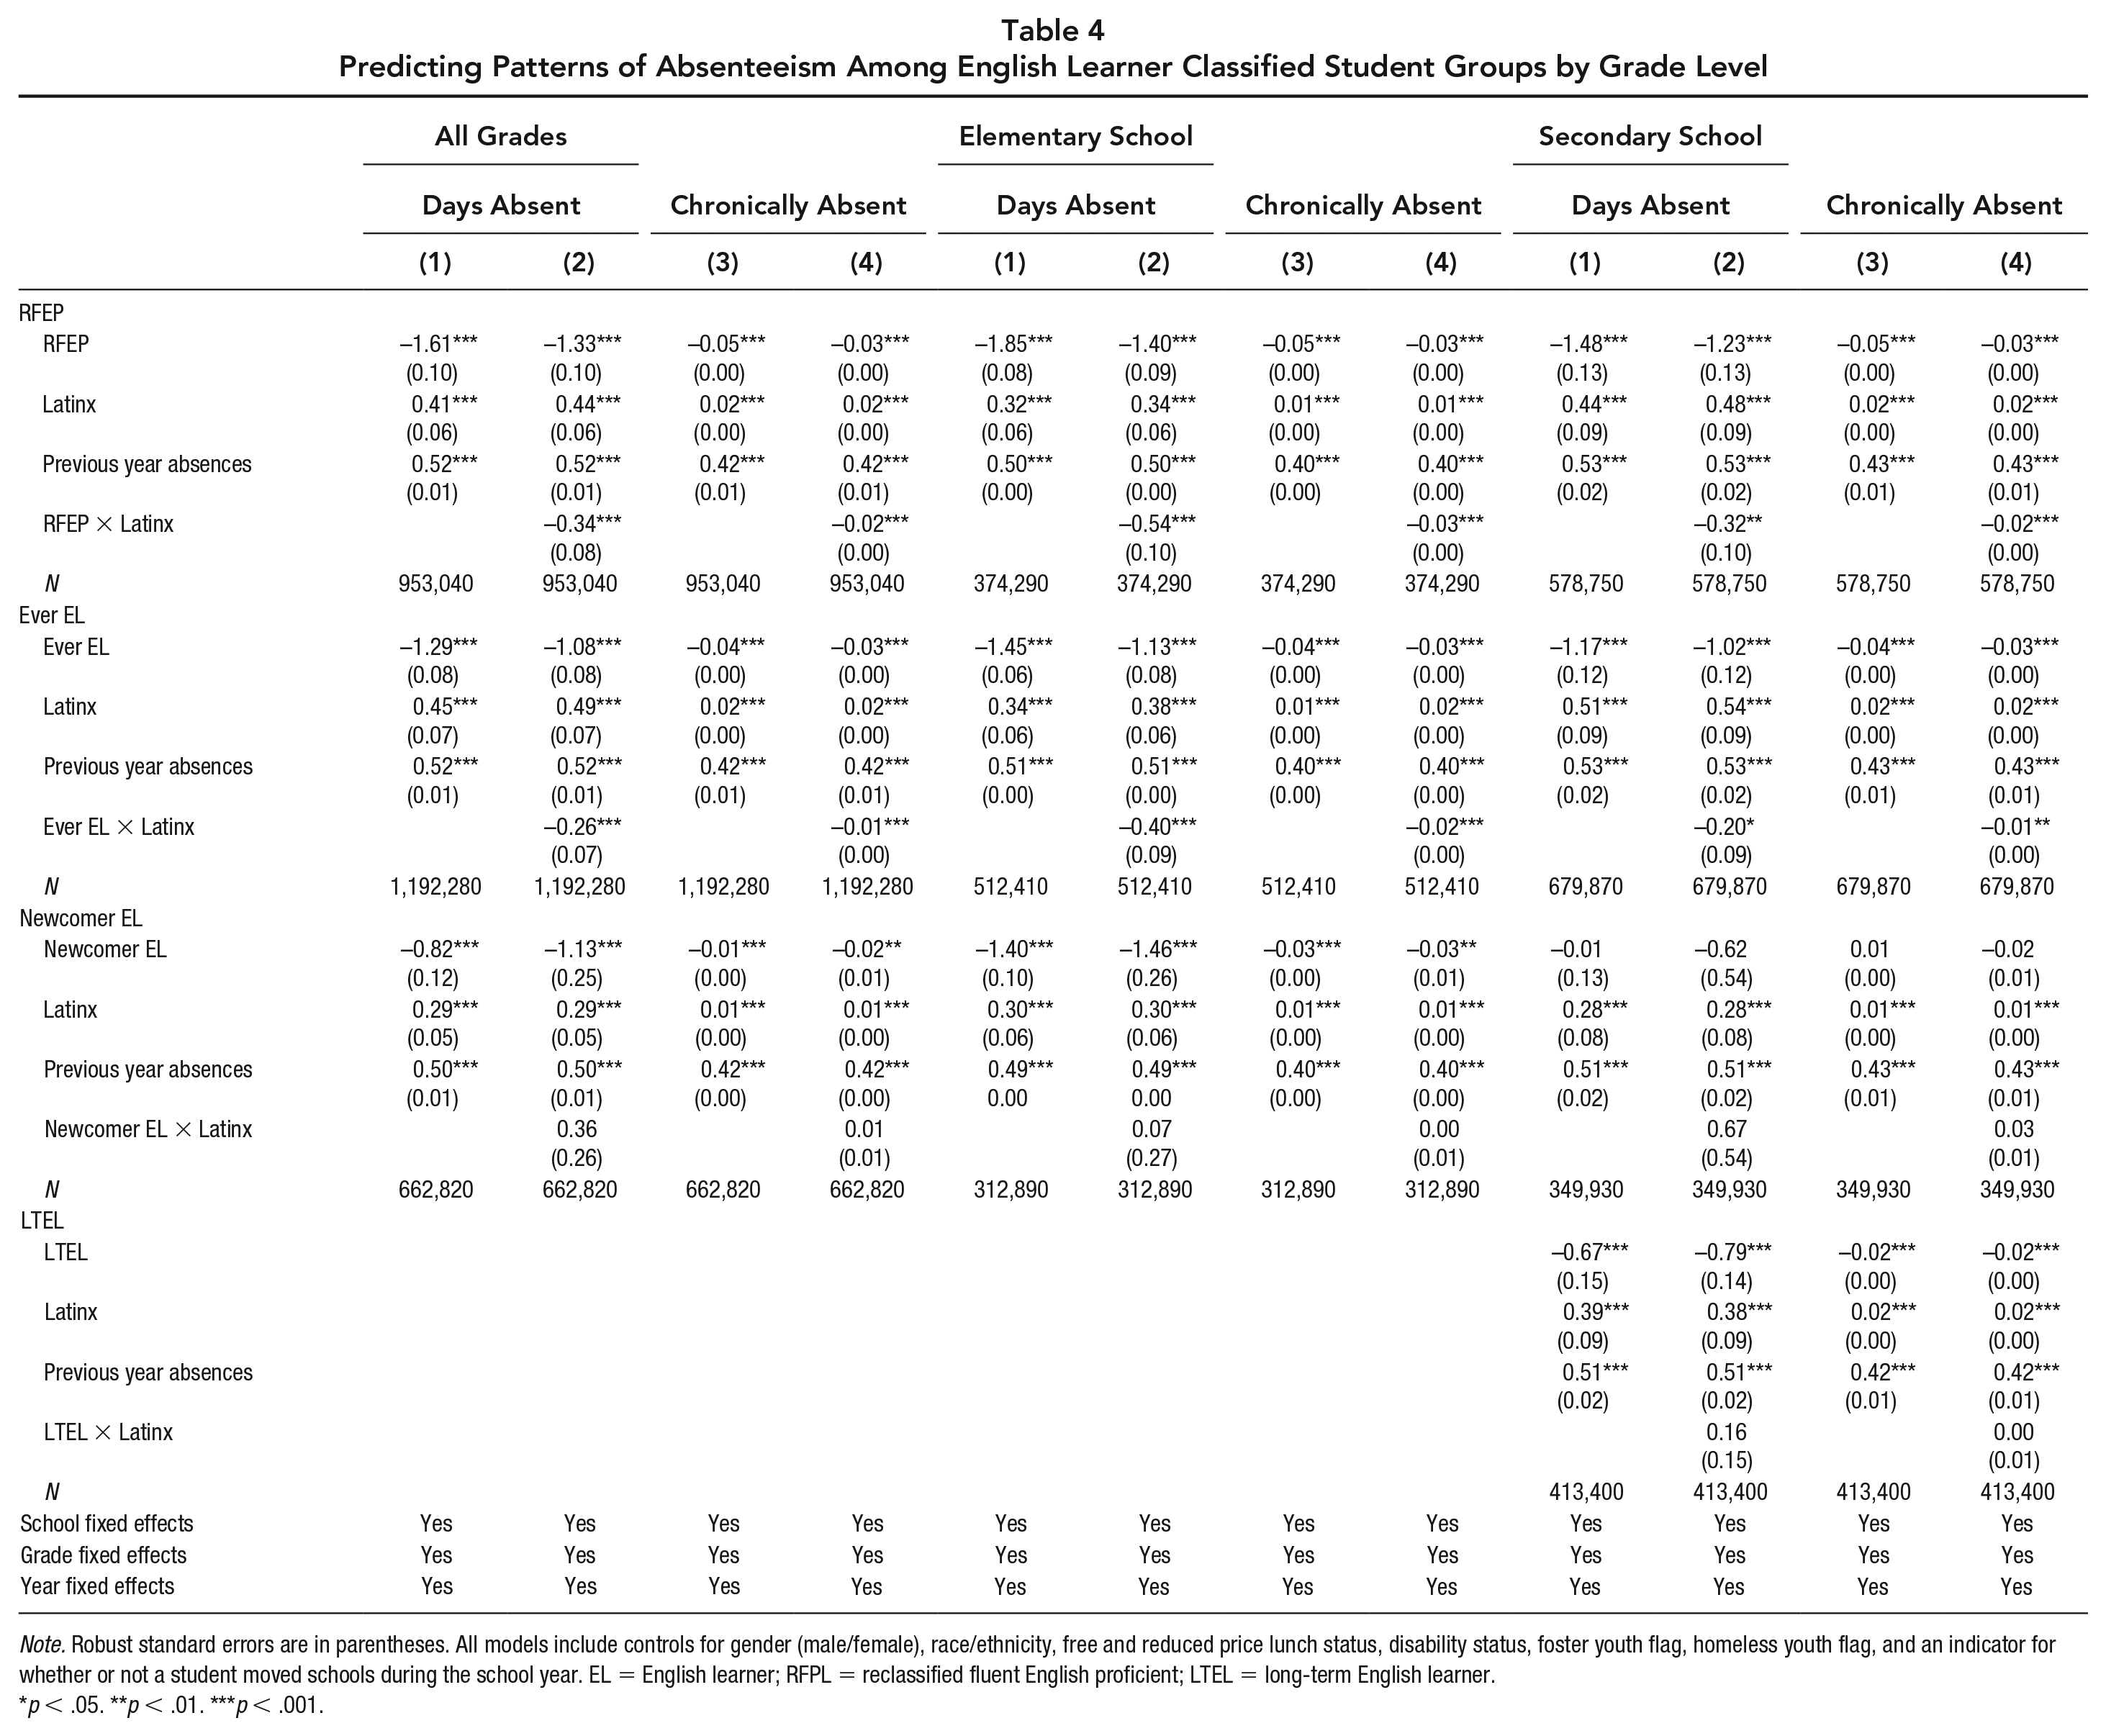
Note. Robust standard errors are in parentheses. All models include controls for gender (male/female), race/ethnicity, free and reduced price lunch status, disability status, foster youth flag, homeless youth flag, and an indicator for whether or not a student moved schools during the school year. EL = English learner; RFPL = reclassified fluent English proficient; LTEL = long-term English learner.
p < .05. **p < .01. ***p < .001.
Research Question 4: Change in Patterns Before and After COVID-19
How do absenteeism rates for ELs look before and during the COVID pandemic? For this analysis we use four pre-COVID years (2015–2016 to 2018–2019) and 2 years right after the onset of COVID (2020–2021 and 2021–2022). The omitted variable category is the first year in our data, 2015–2016. Before the pandemic hit, the yearly marginal effect for current ELs (EL × Year interaction) is not statistically significant, suggesting no discernible time trend before the pandemic hit. In the 2 years of the pandemic (in bold in Table 5), the EL x Year Interaction is positive and significant, suggesting the relationship between EL status and absence rates and chronic absenteeism shifted. The magnitude of the interaction coefficients is small: around 1-1.4 additional absence day and 2 percentage points for the chronic absenteeism indicators, but the trend reversal is telling. The same trend reversal is evident for LTEL students who see rising absenteeism and chronic absenteeism rates after COVID-19. Newcomer ELs do not see a significant trend reversal, i.e. the post-COVID interaction coefficients are not statistically significant. Some of these results vary by grade level, so to investigate further, we separate the analysis for elementary and secondary students (Table A1 and A2 in online appendix). Results show that the issue of rising absenteeism trends for current ELs is greater in the secondary grades (LTELs). In sum, while all EL groups still have lower absenteeism rates overall than non-ELs– other things being equal—there was an evident marginal increase in days absent and chronic absenteeism rates in the first year after the pandemic hit that was most evident for current ELs and LTELs.
Absences by EL Classification Before and After COVID
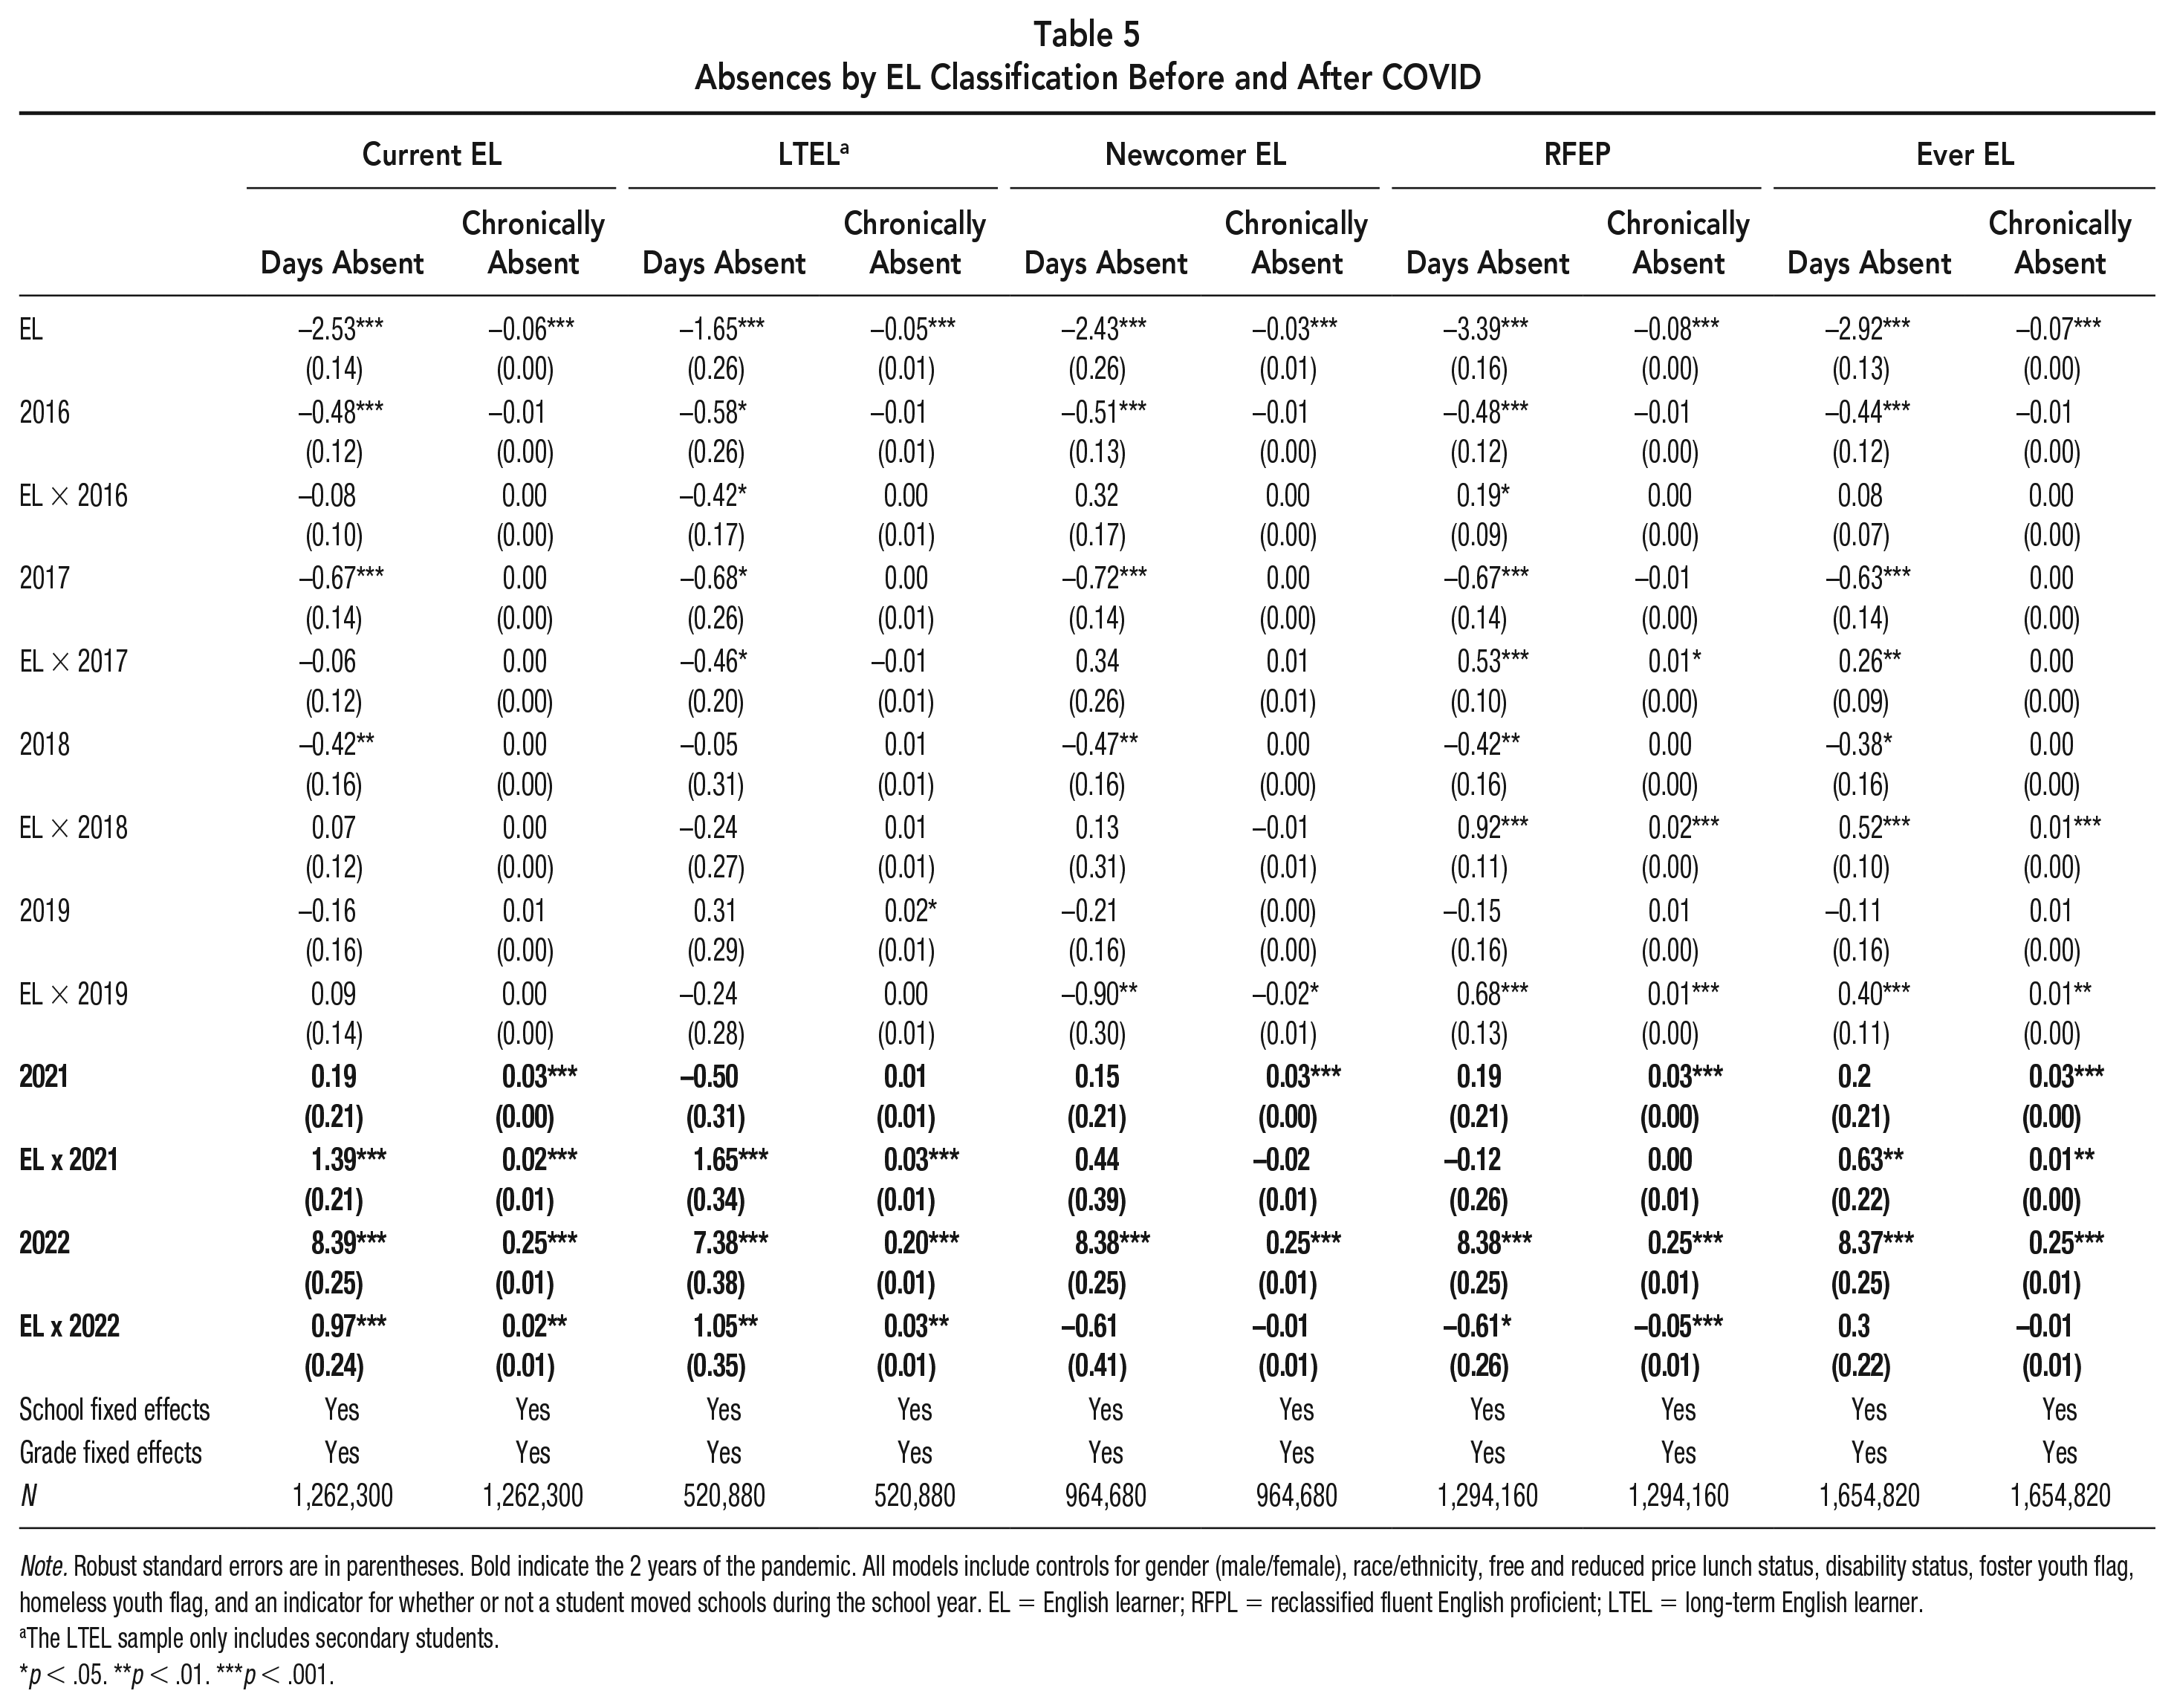
Note. Robust standard errors are in parentheses. Bold indicate the 2 years of the pandemic. All models include controls for gender (male/female), race/ethnicity, free and reduced price lunch status, disability status, foster youth flag, homeless youth flag, and an indicator for whether or not a student moved schools during the school year. EL = English learner; RFPL = reclassified fluent English proficient; LTEL = long-term English learner.
The LTEL sample only includes secondary students.
p < .05. **p < .01. ***p < .001.
Discussion
This article shows that when demographic factors are considered, EL-classified students at all levels are absent at lower rates and are less likely to be chronically absent than non-ELs. This may be explained by the fact that ELs receive language development and other services that encourage school attendance (Sugarman & Lazarín, 2020). Or that ELs, being primarily children of immigrants, have lower residential mobility patterns and families who support regular attendance. Results for newcomer ELs in secondary school are an interesting exception because these students are just as absent as non-ELs. More research is needed to understand why this is the case.
The protective factors that bolstered EL attendance prior to the COVID-19 pandemic for most EL-classified groups seem to have waned after COVID-19 became widespread. Our research finds that holding other factors, current ELs and LTELs experienced higher absence rates after the onset of the COVID-19 pandemic (2019–20) than non-ELs. Understanding the mechanisms for this trend reversal is beyond the scope of this article. Still, undoubtedly, COVID-19 heightened health and economic insecurity for many ELs at a time when many of them were not receiving adequate services or academic support either at school or at home (GAO, 2022). Although many districts outlined specific ways to address EL needs during the move to online instruction, it is unclear how many implemented these plans (Reed et al., 2022). Future work should delve more deeply into the factors that explain the varied absenteeism patterns among EL subgroups and how these may have shifted after COVID-19.
Limitations
Although we leverage a rich data set that allows us to control for many observed and some unobserved variables affecting absenteeism, our analysis is unable to account for factors that could affect absenteeism and EL status, such as distance to school, health, or family issues and importantly, immigration status and other unobserved variables that vary over time. These factors could be confounded with the EL variable and if correctly adjusted for, could change the coefficients estimated here. Nonetheless, we are confident our analysis provides an accurate approximation of patterns of absenteeism among ELs because we have variables that could approximate the influence of these unobserved factors. These include school mobility (whether a student changed schools in the past year), school fixed effects (to account for any characteristics that are not likely to vary much in our time period and have an influence on absenteeism, such as neighborhood safety, community involvement, school climate, etc.), and year fixed effects (to account for any exogenous shocks, such as the health impacts of the COVID-19 pandemic on all schools). In addition, including prior-year absences is likely to adjust for structural factors (i.e., health issues, family circumstances) that affect absenteeism and correlate from year to year.
Concluding Remarks
The finding that the protective factors previously maintaining low absenteeism rates among current ELs and LTELs relative to other groups prior to the pandemic (adjusting for demographic, socioeconomic, and other characteristics) have now diminished is troubling. This is particularly concerning given what we know about how learning losses compound for ELs. EL students derive disproportionate benefits from being in school—and conversely, they see academic achievement and prospects diminished more than other groups when frequently absent. These findings call for urgent and renewed attention to this subgroup to curtail any lingering effects on EL absenteeism from the COVID-19 pandemic. Schools and districts should ensure that EL students receive quality services and educational experiences that encourage them to be present in school for as much time as possible to receive the services they are entitled to. This is particularly important in middle and high schools and for LTELs, where persistent negative absenteeism patterns that arose during the pandemic are observed.
Supplemental Material
sj-pdf-1-edr-10.3102_0013189X241258770 – Supplemental material for English-Learner-Classified Students and Absenteeism: A Within-Group Analysis of Missing School
Supplemental material, sj-pdf-1-edr-10.3102_0013189X241258770 for English-Learner-Classified Students and Absenteeism: A Within-Group Analysis of Missing School by Lucrecia Santibañez, Michael A. Gottfried and Jennifer A. Freeman in Educational Researcher
Footnotes
Notes
Authors
References
Supplementary Material
Please find the following supplemental material available below.
For Open Access articles published under a Creative Commons License, all supplemental material carries the same license as the article it is associated with.
For non-Open Access articles published, all supplemental material carries a non-exclusive license, and permission requests for re-use of supplemental material or any part of supplemental material shall be sent directly to the copyright owner as specified in the copyright notice associated with the article.