
Abstract
Education researchers use surveys widely. Yet, critics question respondents’ ability to provide high-quality responses. As schools increasingly use student surveys to drive local policy making, respondents’ (lack of) motivation to provide quality responses may threaten the wisdom of using questionnaires for data-based decision making. To better understand student satisficing—the practice of suboptimal responding on surveys—and its impact on data quality, we examined its pervasiveness and impact on a large-scale social–emotional learning survey administered to 409,721 elementary and secondary students. Findings indicated that despite the prevalence of satisficing, its impact on data quality appeared more modest than anticipated. We conclude by outlining an accessible approach for defining and calculating satisficing for researchers, practitioners, and policymakers.
Keywords
Social scientists, including educational researchers, have long maintained a love–hate relationship with surveys. On the one hand, surveys uncover respondents’ values, perceptions, and attitudes efficiently and at scale (Gehlbach, 2015; Gilbert, 2006; West et al., 2017). Surveys’ flexibility allows respondents to report on themselves (i.e., self-report measures), other individuals, or their perceptions of a whole class or community.
On the other hand, skeptics have critiqued the value of survey data, often focusing on three concerns. First, some raise questions about the introspective abilities participants need to provide high-quality answers. For example, Nisbett and Wilson (1977a, 1977b) provided multiple examples of people’s erroneous attempts to understand their own choices. Others show how respondents readily report on policies that do not exist, thus, showing how people report opinions that they could not possibly have (Bishop et al., 1980).
A second challenge arises from critics who acknowledge that people might know their own attitudes but worry that subtle forces may inhibit respondents’ accurate reporting. These forces include phenomena such as acquiescence bias, social desirability, floor/ceiling effects, biased question wording, response order effects, and so forth (e.g., Krosnick, 1999).
Yet, survey designers can delimit surveys to topics that respondents might reasonably have opinions on. Furthermore, they can design surveys to accord with many of the best practices that survey researchers have developed (Gehlbach & Artino, 2018). So, although these two potential problems with survey research as a methodology are real and need to be taken seriously, they are rarely insurmountable.
Third, and potentially more challenging, are concerns about participants’ motivation to take the survey seriously. In its most extreme form, some may become “mischievous responders” (Robinson-Cimpian, 2014) who actively strive to give false answers, perhaps out of boredom or an attempt to be funny. Krosnick (1991) describes milder, and potentially more prevalent forms of “satisficing,” where respondents fail to put forth their best efforts in responding. This motivation problem is sufficiently common that some researchers have even used respondents’ effort (or lack thereof) on questionnaires as a performance task to measure the personality trait of conscientiousness (Hitt et al., 2016; Zamarro et al., 2018).
As schools increasingly aim to inform their policies with survey data, this motivation problem presents a unique challenge. If respondents want to skip items, quit early, or speed through the survey by giving the same answer each time, researchers can do little to prevent it. Practitioners and policymakers face a complementary problem: They need to understand the pervasiveness of satisficing to determine to what extent satisficing affects data quality. We address both challenges by investigating satisficing in an ongoing, large-scale survey of elementary and secondary students’ social–emotional learning in California. This article outlines straightforward strategies for detecting, assessing, and accounting for satisficing in survey data. Within the larger literature around participant satisficing (e.g., Barge & Gehlbach, 2012; Hitt et al., 2016; Krosnick, 1991; Soland, 2018), we hope this study provides educational decision makers with accessible tools for identifying potentially problematic response patterns.
Satisficing
Traditionally, “satisficing” refers to a cognitive heuristic in which people employ suboptimal decision-making strategies to conserve mental energy (Simon, 1957; Simon & Stedry, 1968). For example, rather than searching for an “optimal” solution, some decision makers select the first satisfactory alternative that seems “close enough,” thereby saving time and effort. Survey scholars have adapted this concept to explain respondents’ suboptimal behaviors (Krosnick, 1991; Tourangeau, 1984). On surveys, satisficing can include selecting the first reasonable response option, agreeing with all the statements presented, selecting the same option repeatedly in a straight line across multiple items, and consistently selecting the “don’t know” or “not applicable” responses (Barge & Gehlbach, 2012; Krosnick, 1991).
Although some survey researchers have reported on participant satisficing, few systematically include these details. Barge and Gehlbach (2012) examined the effects of satisficing on the reliability of and associations between scales for two surveys administered to college students. The authors found that most students engaged in at least one form of satisficing (61% and 81% of students across the two surveys). This satisficing resulted in artificially inflated internal consistency estimates and correlations between scales. The pervasiveness of these practices and implications for data interpretation underscore the need to further explore survey satisficing and its potential consequences, especially for younger students who may struggle with how certain items are written (e.g., negatively worded items; Benson & Hocevar, 1985). This knowledge is particularly important now as large-scale data are increasingly used to guide decisions for policy and practice (Marsh et al., 2018).
Strategies for detecting satisficing include a range of methods that vary in complexity (Barge & Gehlbach, 2012; Steedle et al., 2019). Ideally, any set of procedures to address satisficing should be as broadly accessible as possible. Toward this end, we focus on three respondent behaviors that researchers, practitioners, and policymakers can assess within almost all survey-based data sets: early termination—when respondents fail to complete the full survey; nonresponse, or omitted items; and straight-line responding—when respondents select the same response option repeatedly (e.g., for at least 10 consecutive items).
In this study, we operationalized straight-line responding as 10 consecutive items based on prior research (Barge & Gehlbach, 2012), and because it fit the context of this particular survey given the placement of reverse-scored items. Although it seemed plausible for students to respond similarly across multiple items within the same construct, the likelihood of 10 identical responses in a row spanning multiple constructs and reverse-scored items seemed vanishingly small. This operationalization also should help distinguish straight-lining from ostensibly similar cognitive biases, such as carryover effects. Straight-line responding helps respondents conserve cognitive effort. By contrast, carryover effects (Dillman et al., 2014) can occur when participants perceive similarities from one survey item to a subsequent item, thereby encouraging (overly) similar responses. Because multiple constructs are included in all 10-item sets within the survey, participants should see conceptual differences between items.
In sum, we operationalized satisficing as engaging in one or more of these three suboptimal response patterns: early termination, nonresponse, or straight-line responding. Although other approaches exist (e.g., Hitt et al., 2016; Robinson-Cimpian, 2014; Steedle et al., 2019), we focused on three straightforward, accessible strategies for systematically defining, calculating, and reporting satisficing in large-scale student survey data. By doing so, we hoped that these simple steps might be widely adopted by as many users of survey data as possible within their specific educational contexts.
Research Questions and Hypotheses
To boost the transparency and credibility of our findings, we preregistered a set of hypotheses (https://osf.io/36zqk/) according to recommended practices (Gehlbach & Robinson, 2018). Specifically, we wanted to know (a) to what extent students engaged in survey satisficing, (b) which form of satisficing posed the largest threat to survey data, (c) which response option students were most likely to select when straight-lining in order to better discern how this strategy might affect students’ mean scores on the survey scales, and (d) which students were most likely to satisfice.
Informed by our exploratory pilot data and prior research, we tested the following prespecified hypotheses:
Method
Sample
This study examined secondary data collected through the Policy Analysis for California Education’s CORE-PACE Research Partnership. We analyzed student responses to a set of social–emotional learning (SEL) items administered as part of a larger survey to several California school districts during the 2014–2015 and 2015–2016 school years. The full survey included SEL items followed by a set of school culture and climate items; however, the number of culture and climate items varied across districts and school years. Thus, we restricted our analyses to the SEL items.
For our pilot, we conducted exploratory analyses on the 2014–2015 school year data. These analyses generated the preregistered hypotheses that we tested on the 2015–2016 data. The sample (N = 409,721) for our confirmatory study included students from a subset of the CORE school districts (see the full list here: https://edpolicyinca.org/initiatives/core-pace-research-partnership). Except for two second graders, students ranged from Grades 3 through 12. The sample included 146,126 elementary school students; 125,747 middle school students; and 137,838 high school students. Table 1 provides a complete description of student demographics.
Student Demographics
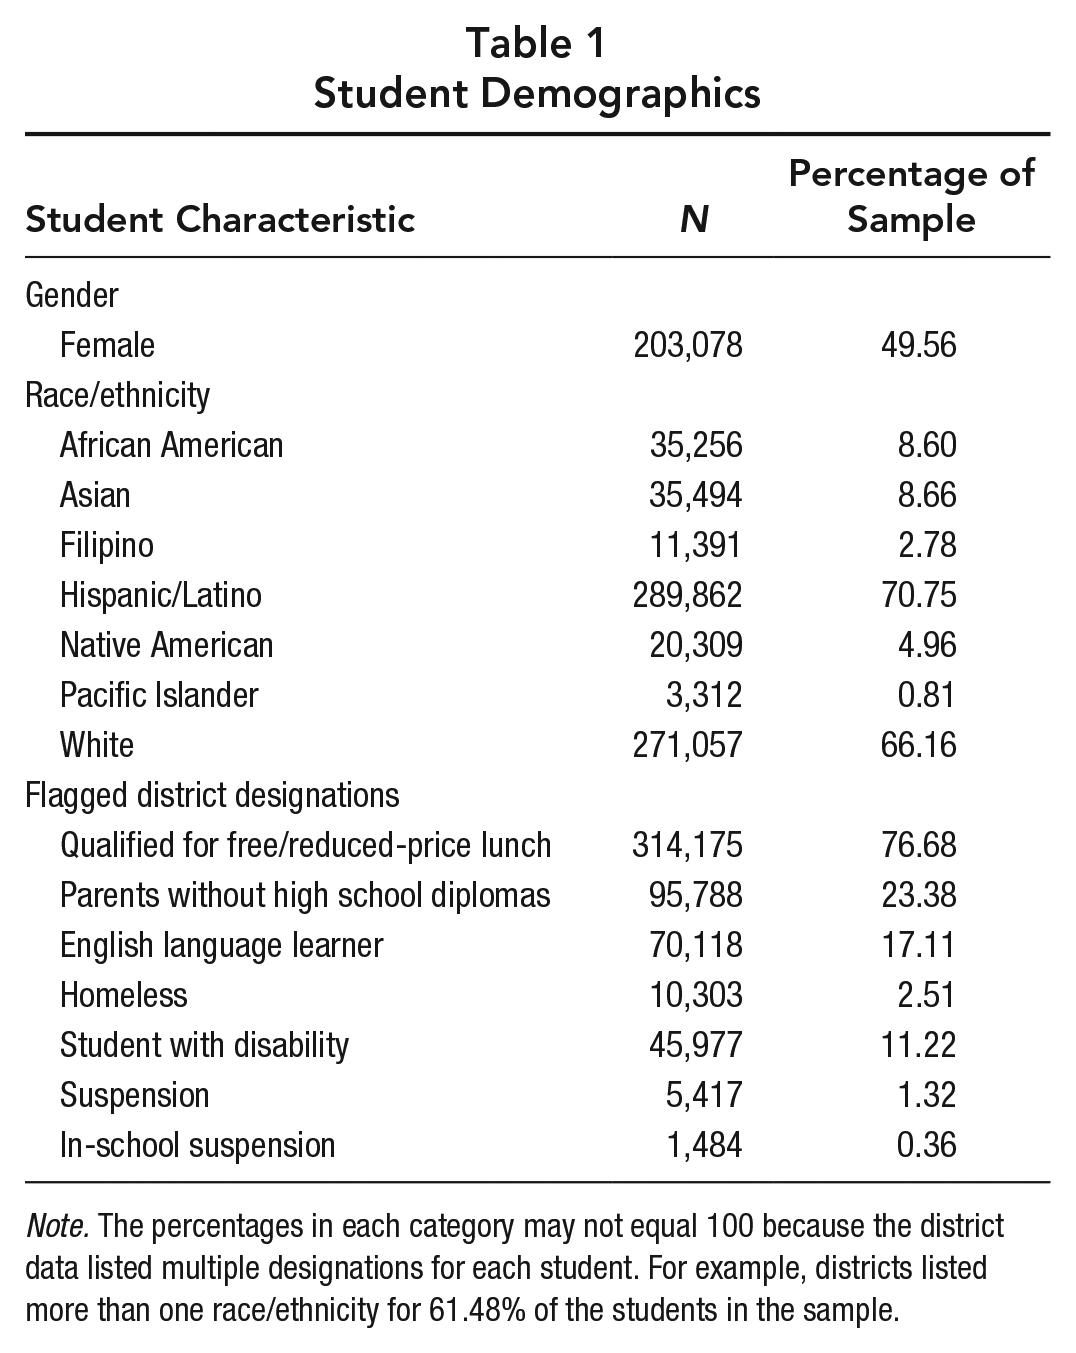
Note. The percentages in each category may not equal 100 because the district data listed multiple designations for each student. For example, districts listed more than one race/ethnicity for 61.48% of the students in the sample.
Measures
The 25-item SEL survey included four scales measuring growth mindset (n = 4 items), regulation (n = 9 items), self-efficacy (n = 4 items), and social awareness (n = 8 items). Example items for each scale included: “My intelligence is something that I can’t change very much,” “I got my work done right away instead of waiting until the last minute,” “I can do well on all my tests, even when they’re difficult,” and “How carefully did you listen to other people’s points of view?” respectively. We present all items for the complete scales and their five response options in Appendix A of the online supplementary materials (available on the journal website). Means, standard deviations, and internal consistency reliability estimates are in Table 2. Overall, the goal of measuring these constructs was to better understand students’ SEL and to support school-level data-driven decision making. For more information about the development of this survey (e.g., how SEL competencies were determined, how measures were selected and tested, etc.), please see West et al. (2018).
Descriptive Statistics for the Complete and High-Fidelity Samples
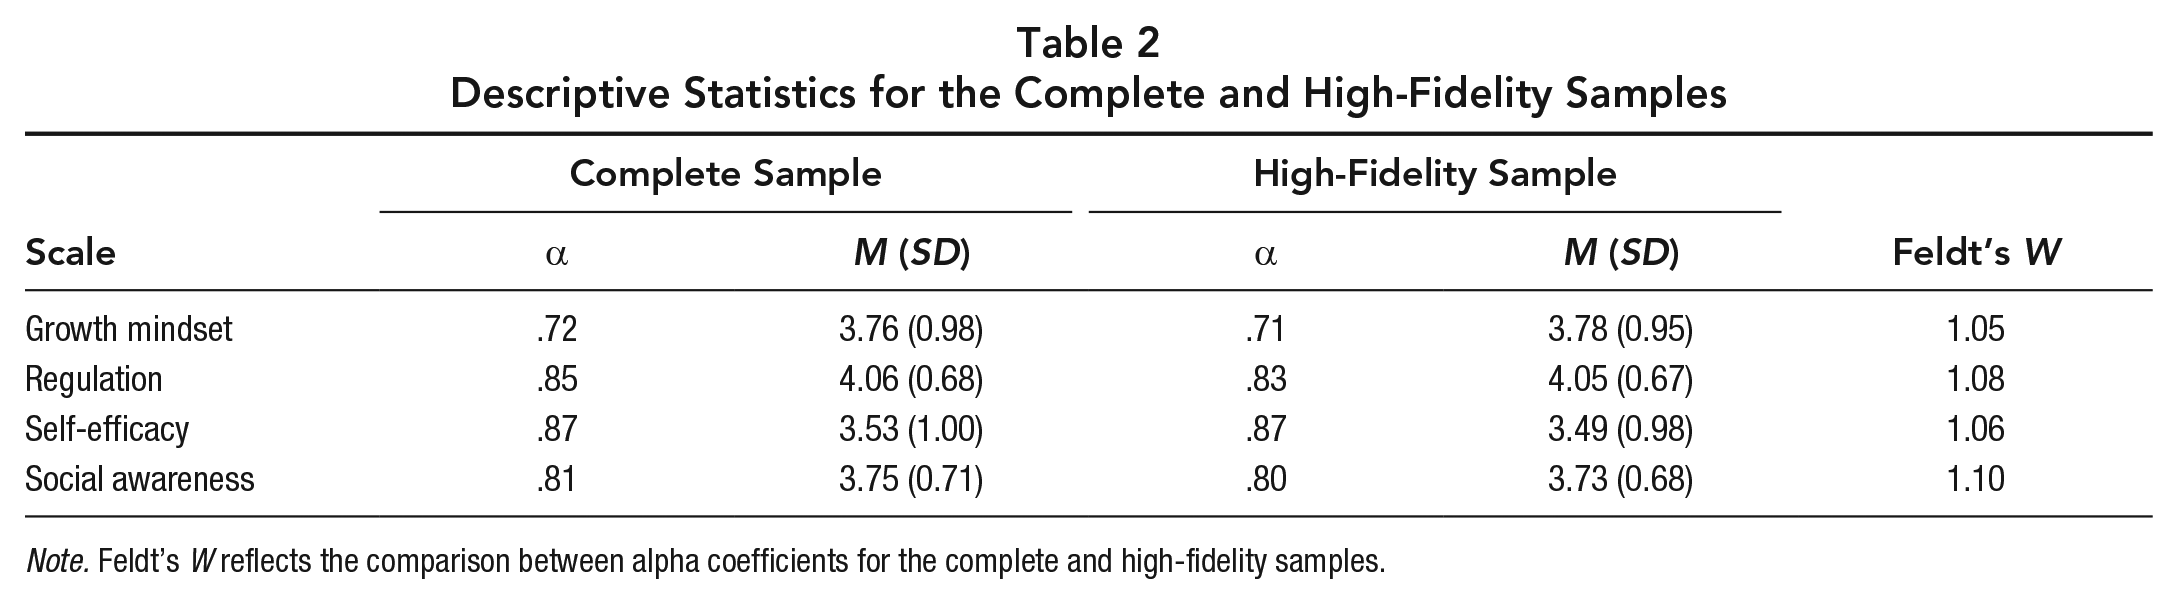
Note. Feldt’s W reflects the comparison between alpha coefficients for the complete and high-fidelity samples.
Procedures
For each satisficing behavior, we determined whether respondents engaged in the specific response strategy or not (coded as 1 or 0, respectively). We operationalized early termination as ending the survey prior to completing the final survey item (i.e., Item 25). Nonresponse was operationalized as omitting at least one item in the survey prior to a respondent’s last completed item. This approach allowed us to avoid double-counting nonresponders and early terminators.
To identify straight-line responding, we analyzed the standard deviation for each sequential set of 10 items across the survey (e.g., Items 1–10, 2–11, 3–12, etc.). Standard deviations of zero for a given set indicated that the student selected the same response option for each of the 10 items. Thus, across the 16 possible intervals (i.e., the 16 sets of 10 sequential items), students qualified as straight-liners if they used the strategy at least once. Finally, we determined overall satisficing—whether a student satisficed at any point during the survey—by summing these three binary values; values greater than zero indicated that a student satisficed at some point during the survey. Please see Appendix B in the online supplementary materials (available on the journal website) for detailed descriptions of these calculations.
Preregistered Results
Hypothesis 1: Overall Rate of Satisficing
We tested our first hypothesis that at least 10% of the sample would engage in survey satisficing by dividing the number of students who satisficed by the total number of participants. Our data supported the hypothesis with 30.36% of students engaging in at least one form of satisficing. The satisficing included 3.73% early termination, 24.99% nonresponse, and 5.38% straight-line responding. Some students engaged in multiple forms of satisficing (3.26% engaged in two forms, and 0.14% engaged in all three).
Hypothesis 2: Survey Impact
We hypothesized that out of the three response patterns, straight-line responding would affect the greatest number of total survey items. In contrast to nonresponse and early termination, which might affect as little as a single item, straight-line responding even once implicates a minimum of 10 items, by definition. The results supported our hypothesis in that students who straight-lined engaged in this behavior for a mean of 3.90 intervals (each interval represents a set of 10, potentially overlapping items; SD = 4.04). This average corresponds to selecting the same response option almost 13 items in a row. In comparison, average nonresponse corresponded to 1.77 skipped items, and average early termination resulted in ending 3.52 items early. Thus, even though more students engaged in nonresponse compared with straight-line responding (24.99% compared with 5.38%, respectively), fewer items were implicated by nonresponse.
Hypotheses 3a and 3b: Straight-Line Responding
We tested Hypothesis 3a, that participants who straight-lined would select the most extreme response option on the right-hand side of the scale over half the time, by examining the frequencies for how often straight-line responding occurred for the first, second, third, fourth, and fifth response options. We then calculated the percentage of straight-line responding that occurred using the fifth response option (i.e., the choice farthest to the right). Participants selected this response option 46.02% of the time across the 16 intervals–short of the majority we had predicted. The second most frequently selected option was the middle option (M = 29.97%).
To examine whether straight-line responding affected students’ mean scores for the four scales (Hypothesis 3b), we conducted a series of two-sample t tests for each scale. We compared the complete sample with the high-fidelity sample (i.e., the sample after excluding respondents who straight-lined). 1
Although the effect sizes were small, the complete sample had higher mean scores than the high-fidelity sample for: regulation, t(796909) = 9.68, p < .001, 99% CI 0.01, 0.02], Cohen’s d = 0.02; self-efficacy, t(794575) = 16.19, p < .001, 99% CI [0.03, 0.04], Cohen’s d = 0.04; and social awareness, t(795008) = 14.93, p < .001, 99% CI [0.02, 0.03], Cohen’s d = 0.03. The same pattern emerged for the growth mindset scale; however, the items were reverse scored. Students who straight-lined on the far right-hand side of the scale (i.e., selecting Response Option 5) endorsed the conceptual opposite of growth mindset. Thus, after accounting for the reverse-scored growth mindset items, we found that the growth mindset scores mirrored the pattern of the other scales. Specifically, the complete sample had lower scores than the high-fidelity sample, t(794700) = −6.51, p < .001, 99% CI [−0.02, −0.01], Cohen’s d = 0.01 (see Table 2). In sum, the pattern of how students engage in straight-line responding affected the overall mean scores for each construct.
Hypothesis 4: Identifying Satisficers
We used a logistic regression to test our hypothesis that male students would be more likely to satisfice than female students. Results showed that the odds of satisficing were 16% higher for males than females (B = 0.15, SE = 0.01, odds ratio = 1.16, 99% CI [1.14, 1.18]).
Exploratory Results
Overall, our results showed the pervasiveness of student satisficing in our sample, with over 30% of students engaging in some form of satisficing and straight-line responding implicating the greatest number of items. While providing important confirmatory data, these preregistered hypotheses also raised additional questions that we pursued through a series of exploratory analyses. Specifically, we first explored whether other student characteristics in addition to gender predicted overall satisficing. Second, we further examined the effects of straight-line responding on student subgroup comparisons and the psychometric attributes of the survey (e.g., Cronbach’s alpha coefficients.) Last, we explored nonresponse in further detail, given that students engaged in this form of satisficing most frequently. 2 We pursued these exploratory analyses to develop more refined recommendations for future research.
Exploratory Analyses: Overall Satisficing
We fit a logistic regression model to examine whether other student characteristics also predicted survey satisficing. In addition to gender, we included race/ethnicity, grade, English Language Learner status, student with a disability status, free or reduced-price lunch qualification, and suspensions. Results indicated that odds of satisficing increased 6% for students of color, 8% for students qualifying for free or reduce price lunch, 22% for students classified as English language learners, and 45% for students with disabilities. Odds of satisficing decreased by 13% for students in younger grades. The number of suspensions did not predict student satisficing (see Table 3).
Student Characteristics That Predict Likelihood of Satisficing
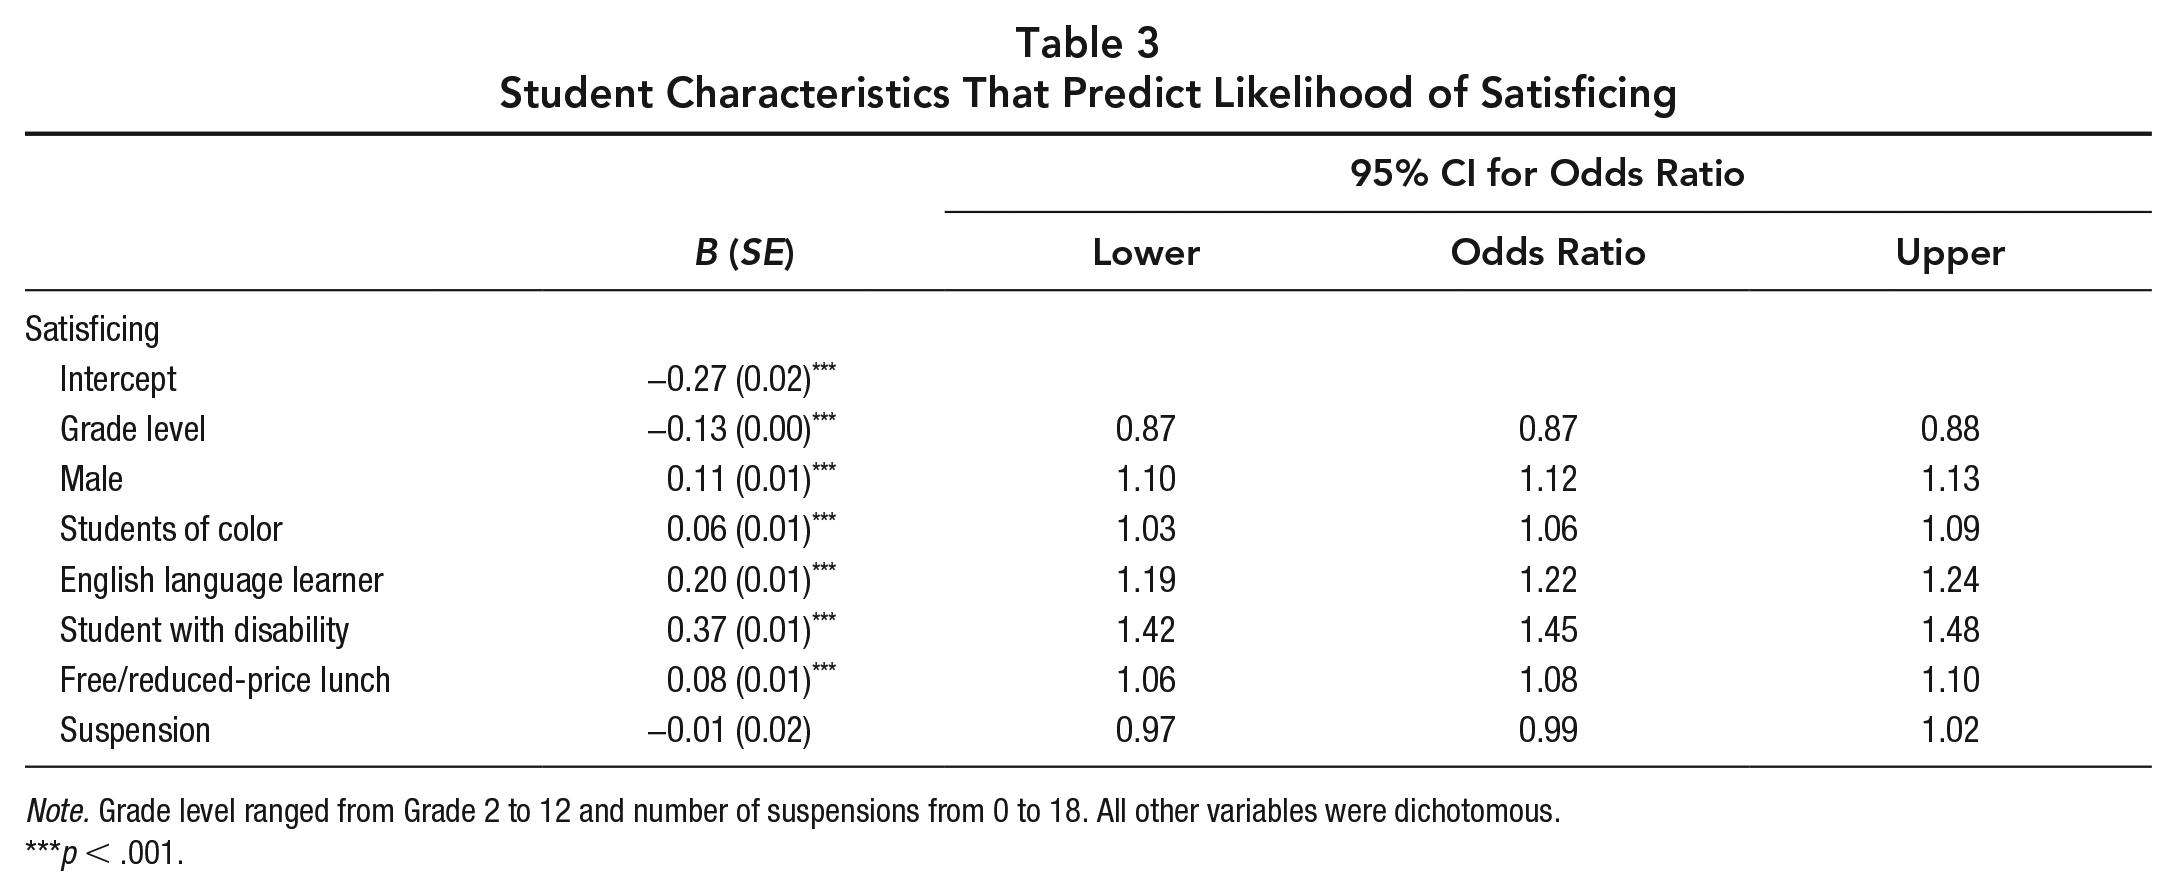
Note. Grade level ranged from Grade 2 to 12 and number of suspensions from 0 to 18. All other variables were dichotomous.
p < .001.
Exploratory Analyses: Straight-Line Responding
Given that straight-line responding affected more total survey items than any other form of satisficing and affected students’ mean scores for the four scales, we pursued several follow-up questions for this specific form of satisficing. We focused on potential gender differences, differences in Cronbach’s alpha and correlation coefficients, and the pattern of straight-line responding.
Gender differences
To follow up on our preregistered finding that male students satisficed more often than their female counterparts, we wondered if this tendency might accentuate or mute gender differences if researchers failed to account for satisficing. Specifically, we compared the complete sample and the high-fidelity sample (i.e., before and after removing students who straight-lined). Results indicated that mean scores changed between 0.01 and 0.02 points after removing the students who straight-lined (e.g., mean self-regulation scores for female students fell from 4.16 to 4.14). However, even though the mean scores changed, the magnitude of differences between female and male students remained consistent regardless of whether analyses were based on the complete sample or the high-fidelity sample. Female students reported higher self-regulation (Cohen’s d = 0.28 for complete, 0.27 for high fidelity), growth mindset after reverse-scoring the items (Cohen’s d = 0.04 for complete, 0.03 for high fidelity), and social awareness (Cohen’s d = 0.22 for complete, 0.22 for high fidelity) than male students. In contrast, male students reported higher self-efficacy than female students (Cohen’s d = 0.08 for complete, 0.10 for high fidelity).
Cronbach’s alpha and correlation coefficients
Second, we compared Cronbach’s alpha coefficients by using Feldt’s (1969) W statistic. As Table 2 shows, the alpha coefficients for growth mindset, regulation, self-efficacy, and social awareness were between .01 and .02 higher for the complete sample as compared with the high-fidelity sample; these findings correspond to a p value of less than .001 (see Table 2).
Third, we used Fisher’s z to compare the correlation coefficients between the complete sample and the high-fidelity sample. Correlations for growth mindset with regulation (z = −12.65), self-efficacy (z = −13.23), and social awareness (z = −5.12) were higher for the complete sample than the high-fidelity sample. The same pattern emerged when examining the correlations for regulation with self-efficacy (z = 13.20) and social awareness (z = 13.16), as well as the correlation between self-efficacy and social awareness (z = 21.80). All correlations were significant at p < .001 (see Table 4). In sum, the differences between the complete and high-fidelity samples for internal consistency and correlations between scales were small.
Correlations Between the Four Survey Scales
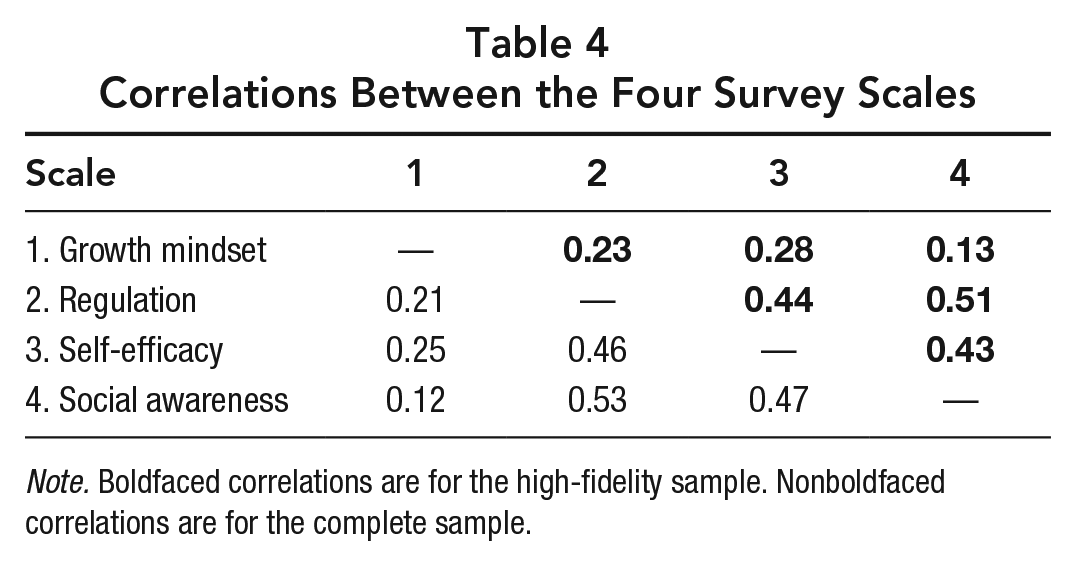
Note. Boldfaced correlations are for the high-fidelity sample. Nonboldfaced correlations are for the complete sample.
Pattern of straight-line responding
Thus far, our data suggested that straight-line responding affected mean scores, scale reliability, and correlation coefficients. This raises the question of where, within the survey, students straight-lined most frequently (e.g., students may get fatigued and start straight-line responding toward the end of the survey). We examined the response pattern for all the students who otherwise completed the full survey (i.e., we included the students who did not omit items or end the survey early). We found that student straight-lining (a) decreased after the first interval, (b) remained fairly consistent for the next 13 intervals but (c) increased during the last three intervals of the survey (see Figure 1).
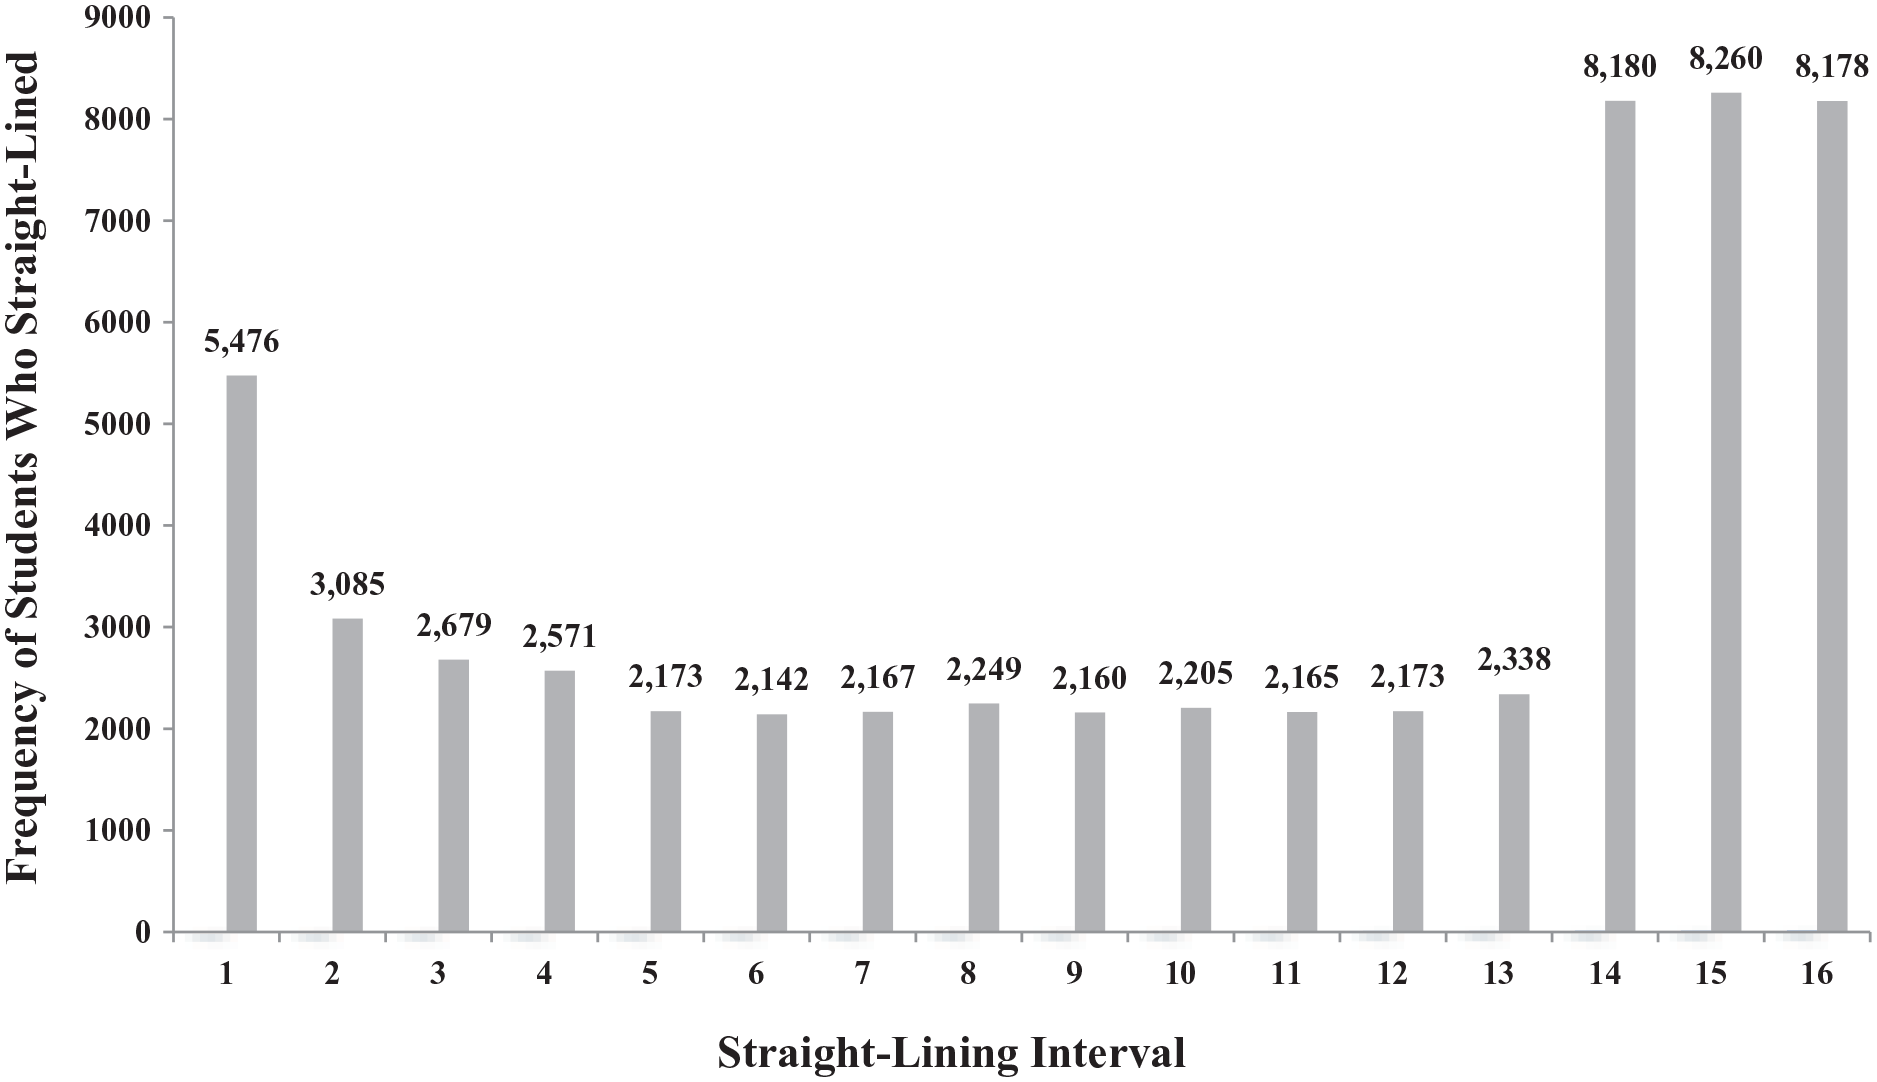
Pattern for straight-line responding.
Exploratory Analyses: Nonresponse
Our preregistered analyses indicated that straight-line responding implicated a greater number of survey items than nonresponse. However, given that nonresponse was the satisficing behavior most students engaged in, we pursued two exploratory analyses to examine (a) whether missing data also affected mean scores for the four scales and (b) the pattern of missing data.
Mean differences
Across the four scales, we examined whether there were differences between the complete and high-fidelity 3 samples. Results indicated that the overall sample had significantly lower mean scores for regulation and growth mindset than the high-fidelity sample. However, the magnitude of the differences was modest for both regulation (Cohen’s d = 0.06) and growth mindset (Cohen’s d = 0.03). The mean differences were even smaller for self-efficacy and social awareness, although given our sample size, these differences also were significant. The overall sample had lower self-efficacy than the high-fidelity sample (Cohen’s d = 0.01). There was almost no difference for social awareness (Cohen’s d = 0.001). See Table 5.
t-Test Results Comparing the Overall Sample and Sample Without Missing Data
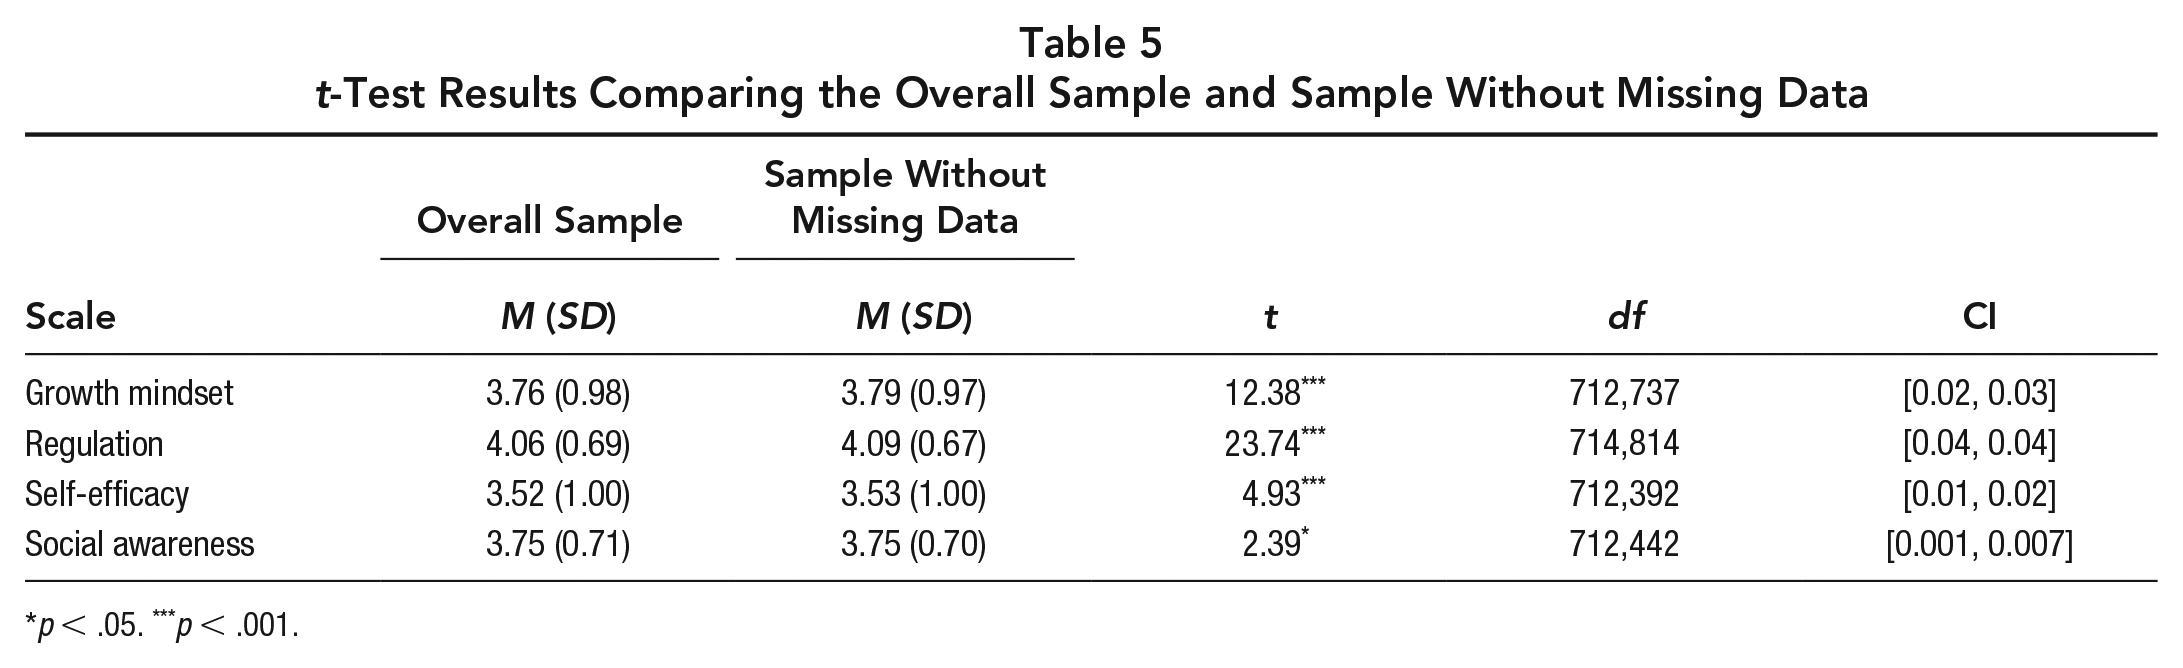
p < .05. ***p < .001.
Pattern of nonresponse
Similar to our analysis exploring the pattern of straight-line responding, we restricted our sample in this analysis to the students who completed the full survey (i.e., those who responded through to Item 25). Thus, Figure 2 shows the pattern of missing data across the first 24 items in the survey. The values represent the total missing responses for each item. The pattern suggests that students generally missed more items in the first half of the survey compared with the second half. The two most-missed items in the survey were Items 10 and 11, where there were 13,627 and 10,104 missing responses, respectively. Both items were reverse-scored growth mindset items.
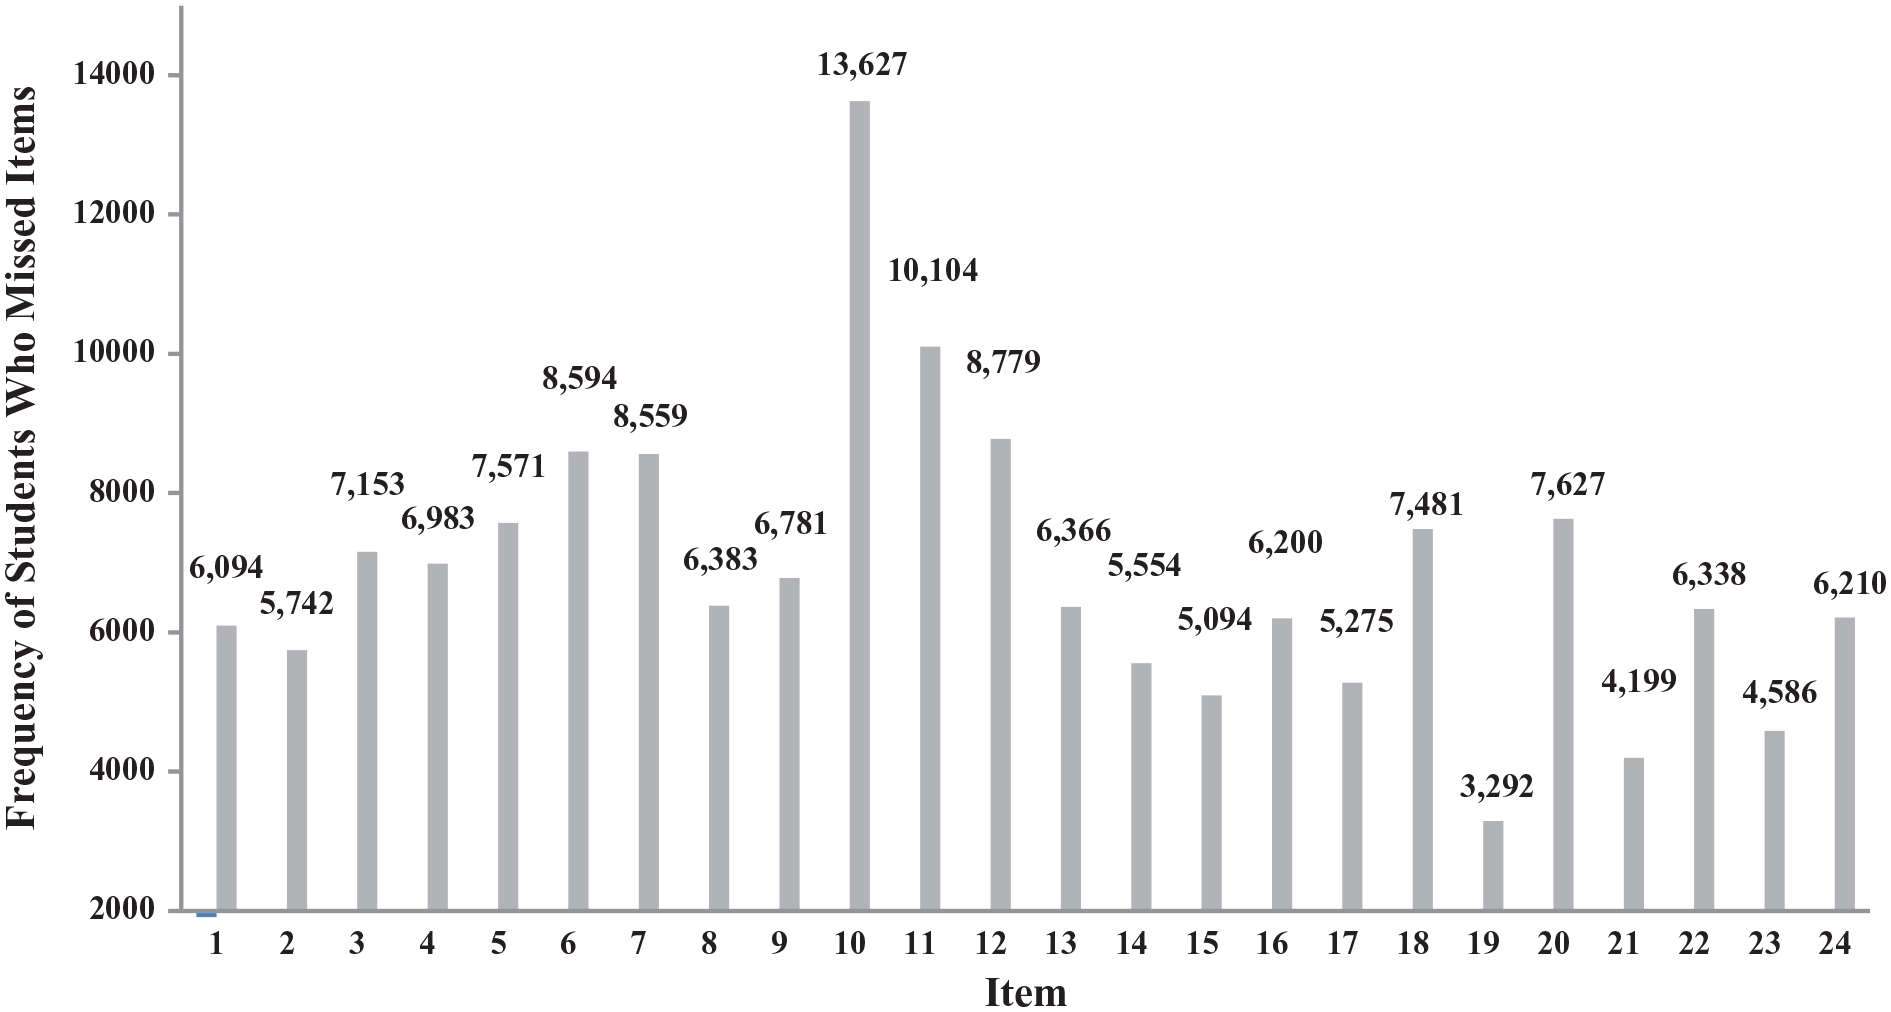
Pattern for nonresponse.
Discussion
In this article, we took a deliberately simple approach to defining and calculating satisficing so that others might easily replicate these steps, even without the help of highly trained statisticians. Despite extensive satisficing, the data appeared to be surprisingly robust to early termination, nonresponse, and straight-line responding. We discuss our findings and what researchers, practitioners, and policymakers might do in response to respondent satisficing.
Total Satisficing
Overall, a little more than 30% of the sample engaged in at least one form of satisficing. Given that satisficing reflects a lack of respondent motivation, however, it is important for researchers to consider how they operationalize satisficing behaviors. We took an inclusive approach to our definitions. In particular, respondents qualified as nonresponders as long as they omitted one item. With a data set this large, it seems inevitable that we inadvertently miscategorized some motivated students (e.g., those who missed an item by accident), thereby potentially misrepresenting student metadata (Soland et al., 2019). On the other hand, it is also possible that our straight-lining threshold of 10 items in a row excluded some respondents (e.g., those who straight-lined for nine items) who were putting forth suboptimal effort. Researchers, practitioners, and policymakers examining satisficing in their own data will need to determine meaningful definitions of satisficing and operationalizations for their specific contexts.
Impact on Survey Data
Of all three satisficing behaviors, student straight-line responding affected the greatest number of total survey items (almost 13 items on average) compared with nonresponse and early termination (1.77 and 3.52 items, respectively). We are reasonably confident that the students who straight-lined were not accurately reporting their attitudes because the survey included a set of reverse-scored items measuring growth mindset. The right-hand response option therefore signaled a fixed mindset—the conceptual opposite of growth mindset. Among straight-line responders, our survey results show that the students with the lowest growth mindset scores have the highest self-efficacy and regulation. These findings would be incongruous with the motivation research linking stronger growth mindsets with higher self-efficacy (Dweck & Master, 2009).
Moreover, because the students who straight-lined in our sample selected the response option on the far right-hand side almost half the time (M = 46.02%), this satisficing behavior affected students’ scores across the four scales. Yet, the relatively modest effect sizes suggested that, while significant, the differences between samples did not necessarily represent a substantial threat to interpretations of our findings. In our prespecified hypotheses, the Cohen’s d coefficients ranged from 0.01 to 0.04, falling below the 0.20 cutoff typically reserved for “small” effect sizes (Cohen, 1988). We obtained similar findings for our exploratory analyses (Cohen’s d coefficients from 0.001 to 0.06)—indicating that, in general, the means were not sufficiently different to warrant substantially different interpretations of our data. Of course, the magnitude of effect sizes ranges across research contexts—what may be small in one domain may represent a meaningful difference in others (Kraft, 2020). Moreover, some researchers argue that effect size cutoffs are relatively arbitrary and should instead be interpreted in terms of the consequences that the effects could cause (Funder & Ozer, 2019). Local contexts can therefore help guide when the differences are meaningful.
We also examined patterns in straight-line responding and nonresponse. Straight-line responding occurred more toward the end of the survey, whereas nonresponse happened more frequently in the first half. Of note is that the most frequently missed items were growth mindset items. This aligns with concerns about the growth mindset scale used in this SEL survey and its inclusion of reverse-scored items (Meyer et al., 2018). Using survey design strategies other than reverse-scoring items (e.g., interspersing items from different constructs throughout the survey rather than presenting all items from one scale at a time) may help to minimize respondent satisficing (Gehlbach & Barge, 2012) without adding the cognitive complexity required by the wording of reverse-scored items (e.g., Benson & Hocevar, 1985).
In sum, the findings of this study suggest that although survey data users need to be aware of how satisficing affects data quality in their respective samples, these behaviors may not always threaten the integrity of the overall results even when rates of satisficing are high. Users of survey data who want additional or different strategies for detecting satisficing that extend beyond the three assessed in this article (e.g., strategies described in Robinson-Cimpian, 2014; Steedle et al., 2019) will need to similarly determine to what extent the response behaviors affect the data in their specific educational context.
Respondent Characteristics
In addition to investigating the impact of satisficing on data quality, we also examined whether satisficing might change the nature of the sample in systematic ways. Addressing the problem of respondent motivation by removing satisficers from the sample could lead to unrepresentative samples if certain groups satisfice at higher rates than others. In the present sample, male students were more likely to satisfice than their female counterparts. Exploratory analyses also identified race/ethnicity, language status, and disability status as other factors associated with satisficing. These findings reflect those obtained by Soland (2018), who found differences in satisficing across student subgroups. Specifically, on the Measures of Academic Progress assessment, male students and students of color engaged in higher rates of rapid guessing (Soland, 2018). However, because of the modest nature of the subgroup differences in the current study and elsewhere (e.g., Soland, 2018), policy decisions may not need to treat different subgroups of students differently. As noted, however, researchers will need to determine to what extent satisficing affects their own data quality in order to ascertain whether it is necessary to remove satisficers prior to presenting their findings.
Recommendations for Researchers, Practitioners, and Policymakers
Based on this study, we recommend the following five guidelines for handling student survey data. First, researchers, practitioners, and policymakers will need to determine meaningful definitions of satisficing that make sense within the context of their surveys. While we took a relatively inclusive approach to defining and operationalizing satisficing, some districts might require more conservative approaches (e.g., defining nonresponse as four missed items rather than one). Fortunately, testing different definitions of satisficing and examining the repercussions is relatively low cost—merely the time taken to conduct additional analyses. As data analysts further explore the impact of satisficing, we recommend testing various definitions to see what is most sensible for a given context.
Second, we recommend that researchers, practitioners, and policymakers examine their data with and without satisficers in order to evaluate how much the satisficing behaviors affect interpretation of the findings. Within the CORE context, straight-line responding and nonresponse did not change the main interpretation of findings. For example, the magnitude of differences between the straight-line responding and high-fidelity samples was quite small. However, given the context-dependent nature of education, results like these might vary across educational settings. Furthermore, other types of analyses might be affected in different ways. Perhaps certain subgroup comparisons (e.g., grade levels, schools, growth rates, etc.) or analyses involving item structure (e.g., factor analytic techniques) are more sensitive to the inclusion or exclusion of satisficers. Thus, we encourage users of survey data to examine how satisficing may affect scales in their own surveys across a range of analyses and settings. Learning when, where, and why there are more consequential differences in findings due to satisficing will be important knowledge moving forward.
Third, we recommend against excluding all data from every student who satisfices. Instead, researchers, practitioners, and policymakers may benefit more from removing only the flawed data (i.e., case-wise rather than listwise deletion). Specifically, because straight-line responding and nonresponse may affect students’ mean scores, we suggest that data analysts focus on these two response patterns. Removing flawed data will also help ensure that analysts are not throwing quality data away along with the potentially compromised data when working to support data-driven decision making. As part of this process, however, we also encourage data analysts first to confirm that excluding data does not markedly change the nature of the sample population (e.g., by removing a disproportionate number of certain demographic groups).
Fourth, including reverse-scored items in a survey may seem like an effective strategy for detecting straight-line responders. However, we caution against using this tactic. Reverse-scored items reduce scale reliability and are difficult for participants to answer (Benson & Hocevar, 1985; Gehlbach & Brinkworth, 2011; Swain et al., 2008). Instead, survey designers can attempt to mitigate straight-line responding by interspersing items from different constructs (Gehlbach & Barge, 2012) and ensuring that response options are construct specific (Gehlbach & Brinkworth, 2011). Interspersing items reduces the chances that participants will engage in cognitive biases, like anchoring and adjusting, which can occur when items from the same or similar constructs are placed next to each other (Gehlbach & Barge, 2012). Furthermore, including fully labeled response options for each item and using the same construct-specific language in both the items and response options can help to reinforce to respondents that the survey is asking about distinct phenomena as opposed to asking similar questions over and over (Gehlbach, 2015).
Last, because students’ motivation to put cognitive effort into a survey is malleable, we urge those using survey research to cultivate buy-in from students prior to administering the survey instruments. Future research may also benefit from exploring qualitative differences in students’ motivation to satisfice on surveys (e.g., through cognitive interviewing) to better understand when and where students are most likely to engage in satisficing behaviors. Using evidence-based strategies (e.g., Dillman et al., 2014) to enhance respondent motivation early in the survey process may reduce some of the satisficing behaviors utilized by students.
Conclusion
Critiques of survey data abound. These criticisms question respondents’ ability to understand their own attitudes, accurately report their attitudes, and engage in surveys with sufficient motivation. Low respondent motivation may present the most uniquely challenging threat to data interpretation given the lack of researcher control over this type of respondent behavior. However, our findings indicate that despite the prevalence of student satisficing in our sample, the impact of this practice on data quality appeared surprisingly small. Because of the context-specific nature of education, we urge others to similarly determine the prevalence and impact of survey satisficing in their own data sets. Through a collective effort, we can learn how robust survey findings are to satisficing behaviors. To support researchers, practitioners, and policymakers pursuing this important task, we have provided an accessible foundation for defining and calculating student satisficing in large-scale data sets. We hope these strategies ultimately facilitate those individuals who are trying to help schools to make better data-driven decisions.
Supplemental Material
sj-pdf-1-edr-10.3102_0013189X211040054 – Supplemental material for Assessing Survey Satisficing: The Impact of Unmotivated Questionnaire Responding on Data Quality
Supplemental material, sj-pdf-1-edr-10.3102_0013189X211040054 for Assessing Survey Satisficing: The Impact of Unmotivated Questionnaire Responding on Data Quality by Christine Calderon Vriesema and Hunter Gehlbach in Educational Researcher
Footnotes
Notes
Authors
References
Supplementary Material
Please find the following supplemental material available below.
For Open Access articles published under a Creative Commons License, all supplemental material carries the same license as the article it is associated with.
For non-Open Access articles published, all supplemental material carries a non-exclusive license, and permission requests for re-use of supplemental material or any part of supplemental material shall be sent directly to the copyright owner as specified in the copyright notice associated with the article.