
Abstract
Research findings regarding the effects of educational interventions—typically reported in units of standard deviations (e.g., Cohen’s d)—are often translated into more intuitive metrics before being communicated to teachers. However, there is no consensus about the most suitable metric, and no study has systematically examined how teachers respond to the different options. We conducted two preregistered studies addressing this issue. We found that teachers have strong preferences concerning effect size metrics in terms of informativeness, understandability, and helpfulness. These preferences challenge current research reporting recommendations. Most importantly, we found that different metrics induce different perceptions of an intervention’s effectiveness—a situation that could cause teachers to have unrealistic expectations about what a given intervention may achieve. Implications for how educational effects should be communicated are discussed.
It is important to communicate the findings of education research to teachers. One approach is that adopted by the Education Endowment Foundation (EEF) in the United Kingdom and Institute of Education Sciences in the United States. These bodies have commissioned hundreds of randomized control trials (RCTs) and systematic reviews on the most effective teaching practices, which have then been summarized on accessible platforms—the Teaching and Learning Toolkit and What Works Clearinghouse, respectively. Such initiatives have proved very popular: Up to two thirds of schools in England report consulting the Teaching and Learning Toolkit to inform their practice (EEF, 2017), and the What Works Clearinghouse website attracts around 35,000 new users every month (Institute of Education Sciences, personal communication, June 1, 2020). Not surprisingly, similar initiatives have been appearing around the world, such as Evidence for Learning (Australia) and SUMMA (Latin America and the Caribbean). Despite these efforts to improve the availability of evidence in education, little research has examined how to present education research findings in ways that maximize the ability of teachers to make informed decisions. This omission is surprising given the large number of teachers who engage with education research (e.g., Barton & Tindle, 2019), given that substantial efforts have been made to increase teacher’s use of research in their practice (e.g., Farley-Ripple et al., 2018; Goldacre, 2013), and given that many initiatives that summarize the impact of educational interventions consider teachers to be one of their target audience (e.g., EEF, 2018; Evidence for Learning, n.d.; SUMMA, n.d.).
Translation of Effect Sizes in Education
In education research, an intervention’s impact is typically reported in units of standard deviations (e.g., Cohen’s d; see Kraft, 2020, for an overview of effect sizes of educational interventions in relation to their cost and scalability). Because this measure is hard to interpret, it is generally translated into a more relatable metric before being reported to practitioners. Many alternative metrics have been proposed (e.g., Lipsey et al., 2012), but to date, there is no consensus about the metric best suited for communication with practitioners. For example, the Teaching and Learning Toolkit, Evidence for Learning, and SUMMA translate effects into additional student months of progress, while the What Works Clearinghouse reports effects as percentile gains (referred to as the improvement index).
Researchers have argued that some metrics are better than others. In their effect size interpretation guidelines, Valentine and Cooper (2003) recommended reporting raw mean difference scores when a measure is familiar and using Cohen’s U3 otherwise (this gives the percentage of students in the intervention group scoring above the mean of the control group). More recently, Baird and Pane (2019) recommended translating effects into percentile gains and argued against converting effects into units of time (e.g., months of progress), in part because the latter metric is dependent on students’ learning rates, which can vary substantially between contexts.
These analyses make valuable points about the strengths and limitations of translation metrics, but their focus is theoretical. To our knowledge, no empirical study has investigated how teachers perceive different effect size metrics. This gap sharply contrasts with the large research effort in health sciences to evaluate how clinicians and patients perceive the various ways of communicating treatments’ outcomes. Indeed, there are entire journals devoted to this question (e.g., the Journal of Health Communication). We designed two studies addressing this gap. Our main aims were to (1) identify the effect size metrics that teachers perceive to be most informative and (2) evaluate whether different effect size metrics induce different perceptions of an intervention’s effectiveness.
Perceptions of Informativeness
It is critical to determine how informative teachers perceive the various effect size metrics to be. Much evidence suggests that perceived informativeness positively predicts the perceived value of information, as well as other desirable outcomes such as the amount of time users spend consulting a source and their intention to use it again in the future (e.g., Davis, 1989; Ducoffe, 1996). Given this, identifying teachers’ preferences regarding effect size metrics is likely to assist research communicators to maximize teachers’ engagement with research findings.
It is also important to determine whether and how teachers’ preferences differ from recommendations made on the basis of theoretical analyses of the type offered by Valentine and Cooper (2003) and Baird and Pane (2019). Teachers may not be aware of the methodological strengths and limitations of different effect size metrics, and if they do, they may prioritize other factors, such as how the metrics relate to their objectives. For example, a teacher who wishes to prioritize the number of their students passing a summative test may prefer effects to be reported as the additional proportion of students expected to pass a test. In Study 1, we examined which effect size metric teachers perceive to be the most informative and explored whether these perceptions are related to teacher characteristics.
Perceptions of Effectiveness
Another important question concerns whether different effect size metrics convey different impressions of an intervention’s effectiveness. It is well-known that readers can respond differently when the same information is presented in different metrics, and that these discrepancies can be large. For instance, communicating a medical intervention’s effect in relative terms (e.g., a 50% reduction in cancer incidence) or absolute terms (e.g., a decrease in cancer incidence from 2 per 1,000 to 1 per 1,000) can strongly influence the extent to which clinicians and patients judge the intervention to be effective (Covey, 2007; Naylor et al., 1992).
Whether the effect size metrics commonly used in education research influence teachers’ perceptions of an intervention’s effectiveness is unknown. If they do, it is important to determine whether some metrics convey misleading impressions. This might happen, for example, if an intervention’s effect is reported in a way that leads teachers to overestimate the intervention’s probable impact in another metric (e.g., when estimating the impact an intervention’s effect reported in months of progress will have on their students’ test scores). Such an overestimation would interfere with the ability of teachers to make informed decisions, and could lead to disappointment, to doubt in their ability to carry out the intervention, and ultimately to question the usefulness of research evidence more generally. The opposite scenario—where effect size metrics lead teachers to underestimate an intervention’s impact—would also be problematic, as it could lead to beneficial interventions being rejected. In Study 2, we examined whether different effect size metrics induce different impressions of a specific intervention’s effectiveness.
Study 1
The goal of Study 1 was to measure teachers’ perceived informativeness of various effect size metrics. We focused our analysis on five metrics, summarized in Table 1. Two of the metrics we considered—Months of Progress and Percentile Gain—are widely used as part of the EEF Toolkit and What Works Clearinghouse, respectively. Cohen’s U3 (Cohen, 1988), although less common, was recommended by Valentine and Cooper (2003) and has previously been found to be perceived as more informative than a number of alternative metrics common in academic research in a sample of general population (Hanel & Mehler, 2019). We also considered a metric in which the effect size was reported as the additional proportion of students reaching a certain threshold, in our case, passing a test. This is a common way to translate interventions’ effects as measured on continuous outcomes in health (e.g., Guyatt et al., 2013). We refer to this metric as Threshold. Finally, for comparison, we presented teachers with the effect of the intervention reported in its original units (i.e., Test Score).
Vignettes Describing Interventions Impact by Metric
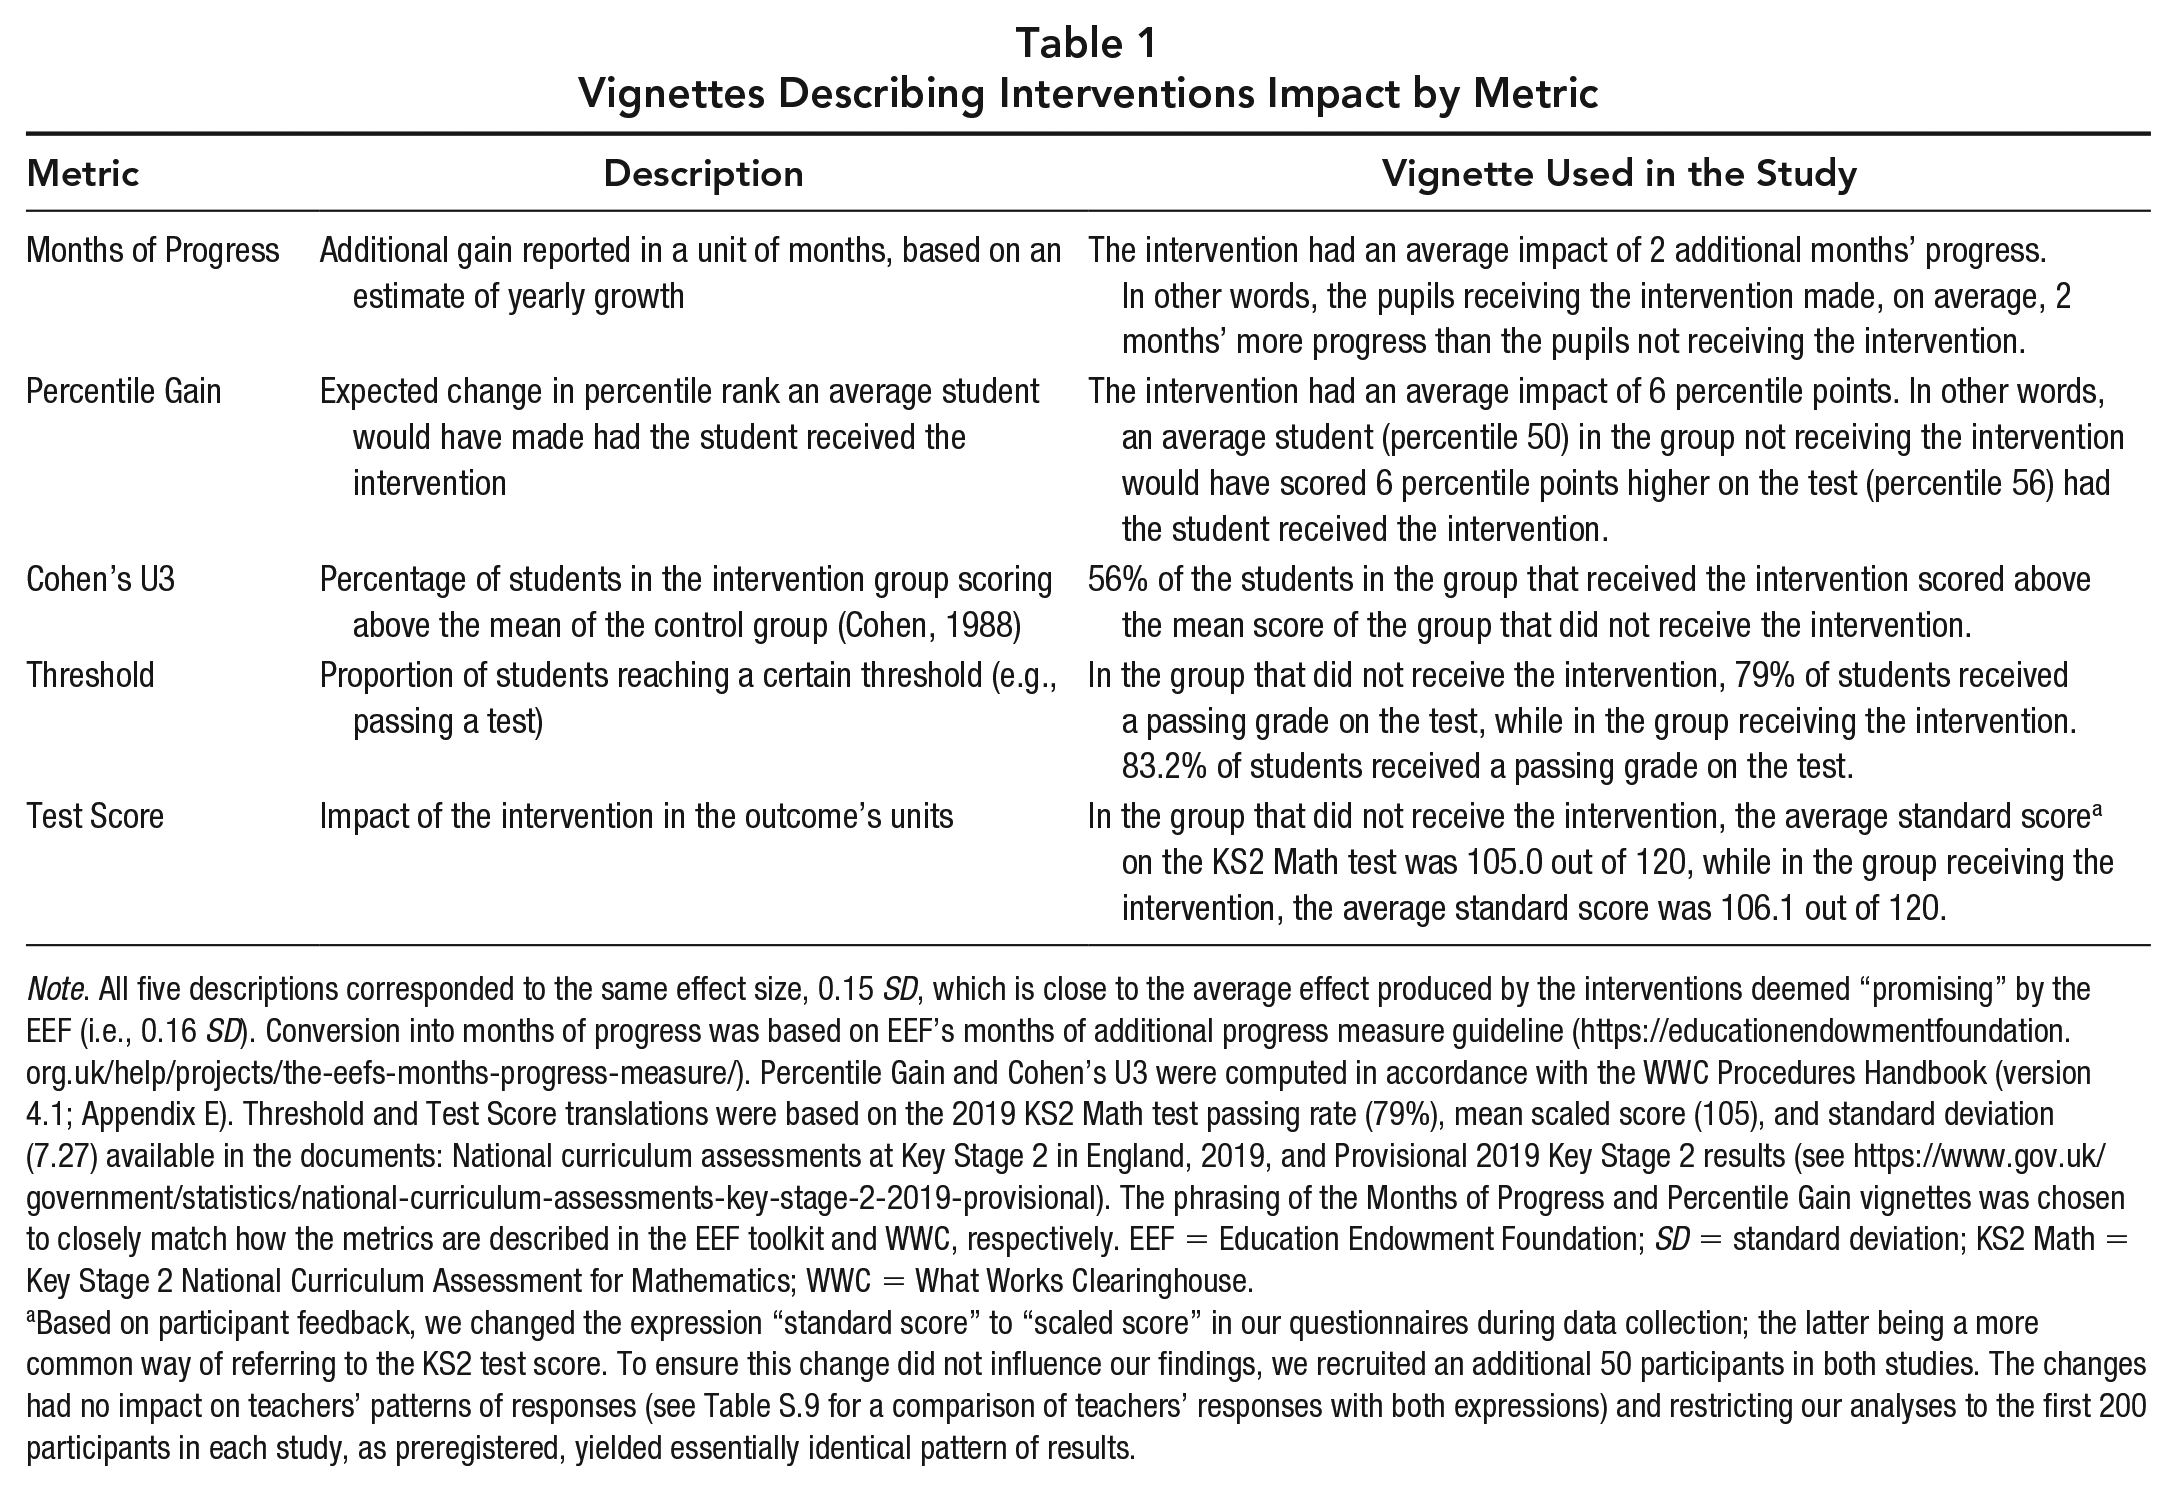
Note. All five descriptions corresponded to the same effect size, 0.15 SD, which is close to the average effect produced by the interventions deemed “promising” by the EEF (i.e., 0.16 SD). Conversion into months of progress was based on EEF’s months of additional progress measure guideline (https://educationendowmentfoundation.org.uk/help/projects/the-eefs-months-progress-measure/). Percentile Gain and Cohen’s U3 were computed in accordance with the WWC Procedures Handbook (version 4.1; Appendix E). Threshold and Test Score translations were based on the 2019 KS2 Math test passing rate (79%), mean scaled score (105), and standard deviation (7.27) available in the documents: National curriculum assessments at Key Stage 2 in England, 2019, and Provisional 2019 Key Stage 2 results (see https://www.gov.uk/government/statistics/national-curriculum-assessments-key-stage-2-2019-provisional). The phrasing of the Months of Progress and Percentile Gain vignettes was chosen to closely match how the metrics are described in the EEF toolkit and WWC, respectively. EEF = Education Endowment Foundation; SD = standard deviation; KS2 Math = Key Stage 2 National Curriculum Assessment for Mathematics; WWC = What Works Clearinghouse.
Based on participant feedback, we changed the expression “standard score” to “scaled score” in our questionnaires during data collection; the latter being a more common way of referring to the KS2 test score. To ensure this change did not influence our findings, we recruited an additional 50 participants in both studies. The changes had no impact on teachers’ patterns of responses (see Table S.9 for a comparison of teachers’ responses with both expressions) and restricting our analyses to the first 200 participants in each study, as preregistered, yielded essentially identical pattern of results.
As context, we used the Key Stage 2 National Curriculum Assessment for Mathematics (abbreviated KS2 Math test), a component of the English National Curriculum assessment, an assessment taken by students (age 10–11 years) at the end of primary school in all government-funded schools in England (approximately 93% of schools). Teachers in England—the group from which we sampled—are highly familiar with the test and its scale because students’ performance on the KS2 test informs teachers’ evaluations and schools’ rankings (Department for Education, 2019b). For this reason, most teachers in England will have the necessary knowledge to interpret an intervention’s impact described in that metric. The KS2 test has also served as an outcome measure in several RCTs (e.g., Boylan et al., 2018; Torgerson et al., 2018), and the test-specific data required to generate the Threshold and Test Score effect size metrics are publicly available.
Method
Participants
Two hundred and fifty teachers (91% female; mean age: 38.50 years; SD: 9.55) were recruited in teachers-only groups on social media to participate in an online survey. They had, on average, 11.53 years of teaching experience (SD: 8.49), worked in the north (30%), middle (31%), or south (39%) of England, and were mainly primary (64%) or secondary (26%) school teachers. Participants’ familiarity with the statistical concept of effect size was low (mean: 1.72 on a 1 [not at all] to 5 [extremely] scale). See Supplemental Table S.1 (available on the journal website) for a detailed description of the sample.
Procedure
Participants were informed that the impact of educational interventions can be described in various ways and that they would be asked to identify what they think is “the clearest and most informative way” to report this impact. They were then presented with five different descriptions of the impact of an educational intervention (see Table 1 for the descriptions) and asked to rate their informativeness on a 7-point scale ranging from 1 (extremely uninformative) to 7 (extremely informative). Participants were informed that the intervention in question was aimed at improving math achievement, that the intervention’s impact was deemed statistically significant, and that it had been measured by comparing the performance on the KS2 Math test of a group receiving the intervention to the performance of a group receiving normal instruction (i.e., “business as usual”). All five descriptions were presented on the same page in one of five counterbalanced orders. Participants were asked to read all five descriptions before rating their informativeness.
In addition, teachers were asked to report their age, gender, years of teaching experience, teaching level, teaching subject, type of school, geographical location, as well as indicating their familiarity with the statistical concept of effect size, their familiarity with the KS2 Math test (i.e., the outcome measure in the vignettes), their mathematical ability, and whether or not they had ever heard of the impact of an intervention being described in months of progress. The study was approved by the University of York ethics committee (reference #EE9153F5). Our analysis plan was preregistered prior to data collection 1 and can be inspected, along with the survey questionnaire, analysis code, and data at https://osf.io/9bgqk/.
Results
As shown in Figure 1, informativeness ratings varied substantially between the various effect size metrics, with Threshold (M: 5.19; SD: 1.38), Months of Progress (M: 5.00; SD: 1.47), and Test Score (M: 4.74; SD: 1.56) perceived as more informative than Percentile Gain (M: 3.33; SD:1.58) and Cohen’s U3 (M: 3.32; SD: 1.46), both of which were rated below the midpoint of the scale by most participants (61.6% and 60.4%, respectively).
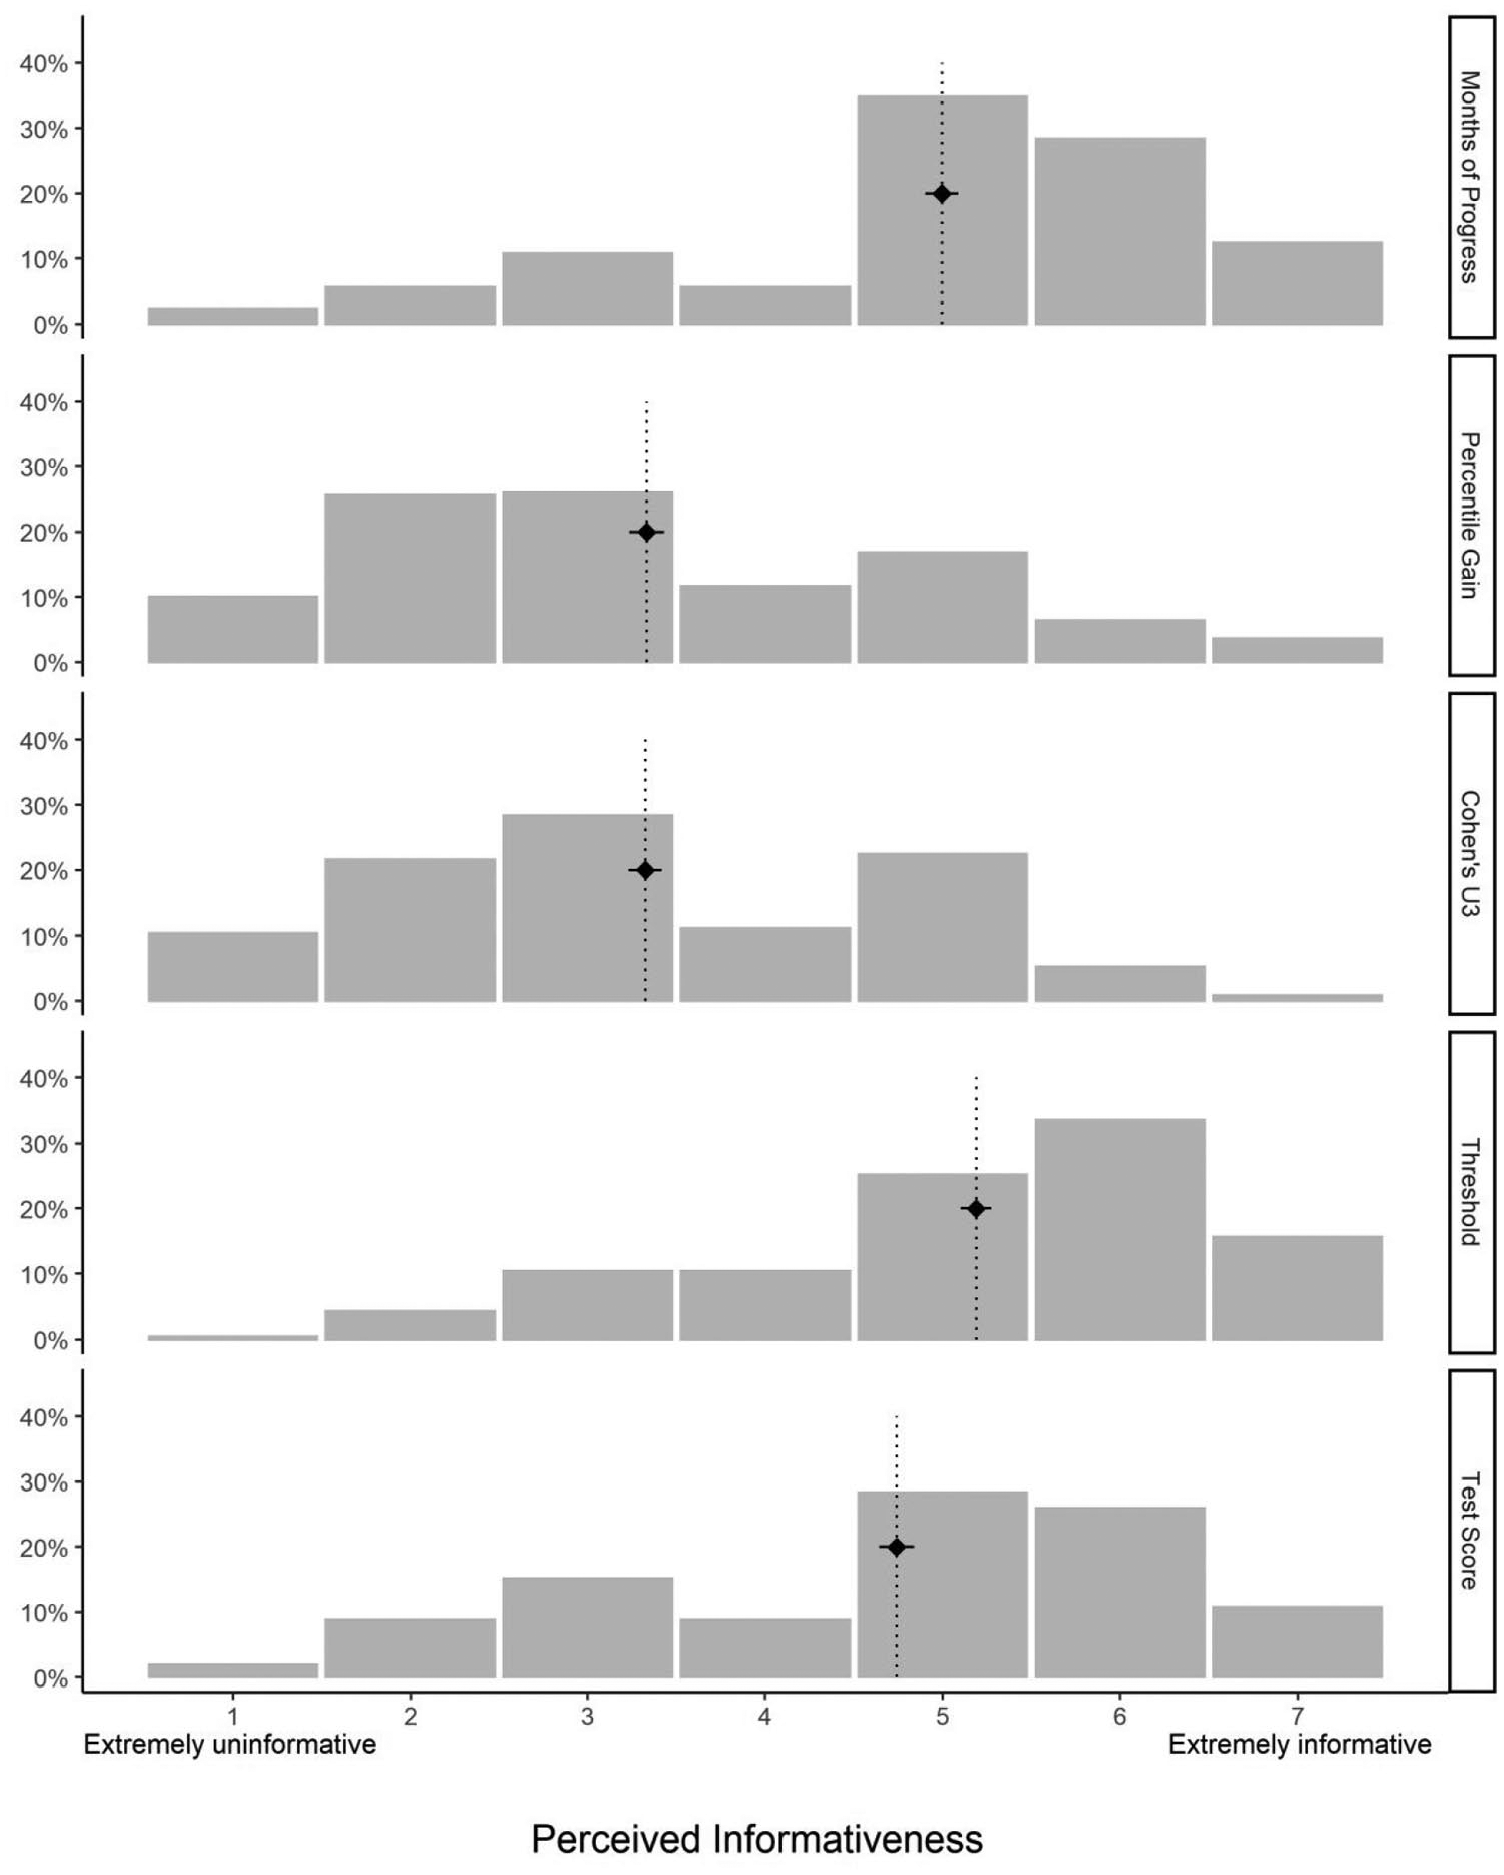
Distributions of informativeness ratings as a function of the metric used to describe the intervention’s impact.
To evaluate whether the effect size metrics had a significant influence on informativeness judgments while accounting for the dependency in observations resulting from our within-subject design, we compared a mixed-effects model that included participants as a random effect and response metric as a fixed effect (mixed model) with a model that only included participants as a random effect (null model) using a likelihood ratio test. As predicted, perceived informativeness was significantly influenced by the metric used to report the intervention’s impact (mixed vs. null model: χ2[4] = 329.86, p < .001; see Supplemental Table S.2 for coefficients of the mixed model). 2 The standardized differences between each metric and corresponding significance levels from paired sample t -tests (after Bonferroni correction) are reported in Table 2.
Mean, SD, and Pairwise Differences (Cohen’s d) of Perceived Informativeness of the Five Metrics
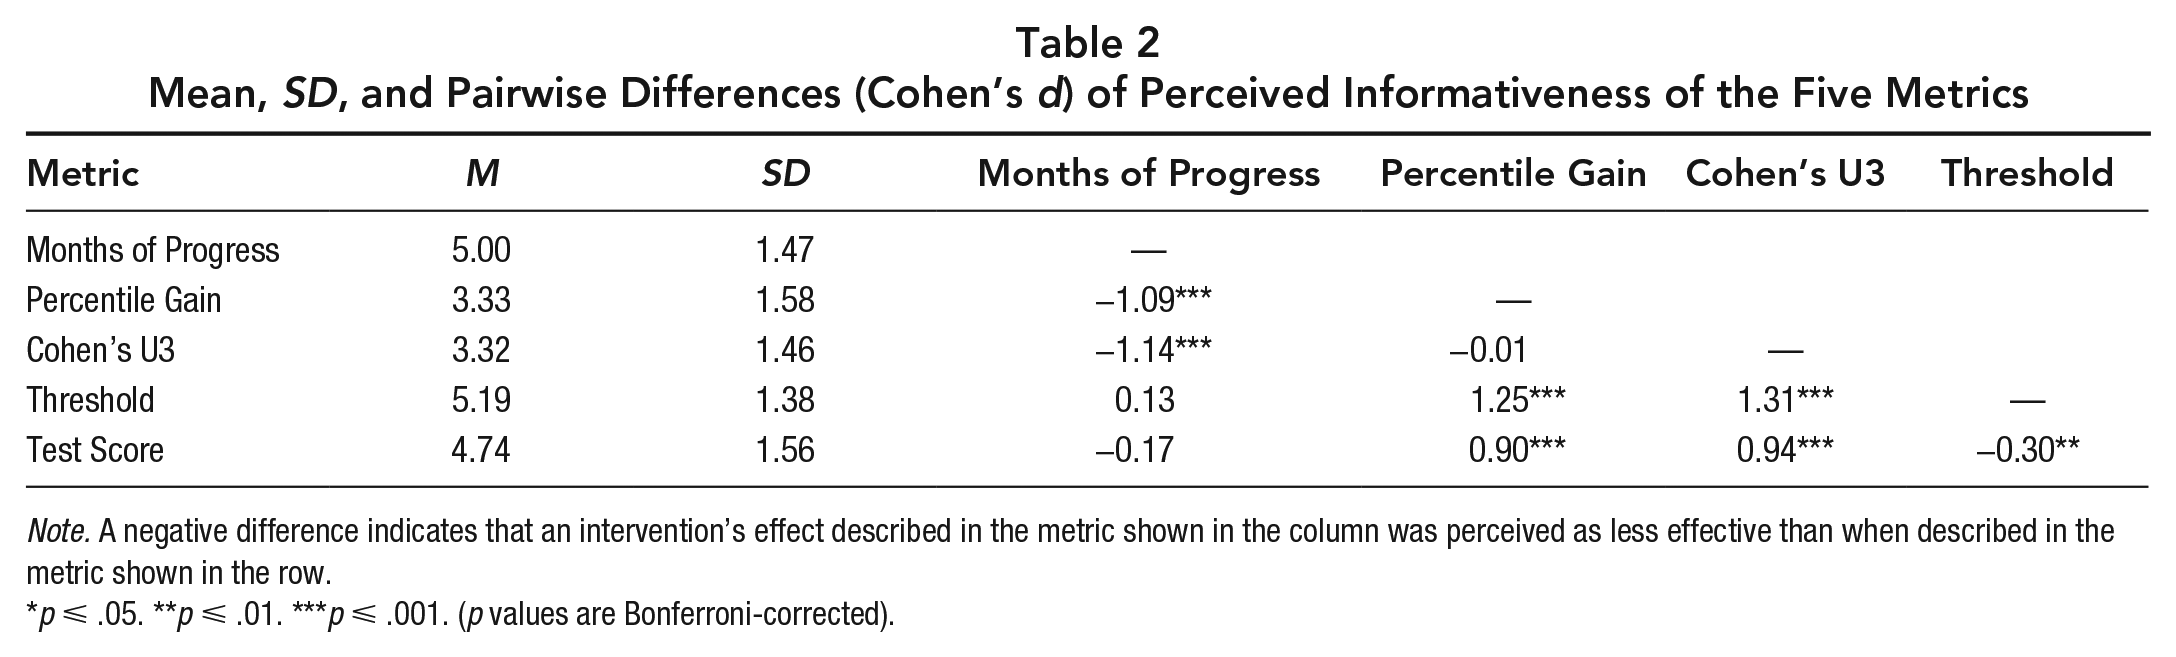
Note. A negative difference indicates that an intervention’s effect described in the metric shown in the column was perceived as less effective than when described in the metric shown in the row.
p ⩽ .05. **p ⩽ .01. ***p ⩽ .001. (p values are Bonferroni-corrected).
We also explored whether teachers’ perceptions of informativeness varied by their demographic characteristics. As shown in Supplemental Table S.3, none of the relations were strong or statistically significant: In no case was perceived informativeness significantly moderated by teachers’ familiarity with KS2 Math test, by their familiarity with the concept of effect size, by whether they had ever heard of intervention impact being reported in months of progress, by their self-reported mathematical ability, or by their teaching experience. Notably, there was no evidence that the teachers’ preferences for months of progress were influenced by whether they had encountered this effect size metric in the past.
Study 2
In the context of medicine, effect size metrics have been shown to influence the extent to which an intervention is perceived to be effective, and therefore to influence practitioners’ decision making (Covey, 2007; Naylor et al., 1992). We aimed to determine whether such an effect is also present with the effect size metrics typically used in educational contexts. Study 2 also expanded on Study 1 by measuring teachers’ perceptions of the understandability and helpfulness of each metric. These factors have, like perceived informativeness, been shown to predict the perceived value of sources of information (e.g., Davis, 1989; Robey, 1979).
Method
Participants
We recruited a new sample of 250 teachers (92% females; mean age: 39.00 years; SD: 9.55) in teachers-only social media groups. They had, on average, 11.66 years of teaching experience (SD: 8.35), were from the north (32%), middle (28%), or south (40%) of England and taught mainly at the primary (70%) and secondary (24%) levels. Participants’ familiarity with the statistical concept of effect size was low (mean: 1.88 on a 1 [not at all] to 5 [extremely] scale). In sum, our sample was very similar to that of Study 1 (see Supplemental Table S.1 for full description).
Procedure
We used the same vignettes as in Study 1 (see Table 1) but introduced them differently. First, participants were told that they would be presented with a description of the effectiveness of five different educational interventions aimed at improving mathematics achievement. Critically, participants were not told that the vignettes described interventions with identical effect sizes (0.15 SD). Participants were informed that all five interventions were aimed at improving the performance of typical students on the KS2 Math test, were of the same duration and cost, and that the impact in each case was deemed statistically significant. The vignettes were presented in random order and on different webpages to hinder direct comparison.
After reading each vignette, teachers were asked to rate how effective they considered the intervention to be at improving performance on the KS2 Math test on a 7-point scale ranging from 1 (not at all effective) to 4 (moderately effective) to 7 (extremely effective). In addition, teachers were asked to rate the following two statements on a 7-point scale from strongly disagree to strongly agree: (1) the information given about the intervention was easy to understand and (2) the information given was helpful to judge how effective the intervention is. Participants were also asked to report the same demographic information as in Study 1. Again, our study was approved by the University of York ethics committee (reference #EE9153F5) and our questionnaire and analysis plan were preregistered prior to data collection and are available at https://osf.io/fzktb/.
Results
Perceptions of effectiveness
Given that each vignette described the same effect, we compared between-vignette ratings to estimate the influence that the effect size metrics had on teachers’ perceptions of an intervention’s effectiveness. Figure 2 shows the distribution of the teachers’ responses to each metric. Impact described in Months of Progress was perceived as most effective (M: 4.89; SD: 1.13), followed by Threshold (M: 4.43; SD: 1.20), Cohen’s U3 (M: 4.19; SD: 1.28), Percentile Gain (M: 4.10; SD: 1.22), and Test Score (M: 3.24; SD: 1.36). To determine if the effect of the metric was significant, we compared two mixed-effects models: one with participants as a random effect and metric as a fixed effect (mixed model) and another with only participants as a random effect (null model). As predicted, the mixed model explained significantly more variance than the null model, χ2(4) = 301.98, p < .001 (see Table S.4 for coefficients of the mixed model). 3 Table 3 reports the standardized differences between each metric and corresponding significance level from paired t tests, after Bonferroni correction.
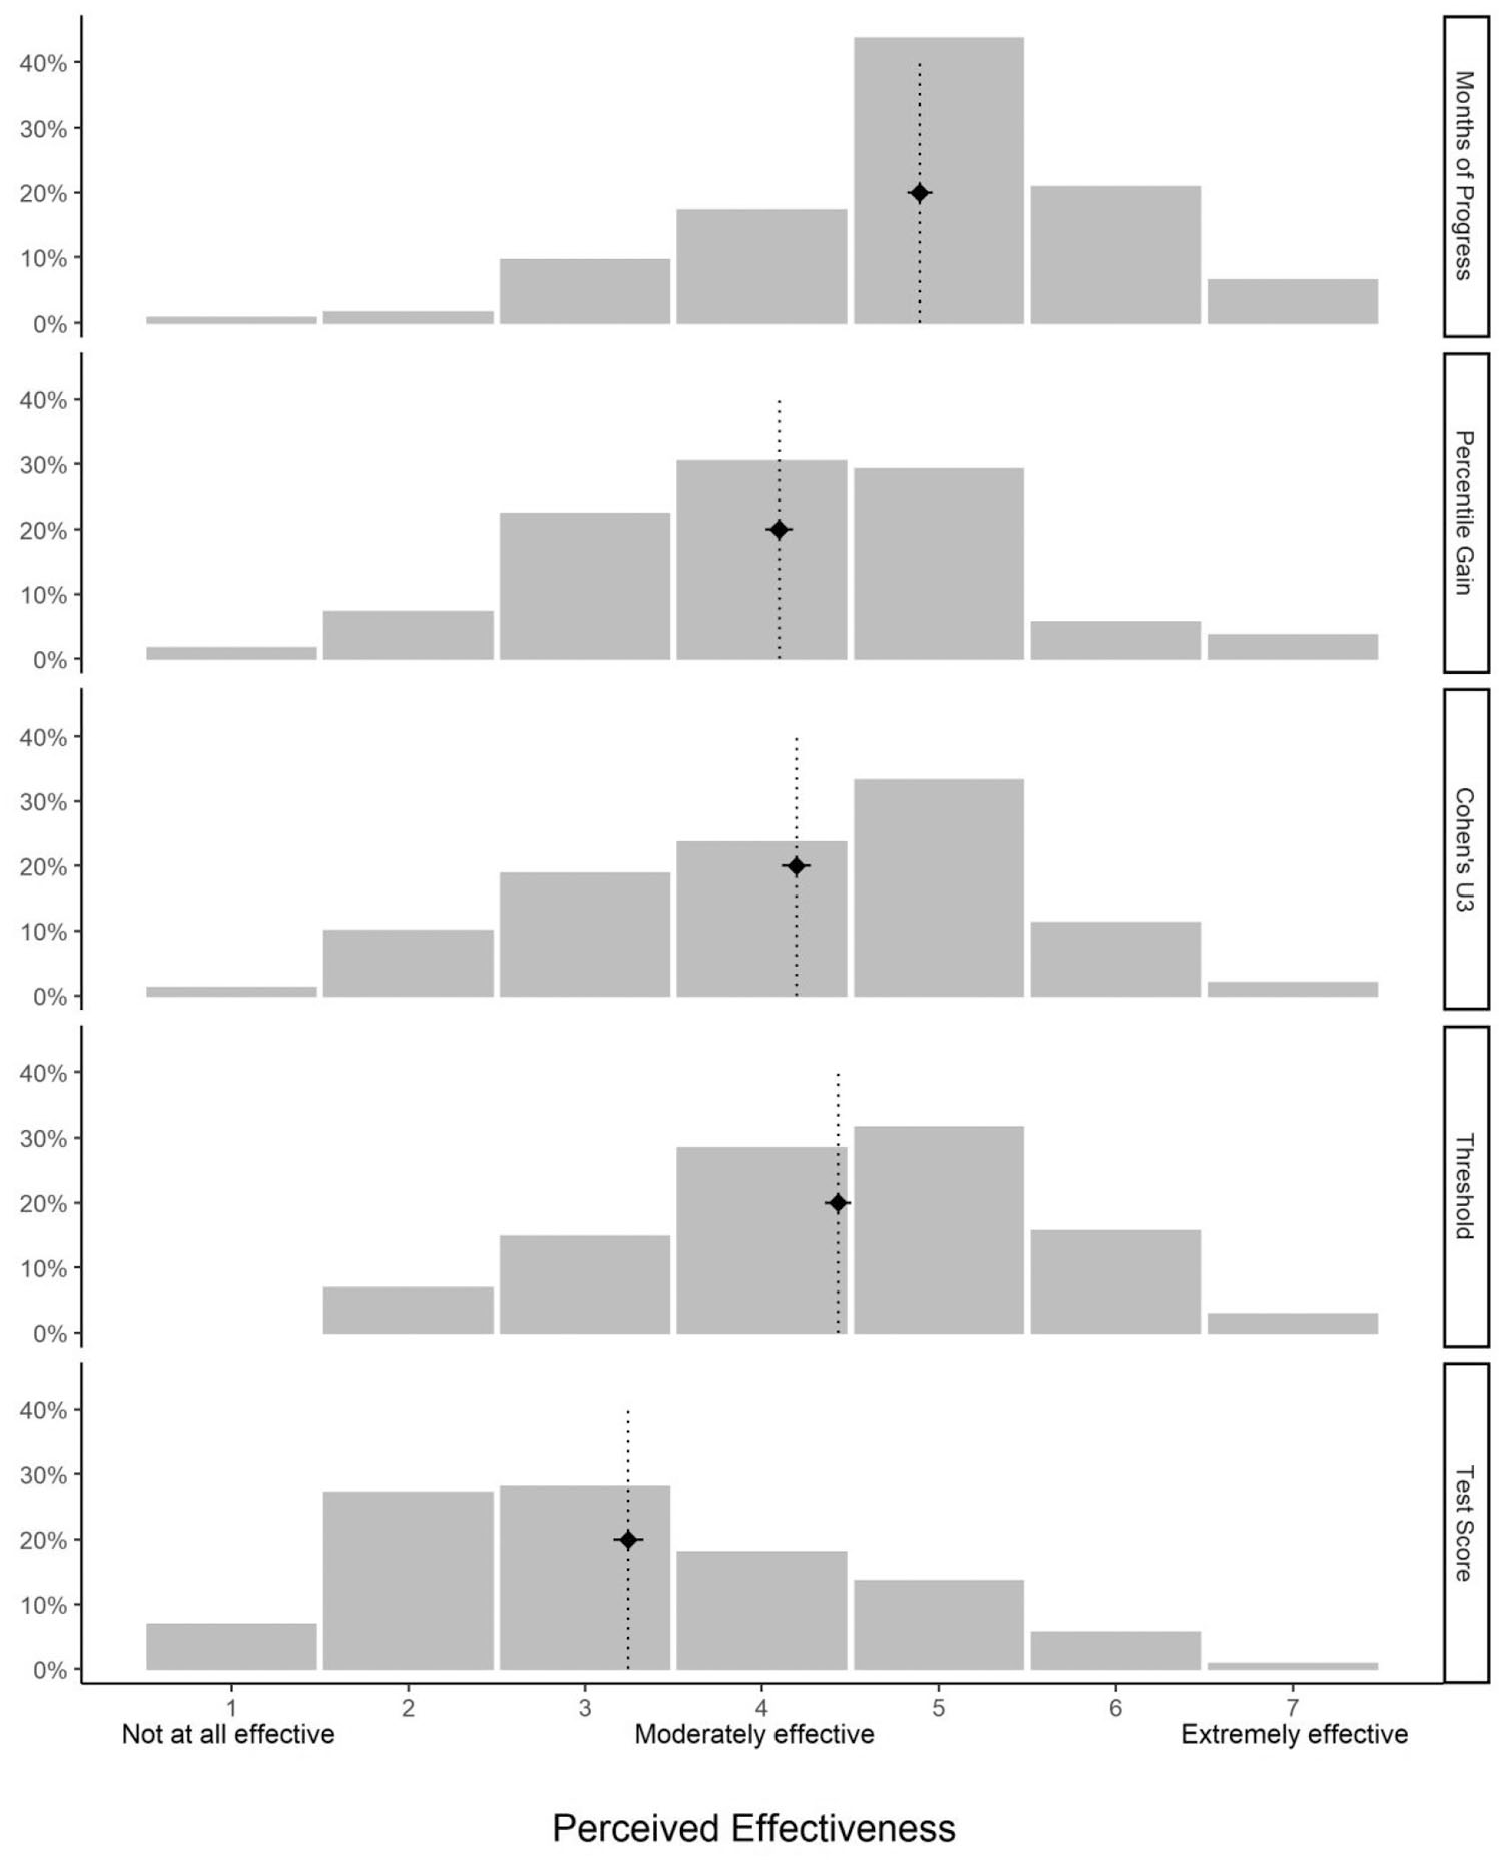
Distributions of perceived effectiveness ratings as a function of the metric used to describe the intervention’s impact.
Mean, SD, and Pairwise Differences (Cohen’s d) of Perceived Effectiveness of the Interventions Described in the Five Metrics
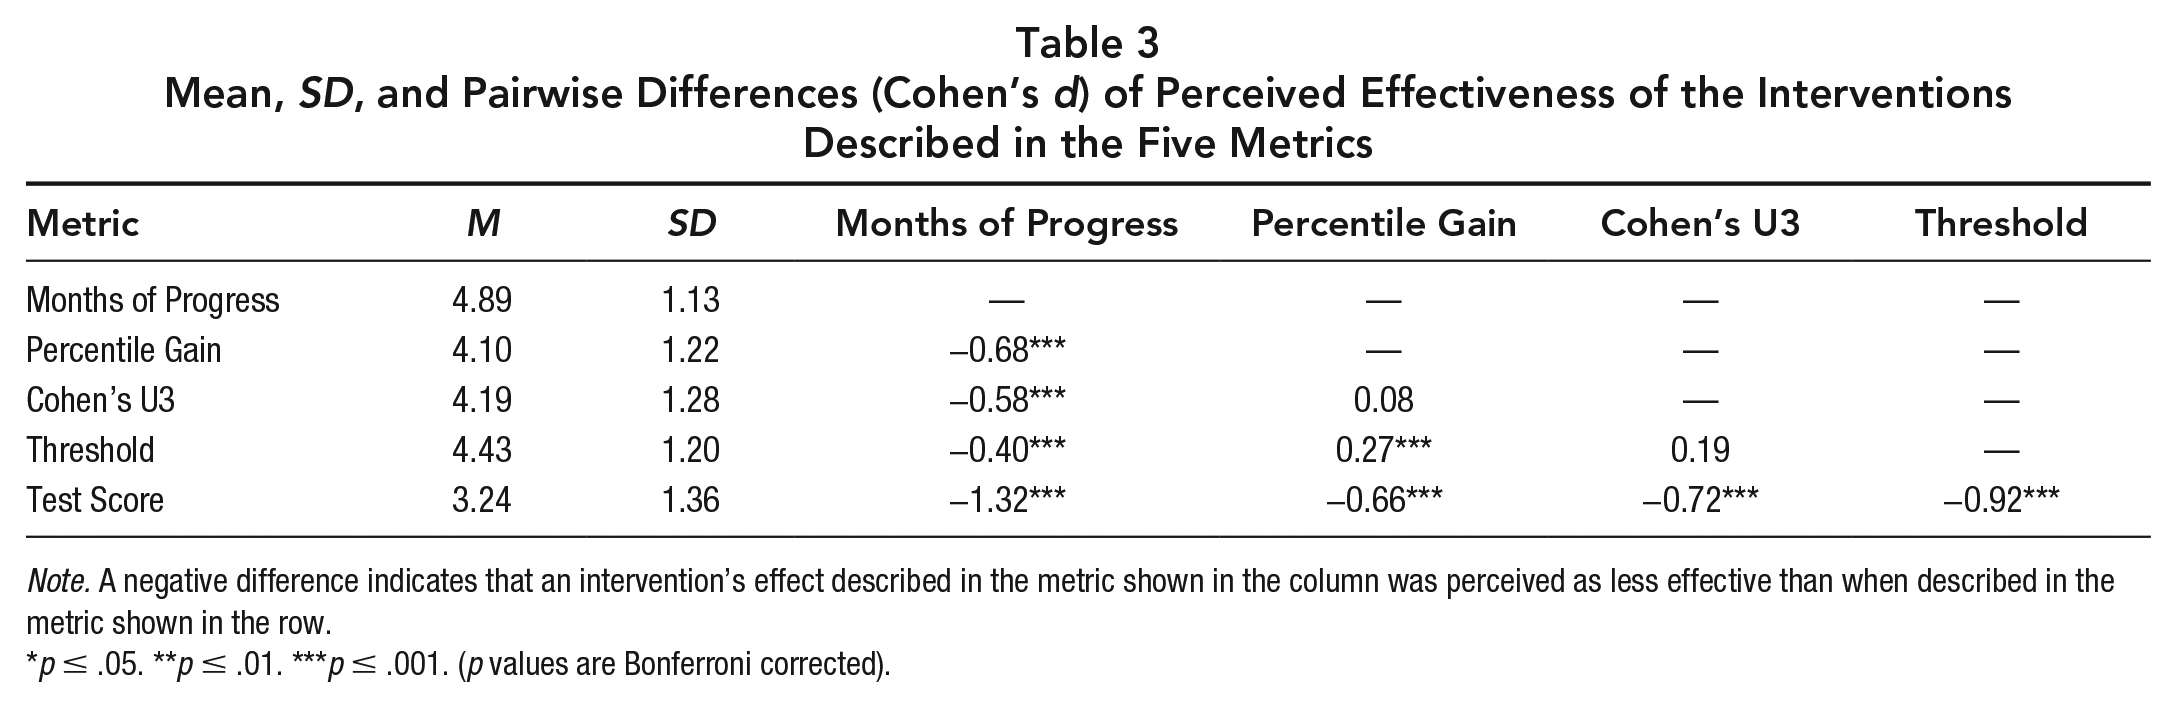
Note. A negative difference indicates that an intervention’s effect described in the metric shown in the column was perceived as less effective than when described in the metric shown in the row.
p ≤ .05. **p ≤ .01. ***p ≤ .001. (p values are Bonferroni corrected).
Because our within-subjects design may have produced unwanted carryover effects, we also reran the analysis only considering the first problem presented to each participant. Despite this change substantially reducing our statistical power, effect size metric still had a significant impact on teachers’ ratings of effectiveness, F(4, 245) = 13.29, p < .001, and their pattern of response was virtually identical to the full analysis (see Supplemental Figure S.1 and Supplemental Table S.5).
Again, we examined whether demographic factors were related to the perceived effectiveness of each metric. As shown in Supplemental Table S.6, there was no evidence of any strong or moderate relationship. Only self-reported math ability was significantly related with teacher’s ratings, and this influence was limited to the effect reported in Cohen’s U3: Teachers with higher math ability rated the intervention described in Cohen’s U3 as less effective than teachers with lower math ability, r(231) = −0.22, p = .020 (Bonferroni-corrected). Perceived effectiveness was not significantly influenced by teachers’ familiarity with KS2 Math test, by their familiarity with the concept of effect size, by whether they had ever heard of intervention impact being reported in months of progress, or by their teaching experience.
Perceived understandability and helpfulness
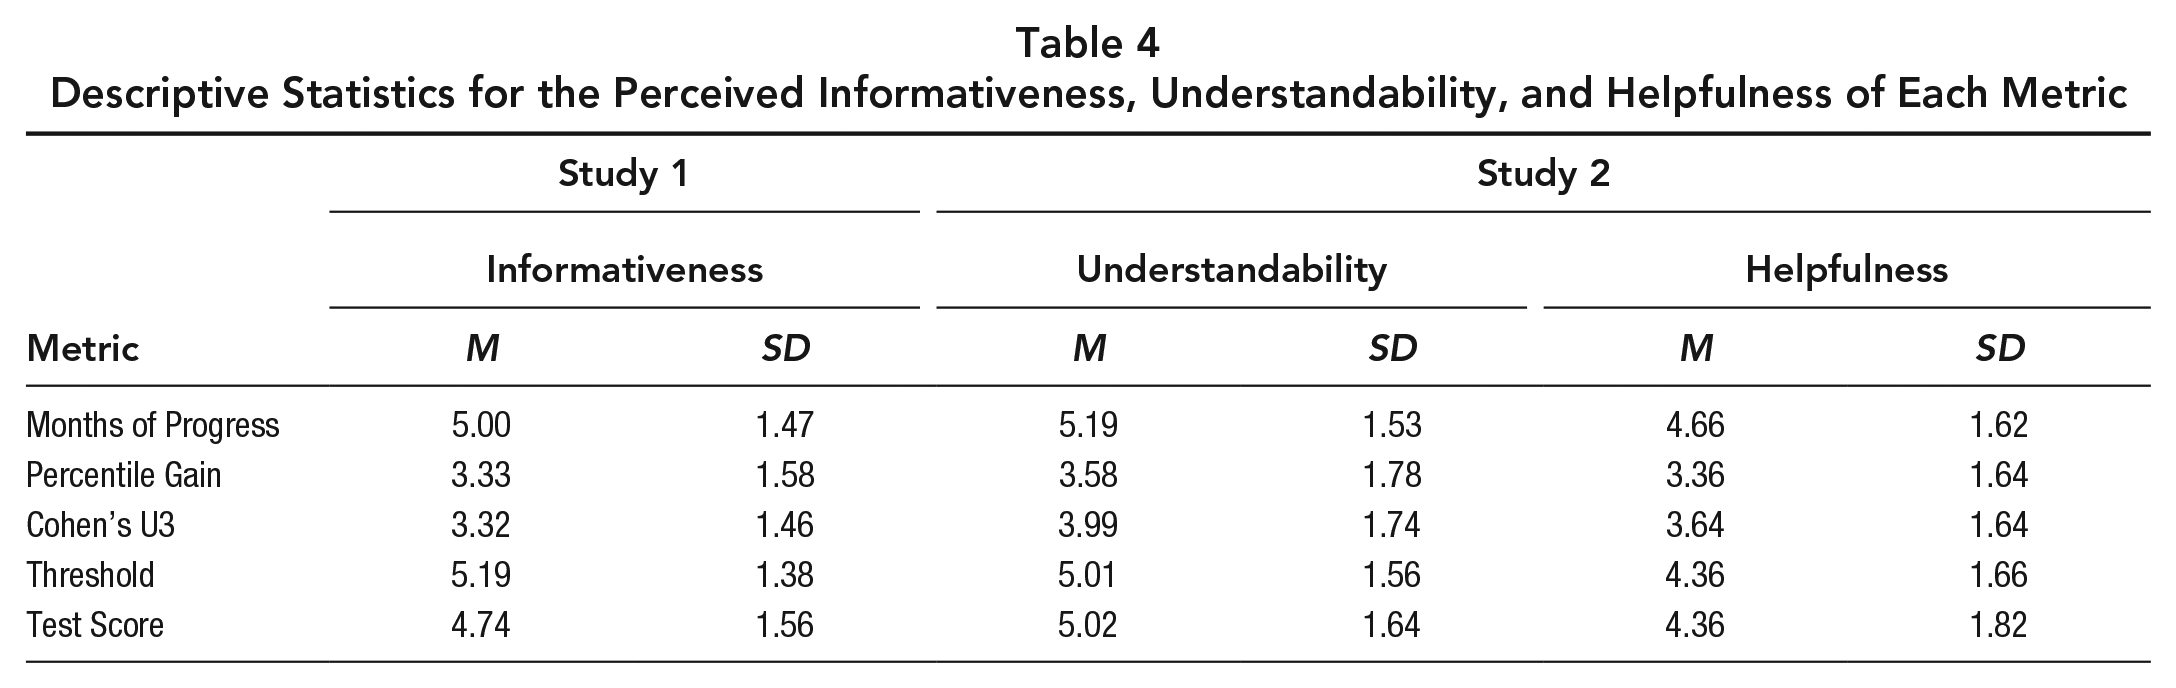
A secondary goal of Study 2 was to clarify teachers’ perceptions of the various metrics by surveying how easy to understand and helpful they perceive each metric to be. As shown in Table 4, the average ratings of perceived understandability and perceived helpfulness for each metric very closely paralleled the perceived informativeness ratings obtained in Study 1. On all three measures, Percentile Gain and Cohen’s U3 were consistently rated lower than the other effect size metrics. As with informativeness, the influence of effect size metric on understandability and helpfulness was significant (Understandability: χ2[4] = 269.94, p < .001; Helpfulness: χ2[4] = 145.8, p < .001). Moreover, there was no evidence that teachers’ perception of understandability and helpfulness were significantly influenced by their demographic characteristics (see Supplemental Tables S.7 and S.8 for a full description).
Descriptive Statistics for the Perceived Informativeness, Understandability, and Helpfulness of Each Metric
General Discussion
The effects of educational interventions are typically translated into an intuitive metric before being communicated to teachers. However, there is no consensus about the metric best suited to that aim, and to our knowledge, no previous study has examined how teachers perceive the different options. Across two studies we evaluated (1) how informative, easy to understand, and helpful teachers believe the different effect size metrics are, and (2) whether these metrics induce different perceptions of effectiveness.
Perceived Informativeness, Understandability, and Helpfulness
We found that teachers have strong preferences about the translation metrics they consider most informative. Our participants rated effects reported in Months of Progress, Threshold, and Test Score metrics as substantially more informative than effects reported in Percentile Gain and Cohen’s U3. These preferences were shared by the majority of our participants. For example, although 76% of teachers rated a vignette above the midpoint of the informativeness scale when an effect was reported in terms of months of progress, only 27% did so when an effect was reported as a percentile gain. We found a very similar pattern of preferences when a new sample of teachers, in Study 2, was asked to rate the metrics in terms of their understandability and their helpfulness. All three measures—informativeness, understandability, and helpfulness—are related to the perceived value of a source of information (e.g., Davis, 1989; Robey, 1979), so the consistent preferences we found for some effect size metrics over others, across the three measures, suggests that these findings are not an artifact of our questions or samples. Furthermore, the absence of any relationships between teachers’ responses and their demographic characteristics suggests that our findings may generalize to other populations of teachers.
Perceived Effectiveness
We also observed that different translation metrics induce different perceptions of an intervention’s effectiveness. Teachers perceived an intervention as most effective when its effect was described in Month of Progress, followed by Threshold, Cohen’s U3, Percentile Gain, and lowest when described in terms of change in Test Score. Between-metric differences were large, particularly between Month of Progress and Test Score. For example, although 71% of teachers rated a vignette above the midpoint of the effectiveness scale when an effect was reported in terms of Months of Progress, only 20% did so when the same effect was reported in Test Score. This effect of metric was observed among teachers who considered themselves extremely familiar with the outcome measure of the described trial (i.e., the KS2 Math test).
It is worth noting that the perceived effectiveness associated with Month of Progress may have been even higher had we based our conversion from Cohen’s d using a different growth estimate to that used by the EEF (see note of Table 1). For example, using Hill, et al.’s (2008) widely cited students’ growth estimates in mathematics (for 1 year of teaching and maturation between Grades 4 and 5, the U.S. equivalent of the students described in our vignettes), the effect of the intervention described would have corresponded to three additional months of progress rather than two, a change that would have made the intervention appear even more effective.
A limitation of our two studies is that we used convenience samples, potentially limiting the generalizability of our findings. Nevertheless, the makeup of our two samples are remarkably similar to population data (e.g., in terms of age [Organisation for Economic Co-operation and Development, 2019], or type of school [Department for Education, 2019a]). One exception is the proportion of primary to secondary school teachers (Department for Education, 2020) where, as shown in Table S.1, our sample had disproportionately many teachers who work in primary schools. To address this, we analyzed our data independently for both groups. This indicated no difference in their patterns of responses (see Table S.10), suggesting that our samples are typical of the general population, at least on these observable measures. 4 As in any study using convenience sample, there are likely unobservable differences between the teachers who took part in the study and those who did not. However, there appears to be no strong reason to believe that these differences would be related to teachers’ judgments of the various effect size metrics in a way that would affect the generalizability of our findings.
How Should Educational Effects Be Communicated?
Our findings suggest that decisions as to how to translate effect sizes can have substantive implications for teachers’ engagement and their perceptions of intervention effectiveness.
The perceived informativeness, understandability, and helpfulness of a source of information influence the extent to which a user engages with that source (e.g., Davis, 1989; Ducoffe, 1996; Robey, 1979). Considering the strong preferences that teachers exhibited on these dimensions, communicators’ decisions as to how to report their research findings are likely to influence, perhaps substantially, the level to which teachers will engage with research findings. Our studies suggest that communicators aiming to maximize teachers’ engagement with their research should consider reporting effects using Months of Progress, Threshold, or Test Score. Reporting effects as Percentile Gains or Cohen’s U3s, as suggested by Baird and Pane (2019) or Valentine and Cooper (2003) may result in lower engagement, at least for teachers in England. Communicators’ decisions, however, should not ignore the theoretical pros and cons of the metrics. This is particularly the case for Months of Progress, which has several undesirable properties. For example, Baird and Pane (2019) pointed out that time-based effect size metrics, such as Months of Progress, rely on hidden (and perhaps invalid) assumptions, are not bounded to a plausible range, do not minimize statistical uncertainty, and are inconsistent across different defensible calculation options.
Importantly, we found that effect size metrics influence the perceived effectiveness of interventions. Our findings suggest that research communicators can, in effect, manipulate the perceived effectiveness of the interventions they study by using different effect size metrics. Reporting effects in terms of months of progress is likely to lead to higher perceptions of effectiveness, whereas using the other metrics examined, particularly Test Score units, are likely to result in lower perceptions of efficacy.
Crucially, our findings reveal an important, but as yet undocumented, implication of the various effect size metrics used in education: their potential to mislead teachers. We found that all the effect size metrics led to considerably higher beliefs about the efficacy of the intervention, compared with when the same effect was reported in terms of the change in students’ tests scores. This finding is concerning, given that teachers are likely to be extremely comfortable with interpreting test scores—particularly on high-stakes tests such as the KS2 Math test—and as such, their perceptions of and intervention’s effectiveness described in this metric is likely to be the most accurate. The implication is that using effect size metrics, such as months of progress or percentile gain, may lead teachers to expect higher effects on raw test scores than these metrics actually imply. This prospect could lead to frustration, disappointment, and ultimately erode teachers’ engagement with research. Our findings suggest that concern is most pronounced when effects are reported in terms of months of progress. Given this, and given that there are good theoretical reasons to avoid using the Months of Progress metric (Baird & Pane, 2019), we suggest that care is needed if research communicators are to adopt this approach. Specifically, at a minimum, research communicators who use this metric should make sure that they calibrate teachers’ expectations appropriately.
One way of calibrating teachers’ expectations would be to report interventions’ effects in multiple metrics. For example, both months of progress and test scores could be used in research reports. This is an explicit recommendation of the CONSORT statement, a set of reporting guidelines endorsed by leading medical journals. When reporting the outcomes of medical RCTs, researchers are advised to use both absolute and relative effect size metrics in order to minimize the influence these two metrics have on clinicians’ and patients’ perceptions of effectiveness (CONSORT Statement, 17b, Schulz et al., 2010). In the present context, reporting multiple metrics would ensure that the advantages of the metrics—in terms of informativeness, understandability, and helpfulness—are not at the cost of inflating the perceived effectiveness of the intervention. Another way to mitigate this issue would be to better communicate the relationship between Months of Progress and Test Scores. Brief calibration exercises have been shown to substantially improve mapping between numerical quantities (e.g., Izard & Dehaene, 2008; Opfer & Siegler, 2007). The extent to which these techniques can be used in applied settings, such as the interpretation of educational effects, is an open question.
In sum, our findings indicate that decisions made when communicating educational effects have substantive implications for both teachers’ engagement and their perception of an intervention’s effectiveness. Given the significant level of research funding devoted to gaining robust educational evidence, it is crucial to ensure that this information is presented to teachers in a way that maximizes their ability to make informed decisions.
Supplemental Material
sj-pdf-1-edr-10.3102_0013189X20987856 – Supplemental material for How Should Educational Effects Be Communicated to Teachers?
Supplemental material, sj-pdf-1-edr-10.3102_0013189X20987856 for How Should Educational Effects Be Communicated to Teachers? by Hugues Lortie-Forgues, Ut Na Sio and Matthew Inglis in Educational Researcher
Footnotes
Notes
Authors
References
Supplementary Material
Please find the following supplemental material available below.
For Open Access articles published under a Creative Commons License, all supplemental material carries the same license as the article it is associated with.
For non-Open Access articles published, all supplemental material carries a non-exclusive license, and permission requests for re-use of supplemental material or any part of supplemental material shall be sent directly to the copyright owner as specified in the copyright notice associated with the article.