



Abstract
This study investigated the relationship between school attendance zone boundary (AZB) changes and racial segregation in Prince George's County Public Schools in Maryland, a diversifying, majority-Black suburban district outside Washington, DC. We found that the district's frequent and widespread elementary AZB changes since 1990 were largely segregative, especially as its court-ordered desegregation plan ended. Our findings reflect a district in which contemporary rezoning processes were largely race evasive, as they are in many other places, although trends there may be shaped by the particular politics of race and class of this majority-Black setting. Our findings add to a growing literature on how suburban districts respond to diversifying student populations, and they can help inform efforts for more integrative and equitable AZBs.
Introduction
School attendance zone boundaries (AZBs), or the lines within a school district that assign students to particular schools, are consequential forms of locally determined education policy. By assigning students to schools, they shape large portions of metropolitan segregation and determine students’ access to educational opportunities. AZBs are drawn and redrawn by school district leaders, often when population sizes change and require school capacities be rebalanced. Population compositions, however, particularly racial and economic, also can affect AZB change processes. In diversifying school districts, leaders manage the desires of long-time residents alongside the need to accommodate growing numbers of new, heterogeneous students. Growing and diversifying suburban school districts across the nation are especially grappling with these trends. Although the existing literature has focused on the responses of formerly majority-White suburbs to diversification, considerably less is known about these trends within other suburban contexts. Prince George's County, Maryland—a largely Black, affluent suburb outside of Washington, DC—represents a unique context in which to study population and AZB changes. This study analyzed elementary school AZB changes in Prince George's County Public Schools (PGCPS) between 1990 and 2020. Specifically, we asked:
How did the public school and residential populations change in Prince George's County between 1990 and 2020?
How did elementary school AZBs change in that time period?
To what extent do elementary AZB changes, including those caused by school openings or closures, contribute to changes in racial segregation over time?
As in most districts across the country, AZBs form the basis of student assignment policy in PGCPS. Analyzing how AZBs sort student groups over time allowed us to understand how these locally determined boundaries continue to shape access to opportunity and can help us to inform more equitable future AZB changes. Our findings add to a growing literature on how diversifying suburban school districts respond to changing student populations. In particular, the case of PGCPS adds to our understanding of these processes in a majority-Black suburban district as it exited court desegregation oversight.
Literature Review
Several bodies of literature inform this study. We first reviewed research demonstrating how AZBs shape both school and residential segregation, making them an important form of policy to study. Second, we turned to literature describing how AZBs have shifted since the end of court-ordered desegregation. A third body of research explored the contemporary political factors affecting AZBs specifically in suburban areas. However, Prince George's County is also unique as an affluent majority-Black suburb, so, finally, we drew on literature that explored the context of Black enclaves.
Importance of AZBs
One of many factors shaping patterns of school segregation today are the AZBs that sort students into schools. Local school boards and superintendents set these boundaries and redraw them, or rezone, whenever it is deemed necessary. Despite the rise of school choice policies, nearly 73% of all students attend their assigned school, and the vast majority of school districts use AZBs as the foundation of their student assignment policies (National Center for Education Statistics, 2021). Even within the same school district, schools can have substantially different resources, opportunities, and perceived quality, so AZBs play a crucial role in shaping students’ educational experiences and outcomes. For example, research has demonstrated gaps in expenditures, teacher experience levels, and school facility quality between schools within the same district (Lane et al., 2018; Webb, 2017) as well as stark disparities in schools’ abilities to fundraise through parent groups (Mackevicius, 2022; Posey-Maddox, 2013). Decades of social science research also have shown the psychological and social harms to children in racially isolated learning environments (Mickelson & Nkomo, 2012). Over the last three decades, the portion of racial and economic school segregation coming from stratification within school districts, rather than between districts, has increased steadily (Owens et al., 2022).
AZBs not only shape school populations, they also influence and are influenced by residential populations. Public schools can help define a neighborhood, conveying information to potential homebuyers about a neighborhood's racial or economic composition, and parents, especially White parents, who can afford to do so will consider AZBs when purchasing a home (Holme, 2002; Lareau & Goyette, 2014). These dynamics have a long history. Areas redlined by the federal government nearly a century ago now have schools with higher shares of students of color, lower funding, and lower student test scores (Lukes & Cleveland, 2021). Research from the 1980s found that newspaper real estate ads tended to only mention particular school names or attendance zones when those schools were majority White and in areas where desegregation was less thorough (Pearce, 1980, 1981). Today, parents may rely on AZB information provided on real estate websites and on school ratings provided by sites such as GreatSchools and U.S. News & World Report, which also can strengthen the link between AZBs and residential segregation (Hasan & Kumar, 2019). In effect, AZBs have created a strong, mutually reinforced link between patterns of residential- and school-based segregation (Denton, 1996). Thus, our research examined the relationships between AZBs and both school and residential segregation.
Several large-scale studies have quantified the relationship between AZBs and school and residential segregation levels (Monarrez, 2023; Monarrez & Chien, 2021; Richards, 2014; Saporito, 2017; Saporito & Van Riper, 2016). This research has found that, on average, AZBs tend to reproduce existing levels of residential segregation in schools (Monarrez, 2023; Richards, 2014). However, it also has found a lot of variation across districts. In some places—especially places experiencing rapid racial change—AZBs have been drawn in ways that create particularly segregated schools (Richards, 2014). In contrast, scholars studying the link between the shape of AZB polygons and segregation levels have found that places with highly irregular AZBs are associated with less segregated schools (Saporito, 2017; Saporito & Van Riper, 2016). Overall, the literature suggests that there is considerable heterogeneity in the relationship between AZBs and segregation levels across districts. The redrawing of AZBs also means that this relationship changes within each district over time.
Post–Unitary Status Districts and AZBs
Throughout the long history of school desegregation in the United States, federal courts have recognized the link between AZBs and residential and school segregation. Many court-ordered desegregation plans have required individual districts to redraw AZBs formerly linked to de jure school segregation and instead create zones that draw heterogeneous groups of students from segregated residential neighborhoods into diverse schools (Gordon, 1994; Taylor et al., 2019). Since the 1990s, however, the federal courts have largely retreated from enforcing school desegregation, and most school districts now alter their AZBs absent any federal oversight.
Research has focused on the range of arguments for and outcomes of the end of court-ordered desegregation. Case studies illustrate that obtaining unitary status is often promoted by those seeking to return to “neighborhood schools” and focus attention on “school quality” but that promises of improvement don't necessarily materialize (Orfield & Eaton, 1996). In some cases, the return to neighborhood schools—implemented through the redrawing of AZBs—began even before districts were declared unitary. In Charlotte–Mecklenburg Schools in North Carolina, for example, the district began to replace its mandatory bus plan with other strategies such as magnet programs in the early 1990s while still under court order (Mickelson, 2001). Proponents of such shifts have argued that mandatory desegregation strategies are rendered ineffective in the wake of White flight and changing demographics. For example, in Freeman v. Pitts (1992), the Supreme Court agreed with DeKalb County School District in Georgia, stating that persisting de facto segregation did not require remedial action by the district. Despite arguments that the end of desegregation policies would bring White families back, research has shown that this did not bear out (Orfield & Eaton, 1996).
Reardon et al. (2012) found a causal link between court desegregation orders ending and rising segregation of Black students. Broadly, assessments also have shown that as desegregation has ended, school segregation would have increased more had there not been declines in residential segregation (Reardon & Yun, 2003). Additional case study research in Nashville, Tennessee, demonstrated that the effects of the return to neighborhood schools depended on the context (i.e., resources and constraints) of one's neighborhood, making schools more dependent on their immediate surroundings (Goldring et al., 2006).
However, there remains the potential for school district leaders to use AZBs to create more racially diverse schools. Local leaders who wish to do so can prioritize racial diversity when rezoning. Research has shown that rezoning can create more racially diverse schools, especially in large school districts with diverse populations (Gillani et al., 2023; Macartney & Singleton, 2018; Monarrez, 2023). This can be accomplished even alongside other rezoning goals, such as minimizing the number of children who must switch schools and reducing transportation times (Gillani et al., 2023). The vast majority of districts in the United States use AZBs as the foundation of their student assignment policies (Geverdt, 2018) and thus have access to these potential desegregation tools.
AZBs in Suburban Areas
Because AZBs determine which students have access to specific schools, resources, and opportunities within a district, redrawing the zones allows stakeholders to alter patterns of access in ways that can either advance or hinder equity. Advantaged groups may advocate for boundaries that allow them to hoard access to educational resources in a form of social closure, defined by sociologists as a process by which groups restrict others’ access to resources or opportunities in order to maximize their own benefit (Fiel, 2013, 2015; Tilly, 1999).
Particular attention has been paid to the rise of White enclaves 1 around the country (Henig et al., 1999; Lewis-McCoy, 2018), and previous case study research has documented instances in which White residents push for exclusionary school boundaries in the face of racial diversification (Holme et al., 2014; Siegel-Hawley, 2013; Wiley et al., 2012). As White families cluster in particular schools, their concentrated social capital and fundraising can lead to highly unequal resources at their schools by, for example, increasing the ability of a school to attract high-quality teachers or provide more extracurricular activities (Posey-Maddox, 2013; Wilson, 2021). Clotfelter et al. (2005, 2006, 2009, 2011) have documented in a series of studies how, compared with their peers, Black and low-income students in North Carolina have higher percentages of novice teachers, absent teachers, and mobile teachers, which negatively affects their academic achievement.
Acts of social closure may be especially prevalent in areas experiencing demographic change. For example, population growth and decline often necessitate school openings and closures, both of which require the redrawing of AZBs and are particularly associated with segregated schools. Research in other districts has found that school closures disproportionately affect predominantly Black schools, and new school buildings may be placed in segregated White neighborhoods (e.g., Erickson, 2016; Tilsley, 2017; Weber et al., 2016).
Other research has shown that in districts experiencing racial diversification, leaders have remained particularly responsive to advantaged (typically White) families’ desires to maintain exclusionary school boundaries, fearful of losing students and the funding dollars attached to them (Holme et al., 2014; Siegel-Hawley, 2013). Further, race-evasive education policies can perpetuate inequities in schools and AZBs without ever mentioning race (Bonilla-Silva, 2017; Lewis & Diamond, 2015). By race-evasive, we mean policies or framing that is silent about the way race influences educational experiences and outcomes in our still-stratified society.
Black Enclaves
Most suburban research has focused on predominantly White suburbs, but the share of Black residents living in suburbs has risen from 25% in 1990 to 40% in 2020 (Lewis-McCoy et al., 2023). Compared with studies of how White residents engage in social closure through the process of redrawing AZBs, the responses of suburban Black enclaves to demographic and AZB change is less well understood. Black suburban residents are also distinct from their more commonly studied urban counterparts in that they are more likely to be middle class. The resources and identities of Black middle-class suburbanites may shape patterns of opportunity hoarding around AZBs. We drew on literature about Black suburbs and the Black middle class to contextualize our study.
Sociological research has found that the number and size of middle-class Black enclaves has been increasing in recent decades, and these areas are becoming increasingly spatially distant from low-income, urban Black populations (Pattillo, 2005). Black enclaves tend to be less economically homogeneous than White enclaves (Haynes, 2001; Pattillo, 2013; Pattillo-McCoy, 2000; Taylor, 2002). One reason for this is racially discriminatory housing covenants that historically have restricted all Black families, no matter their income, to particular neighborhoods (Wilkins & Gibson, 2023). Research also has found that the Black middle and lower classes are bound by perceptions of a “linked fate,” or the idea that racial discrimination continues to dampen the economic mobility of all Black families, including those in the middle and upper-middle classes (Dawson, 1994; Landry & Marsh, 2011). This idea helps explain how middle-class Black families may differ from their White counterparts, although there are certainly still important class differences among the Black population.
Case studies in Prince George's County have demonstrated examples and the political consequences of this economic heterogeneity. For example, Lacy’s (2007) study of the Black middle class featured a particularly affluent subdivision located within a relatively more economically diverse area of the county and showcased upper-middle-class Black residents’ purposeful— but not always successful—efforts to distinguish themselves from their lower-middle-class Black neighbors (Lacy, 2007). An earlier study found that the socioeconomic diversity of Black residents in the county prevented their alignment on policy issues and the ability to elect Black representatives, ultimately limiting their political power (Johnson, 2002).
Finally, research has demonstrated how majority-Black spaces and/or leaders do not guarantee equity for Black residents. A recent ethnographic case study described the ways in which a majority-Black school board employed “racialized and racist logics,” or upheld norms and values that reinforced racial inequalities (Daramola et al., 2024, p. 22). Although Black residents were racially represented in the district's leadership, this representation was not enough to overcome institutional structures “designed to uphold advantages for White students and families,” such as procedural guidelines that shut down public comment or protest from Black community members (p. 22). As another example, Ewing’s (2018) book documented the tensions between the Black chief executive officer of Chicago Public Schools and local Black communities over school closure decisions. These studies highlight how class divisions between Black leaders and lower-income Black communities can perpetuate systematic inequalities. However, other work has suggested that school board membership partisan shifts have reduced racial segregation as a result of changing attendance zones (Macartney & Singleton, 2018).
Prince George's Context
Demographics
Prince George's County is located in the DC metro area, an area with rapidly growing and diversifying multiracial suburbs surrounding a once majority-Black though increasingly White and Hispanic DC city center. Prince George's is a unique suburb in this context because it became majority Black around 1990, following decades of in-migration of Black, middle-class DC families and out-migration of Whites in response to court-ordered school desegregation (Greene, 1999). It is also quite affluent; it was the country's wealthiest majority-Black county from the 1990s to 2022 (Rowlands, 2020; Van Dam, 2022). Sociologists have written about how the area's Black residents find comfort and connection living in predominantly Black suburban communities (Lacy, 2007; Landry, 1987), although racism and discrimination are certainly still present (see, e.g., Coates, 2015).
In the past two decades there also has been a large increase in the Hispanic population, which is, on average, less affluent than the county's other residents (Hendey & Posey, 2017). Qualitative research has documented how some Black residents in Prince George's County, especially those who are affluent, have reacted negatively to the growing Hispanic population and wish to separate themselves (Simms, 2019). This complex interaction between race and class is not well studied in the suburban literature but is becoming more common in diversifying suburbs around the country (Lewis-McCoy et al., 2023).
Despite the county's overall affluence, its public schools remain underfunded; recent PGCPS budgets indicate large budget deficits (Prince George's County Public Schools, 2023b, 2024). Case studies have documented the county's long-standing difficulty balancing residents’ competing desires for low tax rates and high-quality public services such as public schools (Lacy, 2007; Simms, 2019). Much of the financial strain stems from a cap on local property taxes put in place in 1978 (Jones, 2011). The county also has relatively low average property values, at least compared with other nearby suburbs. Structural racism, or forms of racism deeply entrenched in systems, policies, and economic markets, limits developers’ willingness to invest and increase the tax base in this majority-Black area because it leads developers to anticipate that they will not receive the same return on investment that they might expect in majority-White areas (Lacy, 2007; Simms, 2019).
Some of these demographic changes may motivate efforts to create and protect enclave neighborhoods and schools within the county. For example, the influx of less advantaged Hispanic children may motivate middle-class or affluent Black residents to react in exclusionary ways, similar to how White residents have reacted to new residents of color in other places (Castro et al., 2023; Diem et al., 2014). District leadership also may be especially motivated to protect any relative enclave schools (whether they be wealthy, Black, or White enclaves) and avoid unpopular boundary changes. Research has documented such responses in other diversifying districts (Frankenberg & Diem, 2013; McDermott et al., 2015), and they may be likely in PGCPS given the district's history of financial strain and difficulty retaining affluent families who perceive the schools as low quality (Lacy, 2007; Shabi, 2023). Research has suggested that segregation between non-White groups may be rising in the United States, especially between and within suburban areas (Farrell, 2008).
Other residents might opt to leave the county entirely, or prospective residents may not be entering altogether. Neighboring Charles County recently surpassed Prince George's as the most affluent Black county in the United States, and Census data indicate that most recent entrants into Charles County are very high-income Black individuals coming from Prince George's (Van Dam, 2022; Wilkins, 2022). News media suggest that the moves are driven in part by the lower cost of homes in Charles County compared with Prince George's and by perceptions of Charles County's newer, higher-quality public schools (Shabi, 2023; Wilkins & Gibson, 2023).
History of AZB Changes
Amid demographic change, PGCPS has altered its AZBs numerous times, including while it was under court order to desegregate between 1972 and 2002 (Feinberg, 1978; Jones, 2011). A 1983 agreement in the desegregation case stipulated that each school should have a minimum of 10% and a maximum of 80% Black students, and the district implemented a busing and rezoning plan to achieve this goal. As the district's percentage of Black students increased, compliance with the 80% cap was harder, and the guidelines were never adjusted. Most schools above 80% Black were either given more resources (sometimes called Milliken II schools 2 ) or implemented a magnet program in accordance with a 1985 agreement. A report to the court concluded that the magnet program made positive contributions to desegregation and was popular with students and that, as of 1996, busing made a smaller, though still positive contribution to desegregation (Vaughns v. Board of Education, Prince George's, 1998, p. 585). Yet, busing and magnet programs were insufficient to achieve the stated goals given that Black students comprised three quarters of the district enrollment by the late 1990s.
As part of the settlement agreement to end the case, a 1998 Memorandum of Understanding (MOU) between the school district, county government, and plaintiffs stipulated that the district's busing plan be phased out over the coming years and that children return to neighborhood schools. The MOU stated, “[T]he parties express a commitment to provide the opportunity for children in Prince George‘s County to receive their education in as desegregated and racially diverse a setting as is practicable while also recognizing that the mandatory assignment of students is no longer the primary means of desegregation in the public schools and that demographic changes have rendered some of those assignments no longer productive” (Vaughns v. Board of Education, Prince George's, 1998, p. 573). Magnet schools were increasingly part of the district's effort to use school choice to desegregate (Eaton & Crutcher, 1996). By 1987, PGCPS had ~40 magnet schools or programs, and almost all were elementary (accounting for nearly a quarter of schools); the percentage of Black students in these schools and programs was 58%. PGCPS also received state and county funding to help build more than a dozen new schools to accommodate students in their neighborhoods (Baltimore Sun, 2000).
Rezoning processes over the following years demonstrated a transition away from addressing the racial or even economic diversity of schools. Immediately following the end of the district's desegregation case, public discussion around rezoning still raised some concerns about racial/ethnic diversity of the schools (see, e.g., Johnston, 2000; Spellman, 1997). However, racial diversity and economic diversity were no longer formal rezoning criteria, and district leadership did not explicitly address either during the rezonings that followed unitary status and returned students to neighborhood schools (Prince George's County Public Schools, 2004).
Mentions of racial or economic diversity have become even more rare over time, and when community members have expressed concerns about racial or economic diversity, the district's responses are not very thorough. 3 Nationally, the 2000s was a time of growing race evasiveness, especially in discussions of student assignment. The Supreme Court's decision in Parents Involved in Community Schools v. Seattle School District No. 1 (2007) limited the ways in which districts could consider individual students’ race when assigning them to schools and largely reinforced race-neutral approaches to integration, to the extent that it remained a goal at all. Although previous research has documented how growing race neutrality can serve to advance White populations’ priorities (McDermott et al., 2015), similar trends also may be taking place in this majority-Black context.
Until recently, the district's rezoning policy did not mention diversity, but a district policy adopted in November 2023 lists the “racial composition of student bodies” as one of 14 factors that may be considered during the drawing of AZBs (Prince George's County Public Schools, 2023a). The language matches Code of Maryland Regulations around the closing of schools (Code of Maryland Regulations, 2021). However, PGCPS's administrative procedure documents around rezoning do not currently list any racial considerations (Prince George's County Public Schools, 2020), and it is not yet fully clear how the district will implement its new policy when rezoning.
Rezoning discussions in recent decades have focused largely on school quality, funding, and capacity issues (McDermott et al., 2015; Siegel-Hawley et al., 2021). For example, even as PGCPS has opened new schools to account for enrollment growth, it also has closed schools in an effort to consolidate and save money. Despite the wealth of the community, the district has long struggled with perceptions of low-quality schools. A 1978 referendum approved a cap on property taxes, 4 and subsequently, PGCPS had had per-pupil funding below the national average, resulting in students in temporary classroom buildings and challenges in recruiting enough certified teachers. In 1998 newspaper articles, leaders acknowledged that more schools would not improve the quality of teachers or parental involvement (Pierre & Sanchez, 1998). In fact, in media coverage, a state representative claimed that the busing debates were distracting from efforts to improve school quality (Frazier, 1998).
PGCPS has become increasingly diverse since the end of its desegregation case, with increasing percentages of Hispanic students, and discussions of racial segregation are warranted given research about the benefits of integration for all students (e.g., Johnson, 2019)—even though the district may have little practice with them. This study assessed how AZB changes in this race-evasive, post-desegregation context have affected segregation throughout the district.
School Choice
Today, there are several public choice schools and private schools within the county, which complicates the connection between residential and school populations (Prince George's County Public Schools, 2022). Public charter schools constitute one form of choice. The first charter school in Prince George's County opened in 2006 (Wiggins, 2012), and by 2009–10 there were four charters, all serving elementary grades. Together they enrolled 1,300 students in 2009–10, almost all of whom were Black (96%). The number of charter schools grew to nine by 2019–20 (all but one served elementary grades), and 85% of students were Black. Six of the charter schools remained ≥90% Black students, but one was 19% White and another was 26% Hispanic.
Other forms of public school choice at the elementary level include magnet schools, Talented and Gifted schools, and language-immersion schools, several of which were created as part of the district's desegregation order (Honawar, 2002b). However, many designated magnet schools still have attendance zones and give enrollment preference to in-boundary students; as of 2020, ten of the 22 elementary magnet schools listed on the district's website had an AZB. According to a 2021 PGCPS boundary report, ~14% of the district's students attended nonzoned choice schools, whereas the remaining 86% attended zoned neighborhood schools (Prince George's County Public Schools, 2021b). There are differences along racial/ethnic lines; as of 2020, 75% of Black students attended their zoned neighborhood school compared with 90% of Hispanic students (Prince George's County Public Schools, 2021a).
Finally, there are a number of private schools that operate within the county. Maryland Department of Education reports indicate that Prince George's nonpublic school enrollment peaked at ~24,000 in the early 2000s before dropping sharply to 14,000 in 2008, likely due to the recession. Enrollment has continued to decline since then, reaching 12,000 students in 2019–20 and <10,000 in 2021–22. The Private School Survey from the National Center for Education Statistics (NCES), while not a universe and therefore not capturing all students, reported that the county's non–public school enrollment in 2019–20 was 66% Black, 16% White, 7% multiracial, 6% Hispanic, and 4% Asian/Native Hawaiian and Pacific Islander, suggesting that private schools differ from district schools by enrolling higher shares of White and Black students and lower shares of Hispanic students. Such non–district school options, while seemingly declining in enrollment, may lessen the political pressure on AZB changes.
Research Methods
This study analyzed elementary school AZB changes in PGCPS between 1990 and 2020.
Data
We used shapefile data from a developing dataset—the Longitudinal School Attendance Boundary Survey (LSABS). The LSABS contains elementary, middle, and high school AZB maps for hundreds of districts from the 1989–90, 1999–00, 2009–10, and 2019–20 school years, allowing for analysis of boundaries over time. 5 We focused our analyses on PGCPS's elementary AZBs because they were smaller geographic units than middle or high school AZBs and thus had the most potential to separate students. Additionally, demographic changes often show up first among youngest children, enabling us to understand how populations may be shifting.
We merged digitized AZB maps with under age 18 population counts from the U.S. Census Bureau. We included population counts at the block level from the 1990, 2000, and 2010 decennial censuses and at the tract level from the 2020 decennial census, disaggregated by race/ethnicity. 6 All counts included only those aged 0–18 years to approximate the school-aged population. Because of concerns about the quality of economic data (particularly the interpolation of recent-decade American Community Survey estimates into very small geographic areas), and given the unique racial context of Prince George's County, our focus was on racial segregation in this study. Because the census units we used varied according to data availability, and because none of the census units nested neatly inside school AZBs, we used binary dasymetric interpolation to uniformly assign population counts to 30 m2 raster cells (Eicher & Brewer, 2001; Mennis, 2016). Using the 1992, 2001, 2011, and 2019 National Land Cover Database, we identified areas where people could realistically live (i.e., not water bodies or open spaces), and only those raster cells were assigned population values. Raster data define space as a matrix of equally sized cells, where each cell can contain a value representing information about the space. In our case, raster cells contain counts of the populations estimated to live within the raster cell and the AZB that contains most of the cell‘s area.
We included school enrollment data from the NCES Common Core of Data (CCD) for each year of interest, disaggregated by race/ethnicity and free or reduced-price lunch (FRL) status. FRL data are often critiqued by scholars pointing out their unreliability (Harwell, 2018), but we used the data to provide context around the economic status of PGCPS schools. We focused mainly on elementary school enrollments, although we separately provided total (all grade) enrollments for context. We defined elementary enrollments to include students in grades pre-K–5, or all students in grades pre-K–6 in the case of a school where the highest grade served was grade 6. We excluded charter school enrollments from our analyses.
Methods
We used a mix of quantitative and geospatial methods to answer our research questions. To start, we descriptively assessed how school and residential populations have changed over time. We also mapped these populations over time to visualize where they have changed. To answer the second research question, we flagged raster cells assigned to different schools at the beginning and end of a decade; these were areas that experienced boundary changes. We separately identified raster cells affected by school openings (rezoned to a school that did not previously exist at the beginning of a decade) and those affected by school closures (rezoned away from a school that no longer existed by the end of a decade). We aggregated these raster cells and their population counts, and we mapped their locations throughout the district.
Our third research question concerned the intersection of population changes and AZB changes. We began by calculating racial segregation using the mutual information index (M). M was introduced by Theil (1972) and is closely related to his more commonly known information theory index H. M builds off a measure of entropy (Er), or multigroup diversity, defined as

where pr is the proportion of the total population that comes from each group. Entropy is maximized when the proportion of each group is equal. From there, M is defined as

where u refers to the spatial units (e.g., attendance zones). Thus, M is the average difference between each unit's entropy and the overall system's (e.g., county) entropy, weighted by the unit's share of the entire population size. In other words, M measures how evenly sorted a total population is across units. In this study, we calculated racial neighborhood segregation among under age 18 residential populations, treating AZBs as the spatial unit.
We used M in this study because its unique properties allowed segregation change over time to be decomposed into its component parts (Elbers, 2023). Those parts include the creation or removal of units, changes in overall population racial compositions, changes in how the population is sorted across units, and what Elbers refers to as structural segregation. Here, structural segregation is essentially the portion of segregation that is unexplained by the other components. Thus,

We used decomposed segregation change to identify the effect of AZB changes on neighborhood segregation change in each decade. We did this by calculating residential segregation change and its component parts under two scenarios: one in which the boundaries change between t1 and t2 and one in which t1 boundaries remained unchanged until t2. Analyzing the differences allowed us to understand the amount of segregation change that was attributable to the AZB changes.
We measure residential segregation here rather than school segregation because the latter would require individual-level data indicating where every student lived and where they would enroll under various hypothetical AZB scenarios. Differences between school and residential segregation levels are driven by differences in the ages of individuals included (only elementary-aged students were included in our school segregation measure; all youth aged 0–18 years were included in residential segregation) and by resident students who did not attend their zoned school.
Although we did not know for certain the influence of each of these factors, there were data points that could help us estimate. As of 2020, the racial/ethnic compositions of the total PGCPS school enrollment and elementary school enrollment were very similar, suggesting that age differences may be small (see Figure 1). Total school enrollment had a slightly lower percentage of Hispanic students (38%) than the elementary enrollment (40%), reflecting that younger populations were slightly more likely to be Hispanic. By comparison, the differences between the racial/ethnic composition of the residential population and that of the elementary school population were greater and suggested the effects of school choice. In the context of the district's school choice options (detailed earlier), we found that the county had higher school segregation than residential segregation (see Table 3 below). In other words, families’ school choices were more segregative than their choices about where to live.
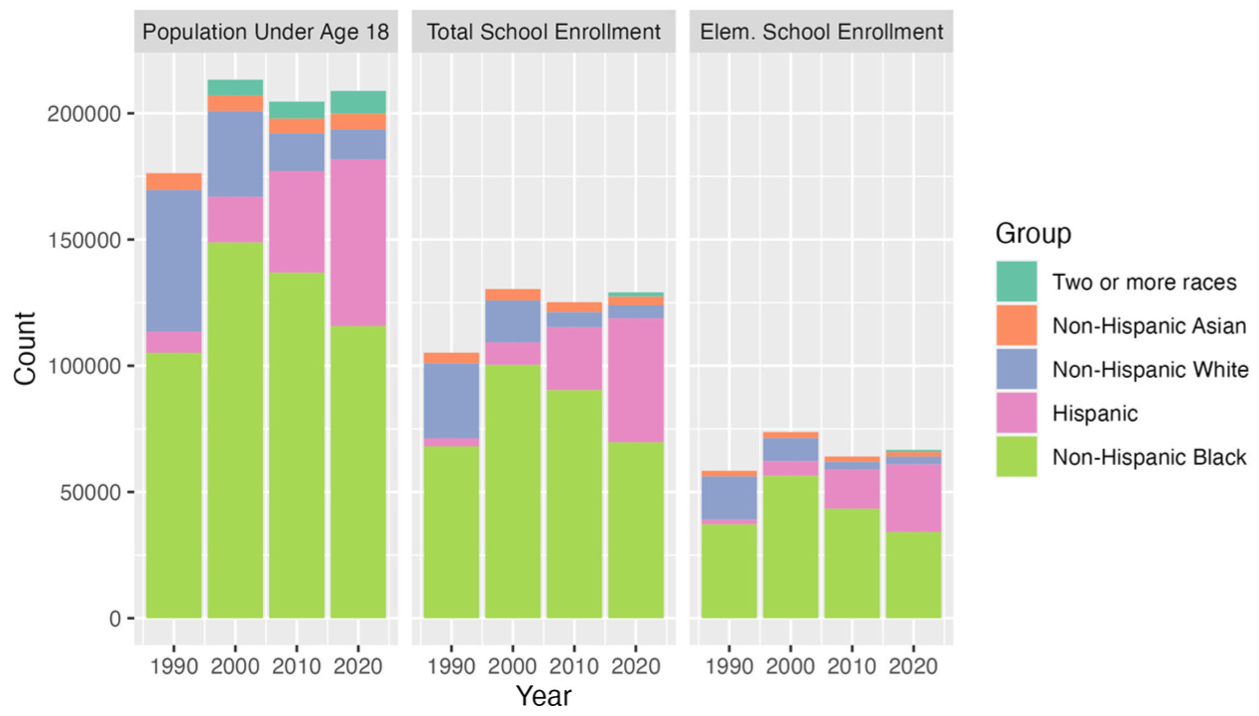
Prince George's County residential population and public school enrollment.
Given these trends, when we estimated the net effect of AZB change on residential segregation, we hypothesized that it would be weaker and less negative than the effect of AZB change on school segregation. Moreover, the relationship between AZB change and residential segregation remained theoretically meaningful given that AZBs were influential in residential decisions, particularly among households with children (Holme, 2002; Lareau & Goyette, 2014).
The 10-year intervals in our study were informed by the availability of LSABS and decennial census data. However, AZBs can be redrawn annually, and populations are ever changing. Although our measures captured the net impact of all AZB changes within a 10-year period, they obscured the impact of individual changes. It could be that one boundary change is slightly integrative, but a subsequent change in the same decade is highly segregative, leading to a segregative net change. The intervals we studied provide a foundational understanding of the outcomes of AZB changes since 1990, something that to date has been impossible due to a lack of boundary data. Future research can build on this work using additional years of boundary and population data to provide even more nuance.
Findings
Residential Populations and School Enrollments Over Time
We began by comparing the racial/ethnic composition of the residential population under age 18, the total public school enrollment, and the elementary school enrollment (schools whose highest grade served was grade 6 or lower). Prince George's child-aged residential population grew by >20% between 1990 and 2000, from ~176,000 to 213,000, but it has declined slightly since then. Although the county is still majority Black, its Black population has declined by >33,000 residents since 2000. The White population also has declined considerably—from 56,000 in 1990 to 12,000 in 2020, a continuation of the trend that began in the 1970s. Meanwhile, the Hispanic population has grown from just 8,400 to 66,000. The number of children under age 18 identified as multiracial also has grown, from ~6,300 in 2000 to >9,000 in 2020. 7 Some of the changes between 2010 and 2020—including the decline in the White population and the growth of the multiracial and Hispanic populations—may be attributable in part to changes the Census Bureau to the question design and coding of race/ethnicity data (Arias et al., 2025; Jones et al., 2021).
The demographic shifts in Prince George's are in some ways similar and in other ways distinct from trends in other places. The recent growth of the Hispanic population is similar to that of other suburbs, which have racially diversified in recent decades (Lewis-McCoy et al., 2023). However, in other suburbs, there also have been recent increases in Black and Asian populations. In Prince George's, though, the county was already majority Black following the large-scale migration of middle-class Black residents to the county in the 1970s, 1980s, and 1990s (Turner, 2020; Wilkins & Gibson, 2023). More recently, Prince George's Black population has actually declined, as has its White population. The large-scale loss of White families from Prince George's began in the 1970s, partly in response to school desegregation mandates. This mirrors the out-migration of White families from many urban centers in the 1970s and 1980s (Boustan, 2012), although, unlike in urban centers, the loss of White families from Prince George's left behind a growing middle-class Black population. More recently, the declines in White and Black families in Prince George's mirrors trends in other suburbs close to urban centers. As populations of color move to these inner-ring suburbs, long-time White residents leave for farther out, predominantly White exurbs (Fowler et al., 2016; Parisi et al., 2019). Given these trends, today's inner-ring suburbs, including Prince George's, are more economically and racially heterogeneous than those of the 1990s.
School enrollments mirror these overall trends but differ slightly. Total school enrollments are smaller than residential populations both because enrollment mostly captures children aged 5–17 years compared with residential populations aged 0–17 years and because some children are enrolled in private schools or independent charter schools rather than public schools. (For example, according to our analysis of NCES CCD data, charter school enrollment in Prince George's increased to 1,300 in 2009–10 and 6,257 in 2019–20, mostly comprising Black children.) In terms of proportions, in 1990, Black young people comprised a greater proportion of total enrollment and elementary enrollment (65%) than they did of the residential population (60%). As of 2020, Black residents and Black students each comprised 55% of their respective populations. The decline in the percentage point difference between Black residential and school populations could indicate more Black private school usage now. It also could be that the most affluent Black residents, those who formerly enrolled in private schools, are some of the Black residents who have left the county altogether. White youth have always been a slightly lower proportion of public school enrollment than residential population, which also suggests some private school usage and is similar to patterns elsewhere. As of 2020, Hispanic young people made up a larger portion of total enrollments than they did of residents (36.7 vs. 31.6%).
Finally, we found that the composition of elementary school enrollment was very similar to that of total school enrollment. Some slight differences included that elementary schools did not see the same slight uptick in population that total public school enrollments and residential populations saw between 2010 and 2020. This could indicate more use of private or charter schools among younger students or dwindling birth rates. Also, the Hispanic proportion was slightly larger in the elementary grades (38.5%) than in the total enrollment (36.7%) in 2020, suggesting that some of the growth in the Hispanic population was coming from younger-aged students. Demographic shifts among this age group provide early indicators of how neighborhood demographics and school populations may evolve; they suggest additional growth, particularly among the Hispanic population.
In terms of economic status, the percent of PGCPS students receiving FRL has increased over time, from 40% in 2000 to 53% in 2010 and 66% in 2020 (FRL data are not available for 1990). This tracks with Census data showing that the percentage of the under age 18 population living in poverty increased from 7% in 1990 to 10% in 2000, 11% in 2010, and 13% in 2020. Note that FRL eligibility is determined by 185% of the poverty line, so percentages of those receiving FRL are naturally higher than percentages of those living in poverty. However, higher-income residents are more likely to choose private schools, making public school enrollment here, as is typically the case elsewhere, less affluent than the total residential population.
Next, we mapped where changes occurred within the county population (Figure 2). Between 1990 and 2000, the Black population grew, especially in the southern and central parts of the county. In the 2000s, the Hispanic population grew substantially in the northern half of the county, whereas the White population noticeably declined in size. From 2010 to 2020, the Hispanic population continued to grow, especially within the Capital Beltway on the western side of the county bordering Washington, DC. This area contains some of the county's most affordable housing options. Meanwhile, Black and White populations continued to decline in the 2010s.
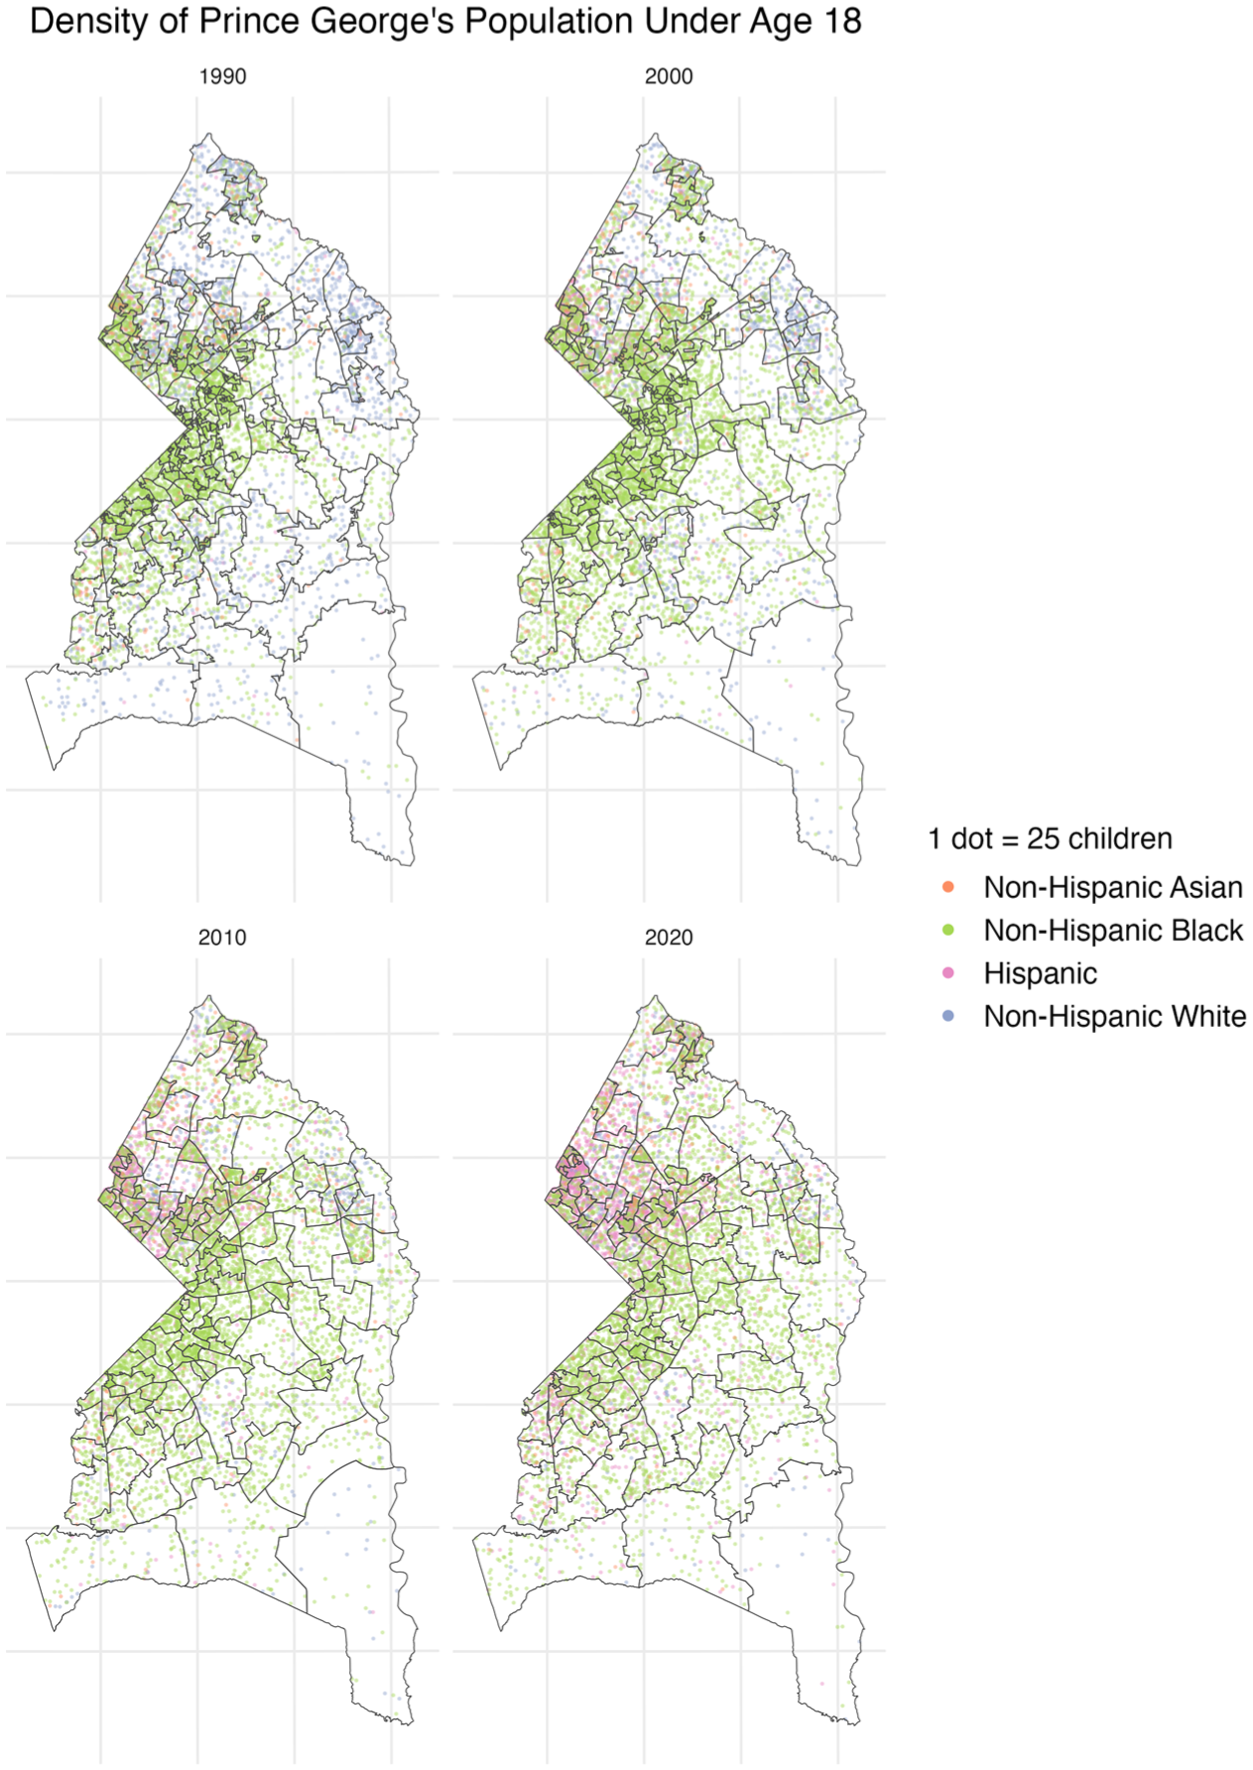
Residents under age 18 by race/ethnicity, overlaid on elementary attendance zone boundaries.
Across all decades, the maps also demonstrate segregation among racial/ethnic groups. The Black population is concentrated within and around the Beltway, whereas the White population is mostly located in the north and northeastern parts of the county. The Hispanic population is mostly located in the northwest and is growing within the Beltway.
According to Census data, the number of school-aged children living in households below the poverty line is highest within the Beltway (see Appendix Figure A1 in the online version of the journal for dot density maps based on economic status). Increasingly, populations in the very northernmost part of the county are also below the poverty line. These are places with growing Hispanic populations.
District documents frequently discuss the uneven nature of the county's population changes. Areas in the north of the county have mostly experienced growth over time, whereas areas in the south are mostly experiencing enrollment declines. However, enrollment trends are not linear over time; for example, some northern parts of the district were losing enrollment in the mid-2000s before their trends reversed (see Figure 3). In some instances, charter schools moved into district school buildings after they closed; by 2020, most of the county's nine elementary charter schools were located in the areas of the district with declining enrollment.

Prince George's County Public Schools’ percent changes in enrollment from 2005 to 2015, by Census area.
The overall population is also becoming more racially diverse as the Hispanic population increases and the Black and White populations decline. The county has slightly increasing rates of poverty; media accounts have noted that some of the county's most affluent residents, especially affluent Black residents, are moving out or not entering the county altogether (Potts, 2012; Shabi, 2023). These varied enrollment trends over space and time create a complex setting in which school leaders must adjust AZBs amid the end of the district's desegregation case.
Elementary School AZB Changes
Given this demographic context, we analyzed how elementary school AZBs changed over this time period. District leaders can redraw AZBs for any number of reasons, including school closures and new school construction; as described earlier, while under court order, such changes had to be approved by the court. In PGCPS, we saw several specific reasons for boundary change. We first calculated the overall percentage of the district's school-aged children affected by any kind of elementary AZB change in each decade, and then we calculated the percentage affected by each specific kind of change. Note that the percentage of affected children is based on residential Census populations and thus captures residents who do not attend their zoned public school.
In the 1990s, >19% of the county's population under age 18 lived in an area affected by elementary school AZB change (Table 1). Most of these children either were affected by rezoning among existing schools or were rezoned to a newly built school. Hispanic children experienced the highest rates of rezoning, especially to newly built schools, as the Hispanic population began to grow. Three elementary schools also were closed in this decade.
Extent and Types of Boundary Changes

Source. Authors’ calculations based on Longitudinal School Attendance Boundary Survey shapefiles, decennial Census population counts, and National Center for Education Statistics Common Core of Data school listings.
AZB changes made during this decade would have taken place under the district's desegregation plan. The 1985 MOU directed the district to continue its busing plan for desegregation purposes, which included a complex map of noncontiguous AZBs, or zones that drew from at least two geographically separate areas. A history of the court case indicates that between 1985 and the late 1990s, PGCPS “made only minor changes within the guidelines to adjust for school openings and closings and has not gone back to the Court to get approval for an overhaul of the plan” (Vaughns v. Board of Education, Prince George’s, 1998, p. 587). An expert panel commissioned by the Court wrote that the busing plan had a “small positive effect” on the diversity of schools but was “unable to sustain” improvements toward desegregation because of “the increasing percentage of African American students in the system” (Vaughns v. Board of Education, Prince George’s, 1998, p. 585).
The 1985 MOU also directed PGCPS to “perform a new study of busing and make recommendations to the plaintiffs and the Court about the ways of eliminating unnecessary busing and reducing busing time and distance for African American students” (Vaughns v. Board of Education, Prince George’s, 1998, p. 583). Our analysis showed that the number of noncontiguous elementary attendance zones decreased from 66 in 1990 to 53 in 2000, 6 in 2010, and 4 in 2020. The decrease in the 1990s suggests that AZB changes made in that decade began the transition back to neighborhood schools even before the desegregation order had been lifted.
Between 2000 and 2010, almost 40% of children living in the district were affected by an elementary school AZB change. Nearly half of those children were rezoned among existing schools. More than one third of the children affected by rezoning were rezoned to a newly built school. In fact, PGCPS opened 18 new elementary schools in that decade, each requiring that a new attendance zone be drawn. At the same time, the district closed 12 elementary schools and an additional three school buildings were reconfigured such that they no longer served as zoned elementary schools, which we also considered closures for elementary school children. 8 In total, these changes resulted in the deletion of 15 elementary attendance zones. Compared with other groups, Black children in particular were disproportionately affected by these school closures: 4% of Black children were rezoned following closure compared with <1% of Asian, White, and Hispanic children (see Table 1). The disproportionate closure of majority-Black schools has been previously documented in Prince George's dating back to the 1960s (Dougherty, 2020), and it was common in many other districts around the United States as well (Tilsley, 2017).
Many of the AZB changes that took place in the PGCPS in the 2000s resulted from the end of the district's desegregation plan. The 1998 MOU laid out a 6-year plan to phase out busing and return students to neighborhood schools; elementary AZB changes were one of the final pieces of that plan, taking effect in 2003 and 2004 (Honawar, 2002a). The MOU also called for the construction of 13 new schools (across all grade levels) to accommodate children in their neighborhoods (Honawar, 2002a). The fact that Black and Hispanic children were so disproportionately rezoned during this decade compared with White and Asian children emphasizes that the former busing plan disproportionately bused racially marginalized children out of their neighborhoods (see Eaton, 1996) and that the return to neighborhood schools also then affected many of those students. These factors also may have dampened political support for continued desegregation.
Some areas were flagged as being both affected by both school closure and reassigned to a newly built school. These are cases of school building replacement, 9 which is somewhat common in PGCPS. In fact, the district's 1998 MOU required PGCPS to replace schools whose facilities were deemed inadequate (Prince George's County Public Schools, 2006). Since then, additional capital improvement programs have identified schools with “very poor” facilities and allocated funds to build new replacements (see, e.g., Prince George's County Public Schools, 2008a). Our calculations showed that in the 2000s, 5% of children, or ~14% of the children living in areas flagged as “rezoned,” were affected by a school replacement rather than by a true redrawing of AZBs.
Additional, smaller AZB changes took place in the mid-2000s before another comprehensive set of changes took effect in 2009, mostly consisting of school closures and grade reconfigurations (Tinsley, 2009). The district described the 2009 changes as an effort to maximize school capacities, increase the number of students attending schools in their neighborhoods, and provide greater access to choice programs in underserved parts of the district (Prince George's County Public Schools, 2008a). For example, Benjamin D. Foulois Elementary School, located in a less affluent neighborhood within the Beltway, was converted to a nonzoned middle school with a creative and performing arts program (Prince George's County Public Schools, 2009b). Students living in its former attendance zone were reassigned to one of two other nearby elementary schools.
The extent of AZB change was much less in the 2010s than in the 2000s, with only ~15% of the district's school-aged residents affected by rezoning. Two new elementary schools opened and four schools closed. Five additional elementary schools were converted into districtwide, nonzoned schools (e.g., two were converted into whole-school Talented and Gifted [TAG] schools), which are also treated in Table 1 as school closures. Overall, roughly 10% of those rezoned were affected by a school closure.
The conversion of zoned elementary schools into TAG schools, alongside subsequent reassignment of students, was controversial. Students and families expressed sadness at having to be rezoned away from their school, as they often do when facing more traditional instances of school closure. “Please don't kick me out of my school,” one fifth grader said in front of the school board, which ended up converting her elementary to a TAG school and rezoning her and 65 classmates to a school 2 miles away (Brownback, 2012). Board documents note that the decision was made because the district had identified more TAG students than it had space to educate and because nearby elementary schools were underutilized, meaning that there was space for students to be rezoned to them (Prince George's County Public Schools, 2012).
Figure 4 shows the locations of various AZB changes throughout the district. Note that the shaded areas right along the edges of AZBs (especially visible in the 2010–20 map) could be the result of increased accuracy in overall mapping infrastructure over time and/or small amounts of error introduced in the digitizing of maps from disparate sources with different projections and underlying data. This also may mean that the percentages displayed in Table 1 are overestimates. It is a limitation of our AZB data that we cannot know for certain whether changes over time were minute but intentional or resulted from imprecise boundary maps (Asson et al., 2023b). However, school board documents do describe “minor boundary changes” that moved as few as five students at a time (Prince George's County Public Schools, 2011), and sometimes listed individual apartment complexes to be rezoned (Prince George's County Public Schools, 2017), suggesting that some of the miniscule boundary changes depicted on the following maps do in fact represent true changes.

Locations and types of elementary school attendance zone boundary change.
Although rezoning occurred across large swaths of the PGCPS in all three decades, there are a few distinct patterns of note. New schools were built in the north/northeast parts of the district in the 1990s (Figure 4), where the Black population was continuing to grow at the time (see Figure 2). In the 2000s, many of the newly built schools were located in the northwest, where the Hispanic population was growing. Most of the school closures took place within the Capital Beltway, where the Black population was shrinking, where there were higher poverty rates, and where facilities were more likely to be identified as in poor condition. An example of school replacement can be seen in the southwestern corner of the district: Henry G. Ferguson Elementary School was closed (along with its feeder middle school, Eugene Burroughs), and both were replaced by the newly built K–8 Accokeek Academy.
Overall, boundary changes were frequent, and their rationales varied. School board policy stated, “School attendance areas shall be reviewed annually” (Prince George's County Public Schools, 2010, p. 1), and there were in fact board documents describing boundary changes in most years after about 2002. The district implemented a complex combination of rezoning among existing schools, school construction, school closures, reconfiguration for special districtwide programs, and grade reconfigurations (Prince George's County Public Schools, 2009a). Much of this was linked to the county's uneven patterns of growth; some schools were dramatically underutilized, whereas others were oversubscribed. Maryland state rules also limit a school district's ability to request funds for school expansions or new school construction when the district has underutilization in other areas (Prince George's County Public Schools, 2016). The district therefore was incentivized to close and consolidate underutilized schools in some parts of the district and then request funds to build new schools to address overcrowding in other parts of the district. The only other conceivable alternative was to bus students from overcrowded schools to undercrowded ones across the district; this has not been pursued and likely would not be popular in a district that largely pushed to end busing plans for desegregation and wanted to focus instead on creating quality neighborhood schools (Pierre & Sanchez, 1998).
AZB Changes and Segregation
Our third and final research question concerned the intersection of population changes, patterns of segregation, and AZB changes. We asked, To what extent do elementary AZB changes, including those caused by school openings or closures, contribute to changes in racial segregation over time?
We began by calculating multiracial segregation in each decade (see Table 2). While M values are necessary for our decomposition calculations, they are unstandardized measures that can be difficult to interpret. Thus, we also provided corresponding values of Theil's H, the standardized version of M, in Table 2. Theil's H is equal to M divided by an area's total unscaled entropy, and its values can vary from 0 to 1. Values of H >0.10 are considered moderate segregation, and values >0.25 are high (Reardon & Yun, 2003). A change in H of ≥0.05 over the course of a decade “represents a significant change in segregation levels” (Reardon & Yun, 2003; p. 1570). Because they are standardized, neighborhood and school H values are directly comparable.
Multiracial Segregation, as Measured by the Mutual Information Index M and the Information Theory Index H
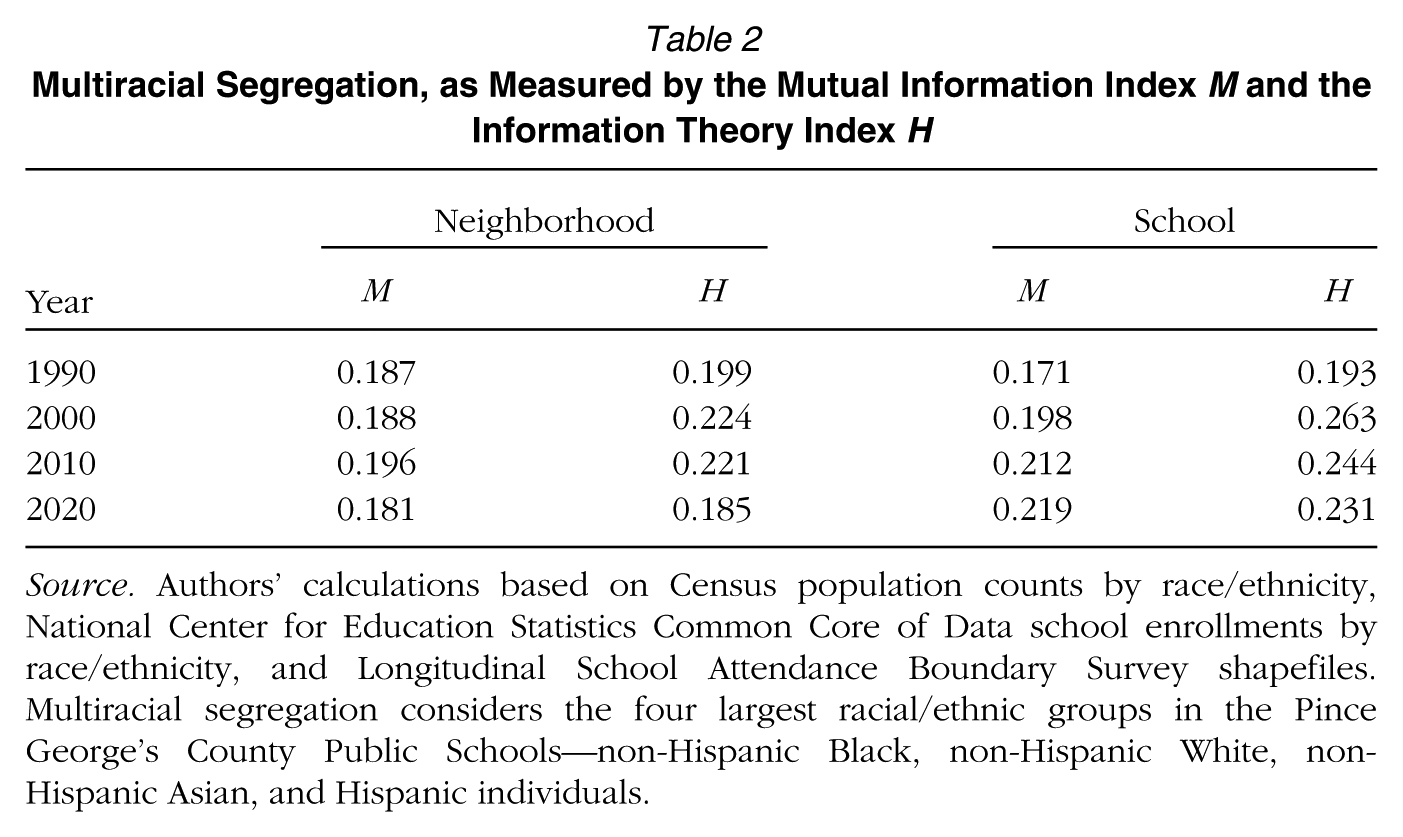
Source. Authors’ calculations based on Census population counts by race/ethnicity, National Center for Education Statistics Common Core of Data school enrollments by race/ethnicity, and Longitudinal School Attendance Boundary Survey shapefiles. Multiracial segregation considers the four largest racial/ethnic groups in the Pince George's County Public Schools—non-Hispanic Black, non-Hispanic White, non-Hispanic Asian, and Hispanic individuals.
Multiracial neighborhood segregation in the PGCPS, as measured among AZB units, was consistently moderate to high. After two decades of slight increases between 1990 and 2010, it decreased between 2010 and 2020. Multiracial school segregation increased significantly between 1990 and 2000. Although it has decreased slightly since then, school segregation levels remain near the threshold to be considered high. School segregation was consistently higher than neighborhood segregation, especially in the most recent decade, suggesting that families’ decisions about where to send their children to school were more segregative than their decisions about where to live. 10
Next, we analyzed the factors that contributed to changes in neighborhood and school racial segregation in each decade. On their own, each of these factors contributed to small changes in M, or changes that would not be considered significant, but the relative direction of their impact on M is informative. Figure 5 suggests a complex interaction among demographic change, boundary changes, and school openings and closures. First, the county saw a significant increase in the Hispanic population during this time period that initially reduced overall segregation (1990–2000) but ultimately increased segregation as this population entered the county in a highly concentrated way. Shifting locations for the populations within the county—or the sorting of populations among AZBs—followed a similar pattern but lagged by 10 years. School openings, which may respond to population increases, increased segregation in all time periods. This is suggestive of race-evasive policies that would have opened schools in areas of fast population growth—which at this time were places with growing concentrations of Hispanic students—rather than assigning Hispanic students across many existing schools. Given what we know about demographic change in the county, this would have increased the segregative impact of the fast-growing Hispanic population without doing anything to remediate the existing Black/White segregation of earlier decades. School closures from 2000 to 2010 also increased school segregation and disproportionately affected Black students.

Factors contributing to changes in school and neighborhood racial segregation (M).
We observed a major change in the direction of the structural or unexplained component of segregation between the first and third analysis periods from strongly positive to strongly negative. Notably, this shift coincided with the end of the busing program in 2002 and the return to neighborhood schools. We can see, as expected, that neighborhood changes lagged school changes as people made housing choices based on observed conditions in schools.
Finally, we further analyzed changes in neighborhood segregation in each decade to assess the overall contribution of AZB changes. We found that AZB changes that took place in the 1990s and 2000s were racially segregative overall (Table 3). As measured by H, neighborhood segregation increased by 0.025 in the 1990s (see Table 2), which is about half of what Reardon and Yun (2003) would consider a significant change. The piece of that total change that can be traced to AZBs—calculated using the decomposable properties of M—is relatively small at 0.012 (see Table 3). However, it is still meaningful: If boundaries had remained constant, racial neighborhood segregation within the county would have actually decreased. Instead, the elementary AZB changes that took place led to a slight increase in segregation.
Contribution of Attendance Zone Boundary (AZB) Changes to Changes in Neighborhood Multiracial Segregation (M) by Decade

The same was true to an even greater extent between 2000 and 2010, when the district formally ended its desegregation plan. In that decade, neighborhood H remained basically constant (see Table 2). And yet, AZBs contributed to an even larger net increase in segregation than they did in the prior decade (ΔM = 0.022). The effect of AZBs on segregation change was simply offset by other factors, such as population composition changes. School openings were especially segregative during this period, contributing net increases to segregation. Structural segregation also increased. In contrast with the prior period, school closures had a desegregative effect, as did the overall racial composition changes (growing numbers of Hispanics residents) and the ways in which populations moved across AZBs. But had the boundaries not changed at all, overall segregation change actually would have been negative, and population shifts would have contributed to larger decreases in segregation. The trends during the 1990s and 2000s align with the return to neighborhood zones, especially after unitary status.
In the 2010s, racial segregation saw net decreases. Boundary changes, which were fewer during this decade, contributed very slightly to those decreases. The creation of new AZBs for new schools contributed to slight increases in segregation. Changes in the county's population composition also contributed to net increases in segregation, but those net increases would have been larger in magnitude had AZBs remained constant.
Overall, these findings align with a start of a return to neighborhood school zones in the 1990s and even more so in the 2000s. The lack of any effect of AZB changes on total contribution to racial segregation in the 2010s is similar to findings in other contexts.
Discussion
Our findings demonstrate relatively high levels of racial segregation among Prince George's County elementary schools. In the context of stark demographic changes over the past 30 years, elementary school AZB changes have been frequent and widespread. In general, AZB changes contributed to increases in racial segregation in the 1990s and 2000s, immediately preceding and then following the end of the district's desegregation order. This finding demonstrates that the return to neighborhood schools was associated with increases in racial segregation. This case helps to illuminate the ways in which segregation is rising, giving an in-depth look at a larger trend of post–unitary status segregation increases (Reardon et al., 2012; Reardon & Owens, 2024). School openings were consistently segregative in terms of race, especially in the 2000s as the county began to see substantial growth in its Hispanic population and more limited growth in its low-income population. This finding in particular suggests that the need to put new students in schools in PGCPS conflicted with desegregation. These goals are often pitted as zero sum, although they do not have to inherently conflict; previous research has shown how AZB changes can both contribute to desegregation and accomplish other goals, such as reducing students’ travel times to school or minimizing the number of children affected by rezoning (Gillani et al., 2023; WXY Architecture + Urban Design, 2021). Between 2010 and 2020, AZB changes in the PGCPS did not contribute to net segregation changes, although they also have not been a strategy for desegregation. Overall, our findings demonstrate the continued importance of AZBs in shaping patterns of segregation, even in a majority-Black space.
Indeed, perhaps one of the surprising findings of this case is the relative similarity to rezoning processes and outcomes in other post-unitary or suburban districts. The racial and economic composition of schools is not often discussed in PGCPS rezoning processes. District documents suggest that the race-neutrality other researchers have documented in majority-White spaces (McDermott et al., 2015) is also common in PGCPS. In fact, our findings here suggested greater avoidance of naming diversity—economic or especially racial—as a goal in Prince George's County than in some other nearby DC suburbs we have analyzed. In Montgomery County, Fairfax County, and Howard County, we have similarly found that AZB changes have not yet been used effectively as a force for desegregation, but our contextual findings demonstrate slightly more discussion of race and economic composition among school leaders and community stakeholders (Asson et al., 2023a, 2023b; Taseen et al., 2021). For example, Montgomery and Howard counties have both explicitly considered rezoning options that would reduce economic isolation in schools, although resistance from affluent, White populations has prevented full implementation of more desegregative AZBs.
It may be that economic or racial school diversity does not have the same public perception in PGCPS that it does in other suburban areas because of the district's overall demographics. Although DC's near-in suburban districts are all becoming more racially and economically diverse, Montgomery, Fairfax, and Howard counties each have been majority-White suburbs in the most recent decades, whereas Prince George's County most recently has been majority Black. The overall demographics of PGCPS and a White-centered conception of diversity may give the perception that the schools are already diverse and that stakeholders do not need to discuss or have much experience collectively considering policy effects related to race/ethnicity. Recent research of school rezoning processes in Virginia has demonstrated some of those White-centered definitions of diversity; many stakeholders there argued that segregated White schools with few students of color were “already diverse” (Castro et al., 2022, p. 13). But PGCPS schools remain segregated, and avoiding explicit discussions of race or economic status still implicitly considers those variables, although in ways that maintain patterns of segregation (Castro et al., 2022).
The economic diversity of PGCPS, especially of its Black population, may help explain why we saw segregative AZB changes. Previous research found that the economic diversity of the Black population in PGCPS prevents their political alignment (e.g., Johnson, 2002). Other studies have found that some affluent Black residents attempted to distance themselves from lower-middle-class Black neighbors (Lacy, 2007), and some Black residents expressed prejudice against the growing Hispanic population (Simms, 2019). Further, the district has long been regarded as having low-quality schools (Lacy, 2007), and affluent residents of all races may be enrolling in private schools or leaving the district altogether, particularly if they did not get seats in desirable magnet schools. These dynamics threaten the potential for desegregated public schools in the county.
Our study of AZB change within the unique demographic context of Prince George's County showed that race-evasive, segregative trends are playing out here as they are in other suburban contexts. Our analysis adds to a growing literature on how diversifying suburban school districts respond to changing student populations (see Ayscue, 2016; Diamond et al., 2021; Frankenberg & Kotok, 2013; Frankenberg et al., 2023; Holme et al., 2014). It advances our understanding of how AZBs affect racial segregation within school districts. If AZBs serve to isolate Hispanic and/or lower-income Black students in specific schools, these students may not have access to the same quality of teachers, extracurricular activities, or other opportunities as their peers. Many of the harms of racial segregation come from the ways in which it concentrates racially minoritized students in high-poverty schools with fewer resources (Reardon et al., 2019).
Although rezoning is a tool that PGCPS and other districts could use to create more racially diverse schools, there are limits to its potential. For one, the desegregative potential of AZB changes is informed by the overall diversity of the district. Second, actors in noneducational sectors, such as county councils and land developers, can take actions that influence and complicate school rezoning needs (Bierbaum & Sunderman, 2021). For example, they determine where new housing developments are built, and they shape the residential zoning policies that influence the affordability of those homes. Finally, the ability to use school rezoning as a desegregative tool relies on the political will of district leaders and local families. In many places, political pressures lead school boards to avoid naming desegregation as a goal of rezoning or to abandon it in the face of public resistance (Castro et al., 2023). In the current political and legal climate, though, there remain few other tools and incentives for integration, and all have their own limitations. For example, voluntary choice-based integration programs such as magnet schools and transfer policies exist in some places but can suffer from lack of buy-in (Taylor et al., 2019). Despite the limitations of rezoning, it remains a viable tool districts should consider (Castro et al., 2023; Gillani et al., 2023).
The need to integrate schools remains more important now than ever. Federal actions to limit diversity, equity, and inclusion in education and to push privatization threaten us all. Despite the current administration's claims, it remains legal for school boards to pursue racial integration through rezoning and to consider the racial demographics of neighborhoods when making these decisions. In fact, in the current climate, school boards around the country have great potential to positively impact their local communities (Sampson, 2024).
Supplemental Material
sj-pdf-1-aer-10.3102_00028312261440310 – Supplemental material for School Attendance Zone Boundary Changes and Segregation in a Suburban Black Enclave
Supplemental material, sj-pdf-1-aer-10.3102_00028312261440310 for School Attendance Zone Boundary Changes and Segregation in a Suburban Black Enclave by Sarah Asson, Erica Frankenberg, Ruth Krebs Buck and Christopher S. Fowler in American Educational Research Journal
Footnotes
Acknowledgements
Thanks to Michael Cattell, Jr., for his help.

Funding
The authors disclosed receipt of the following financial support for the research, authorship, and/or publication of this article: This material is based on work supported by the National Science Foundation under Grant No. 1918277 and Pennsylvania State University.
Declaration of Conflicting Interests
The authors declared no potential conflicts of interest with respect to the research, authorship, and/or publication of this article.
Notes
S
E
R
C
References
Supplementary Material
Please find the following supplemental material available below.
For Open Access articles published under a Creative Commons License, all supplemental material carries the same license as the article it is associated with.
For non-Open Access articles published, all supplemental material carries a non-exclusive license, and permission requests for re-use of supplemental material or any part of supplemental material shall be sent directly to the copyright owner as specified in the copyright notice associated with the article.
