
Abstract
Despite its substantive importance as the strongest predictor of racial achievement gaps, racial economic segregation has been understudied in the previous literature on segregation. This paper describes trends in racial economic segregation over the last three decades and decomposes these trends into different geographic scales (e.g., between-state, between-district, and within-district segregation). Racial economic segregation has decreased since the late 1990s, yet Black students are still considerably isolated in schools with higher poverty rates. Between-district segregation has been the largest component of racial economic segregation, whereas within-district segregation has grown steadily during the last three decades. Findings from this study suggest the imperativeness of interdistrict policy remedies while also highlighting intradistrict policy needs for promoting student diversity across schools in the district.
Keywords
The era of court-ordered school desegregation did not last longer than a few decades after the Brown v. Board of Education decision, with many school districts released from court oversight in the 1990s (Reardon et al., 2012). Research on racial school segregation has reported mixed evidence on the resegregation of schools by race (Logan et al., 2017; Reardon & Owens, 2014; Richards et al., 2020; Stroub & Richards, 2013). In contrast, studies on economic school segregation have documented clearer evidence of growing segregation by income between school districts. (Owens et al., 2016, 2022; Reardon & Bischoff, 2013).
These studies use various measures of racial or economic segregation to describe the separation of students by race or class. However, they have a crucial limitation in conceptualizing school segregation in the United States by overlooking the intersection of race and poverty. Due to the historical protection of white privilege as property (Capper, 2015; Ladson-Billings & Tate, 1995), children of color have become isolated in higher-poverty schools with limited access to quality teachers compared with their white peers (Goldhaber et al., 2015; Simon & Johnson, 2015). As reported by several researchers and media sources, these schools do not have sufficient financial and social support for teachers, which impacts teacher retention and school climate (Kelleher, 2015; Mason-Williams et al., 2023; NowThis, 2019). Moreover, the separation of students by race and class hinders intergroup contact across students from diverse backgrounds, which is important for delivering democratic values (Williams & Graham, 2019). Consequently, racial economic segregation may negatively impact educational equity and civic preparation within U.S. society.
This paper focuses on the isolation of racially minoritized students in high-poverty schools, hereafter referred to as racial economic segregation. Understanding how racial economic segregation has changed in recent decades is timely and essential for several reasons. First, recent studies show that racial economic segregation significantly impacts racial achievement gaps, even more so than racial segregation (Reardon, 2016; Reardon et al., 2022). Second, demographic shifts in the 2000s may have influenced racial/ethnic disparities in exposure to school poverty. Child poverty rates increased, with steeper rises among Black and Hispanic children 1 compared with white children (Nolan et al., 2017). During the same period, Black and Hispanic families moved into slightly higher-income neighborhoods (Reardon et al., 2015). Third, the rise in school choice options has weakened the link between neighborhood residence and school attendance (Rich et al., 2021). It remains unclear how all these dynamics have affected the sorting of Black and Hispanic students into high-poverty schools.
Only a few prior works document recent trends in racial economic segregation (Fahle et al., 2020; Orfield & Jarvie, 2020; Orfield et al., 2016). They compute the difference in school poverty rates between schools serving racially minoritized students and those that do not using student enrollment data in the Common Core of Data (CCD) provided by the U.S. Department of Education. This approach advances studies on racial or economic segregation by considering the joint distribution of race and poverty, not the marginal distribution of one or the other. I therefore generally follow this approach, using the share of free lunch–eligible (FLE) students as the school poverty rate. While free lunch eligibility may not be a perfect measure of students’ socioeconomic status, it effectively captures educational disadvantage attributable to poverty (Domina et al., 2018).
However, this approach still has methodologic concerns, as evidenced by the inconsistency in findings despite using the same underlying data. For instance, the Civil Rights Project (Orfield & Jarvie, 2020; Orfield et al., 2016) reports an increase in Black-white and Hispanic-white racial economic segregation in the early 2000s, whereas Fahle et al. (2020) find a gradual but steady decrease during the same period. This discrepancy may arise from their different approaches to addressing missing and implausible nonmissing values in FLE enrollment in the CCD. The Civil Rights Project uses the original CCD as is, whereas Fahle and colleagues impute missing data without scrutinizing anomalous patterns in the CCD. To address this gap, I use the Longitudinal Imputed School Dataset (LISD; Reardon et al., 2024b), which imputes missing and nonmissing implausible FLE enrollment data in the CCD. I compare how different methods of handling low-quality CCD observations can affect the computation of racial economic segregation trends.
Moreover, these prior studies do not inform trends in racial economic segregation across districts, metropolitan areas, and states. Segregation at different geographic levels is influenced by distinct factors and contexts (Owens et al., 2016), which notably have changed over the past quarter century. School segregation within districts, primarily determined by school attendance zoning (Monarrez, 2023), may have been affected by the expansion of school choice options since the 1990s (Candipan, 2020). Between-district segregation is shaped by school district fragmentation (Bischoff, 2008), which may have increased due to recent school district secessions (EdBuild, 2019; Houck & Murray, 2019; Richards, 2020). Segregation between states may have been influenced by macro-level demographic changes, such as the Hispanic dispersion into “new destinations” since the 1990s (Flippen & Farrell-Bryan, 2021). Therefore, describing trends in racial economic school segregation within and between districts, or between states, can provide insights into the impact of recent policy and demographic changes as well as the potential of inter- and intradistrict policies to address racial economic segregation.
Considering these knowledge gaps, this study aims to address the following questions:
1. How has racial economic segregation across U.S. public schools changed between 1991 and 2022? a. How do substantive conclusions about these trends vary across the present and prior studies based on their treatment of missing and implausible nonmissing values in the original CCD?
2. To what extent can national trends in racial economic segregation be attributed to between- and within-district segregation? a. What proportion of between-district segregation is due to segregation between and within states? b. How do trends in between- and within-district segregation differ between metropolitan and rural areas?
The remainder of the paper is organized as follows: First, I review previous research on school segregation trends and prior studies on recent policy and demographic changes that may have influenced racial economic segregation. Second, using the LISD, I describe national trends in racial economic segregation among U.S. public schools from 1991 to 2022. I compare these trends with the results from the Civil Rights Report and Fahle et al. (2020) to illustrate how different approaches to handling low-quality data in the CCD can lead to discrepancies across the present and previous studies. Additionally, I decompose the national trends in racial economic segregation as a sum of segregation between and within various geographic units (e.g., between and within districts). Lastly, I discuss implications for researchers and policymakers based on my findings highlighting the persistent importance of between-district segregation and the growth of within-district segregation.
Literature Review
Trends in Racial, Economic, and Racial Economic School Segregation
Previous studies on trends in racial school segregation generally document sharp decreases in Black-white segregation during the court-mandated desegregation era, beginning in the late 1960s and extending through the 1970s, and stalled progress or slight increase in Black-white and Hispanic-white segregation since the 1980s. However, findings from the post-desegregation era are inconsistent depending on the choice of segregation measure (Reardon & Owens, 2014). Black and Hispanic students’ exposure to white students gradually decreased during the 1990s and 2000s (Fiel, 2013; Logan & Burdick-Will, 2017; Orfield & Lee, 2005), whereas Black-white and Hispanic-white differences in exposure to white students remained stable over time (Stroub & Richards, 2013). Reardon and Owens (2014) explain that this is partly due to the decrease in the share of white students among school-age children over time, which inherently yields lower exposure to white students for students of all races (including whites).
In contrast, economic segregation among schools modestly increased during the last few decades. Owens et al. (2016) found that income segregation rose from 1990 to 2010 between schools in the same district (i.e., within-district segregation) and between districts in the same metropolitan area (i.e., between-district segregation). The growth of between-district segregation is driven by upper-middle-class families segregating from lower-class families rather than low-income families segregating from the rest of the population. And the rise in between-school income segregation is pronounced among large school districts. Although their findings focus on larger school districts in metropolitan areas, other researchers document similar trends observed across all U.S. elementary schools (Marcotte & Dalane, 2019).
However, understanding segregation by race separately from segregation by class may not provide the most accurate description of the separate and unequal education observed in U.S. society. Historically, people of color have been denied residential opportunities in white neighborhoods due to collaborative efforts between governments and the housing market, which still constrains their housing choices across the nation today (Christensen et al., 2022; Rothstein, 2017). Racial discrimination in the housing market has contributed to the establishment of schools exclusive to white students because the vast majority of students attend residentially zoned schools (Rich et al., 2021). Consequently, school segregation not only separates students by race/ethnicity but also concentrates poverty into schools attended by students of color. Racial economic segregation aims to directly address this intersection of race and poverty in school segregation by defining segregation as racial differences in exposure to school poverty (often referred to as double segregation; see Orfield & Jarvie, 2020).
Only a few recent papers have focused on racial economic segregation in public schools. Despite using the same data source (i.e., the CCD), findings from these studies are somewhat contradictory. Fahle et al. (2020) reported a decrease in both Black-white and Hispanic-white differences in exposure to school poverty from the late 1990s through the mid-2000s. In contrast, the Civil Rights Project (Orfield & Jarvie, 2020; Orfield et al., 2016) documented an increase in the Black-white differences during the same period. It also noted that the Hispanic-white differences increased in the early 2000s after a decline throughout the 1990s.
One possible explanation for this disagreement can be their choice of student poverty measure. Fahle et al. (2020) used free and reduced-price lunch eligibility (FRPL), whereas the Civil Rights Project used FLE. The CCD FRPL enrollment data include students whose household income is at or below 185% of the federal poverty line and have been available since 1998. By contrast, FLE enrollment data have a lower threshold at 130% percent of the federal poverty line and have been available for most public schools since 1991.
More important, the two studies differed in their approaches to addressing data quality issues in FLE/FRPL enrollment data in the CCD. These data not only have missing values but also include implausible nonmissing values that can cause anomalous patterns in year-to-year FLE/FRPL enrollment trends. Moreover, since the mid-2010s, a potential challenge in data quality has arisen due to the nationwide implementation of the Community Eligibility Provision (CEP) in 2014, which allowed schools to provide free meals for all students if 40% or more of their students were enrolled in federal welfare programs such as the Supplementary Nutrition Assistance Program. Although the CEP improved food access for a greater number of students, it may lead to overreporting FLE counts in the CCD because CEP-eligible schools might report all students as eligible for free lunch (Long & Renbarger, 2023).
Although the Civil Rights Report does not discuss any of these issues, Fahle et al. (2020) used multiple imputation to impute missing data and three types of implausible nonmissing data. These implausible data include (a) zero values in FRPL counts, (b) districts and metropolitan areas that show outlying trends in FRPL percentage compared with other units, and (c) school-by-year observations that are affected by the CEP. Although these steps can partially address anomalous values in FRPL enrollment data, their approach may not be ideal because it lacks a rigorous investigation of anomalous cases in the original CCD. This can pose a potential concern because the selection of data used in imputation models directly impacts the imputation results (Huang et al., 2018; Templ, 2023).
Demographic and Policy Contexts Shaping the Landscape of Racial Economic Segregation
School segregation at different geographic scales is driven by distinct factors. At the largest scale, state-to-state migration patterns, which are less malleable to policy interventions, may influence school segregation between states. For instance, since the 1990s, the Hispanic population has spread to states in the Midwest and the Southeast, outside traditional gateway states in the Southwest (Griffith, 2008; Passel et al., 2022). Although traditional gateway communities are often urban and economically disadvantaged, new Hispanic destinations are more suburbanized with lower poverty levels (Flippen & Farrell-Bryan, 2021; Ludwig-Dehm & Iceland, 2017). These new destinations also include rural areas that witnessed an influx of Hispanic immigrants in response to job growth in agriculture and food processing (Johnson & Lichter, 2016). Indeed, Hispanic migration has boosted the local economy and population growth in many rural communities that otherwise might have experienced a decline (Carr et al., 2012; Coates & Gindling, 2013; Lichter & Johnson, 2020). A recent study shows that Hispanic children are less exposed to neighborhood poverty in rural new destinations compared with rural established destinations (Lichter & Johnson, 2021). Therefore, the dispersion of Hispanics into new destinations may have reduced Hispanic students’ exposure to poverty in schools across the states.
At smaller scales of geography, such as between and within districts, segregation is largely influenced by housing and educational policies such as zoning regulation, district fragmentation, and school choice (Ritter et al., 2016; Saporito & Van Riper, 2016; Taylor et al., 2019). Currently, the layout of district boundaries—district fragmentation—is the primary condition determining school segregation between districts (Ayscue & Orfield, 2016). Although district fragmentation is most salient in the Northeast and Midwest (Bischoff, 2008), a series of school district secessions in and out of the South during the 2000s and 2010s may have contributed to shaping between-district school segregation across the nation (Houck & Murray, 2019; Richards, 2020). It should be noted that addressing between-district school segregation may be particularly challenging because district governments lack discretion in implementing cross-district policies beyond their district boundaries (Holme & Finnigan, 2013).
In addition, within district boundaries, students attend different schools based on available options. School options beyond neighborhood schools, such as charter schools, magnet schools, and district-wide open enrollment, have increased since the 2000s (Council of Economic Advisers, 2020). The growth of school choice is concentrated in urban and suburban districts (Polikoff & Hardaway, 2017; Sheridan-McIver & Wolfe, 2023), which together comprise metropolitan areas (Lichter et al., 2023). The wider availability of school choice options loosens the link between neighborhood location and school assignment, which can contribute to increasing racial and socioeconomic segregation within districts (Marcotte & Dalane, 2019; Monarrez et al., 2022; Rich et al., 2021). Moreover, magnet schools and open enrollment provide opportunities for white and wealthier families to choose schools with fewer nonwhite or economically disadvantaged students (Bischoff & Tach, 2018; Candipan, 2020).
Data
I use LISD 1.0, provided by the Segregation Explorer from the school years of 1991–1992 through 2022–2023, which imputes missing and implausible values in the CCD (Reardon et al., 2024b). As a national database provided by the National Center for Educational Statistics (NCES), the CCD contains counts of students in each U.S. public school disaggregated by race/ethnicity 2 (e.g., Black, Hispanic, white, Asian, and Native American) and poverty status such as FLE or FRPL.
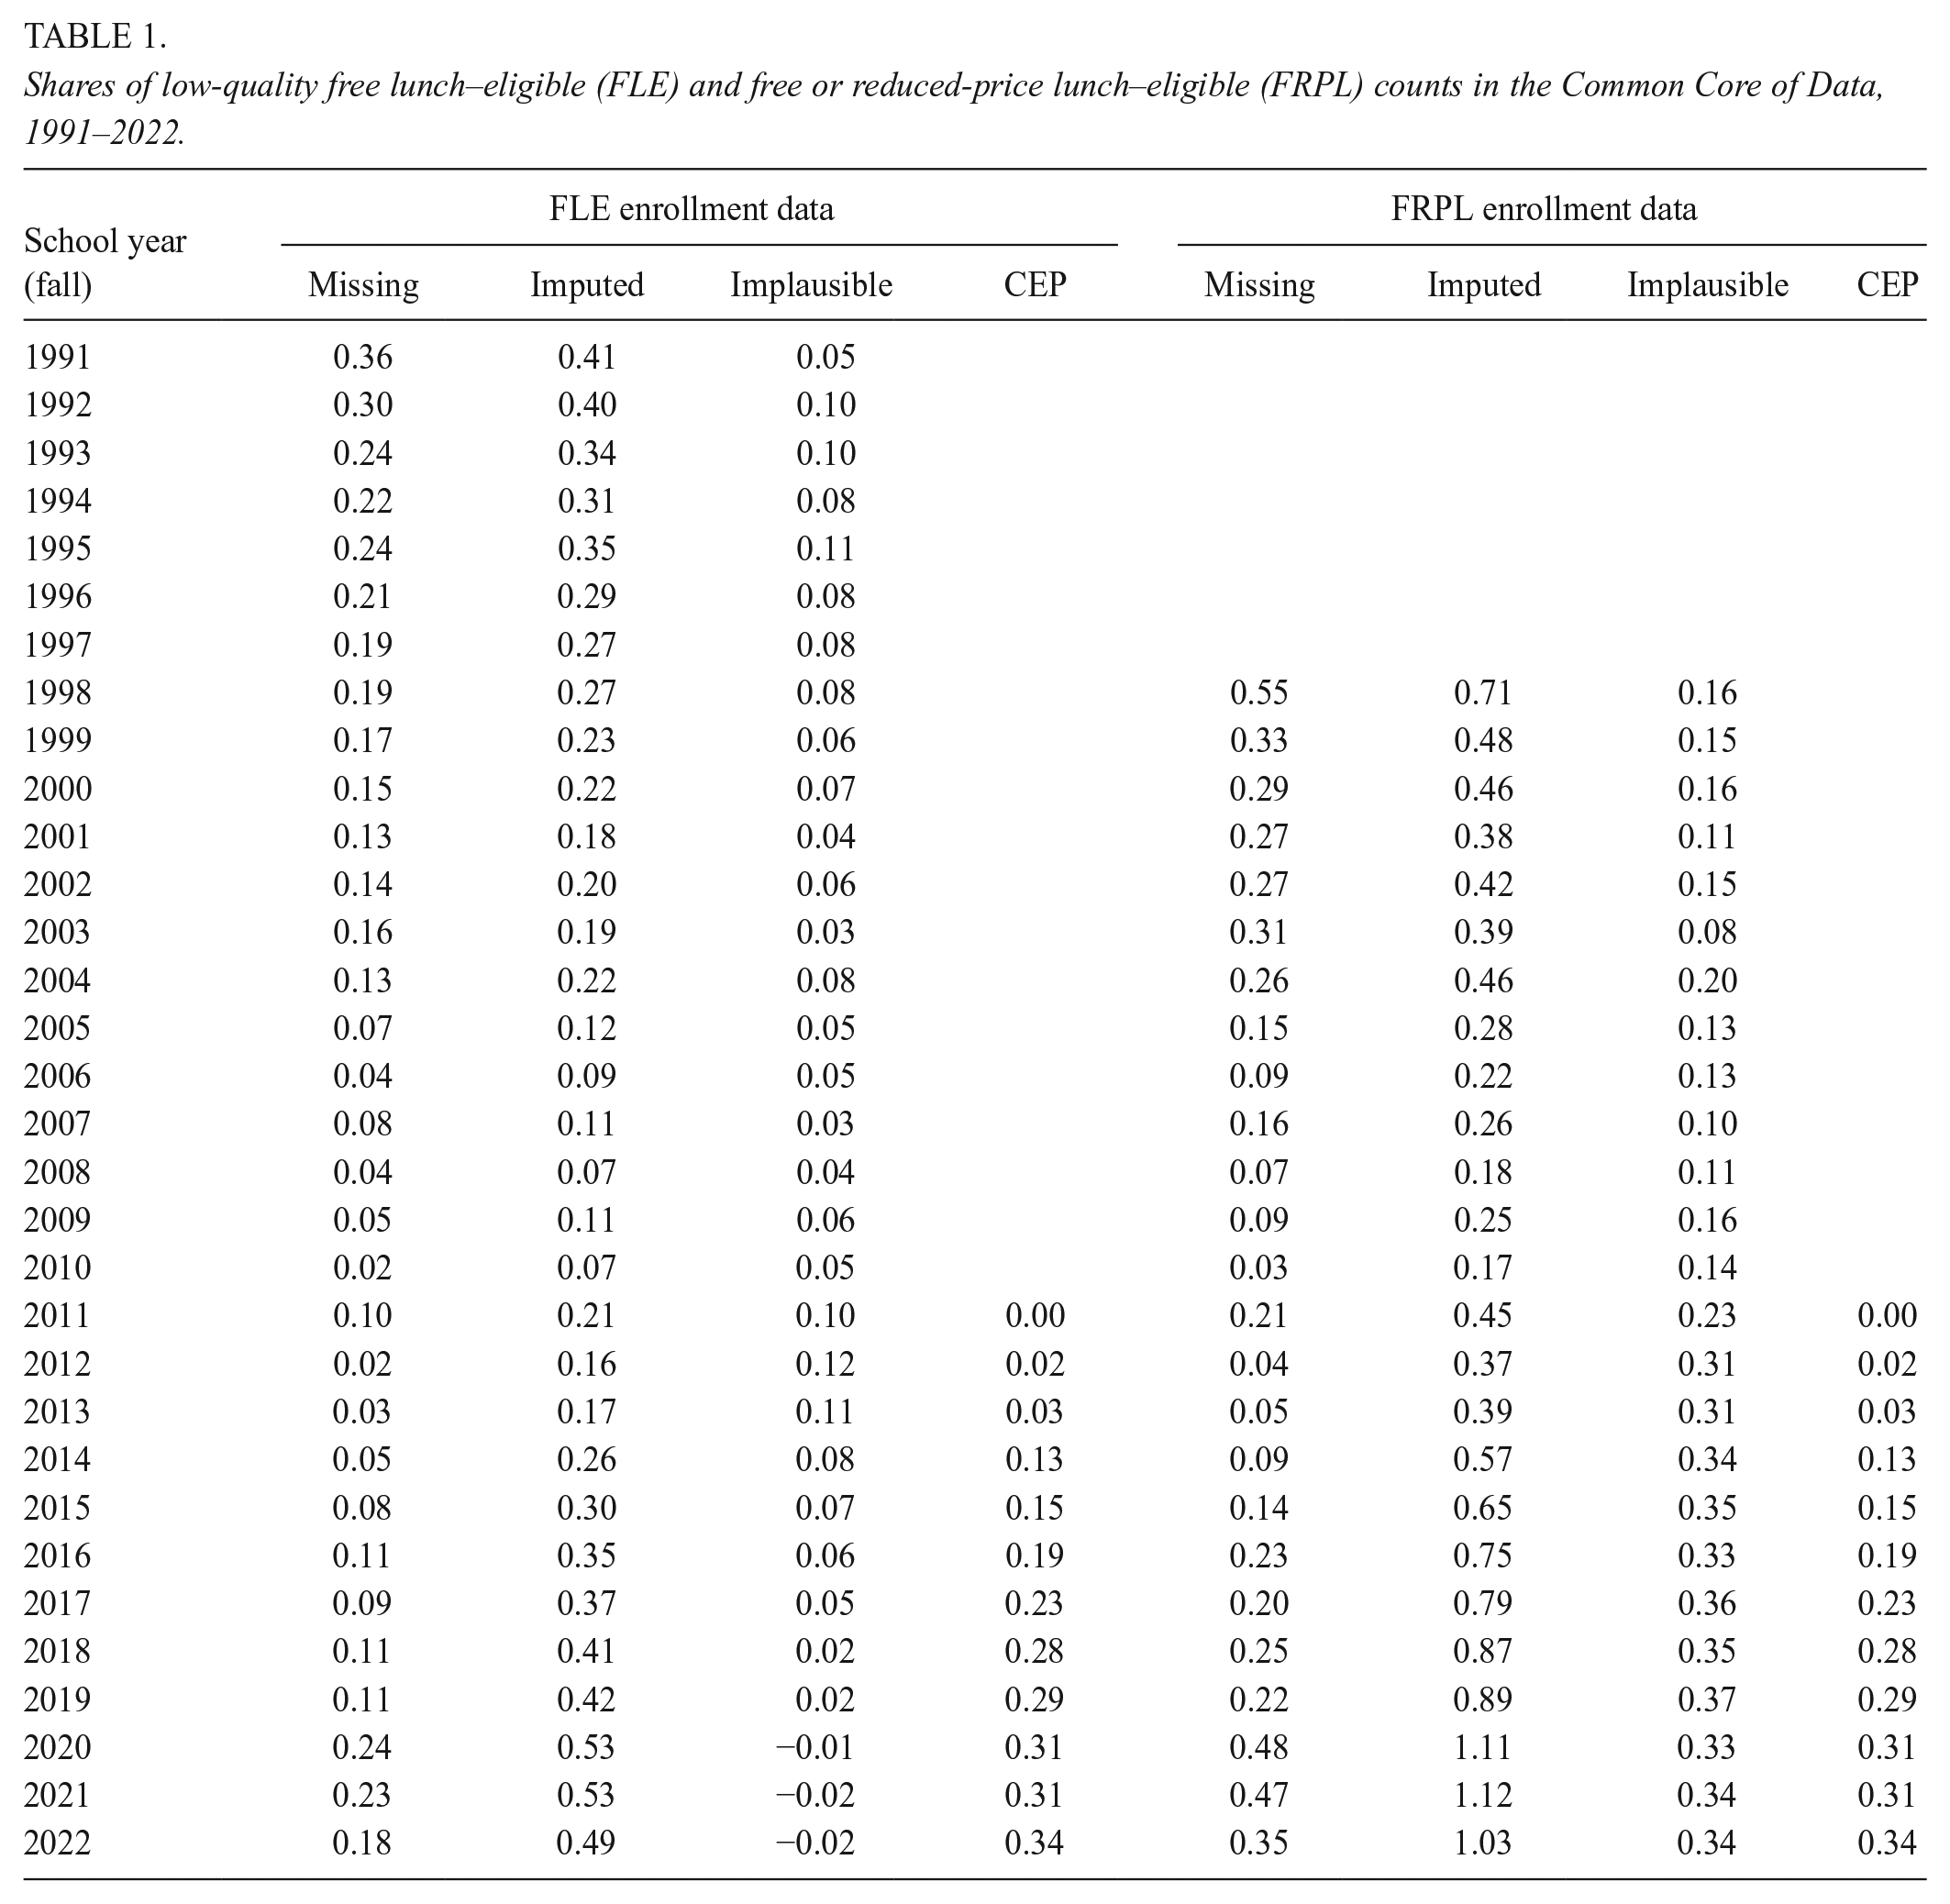
Although it provides population-based information, the CCD has notable data quality issues in FLE enrollment counts in three aspects, as presented in Table 1. First, there is a nonnegligible amount of missingness. For instance, between 1991 and 2004, one-fifth of FLE counts are missing on average, with subsequent missing rates dropping to <10% in the late 2000s and 2010s. However, the FLE missing rates increased to >20% again in 2020. Second, some nonmissing values in the CCD appear implausible, producing inexplicable spikes in year-to-year FLE enrollment trends within districts or states. These cases include anomalies in overall FLE enrollment trends at the district or state level, statewide surges in FLE counts due to administrative changes in reporting, and states reporting district-wide FLE counts instead of school-specific FLE counts for certain years (see Appendix A for more details about these implausible values). Third, since 2011, FLE counts may be prone to potential overreporting due to the CEP, which offers free meals to all students in high-poverty schools.
Shares of low-quality free lunch–eligible (FLE) and free or reduced-price lunch–eligible (FRPL) counts in the Common Core of Data, 1991–2022.
Using missing and likely incorrect data as they are can introduce potential bias in statistical inference (Kwak & Kim, 2017; Wada, 2020). Therefore, the LISD employs wide-format multiple imputation that imputes missing and implausible nonmissing values. Wide-format imputation sets the data structure to be wide so that each school has multiple variables for any given measure across the years (e.g., FLE rates in 1991, . . ., FLE rates in 2022). This approach is generally recommended in the literature for longitudinal datasets such as the CCD because it allows the imputation to be informed by observed values in other waves of the same variable, addressing potential bias from the attenuation of between-wave item covariance (Young & Johnson, 2015). For more information about the imputation method, refer to Appendix A.
As a result of multiple imputation, 10 imputed datasets were generated. I then computed segregation measures separately for each imputed dataset. These computed measures were averaged across the 10 imputed datasets following the guideline for pooling point estimates suggested by Rubin (1987). This guideline has been commonly used for analysis involving multiple imputation (Woods et al., 2023).
To construct segregation measures in this study, I used the school-by-year percentage of underrepresented and racially minoritized (URM) and poverty rates within the LISD. I defined URM students as Black, Hispanic, and Native American students and non-URM students as the remaining, mainly white and Asian students. I defined poverty rates as the share of FLE students whose household income was at or below 130% of the federal poverty line. 3
Charter and magnet schools occasionally establish their own local educational agency and thus have unique administrative district IDs in the CCD. Because this study focused on the geographic patterns of school segregation, I used geographic district IDs for charter and magnet schools (instead of their administrative district IDs) based on their physical location provided by the NCES Education Demographic and Geographic Estimates. This approach of using geographic district IDs follows previous studies describing charter and magnet school segregation within and between districts (Monarrez et al., 2022; Rich et al., 2021).
Methods
Measuring Racial Economic Segregation
Recent studies generally measure segregation in two ways (Reardon, 2016): exposure and unevenness. Exposure describes the average proportion of individuals of a specific group who are in potential contact with another group. For example, when white students make up one-fifth of the enrollment in the typical Black student’s school, Black students’ exposure to white students is 0.2. Conversely, unevenness refers to differences in the average experience between different groups. For example, if the Black-white difference in exposure to Black students is 0.2, the share of Black students in the average Black student’s school is 20%p higher than the average white student’s school. Unevenness becomes zero when every school has the same racial (or socioeconomic) composition as the total student population and reaches its maximum when each school only enrolls students of a single group. Because unevenness focuses on differences in exposure between groups rather than the sole levels of exposure, it is less sensitive to demographic changes than exposure measures (Reardon & Owens, 2014).
Exposure of a racial/ethnic group to school poverty indicates the proportion of poor students enrolled in the school of the typical student of a given racial/ethnic group. For instance, if Black students’ exposure to school poverty is 0.62, this indicates that 62% of students in the average Black student’s school qualify as poor. The following equation represents the exposure of racial group A to school poverty, where

To compute racial economic segregation, this study used the URM–non-URM difference in exposure to school poverty, which is a measure of unevenness. This measure is equivalent to the variance ratio index (James & Taeuber, 1985) and the relative diversity index (Reardon & Firebaugh, 2002) among the conventional measures of segregation. It indicates how many more poor students are enrolled in schools for the average URM student than in schools for the average non-URM student. For instance, if the URM–non-URM exposure to school poverty is 0.25, this indicates that the average URM student’s school has 25% higher poverty rates than the average non-URM student’s school. Below is the equation for the URM–non-URM racial difference in exposure to school poverty, denoted as ∆. For students who fall into the URM category (

Racial difference in exposure to school poverty becomes zero when all students experience the same school poverty rates regardless of their race. It reaches its maximum or minimum when school poverty is concentrated in schools attended by students of a specific race. For instance, the URM–non-URM difference in exposure to school poverty would be zero if URM and non-URM students had the same poverty rates in their schools; however, it would be maximized (i.e., have a value of 1) if all poor students are enrolled in URM students’ schools and non-URM students have no poor students in their schools; it would be minimized (i.e., have a value of −1) if the reverse were true.
I describe changes in racial economic segregation in terms of relative percent change between two time points, following prior works using the measure of race-specific exposure to poverty rates (Fahle et al., 2020; Owens et al., 2022). For instance, Fahle et al. (2020) used relative percent change to describe change in Black-white and Hispanic-white differences in exposure to school poverty such as follows: “In 1999, the black-white difference was 0.29 and the Hispanic-white difference about 0.31. In 2016, the differences had dropped slightly to 0.27 and 0.26, respectively. This represents about an 8% decline in the gap in the black-white and a 16% decline in the Hispanic-white gaps in exposure to school poverty over the 18 years of our panel—a rate of change of less than 1% per year.” In line with this, I used percent growth/decline between two specific time points to explain temporal changes in racial economic segregation.
Reconciling Trends in Racial Economic Segregation with Previous Studies
I compared trends in racial economic segregation from this study, which are based on FLE counts in the LISD, with the Civil Rights Project (Orfield & Jarvie, 2020; Orfield et al., 2016) and Fahle et al. (2020) to investigate how differences in handling missing and implausible values in the original CCD can help understand us inconsistent results. I also addee racial economic segregation trends using FRPL counts in the LISD for better comparability with Fahle et al. (2020), who used FRPL counts. The Civil Rights Project used FLE counts in the original CCD from discrete years (1993, 1996, 2000, 2003, 2005, 2010, 2013, and 2018) and did not include detailed information on analytic sample selection. Fahle et al. (2020) used FRPL counts in the CCD, which has been reported since 1998. In using the original CCD, they imputed missingness, zero counts, and CEP-affected observations. Moreover, they excluded school districts and metropolitan areas from their analysis if these units had FRPL enrollment trends that were substantially different from the rest of the units. However, they did not scrutinize implausible nonmissing values (see Data section and Appendix A for further discussion of these values).
Geographic Decomposition of Racial Economic Segregation
I decomposed racial economic segregation into several geographic scales, expressing the total segregation in the nation as a sum of different geographic components. Specifically, I used three different geographic decompositions as follows:


The set of geographic units included in each decomposition depends on potential mechanisms of interest. For example, equation (4) includes states to explore how state educational policies and macro-level demographic patterns affect the national trends in racial economic segregation. In contrast, equation (5) includes between- and within-district segregation separately for rural and metropolitan areas to identify differential patterns in the composition of between- and within-district segregation by urbanicity.
Equation (3) breaks down nationwide segregation into between- and within-district components. Equation (6) illustrates how total segregation in the nation (∆) is expressed as the sum of between-district segregation (
Consequently, where

Equation (4) decomposes between-district segregation into between-state and between-district within-state components. Where

Equation (5) expresses total segregation as a sum of segregation between and within districts in metropolitan areas, between and within districts in rural areas, between metropolitan areas, and between metropolitan and rural areas. I define metropolitan areas following Office of Management and Budget standards
4
and consider all nonmetropolitan areas as rural. I combine the last two components and refer to them as regional segregation, which indicates the share of segregation that is not malleable to policy remedies. Where

Results
Trends in Racial Economic Segregation
The upper panel of Figure 1 describes trends in racial economic segregation between schools in the entire nation from 1991 to 2022. During this period, schools attended by URM students consistently had a poverty rate roughly 20 to 30% higher than those attended by non-URM peers. The URM–non-URM differences in exposure to school poverty (i.e., racial economic segregation) increased from 0.26 in 1991 to 0.30 in 1997 (14% increase). Since then, these differences began to decline, reaching 0.21 by 2022 (29% decrease).

Trends in racial economic segregation, 1991–2022.
The decline in URM–non-URM racial economic segregation in the 2000s and 2010s appears to be driven by Hispanic-white differences in exposure to school poverty. The Hispanic-white gap in exposure to school poverty (red) grew steadily from the early to mid-1990s, peaking at 0.32 in 1997, and then decreased to 0.19 by 2022. Meanwhile, the Black-white gap (blue) remained largely unchanged from 1991 to 2022. These differential trends reversed the gap between the Black-white and Hispanic-white racial economic segregation by 2001, making Black-white segregation larger than Hispanic-white segregation, and this gap grew over time. This reversed and widening gap may be related to the dispersion of population distinctively experienced by the Hispanic population. Since the 1990s, Hispanics migrated into suburban and rural communities having lower levels of concentrated poverty than their traditional urban settlements. Moreover, economic growth in these rural communities since their arrival (Coates & Gindling, 2013) likely contributed to the decline in Hispanic-white racial economic segregation.
To understand how specific racial/ethnic groups contribute to trends in racial economic segregation, I present group-specific exposure to school poverty trends in the bottom panel of Figure 1. In the early to mid-1990s, all groups experienced an increase in exposure to school poverty, with Black and Hispanic students having a sharper increase. These differential increases contributed to the growth of Black-white and Hispanic-white racial economic segregation during this period. During the 2000s, Hispanic students’ exposure to school poverty decreased slightly, whereas Black and white students’ exposure to school poverty continued to grow, producing a decline in Hispanic-white racial economic segregation. Between the late 2000s and the mid-2010s, students of all groups experienced increasing exposure to school poverty, possibly due to the overall increase in child poverty since the 2007–2008 financial crisis (Fahle et al., 2020). However, Black students witnessed the most rapid increase among all racial/ethnic groups, and their exposure to school poverty remained relatively unchanged thereafter, whereas Hispanic students’ exposure to school poverty decreased slightly during the late 2010s. These diverging trends by race/ethnicity yield persistent Black-white and declining Hispanic-white racial economic segregation.
Reconciling Trends in Racial Economic Segregation
I compared my findings using the LISD with those from the Civil Rights Project (Orfield & Jarvie, 2020; Orfield et al., 2016) and Fahle et al. (2020) to understand discrepancies in racial economic segregation trends in relation to handling low-quality data in the CCD. Figure 2 shows trends in Black-white and Hispanic-white differences in exposure to school poverty reported by the Civil Rights Project (red, using FLE counts) and Fahle and her colleagues (green, using FRPL counts), respectively. It also presents corresponding LISD-based trends using FRPL (orange) and FLE counts (black). Although FLE is the poverty indicator used for the main results of this paper due to its better availability (FLE enrollment data are available from 1991 to 1992, whereas FRPL data are available from 1998 to 1999), I add FRPL counts to improve compatibility with Fahle et al. (2020) because their results are based on FRPL.

Comparison of trends in Black-white and Hispanic-white differences in exposure to school poverty with previous studies.
Figure 2 illustrates how treating low-quality data in FLE/FRPL counts in the original CCD may impact substantive conclusions, primarily in three aspects. First, from the late 1990s through the early 2000s, the Civil Rights Project (red) reports an increase in Black-white differences in exposure to school poverty, whereas the results from the LISD (black and orange) and Fahle and her colleagues (green) document decreases in the same measure. And the levels of Hispanic-white differences reported by the Civil Rights Project during this period differ substantially from the other two studies. This discrepancy likely stems from the high missingness in FLE/FRPL counts in this period (see Table 1). About 20% of FLE counts were missing from 1993 to 2003, which is sufficient to impact the quality of statistical inferences (Dong & Peng, 2013). Although the other two studies impute missing values in the original CCD, the Civil Rights Project ignores these values. This approach, known as complete case analysis, relies on a strong and unlikely assumption that data are missing completely at random (Young & Johnson, 2015). Therefore, interpreting the trends in Black-white racial economic segregation in the late 1990s and early 2000s as decreasing appears to be more plausible.
Second, the Civil Rights Project shows a sizable drop in 2018 in both the Black-white and Hispanic-white trends, which does not appear in Fahle et al. (2020) or the LISD-based trends. This can be explained by implementation of the CEP, which impacted 28% of public schools in 2018 (see Table 1). The data quality of FLE counts reported by the CEP-affected schools may have been compromised because they were not required to collect the exact counts of FLE students. In contrast to the Civil Rights Report, which uses the original CCD as is, Fahle et al. (2020) and the LISD treat FLE/FRPL counts in CEP schools as missing before imputation. Consequently, their results are informed by FLE/FRPL enrollment data from the other years within the same school, providing more comparable trends with adjacent years.
Lastly, around 2010, Fahle et al. (2020) showed slight but noticeable gaps in the Black-white trends when compared with those based on the LISD and FRPL counts. Because the only difference between them lies in investigating implausible nonmissing values in the CCD, it is reasonable to attribute these gaps to increases in implausible nonmissing FRPL data during the early 2010s (see Table 1). According to the literature, using likely incorrect values in the imputation may influence the imputation results (Huang et al., 2018; Wada, 2020). The steady and substantial rise in implausible values since 2010 may suggest that these erroneous values may significantly influence the imputation compared with a few sporadic increases in implausible counts in the 2000s (e.g., from 8% in 2003 to 20% in 2004). Moreover, although race-specific FRPL counts are not available in the CCD, Census data show that Black children are more likely to be in poverty than Hispanic children (Nolan et al., 2017), implying that the presence of implausible data in FRPL enrollment counts may have impacted the Black-white trends more than the Hispanic-white trends.
Geographic Decomposition of Trends in Racial Economic Segregation
As in equations (3) to (5), I decomposed the nationwide racial economic segregation into three decompositions–equations (6), (7), and (8)–and present the results in Table 2 and Figure 3. These decompositions express total segregation in the nation as a sum of (a) segregation between and within districts, (b) segregation between states, between districts within states, and within districts, and (c) segregation between and within districts, separately for metropolitan and rural areas, along with regional segregation components. Overall, I find that between-district segregation has been the largest component of total racial economic segregation, although it modestly declined throughout the last three decades. By contrast, the share of the within-district component in total segregation has increased continuously over the study period. Although the growth of the within-district component is more pronounced in metropolitan areas, the decline in between-district segregation is more noticeable in rural areas.
Trends in racial economic segregation with geographic decompositions, 1991–2020.
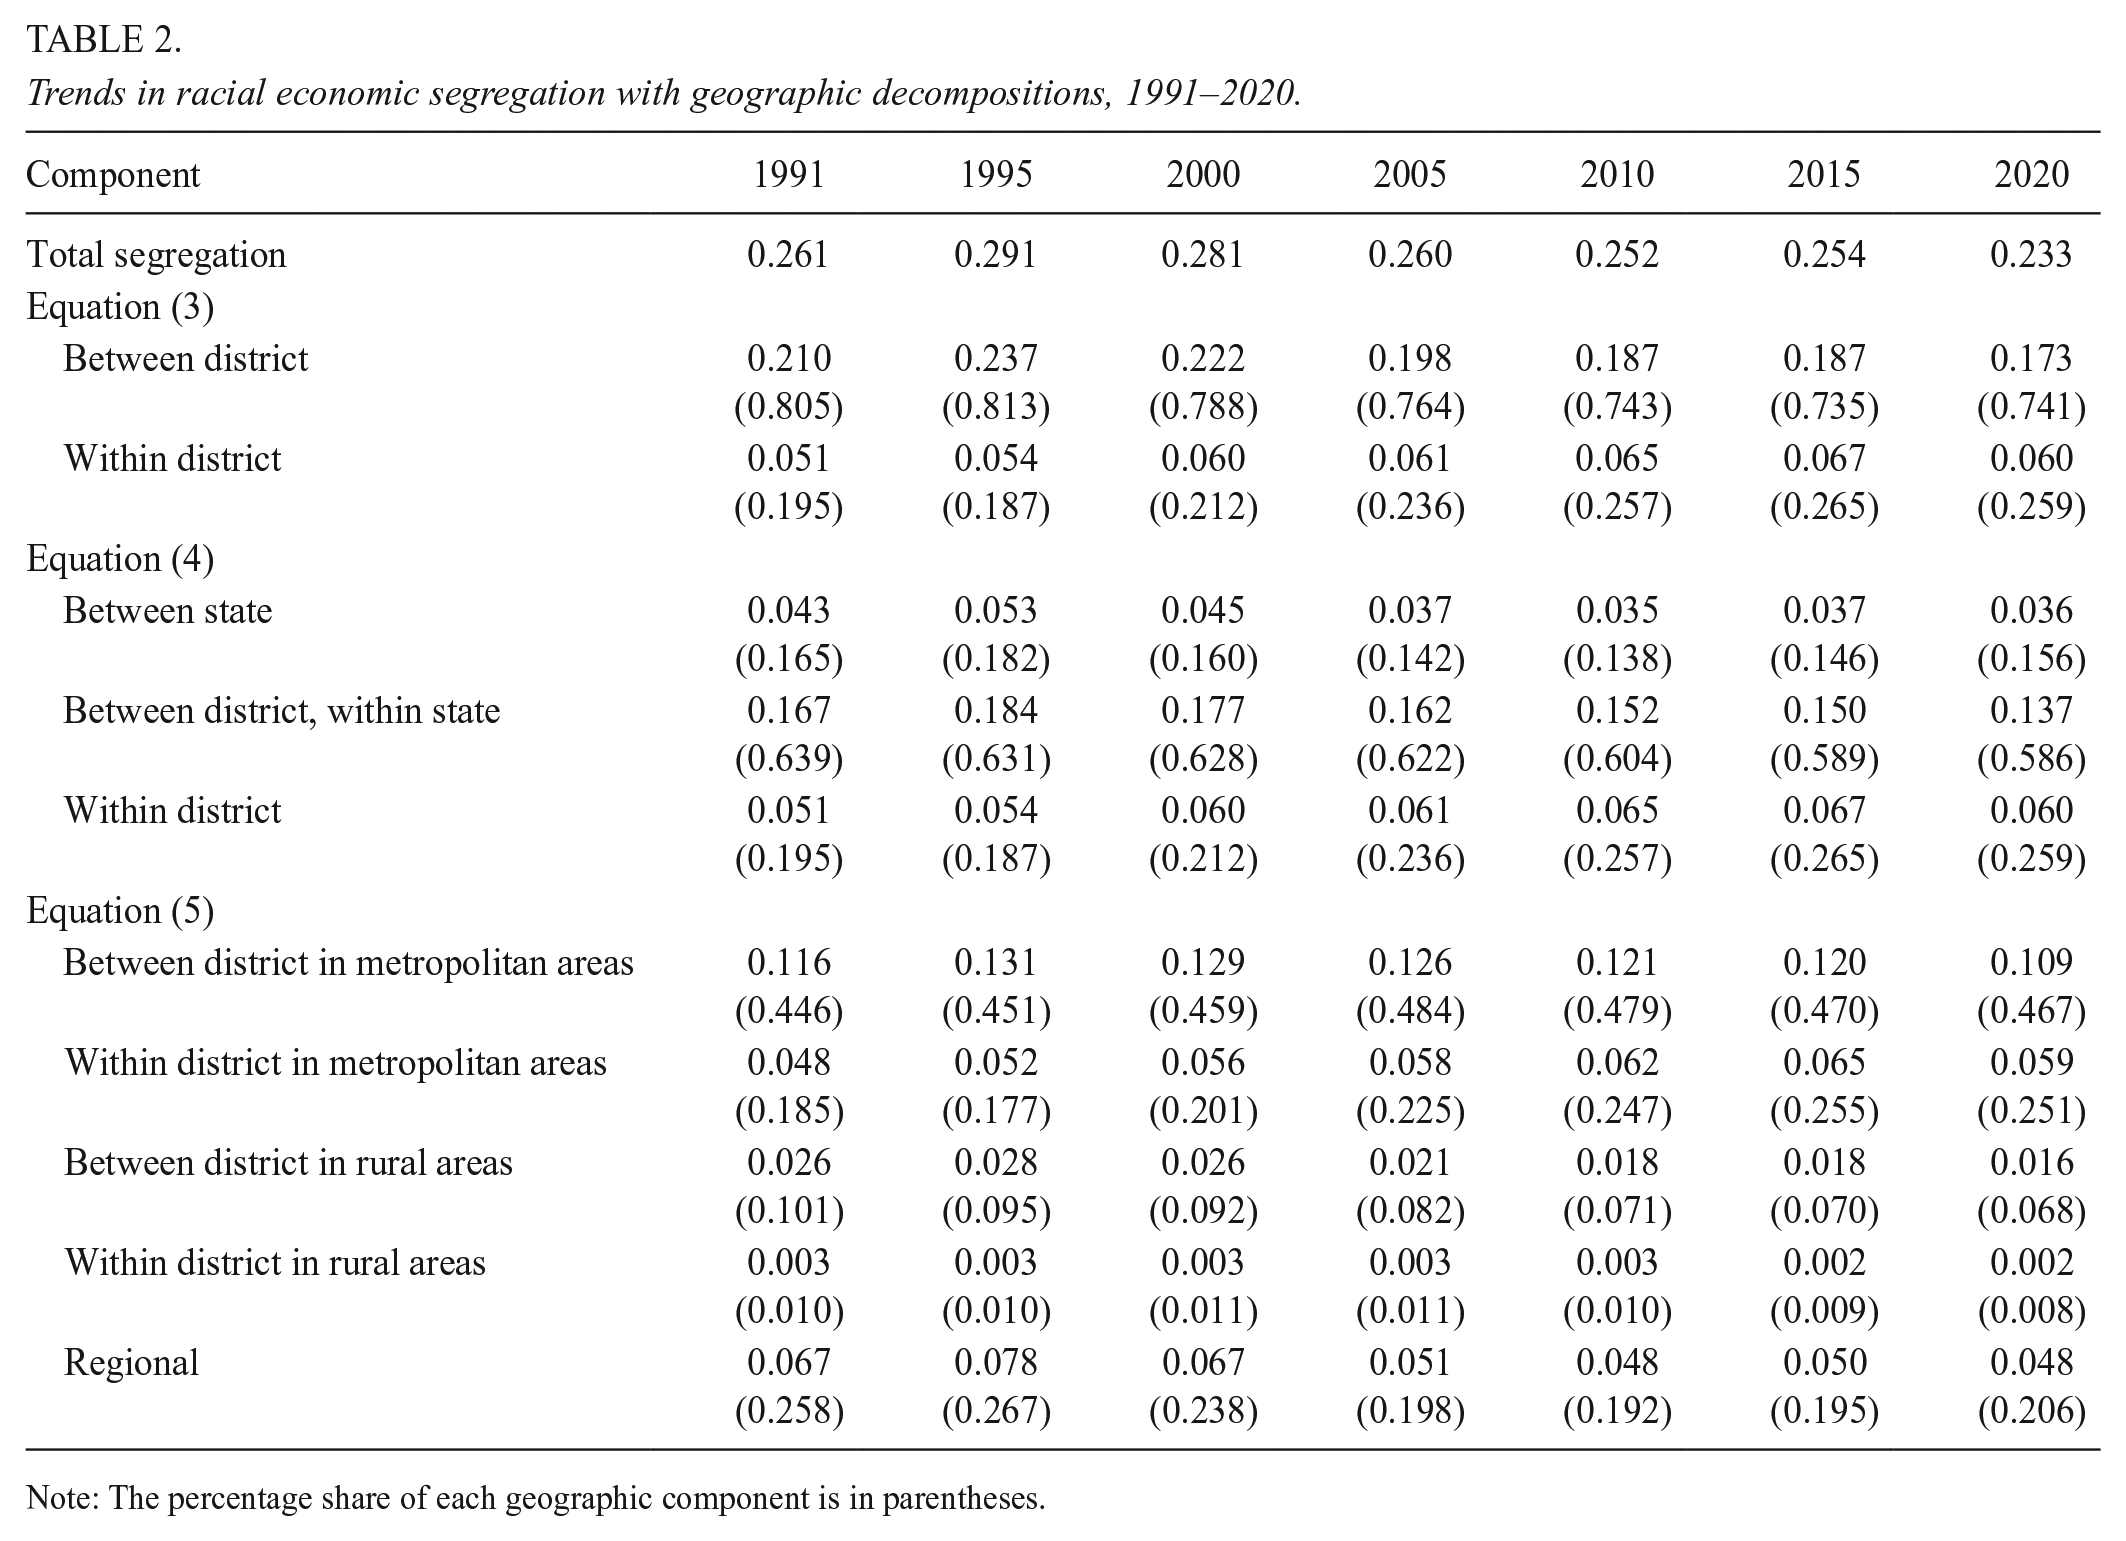
Note: The percentage share of each geographic component is in parentheses.

Geographic decompositions of trends in racial economic segregation.
The top panel in Figure 3 presents equation (3), breaking down the nationwide segregation into between- and within-district components. Between-district segregation (gray) has been the largest component of racial economic segregation during the last three decades, accounting for 70 to 80% of total segregation in the nation over the study period. Despite being the primary driver of national trends in racial economic segregation, between-district segregation decreased steadily over time, from 0.210 (81% of total segregation) in 1991 to 0.173 (74% of total segregation) in 2020.
In contrast, the within-district component has constituted a relatively minor share of nationwide racial economic segregation, about one fifth to one quarter of total segregation. However, this component constantly increased during the study period, from 0.051 (20% of total segregation) in 1991 to 0.060 (26% of total segregation) in 2020. This corresponds to an 18% growth over three decades. These results suggest that the relative importance of the within-district component has marginally but continuously risen over time.
Equation (4) decomposes between-district segregation in equation (3) into between-state and between-district and within-state components of segregation, expressing national segregation as a sum of between-state, between-district (within-state), and within-district components. Between-state racial economic segregation has declined since the mid-1990s, from 0.053 in 1995 to 0.045 in 2000 and further to 0.036 in 2020, reducing its share in national segregation (18.2% in 1995 to 15.6% in 2020). This decrease in between-state segregation suggests that racial economic school segregation in the nation is now driven more by within-state processes than between-state ones.
Equation (5) applies the decomposition of between- and within-district segregation separately for metropolitan and rural areas, yielding four geographic components. I then refer to the remaining components as regional segregation (i.e., segregation between metropolitan and rural areas and between metropolitan areas), which decreased since the mid-1990s (from 0.078 in 1995 to 0.048 in 2020; 38% decrease).
Within metropolitan areas, the patterns of large between-district segregation and growing within-district component observed in equation (3) are generally consistent. Between-district segregation is about twice as large as the within-district component across all time points but did not change much over time. The within-district component of racial economic segregation in metropolitan areas increased from 0.048 in 1991 to 0.059 in 2020 (23% growth). This increase indeed is steeper than the within-district component in the entire nation (18% growth from 1991 to 2020), which may be attributed to the concentration of school choice expansion in metropolitan areas. The availability of nontraditional public schools such as charter schools increased more rapidly in urban and suburban areas than in rural areas (Baker, 2016), which may have contributed to increasing within-district segregation in metropolitan areas (Monarrez et al., 2022).
In contrast, within rural areas, between-district segregation experienced a noticeable decline over time, from 0.026 in 1991 to 0.016 in 2020 (38% decrease), whereas the within-district component remained consistently low. This decline may be linked to the dispersal of the Hispanic population across rural counties and their contribution to the local economy (Coates & Gindling, 2013), which could have reduced Hispanic students’ exposure to poverty. It should be noted that Hispanics may have been particularly impactful in shaping between-district segregation in rural areas. Many of those rural destinations would have otherwise shrunk without the influx of Hispanics (Lichter & Johnson, 2020), whereas the Hispanic population growth in metropolitan areas was in line with the overall increase in population and racial/ethnic diversity (Lichter et al., 2023; Parker et al., 2018).
Discussion
This study innovates past research in two key aspects. First, it highlights the importance of data quality issues in the CCD by using a dataset that scrutinizes anomalous patterns in FLE/FRPL enrollment data within the CCD and employs multiple imputation to handle missing values. It also provides a comparison of findings based on this dataset with previous studies to reconcile discrepancies in the prior understanding of trends in racial economic segregation among schools. Second, the geographic decomposition analysis in this study provides insights into how racial economic school segregation has changed in response to changing demography and policy contexts. This analysis also informs how much of the current racial economic segregation can be addressed via policy remedies at different organizational levels.
Findings from this study bring significant implications for both scholarship and policymaking on school segregation. For scholars, the results offer clearer evidence on trends in an important yet understudied dimension of school segregation. Racial economic segregation increased during the 1990s and declined steadily since the late 1990s. Specifically, the Hispanic-white gap in exposure to school poverty decreased over time, whereas the Black-white gap remained high, primarily due to the faster growth in exposure to school poverty among Black compared with Hispanic students in the early 2010s. This pattern aligns with the prior findings showing that child poverty rates grew most rapidly for Black children during the 2010s (Nolan et al., 2017). It also may be interpreted in the context of the Hispanic influx into lower-poverty suburban and rural areas since the 1990s (Flippen & Farrell-Bryan, 2021; Lichter & Johnson, 2021). Therefore, I suggest that Black students’ concentration in high-poverty schools should be prioritized when addressing racial economic segregation.
Moreover, this study investigates different approaches to data quality issues in FLE/FRPL counts in the CCD and discusses how existing discrepancies in prior studies can be explained by these approaches. By comparing my results with those of Fahle et al. (2020) and the Civil Rights Report (Orfield & Jarvie, 2020; Orfield et al., 2016), I find that not addressing missing or implausible values in the original CCD can lead to unconvincing results in the computation of racial economic segregation. This tendency is particularly pronounced in the 1990s, due to higher missing rates in the early years of the CCD collection. Furthermore, the observed gap in racial economic segregation trends in the mid-2010s between studies that considered CEP-affected schools and those that did not highlights the importance of accounting for the presence of CEP-affected observations when using FLE/FRPL counts in the CCD. Additionally, a substantial and systematic increase in implausible nonmissing values in the 2010s can result in minor differences in yearly estimates of racial economic segregation if anomalous data points observed in this period are not treated properly. Consequently, I suggest that addressing low-quality data points in the CCD’s FLE/FRPL enrollment data is critical to ensuring the quality of inferences about historical trends in school segregation.
For policymakers, the geographic decomposition analysis provides insights into which organizational-scale policies should be targeted to design strategies that can address the current racial economic segregation most effectively. First, between-district segregation has been the largest part of the total racial economic segregation, suggesting the pressing need for interdistrict collaborations beyond district boundaries and efforts to promote wider access to housing for racially underrepresented groups. However, the impact of these strategies may be limited since the Milliken v. Bradley decision in 1974, when the Supreme Court ruled that federal courts could not implement multidistrict remedies without clear evidence of school districts’ committed acts causing racial discrimination. Moreover, this study reveals that the within-district component of racial economic segregation has grown steadily over the last three decades. This finding necessitates public attention to intradistrict strategies such as ensuring racially minoritized students’ access to lower-poverty schools in student assignment plans.
Second, the within-district component of racial economic segregation has been increasing at a faster rate in metropolitan areas compared with the rest of the nation, partly due to the rapid expansion of school choice options in urban and suburban areas. This growing concentration of economic disadvantages in schools serving racially minoritized students in metropolitan areas is particularly crucial for two reasons: First, metropolitan areas include the vast majority of the nation’s Black and Hispanic population (Parker et al., 2018), and second, the concentration of poverty in schools attended by Black and Hispanic students has been identified as the strongest predictor of racial achievement gaps in previous studies (Reardon, 2016; Reardon et al., 2022). Therefore, addressing racial economic segregation within urban and suburban districts should be prioritized in policy considerations due to the increasing levels of within-district segregation and the overrepresentation of the racially minoritized population.
Lastly, segregation at higher scales of geography (i.e., between-state and regional segregation) indicates how much of the current segregation consists of components that may not be addressed directly via state and district policy efforts. Segregation at these scales decreased during the last three decades, suggesting that states and districts have sufficient leeway to prevent racially minoritized students from being concentrated in high-poverty schools via inter- and intradistrict policy efforts. Between-state segregation decreased by 23% and regional segregation decreased by 38% over the 1991 to 2022 study period, whereas these components have accounted for one fifth to one quarter of total segregation.
Despite its significant implications for scholars and policymakers, this study has a few limitations. One limitation is that a student’s economic status is limited to a binary indicator of free lunch eligibility, which only allows us to focus on economic disadvantage. If more fine-grained household income information were provided, it would be possible to answer more questions, such as how the concentration of economic advantage has changed (Reardon & Bischoff, 2013) and at which income percentile racial economic segregation is most salient.
In sum, this study provides a thorough description of trends in racial economic segregation during the last three decades using rigorously cleaned data of student enrollment by race and poverty status. The results from the geographic decomposition analysis underscore the magnitude of between-district racial economic segregation and the role of interdistrict educational and housing policy efforts in promoting student diversity across schools. These measures are imperative but may not be widely feasible because district leaders do not have enough discretion to collaborate on cross-district integration policies in the current U.S. context (Holme & Finnigan, 2013). Lastly, this study highlights the growing importance of intradistrict strategies to address school segregation, particularly among districts in metropolitan areas.
Footnotes
Appendices
Funding
This study was supported by a grant from the American Educational Research Association, which receives funds for its AERA-NSF Grants Program from the National Science Foundation under NSF award NSF-DRL 1749275.
Notes
Author
HEEWON JANG is an assistant professor at the University of Alabama (