
Abstract
How will climate change impact education since near-universal primary education has been achieved in many developing countries? We begin to answer this by studying a recent severe drought in Southern Africa. Using data from a large cluster-randomized control trial involving girls and satellite data measuring drought intensity, we find that drought exposure increased attendance, especially for the poorest girls. Girls experiencing food insecurity see declines in learning assessment scores while others see no gains in assessment scores, on average, compared to the counterfactual. The analysis highlights the importance of considering both attendance and performance in analyses. It also suggests the potential importance of ensuring schools have the resources to deal with higher attendance and providing food assistance to students during droughts.
Keywords
Introduction
Around the world, droughts and other extreme weather events can negatively impact households’ financial security, health, and nutrition (Hoddinott & Kinsey, 2001; WHO, 2008). Climate change is expected to increase both the frequency and severity of such events throughout Sub-Saharan Africa, where there already has been a rise in both severe flooding and severe droughts (Gizaw & Gan, 2017; Masih et al., 2014). The consequences of these events can be particularly severe in developing countries’ agriculturally dependent populations. In rural Zimbabwe, for example, over 90 percent of employment is in the agricultural sector (ZIMSTAT, 2018), and over 70 percent of Zimbabwean households’ food comes from their own agricultural production (Food and Agriculture Organization of the United Nations, 2021). Children’s health and well-being are particularly vulnerable in these situations, as kids are more likely to experience stunted growth and other adverse health consequences, which can also impact their ability to thrive in an educational setting. In light of this, we specifically examine the impact of a severe drought on education outcomes. The analysis provides two key contributions with implications for policy and future research.
First, we use data from a severe drought in southern Africa during the 2015–16 growing season to study how education outcomes differed by drought severity across communities and to consider how the impact of the drought differs based on individual and family characteristics. Our focus is on girls in rural Zimbabwe, where a study funded by the UK government Girls’ Education Challenge (GEC) had already collected detailed data on girls’ education outcomes before and during the drought period. We combine this data with remote-sensing satellite data from the National Oceanic and Atmospheric Administration (NOAA). This gives us insight into the effect of a major drought on the educational attainment and measures of learning for a population group that is particularly vulnerable to leaving school early. Through this analysis, we show that the poorest girls tend to be disproportionately impacted as they see the largest declines in learning when exposed to the drought. This illustrates how crises can perpetuate existing inequalities in learning across socioeconomic groups. Such analyses can guide the allocation of aid and disaster relief to help minimize the lasting impact on the most marginalized groups.
Second, we show that a crisis may impact educational attainment and measured learning outcomes in different directions. While this difference has been articulated by previous research (e.g., Hanushek & Woessmann, 2020a), this insight comes with substantial implications for researchers studying the impact of community-wide events on education outcomes. We show that exposure to more severe drought conditions leads to an increase in school advancement for girls in Zimbabwe, likely reflecting an increase in school attendance driven by declining opportunity costs of attending school (e.g., fewer opportunities to work or contribute to household activities). However, we see no corresponding increase in test scores accompanying this increase in attendance. If anything, as attendance increases, there is a decrease in learning among the most marginalized girls, with exposure to the drought leading to lower literacy performance among girls from the poorest households. This does not mean that increased attendance was not beneficial, just that it was insufficient to overcome the other challenges associated with drought exposure overall. In this framework, attendance can be viewed as a necessary but not a sufficient condition for girls to learn.
This implies that when assessing the impact of a crisis on education outcomes, it is important to consider the impact on both the amount of schooling (e.g., enrollment, attendance, or advancement—sometimes referred to as “progression” or “transition”) and learning (e.g., test scores, literacy rates) outcomes. While the quantity of education and quality of learning frequently move in the same direction (e.g. Björkman-Nyqvist, 2013; Burde & Linden, 2013; Shah & Steinberg, 2017), we show that this will not always be the case. Focusing only on one type of outcome measure, as many evaluations do, may tell only part of the story, leading to incorrect conclusions about the overall educational impacts. This highlights a concern with literature studying the impact of a shock on education outcomes using data on education attainment without assessing learning. For example, Stevens and Schaller (2011) look only at grade repetition, Duflo (2001) looks at total years of education, Jensen (2000) considers progression through school, and J. D. Angrist et al. (2012) focus on standardized test scores but not progression or enrolment.
Had our analysis only focused on the impact of the drought on the amount of schooling, we would conclude that the drought had a positive impact on education, overlooking the fact that the gains in schooling did not correspond to expected gains in learning overall and that the crisis likely caused the most-marginalized girls to fall further behind. This is consistent with broader trends suggesting students around the world are not meeting basic skill proficiency, despite near-universal primary school enrollment (N. Angrist et al., 2021).
There are several other features of our analysis that further set it apart from the literature. First, the NOAA data that we use to construct localized measures of agriculture production represents state-of-the-art data processed from satellite images. This provides much more precise and detailed community-level indicators of drought impact than those used in previous studies assessing the impact of drought/rainfall on education outcomes in development. Rainfall anomalies are by far the most commonly used indicator in the literature looking at the impacts of droughts on education and other development outcomes. 1 However, rainfall alone is not a sufficient indicator of agricultural droughts, as droughts can occur in both high and low rainfall conditions depending on the biological requirements of the vegetation and the state of the soil in a given environment (Wilhite & Glantz, 1985). Our analysis relies on a more relevant measure, the Vegetation Health Index, which takes into account both vegetation health and temperature based on remote-sensing satellite data.
Second, by overlapping the NOAA data with detailed data from an ongoing Girls’ Education Challenge study, we have detailed individual-level education outcome data for girls from before and after the drought. This allows us to compare the impact of the drought on different outcomes, including measures of schooling quantity and learning quality. It should be noted that by using the Girls’ Education Challenge data, our results are limited to focusing only on girls.
Third, and perhaps most importantly, we study a shock that occurred recently, after many years of global efforts to increase access and support for girls’ education has led to most children around the world being in school (Psacharopoulos & Patrinos, 2018). Therefore, our results may be a better indication of the impact of severe climate events taking place today than studies based on shocks that occurred decades ago, given the impact these efforts have had on returns to schooling (Psacharopoulos & Patrinos, 2018). Relatedly, our study focuses on the impact of a severe drought (the worst in 20 years), while most of the literature is more likely to study the impact of fluctuations in annual rainfall during a typical year (e.g. Björkman-Nyqvist, 2013; Jensen, 2000; Maccini & Yang, 2009; Shah & Steinberg, 2017). Understanding the impact of severe weather events is essential as climate change contributes to more volatile weather, particularly in vulnerable areas like Sub-Saharan Africa.
The severity of the drought means that the communities were hit with a substantial shock that likely impacted the local economies as well as variables such as nutrition or home production. Although rare, such extreme shocks are becoming increasingly common due to climate change (Masih et al., 2014); therefore, understanding their impact is increasingly important. Furthermore, the timing of our data, combined with the use of data from detailed satellite images, allows us to show how quickly households and girls are impacted by droughts and how quickly they change their behavior in response to early warning signs that a drought is approaching. As policymakers and development agencies work to design projects that are sensitive to these kinds of extreme events, this paper contributes to our understanding of the impact that these types of phenomena have on education.
The following section reviews the relevant theoretical framework that motivates our analysis and interpretation of findings. We then describe our data, the local context, and our methodology. This is followed by a presentation of the results. The paper concludes with a discussion of the policy implications.
Conceptual Framework
To motivate our analysis, we explore how economic shocks or droughts, more specifically, affect the willingness to work, the availability of jobs, financial hardship, food security, and other factors. Some of these factors, such as the reduced availability of work opportunities for children, work toward increasing school attendance and potential learning. Other factors, such as financial hardship and reduced food security, work toward decreasing school attendance and present challenges for learning for those in school.
Together, the factors may drive either increases or decreases in attendance and learning, depending on which factors dominate. Furthermore, it is not guaranteed that the impact on attendance will go in the same direction as learning, as shocks impact learning outcomes through more than just their impact on school attendance. While our empirical analysis only includes data from girls, there may be gender differences in the relative importance of the different channels and effects in the conceptual framework. So any finding we find regarding girls in our sample may or may not also apply to boys.
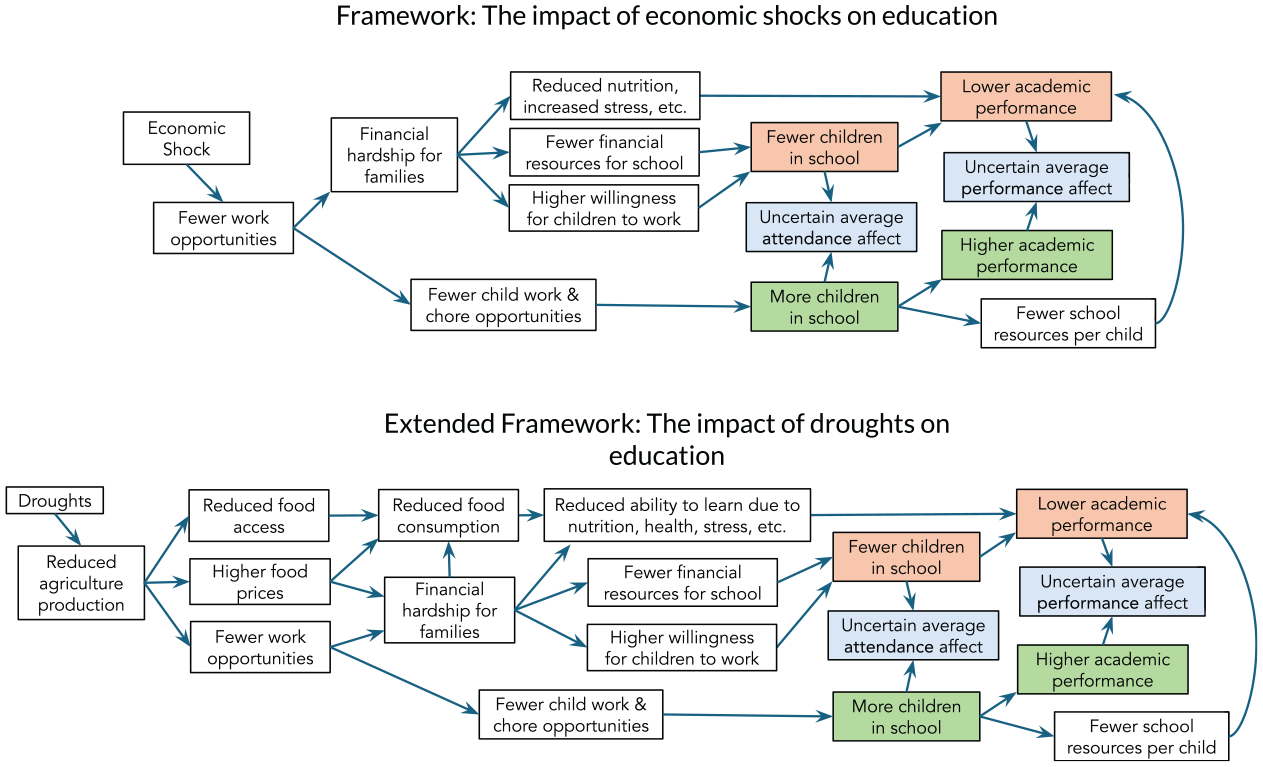
Figure 1 presents two frameworks. The first illustrates key pathways through which an economic shock can influence attendance and performance in school. It shows both positive and negative impacts on these outcomes, and it is not clear from the framework whether the aggregate impact on these outcomes is positive or negative. The second illustrates the key pathways through which a drought impacts education outcomes. It is an extension of our economic shock framework in that a drought produces both an economic shock and an impact on food supply, creating additional channels through which the shock creates hardships for families and children, potentially reducing student attendance and performance.
Impact of shocks on attendance and performance.
Factors Reducing Attendance
Droughts and economic factors typically reduce schooling by reducing student attendance rather than disrupting the availability of learning opportunities. 2 There is a well-established association between poverty and child labor, suggesting a drought or economic shock, which may increase financial hardship, may increase the willingness of households to have children engage in work in lieu of attending school (e.g. Edmonds, 2005; Ersado, 2006; Soares et al., 2012). Children are also more likely to leave school for work when their parents experience a negative income shock (Duryea et al., 2007). 3 There is also substantial evidence presented by NGOs suggesting that economic hardship and hunger caused by droughts lead children to leave school, either due to the need to work or the inability to pay school fees. For example, Jensen (2000) shows that enrollment falls in areas that receive substantially less rainfall than normal in Côte d’Ivoire. Agamile and Lawson (2021) present evidence of reduced attendance associated with negative rainfall shocks for Uganda. 4 Marchetta et al. (2018) find similar evidence from Madagascar and show that the effect is most prominent among poorer households, which, the paper argues, have fewer assets to cope with negative weather shocks.
Factors Increasing Attendance
Despite evidence that negative rainfall shocks have led to higher child labor and lower school attendance in some countries, this is not a universal experience. Shah and Steinberg (2017), for example, show that children in India spend more time in school during periods of low rainfall. Zimmermann (2020) confirms the finding while showing that the pattern has been changing over time, with decreased rainfall being associated with increased enrollment in more recent years. Consistent with our framework, Zimmermann (2020) argues that the impact of weather shocks on school attendance depends heavily on the availability of work. 5
Although financial hardship may increase the number of children who are willing to work rather than attend school, it may also decrease the number of work opportunities available for children. Droughts or other shocks affect the local labor markets, particularly in primarily agricultural areas, decreasing the availability of jobs and increasing the number of nonchildren looking for work (Beegle et al., 2006; Duryea & Arends-Kuenning, 2003; Kruger, 2007; Soares et al., 2012). These economic factors may offset or even dominate the increased willingness of children and families to engage in child labor (Shah & Steinberg, 2017; Zimmermann, 2020). An economic shock or drought can simultaneously increase the supply of child labor and decrease the demand for it, leading to an ambiguous net effect on the number of children leaving school for work. The direction of the net effect may differ across environments.
Factors Affecting Academic Performance
Economic shocks and droughts also affect student performance, as measured by learning assessments, through their impact on both time in school and the environments in which students live and learn. Just as the overall impact on student attendance could be positive or negative, so can the overall impact on performance.
If a shock leads more children to attend school (due to there being fewer work opportunities), then one might assume that the shock increases learning performance. However, there are many channels through which a shock may work to offset learning gains or decrease overall student performance, even as attendance increases.
Financial hardship at home, food shortages, and higher prices of food can drive psychological stress, decreased mental health, poor environmental conditions, and malnutrition. Chuta (2014), for example, shows how shocks can lead to the death of livestock, and Berhane et al. (2016) show that droughts can increase food prices, both of which may contribute to financial hardship and malnutrition. These risk factors are correlated with decreased student performance (Ananat et al., 2017; Ebenstein et al., 2016; Rege et al., 2011; Stevens & Schaller, 2011; Taras, 2005; Yoshikawa et al., 2012). 6
Additionally, if the shock increases the number of students attending school, then we may see a decline in the performance of other students who now receive less support from the existing education resources. Indeed, this is consistent with what we observe in Zimbabwe’s Girls’ Education Challenge, where education spending did not fall significantly in response to the drought (UNICEF, 2021). In our setting there was no change in teacher absenteeism in these communities, meaning more students were being served by the same educational resources. At the same time, if there is a change in the number or type of students who are attending school, evidence suggests that this may introduce compositional or peer effects that can influence the outcomes of not only the student who is attending more or less often but also the outcomes of other students in the class (Epple & Romano, 2011; Sacerdote, 2011). Depending on the characteristics of which students’ attendance has changed, the impact that such effects have on average academic performance can vary.
Disassociation Between Schooling and Learning
The framework highlights how economic shocks and droughts lead to offsetting pressures working to increase and decrease school attendance and learning. The relative importance of the different channels of impact is likely highly context-specific and whether the aggregate impact is positive or negative is an empirical question. Of particular relevance for our analysis is the insight that aggregate attendance effects and performance effects need not move in the same direction. Even when a shock increases attendance (as in Shah & Steinberg, 2017; Zimmermann, 2020), it may simultaneously decrease performance due to the declines in per-pupil resources, asymmetric effects across individuals, or the effects of offsetting the impact of hardship and malnutrition on students’ ability to learn.
Recognizing the contributions of work by others, including Hanushek and Woessmann (2020a) and Hanushek and Woessmann (2020b), our framework recognizes that relying on measures of attendance as a proxy for learning may be problematic as a gain (or loss) in one does not automatically imply a gain (or loss) in the other. While this point has been acknowledged by others, including Hanushek and Woessmann, this practice is still observed in literature (e.g., Jensen, 2010; Stevens & Schaller, 2011).
These insights contribute to growing evidence that increasing school enrollment is not sufficient for ensuring gains in learning. There is a disassociation between educational attainment and learning from an empirical perspective, as explored by Bau et al. (2021), Crawfurd (2021), and Beatty et al. (2021), among others. Pritchett and Sandefur (2020), for example, show significant variation in learning gains from schools across countries but find that, on average, “only about half of women who completed grade 6 (but no higher) could read a single sentence.” Although we also highlight a disconnect between the quantity of schooling and learning, it may emerge in our framework even when the education system is normally effective at producing learning gains, as the same factors that contribute to children staying in school may also contribute to hardships, malnutrition, or other impacts that decrease their ability to learn.
External Validity
The conceptual framework has several notable features worth highlighting that affect how generalizable our findings likely are.
First, we present conceptual frameworks for both a general economic decline and one caused specifically by a drought. We show how generic economic shocks, even those not tied to agriculture, can have both positive and negative impacts on school attendance and enrollment and that the aggregate impacts can go in either direction. Thus, our main insights are not specific to droughts or those affecting food production but may apply to other shocks as well.
Second, extending the general economic shock framework to incorporate factors specific to droughts adds additional pathways through which the shock leads to malnutrition and financial hardship (e.g., affecting the availability and price of food) but does not change the three channels through which positive and negative academic impacts occur: (i) mental and physical hardship, (ii) willingness to work, and (iii) opportunities to work.
Third, the framework is not country-specific and may be applied anywhere facing an economic shock or drought. However, there may be differences across contexts in whether aggregate effects are positive or negative. Although insights from our analysis likely apply to other contexts, they may not apply to all other contexts.
Data and Identification Strategy
This analysis exploits the occurrence of a natural experiment to evaluate the impact of a drought on girls’ education outcomes. This natural experiment took place in rural Zimbabwe between 2015 and 2016, affecting different communities with varying degrees of severity. The most severe period of this drought was concentrated in the 2015–16 growing season (October 2015–April 2016). Throughout this period, the Improving Girls’ Access through Transforming Education (IGATE) project was also operational in rural Zimbabwe.
IGATE was operational between 2013 and 2016 and evaluation data was collected at “baseline (between October 2013 to February 2014) and “endline” between November to December 2016. An additional round of “midline” data was collected between June and August 2015 before the most severe part of the drought. The drought’s “creeping” effect is detectable during the 2014–15 growing season so the midline data would not be an appropriate base period for the main analysis; however, we adapt this as a robustness check in the results section.
Figure 2 shows the timeline of data collection alongside the timing of the drought. Importantly, the regions impacted by the 2015–16 drought had historically experienced very similar conditions to the areas that were not impacted in the same way. This is shown in Figure 3, which describes the variation in vegetation health using the Vegetation Health Index (VHI), a measure of drought severity. Here we observe that 2015–16 did not follow historical weather or drought patterns. The areas negatively impacted by the drought and the areas that were relatively unaffected had previously experienced similar vegetation since 1982, suggesting that the 2015–16 drought is an exogenous event. Since the project collected data on girls from both the drought-affected and unaffected areas before and after the drought, this timeline provides an ideal opportunity for a difference-in-differences approach, which we describe in the section on the data and methodology.
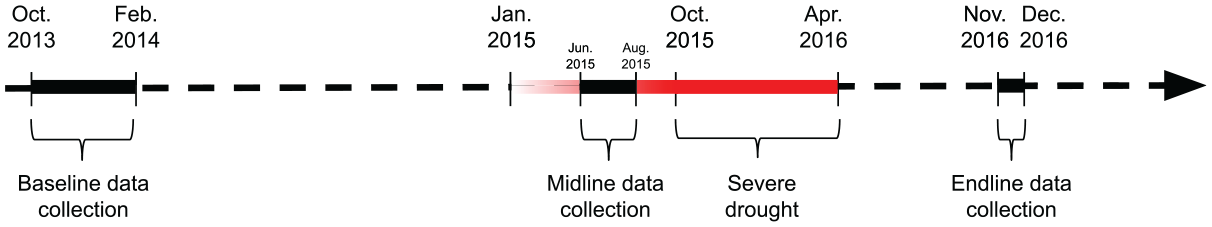
Drought and data collection timeline.
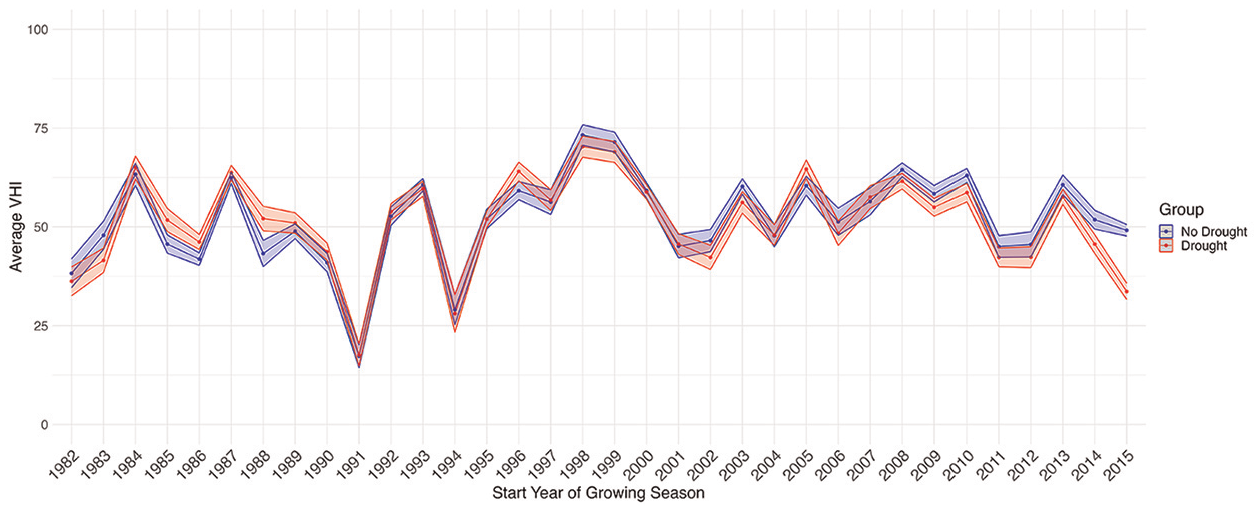
Average vegetation health index by growing season.
The data followed girls in 85 schools in rural Zimbabwe. Some locations were exposed to the IGATE programming, which involved a suite of treatments including a community engagement campaign and providing learning resources and curriculum updates. This paper will not focus on the impact of these interventions as the drought has impacted both IGATE treatment and IGATE control schools in an exogenous way. For an evaluation of the IGATE program’s impact, see Cotton et al. (2025). 7 Although we use the same data, the focus of the current paper is the impact of droughts rather than the IGATE programming. 8
Table 1 summarizes some of the main characteristics of girls in both drought-affected and unaffected regions. “Drought-affected” refers to girls living in a region where the change in vegetation health was at least 80% of its typical level. This is the common threshold for defining severe droughts (Aitekeyeva et al., 2020; Gumma et al., 2019; Kogan & Kogan, 2019). Throughout this analysis, we therefore measure the impact of the drought using the VHI anomaly, which is measured by the proportion of the 2015–16 VHI to the historical average, though we test the robustness of the findings to this measure in Online Appendix B. Based on the 80% threshold for this VHI anomaly measure, 30% of the sample lived in an area that did not experience a drought, with many communities experiencing a better-than-average growing season.
Summary Statistics by Drought Severity

Notes. This table shows the means and standard deviations (in parentheses) of the sample characteristics at baseline in areas that were affected by the drought and areas that were not, using an 80% VHI anomaly as the cutoff to define a drought. [b] indicates a binary variable: the mean is the percentage of girls with this characteristic. EGRA refers to the Early Grade Reading Assessment. EGMA refers to the Early Grade Mathematics Assessment. HH refers to “Household.” IGATE school refers to whether the student attends a school that received the “Improving Girls’ Access Through Transforming Education” interventions.
p < 0.10; **p < 0.05; ***p < 0.01.
Beyond the natural experiment described so far, the fact that there are no significant differences in what proportion of drought-affected and unaffected schools were IGATE schools allows us to conduct a secondary analysis evaluating whether education programs like IGATE impact student resilience during a drought. Previous work by Burde et al. (2019) has highlighted that evidence on the efficacy of education projects during crises—like droughts—is currently limited in the education literature. Our paper attempts to begin to fill this by examining whether the engagement campaigns and learning resources provided by IGATE can mitigate the impact of the drought. However, we do not find compelling evidence that these types of interventions improved student resilience during the 2015–16 drought in Zimbabwe.
Girls’ Education Data and Environment
Due to data limitations or operational constraints, evaluations of education projects in developing countries have traditionally focused on learning (e.g., performance on standardized tests), changes in enrollment, or attendance when measuring education outcomes. However, the IGATE project was funded through the UK government’s Girls’ Education Challenge (GEC), which has invested approximately £500 million in projects to improve access to and quality of education for girls around the world. The GEC had evaluation guidelines that required data on multiple outcomes be collected on all projects. The data collected for the IGATE program, therefore, includes details on all of these education-specific measures. By considering all of these dimensions, this paper offers a comprehensive view of the impact the drought had on girls’ education.
The data collected for the IGATE program includes performance on standardized literacy and numeracy assessments, measured using the Early Grade Reading Assessment (EGRA) and Early Grade Numeracy Assessment (EGMA), respectively (Gove & Wetterberg, 2011; Platas et al., 2014). Following the best practices for EGRA and EGMA, the literacy and numeracy tests were reviewed by local education partners and were piloted in schools before being administered to assess the validity and reliability of the assessments before beginning data collection (International NGO Training and Research Centre, 2014). These learning assessments have been shown to be valid in other evaluations in similar settings that experienced similar challenges during this time in Sub-Saharan Africa (RTI International, 2015). These assessments are administered in English, which is consistent with the language of instruction used in Zimbabwe. Across all districts in Zimbabwe and in all schools in our sample, English is taught beginning in the first grade (Unicef, 2017) and is the primary language of instruction beginning in the fourth grade.
IGATE follows the same girls over time, which makes it possible to identify if a girl successfully advanced in school (meaning they progressed to the next grade and have not dropped out). The sample also includes girls from both the IGATE treatment areas and the IGATE control areas, which we discuss in more detail later.
Although Zimbabwe has an automatic grade advancement policy, over 20% of children still repeat at least one grade before they leave school (United National Educational, Scientific, and Cultural Organization, 2012). Based on discussions with local education experts, in these communities, this typically occurs when students fail to attend regularly during the year, making this a proxy for attendance. This has also been documented by Muchemwa (2017) in other parts of Zimbabwe, noting that grade retention typically occurs upon the family’s request. 9
Tuition is not fully subsidized in Zimbabwe, and at the time of the drought, the compulsory school age required kids to stay in school until seventh grade, though this was not strongly enforced. During the period considered here, households were expected to pay both tuition fees and school levies, which tend to vary between schools. Though reliable statistics on the level of these levies are unavailable given their informal nature, details on tuition show that after grade seven in Zimbabwe, tuition fees increase from approximately $15/term to $50/term (USD) per child (Higherlife Foundation, 2018). This is a significant burden on households, who have an average of four children per household, and where the average GDP per capita is $1,080 (World Bank, 2018). To avoid selection issues that may arise by including children who have already passed the jump after grade 7 where tuition fees increase, the analysis includes only girls who were in primary school at baseline.
Table 1 also shows that approximately 10% of the baseline sample was lost to attrition, and this did not differ significantly between areas that were or were not affected by the drought. To test the effect of this attrition on our results, in Online Appendix C we test whether the drought predicts whether or not a student could not be found and find no evidence that the drought significantly predicts attrition status. Note that if a student had dropped out of school, they would still be recontacted for the study. Typically, if a student was attrited from the sample, it was because they had moved away and could not be located.
Detecting Droughts Using Satellite Data
Although there are many different definitions of what constitutes a drought, it is well established that lack of rainfall alone is not sufficient to categorize a weather event as a drought since areas with both high and low rainfall levels can experience drought events (AghaKouchak et al., 2015; Wilhite & Glantz, 1985). Instead, a drought must involve a deviation in both rainfall levels and the amount of moisture evaporation from soil and plants into the atmosphere (Wilhite & Glantz, 1985). In recent decades, there have been advances in technologies that allow for remote sensing to measure droughts quickly and accurately. This paper employs data from some of these technologies. Specifically, we use satellite observations of vegetation health collected by the National Oceanic and Atmospheric Administration’s (NOAA) Centre for Satellite Applications and Research (STAR).
This data includes weekly observations captured by NOAA’s fleet of polar-orbiting satellites, including the Advanced Very High Resolution Radiometer (AVHRR), used between 1981–2012, and the Visible Infrared Imaging Radiometer Suite (VIIRS), used since 2013 (Kogan et al., 2015; NOAA Centre for Satellite Applications and Research, 2019). The vegetation health satellites collect weekly, 4 km-squared observations of the entire globe dating back to 1981. 10
These observations are used to measure several standard measures of vegetation health including the Vegetation Condition Index (VCI), Temperature Condition Index (TCI), Vegetation Health Index (VHI), Soil Saturation Index (SSI), Fire Risk Index, and two versions of the Normalized Difference Vegetation Index (one with noise corrections and one without). These are all well-established measures of ecological droughts, based on remote-sensing measures that detect either plant coloration, temperature, surface moisture, and other reflective-thermal indicators, and all are commonly used to measure droughts (AghaKouchak et al., 2015; Faridatul & Ahmed, 2020; Frischen et al., 2020). A survey paper by AghaKouchak et al. (2015) provides a detailed description of how these indices are measured:
•
•
•
•
To estimate the drought specific to Zimbabwe, weekly data was collected, and we calculated the average VHI in the 2015–16 growing season and the historical average VHI for all seasons between the 1981–82 growing season up to the 2014–15 growing season. For each 4 km pixel,

where (
As shown in Figure 3, prior to the 2015–16 drought, drought patterns had been very similar. This indicates that until this drought, the two regions did not experience systematically different drought activity and that this current drought is random in this context.
Figure 4 shows the VHI anomalies across Zimbabwe, where values below 0.8 indicate a drought using the measure defined in equation 1. Note that the drought measures are available at the school level since household location details are not available in the data. However, the data does include information on the students’ walking time to school. The median time to school is 30 minutes, with more than 75% of students living within 45 minutes of school. Even at a conservative estimate of 8 km/hr based on Cavagna et al. (1983) for walking pace for children in this age group, this would suggest that the median student is within 2 km walking distance to school; 75% of students would be within 3 km of school by walking distance. This is longer than linear distance, which would suggest that most households live relatively close to these schools, making the school-level drought intensity measure an appropriate proxy for household drought intensity.
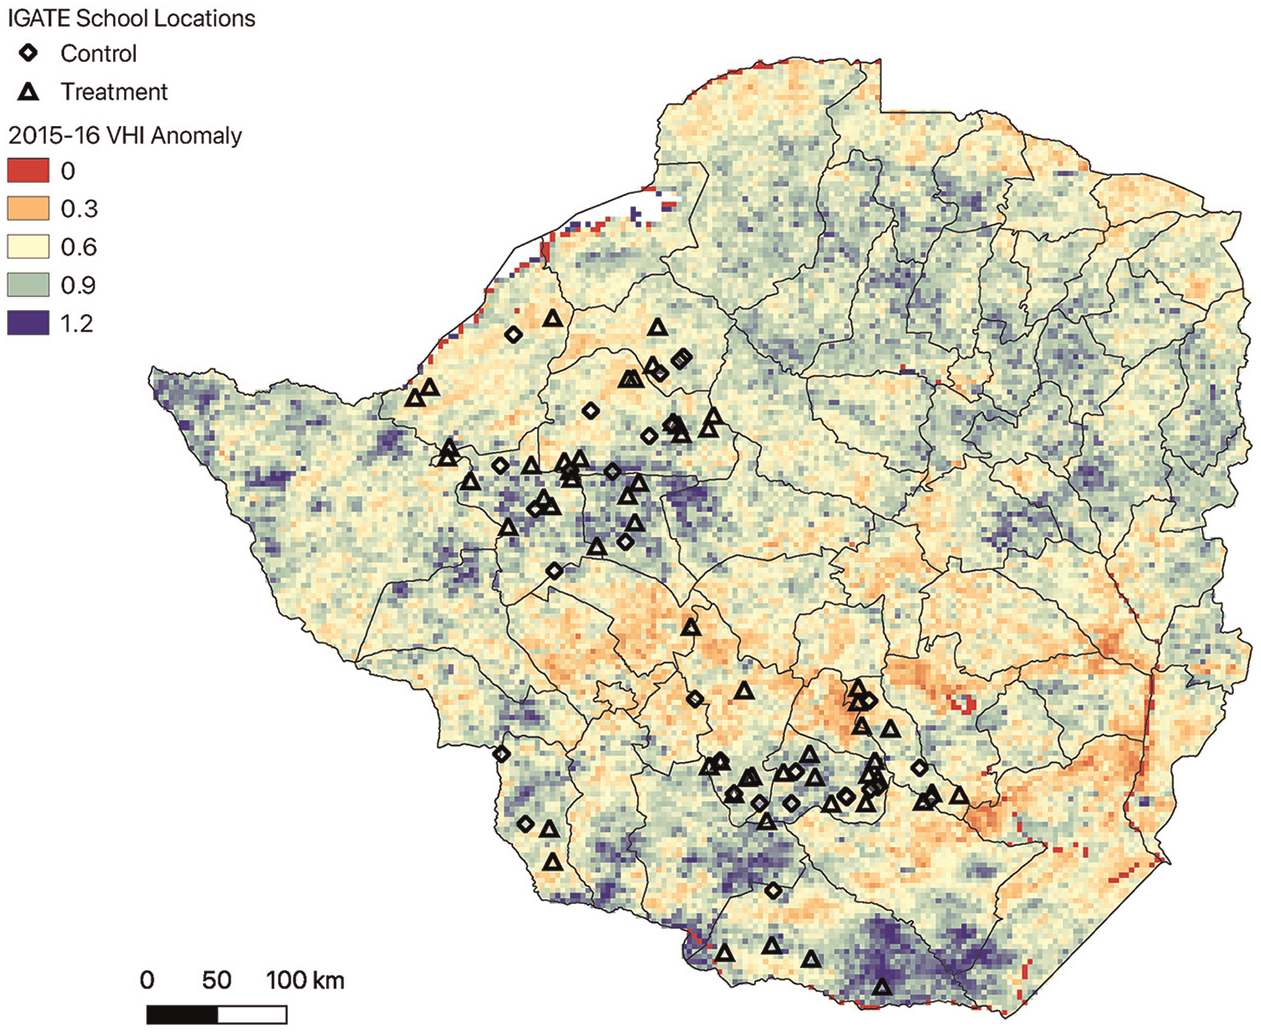
Vegetation health anomaly and school locations in 2015–16.
In drought-affected areas, the drought was more severe, with vegetation health falling to 63% of usual levels. 12 In unaffected areas, vegetation health was 95% of the usual level. This is not surprising since this difference is a direct consequence of how the drought threshold has been defined. However, what is important to note from this table is that a significant proportion of the sample experienced a typical (or better-than-average) year. Specifically, 31% of the sample live in regions where vegetation health improved in the 2015–16 growing season or fell by less than 20%. 13
This measure will allow us to measure the causal impact the drought has on a more diverse set of educational outcomes than has previously been explored in the literature. Although our measure allows us to isolate the unexpected changes in weather, it is also important to note that the areas more severely hit by the 2015–16 drought are not historically more vulnerable to droughts or poorer weather conditions than the unaffected areas. 14
Table 1 summarizes the differences of some key characteristics of both the “Drought” and “No Drought” groups at baseline. Prior to the drought, there was no significant difference between age, disability status, or chore time across the groups. There are no significant differences in the baseline test scores of children in these two areas.
Drought Details
Within Zimbabwe, this drought was particularly devastating. According to USAID’s Famine Early Warning Systems Network, Zimbabwe had the highest national cereal deficit in the region. Over a quarter (26%) of Zimbabwe’s population experienced food shortages at some point during the drought, and harvests were on average about 50% lower in the 2015–16 growing season than the previous year (Famine Early Warning Systems Network, 2016). However, the drought did not affect the entire country equally. This is shown in Figure 4, which highlights the areas that experienced an unusually dry growing season. This map has been overlaid with the IGATE school locations, showing there are both drought-affected and unaffected areas in regions where data collection took place.
In the drought-affected regions, incomes fell as a result of agriculture and livestock collapse, and food shortages were common in rural areas (Famine Early Warning Systems Network, 2016). The IGATE project only includes households located in rural areas in Zimbabwe, which are highly dependent on subsistence farming and small-scale agricultural production to support households’ livelihoods (Famine Early Warning Systems Network, 2014; Food and Agriculture Organization of the United Nations, 2013). According to a report by Zimbabwe’s Food and Nutrition Council, and the Food and Agriculture Organization of the United Nations, between 70–75% of households’ food comes from their own crop production in the regions the IGATE schools are in (Food and Agriculture Organization of the United Nations, 2021; Food and Nutrition Council, 2011), meaning that households in drought-affected regions will be less able to meet their households’ basic nutrition needs.
Although most of the country did experience significant declines in agricultural output, this did not correspond to a change in funding for the education system in Zimbabwe (UNICEF, 2021). This is apparent in the data from the project as well, which shows that areas affected by the drought were no more likely to experience teacher absences. Within this context, teacher absences are typically a consequence of limited resources within the education system as teachers go unpaid or underpaid, as was the case in 2019 and 2020 before the COVID-19 pandemic. However, in the Online Appendix, Table A.3 shows that the drought did not lead to systematic differences in teacher absences, suggesting the drought did not lead to systematic differences related to educational resources that could potentially have mediated the effects described here.
Identification Strategy
This paper considers two types of education outcomes. The first class of variables involves binary indicators for “progression” (sometimes referred to as “advancement”) outcomes that identify if an outcome has occurred between the base and end periods. This includes indicators for whether a girl has repeated a grade or stayed enrolled. Although it has already been noted that Zimbabwe does have an automatic progression policy to move children to the next grade regardless of their ability to demonstrate that they have met the learning requirements, over 15% of the population sampled in this analysis have repeated a grade between the baseline and endline sample periods so we will look at this outcome specifically.
If this evaluation strategy finds that girls are more likely to have successful transition outcomes, this would support the concept that when a drought makes agricultural households less productive, the opportunity cost of education falls, leading households to send their children to school more often during the drought. However, if this evaluation finds evidence that progression gets worse, this would support the idea that when households become financially constrained because of the drought, they are either unable or unwilling to send their child, specifically their daughters in this case, to school. The specification for this part of the analysis is:

where
The second class of outcomes includes variables that change over time. This includes test scores. The impact of the drought on these aspects of girls’ education will be measured using a difference-in-differences (“DD”) approach using the following two-way fixed effects specification:

Some areas began to experience unusually dry weather toward the end of the 2014–15 growing season (i.e., spring 2015). Since midline data collection took place during this 2014–15 growing season, the baseline data collected between October 2013 and February 2014 is used as the first time period in the DD setup and endline data as the second time period.
Since the assignment of the drought here is naturally exogenous, any differences in changes in outcomes found between drought-affected areas and unaffected areas can be interpreted as caused by the drought. The mechanisms that moderate the relationship between the drought and these outcomes will be discussed more thoroughly in the following section.
Results
Progression
Here we consider the impact that the drought has had on enrollment in formal education and grade repetition. Although at baseline 100% of girls were enrolled in school, the identification strategy described above can estimate the probability that a girl stayed enrolled after their community experienced drought conditions, compared to households that did not.
While we do not observe any significant impact on enrollment, columns (3) and (4) of Table 2 show the marginal effect of being in a household affected by this exogenous shock on the probability that a girl would repeat a grade by endline. Every 1 percentage point (pp) decline in agricultural conditions from the 2015–16 drought is associated with an 0.17pp decrease in the probability that they will repeat a grade. Practically speaking, this means that if a drought caused vegetation health to be only 90% of what it is in a typical year, girls in this area are 1.7pp less likely to repeat a grade than a girl in a region that was unaffected by the drought. The same girl in a region that experienced 110% of its usual vegetation health (meaning 2015–16 was better than an average year) will be 1.7pp more likely to repeat a grade. This is consistent with a state where the opportunity costs of schooling are the main barrier to girls continuing their schooling. When there is a drought, girls are more likely to progress to the next grade.
Impact of Drought on Progression Outcomes
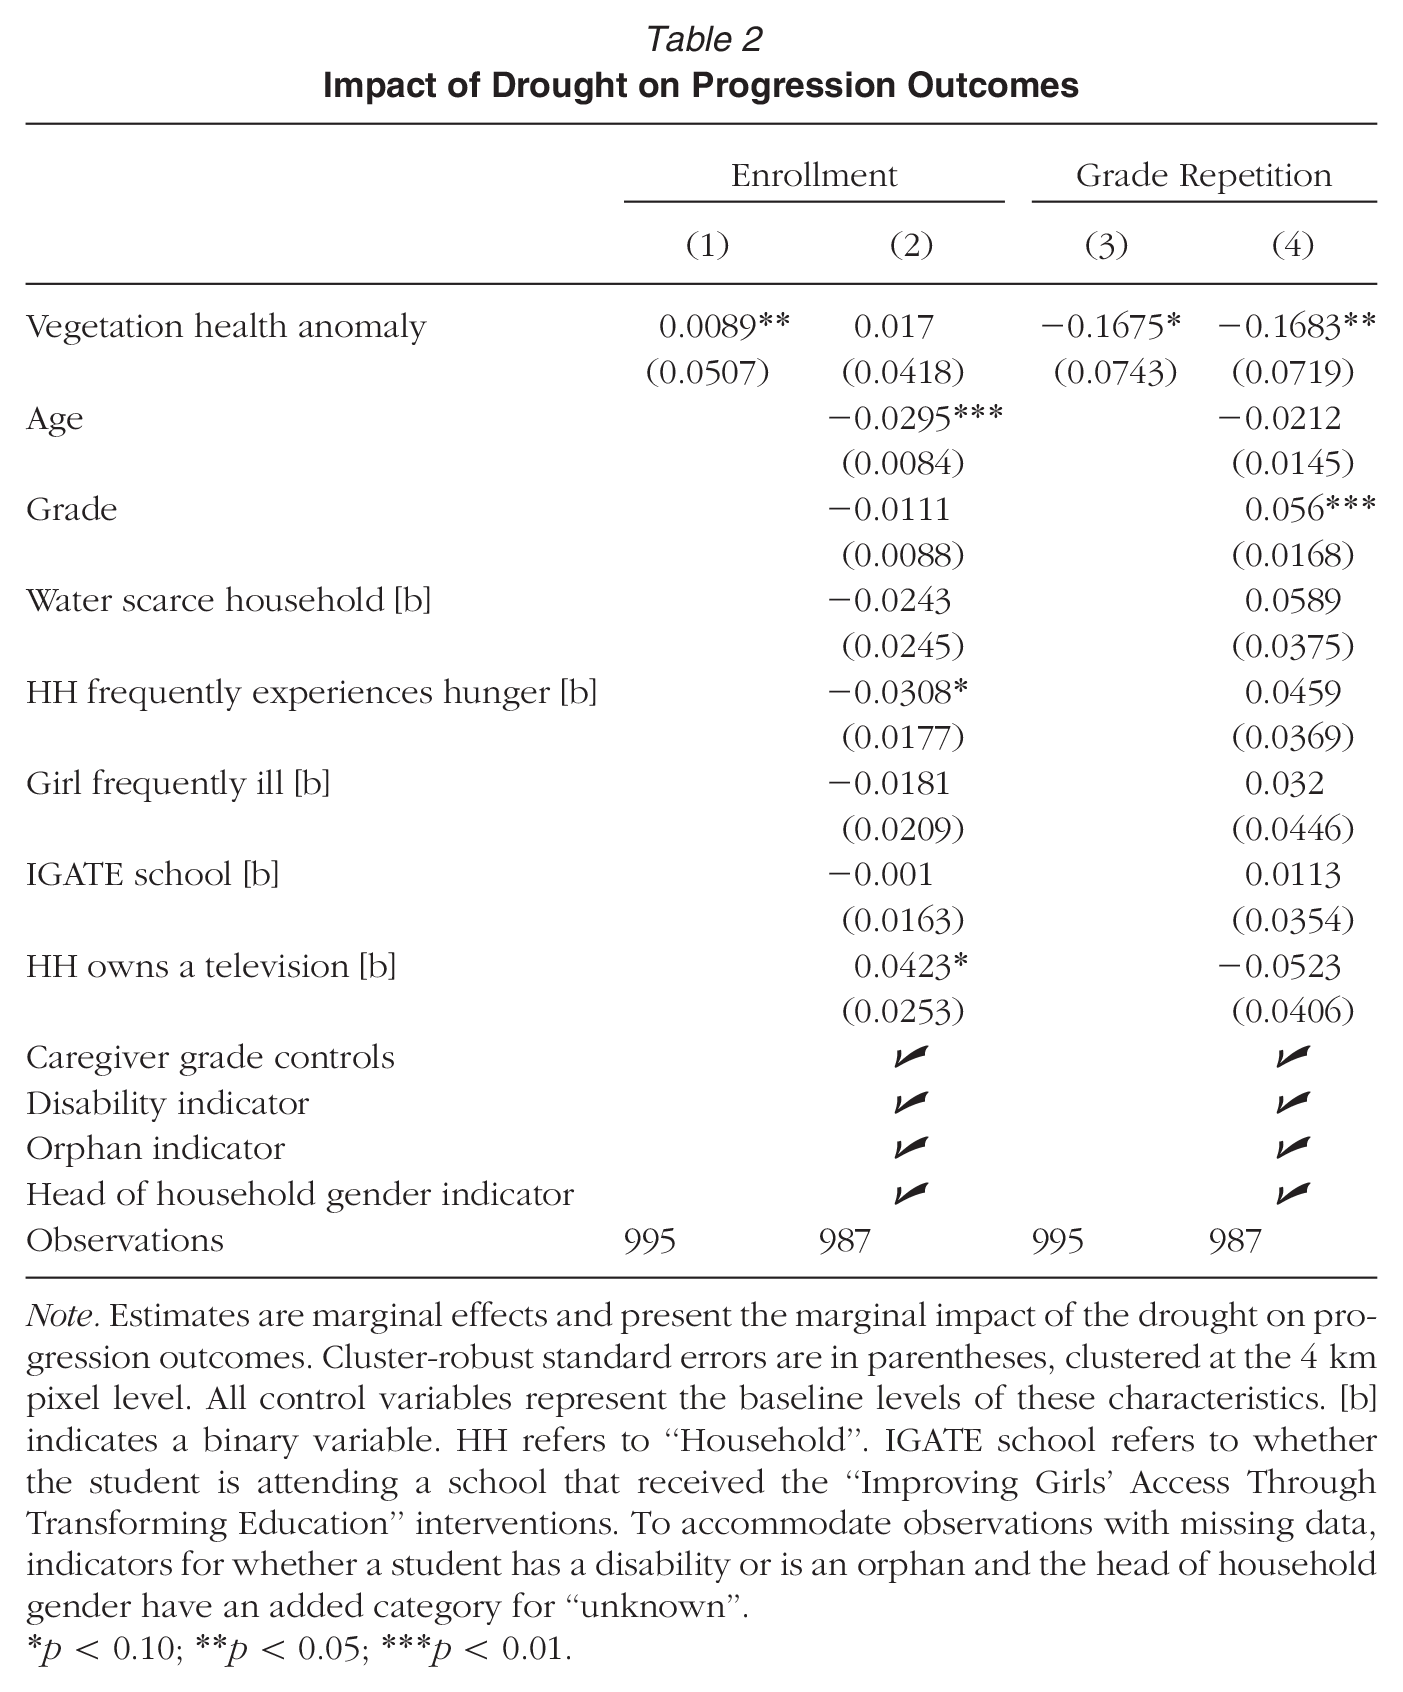
Note. Estimates are marginal effects and present the marginal impact of the drought on progression outcomes. Cluster-robust standard errors are in parentheses, clustered at the 4 km pixel level. All control variables represent the baseline levels of these characteristics. [b] indicates a binary variable. HH refers to “Household”. IGATE school refers to whether the student is attending a school that received the “Improving Girls’ Access Through Transforming Education” interventions. To accommodate observations with missing data, indicators for whether a student has a disability or is an orphan and the head of household gender have an added category for “unknown”.
p < 0.10; **p < 0.05; ***p < 0.01.
While we do not have data on boys, it is possible that the positive impact of the Zimbabwe drought on progression may also extend to boys. Other evidence from Woldehanna et al. (2009) finds that after droughts, male and female children were impacted in the same direction, but that boys were affected more strongly. In their study in Ethiopia, all children experienced declines in enrollment after a drought, and the impact was larger for boys. We cannot determine the direction of the impact on boys here; however, if boys’ attendance is more sensitive to droughts, then based on our conceptual framework, we can expect that any change in male attendance may introduce peer effects that could affect education outcomes for their female peers. For example, if boys are more likely to drop out during a drought, this could free up household resources to be allocated to female children’s school fees. This potential mechanism would be captured by our measures of impact for girls.
Since we know that progression is a function of attendance, this suggests that opportunity costs associated with chores and work are what influence the decision about whether or not girls attend school and ultimately progress to the next grade. In Table A.2 in the Online Appendix, we consider the changes in chore burdens between baseline and endline. We observe that a 1pp decrease in agricultural conditions from the 2015–16 drought led to a significant decrease of 5.8pp in the likelihood that a girl is spending more time on agriculture-related chores (alternatively, girls in areas with better than usual vegetation health spent significantly more time on agriculture chores). The drought led to no change in other business-related chores, which would not be dependent on their household’s agricultural productivity. The drought also led to a similar decrease in the time that girls spent on domestic chores such as housework and caring for other children in the household. In Online Appendix D, we conduct a formal mediation analysis to determine the change in progression outcomes and find that the decrease in repetition rates is at least partially mediated by the decrease in household chores. Together, this is suggestive evidence that severe droughts (like the one observed in 2015–16) remove the incentive to keep children home to support farm-related activities and other household chores that would have otherwise prevented children from progressing in school.
The impact of the drought on girls’ progression depends on how vulnerable their community has been to droughts historically. Historical drought patterns incentivize vulnerable communities to develop coping strategies (Bola et al., 2014). To explore the role historical drought vulnerability has on this relationship, we’ve separated the sample into quintiles based on their historical average Vegetation Health Index across all recorded growing seasons (1981–2015). Estimating equation 2 by quintile, we see in Figure 5 that there is a U-shaped pattern for the relationship between droughts and enrollment outcomes. This suggests that the consequences are the most severe in areas that are the most and least susceptible to droughts. Specifically, in areas with the worst historical vegetation health, we see that drought leads to a significant increase in enrollment. We see a similar (but smaller) increase in enrollment for areas that have had the best historical vegetation health.
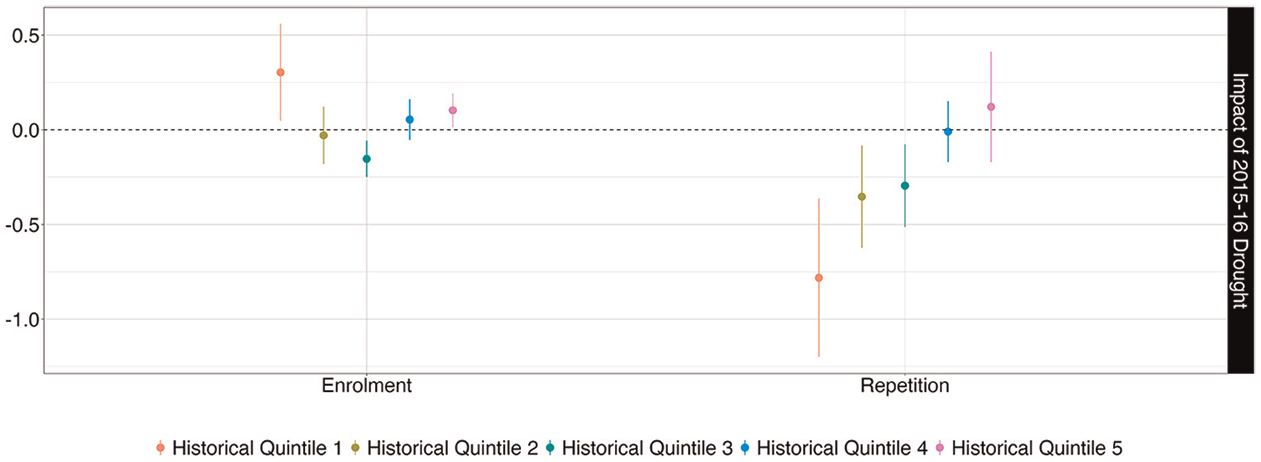
Progression estimates by historical VHI quintile.
Looking at repetition outcomes, we find that girls from households in areas with the worst historical vegetation health have the best outcomes when their household experiences a drought (alternatively, they are the most likely to repeat a grade if the household experiences a positive vegetation health shock). This is evident in Figure 5. While some of the confidence intervals for some quintile effect size estimates overlap, the size of the drought’s impact appears to shrink as we shift toward regions with better historical vegetation conditions.
Considering the regions studied here are mostly agrarian, it is expected that areas with worse vegetation health historically would be financially poorer. Although our data do not capture household income, we do observe what assets each household has. For example, households in areas with better historical vegetation health are more likely to own a television. This can be seen in Figure A.2 in the Online Appendix.
The pattern of these coefficients suggests that poorer households who have historically worse vegetation health are the most sensitive to either drought or an unusually productive agricultural season. This has several policy implications. If the poorest areas are most sensitive to environmental fluctuations, then girls from households in these areas are more likely to go to school more often during a drought and may require less direct intervention if policymakers are trying to get more learners in schools. But they are also more likely to be encouraged to stay home when resources are less constrained. If policymakers or development agencies are trying to increase the number of girls who attend school regularly, then environmental conditions should be taken into account to better target resources. Based on the conceptual framework we described in above, this could include the delivery of school feeding programs to combat hunger associated with droughts, as well as additional resources to support teachers and school administrators if the number of students in schools increases in response to the drought.
Learning
In this section, we exploit the variation created by the drought detailed earlier to estimate the impact that this had on learning outcomes, including literacy and numeracy. Table 3 summarizes these results, looking at the impact on both literacy and numeracy using test scores from the Early Grade Reading and Mathematics Assessments. Overall, we find no impact on either literacy or numeracy despite the increase in progression observed previously. 16 This is consistent with the discussion of the conceptual framework, which identified many possible channels through which a drought could influence education, including fewer resources being available per student if more students are progressing in school after a drought.
Impact of Drought on Learning

Note. Coefficients represent the estimated impact of the drought on literacy and numeracy test scores using a difference-in-difference estimation strategy. Columns (1) and (3) use a standard differences-in-differences approach, with controls for baseline characteristics. Columns (2) and (4) use a two-way fixed effects specification with time-varying controls for age. Cluster-robust standard errors are in parentheses, clustered at the 4 km pixel level.
p < 0.10; **p < 0.05; ***p < 0.01.
This holds true even when we separate the results according to historical drought exposure, as shown in Figure 6, which is based on quintiles of historical vegetation health between 1982 and the end of the 2014–15 growing season. While the region’s historical drought patterns do matter when we consider the impact of drought on enrollment and progression, we do not observe a similar relationship between historical drought patterns and the impact of drought on learning outcomes.
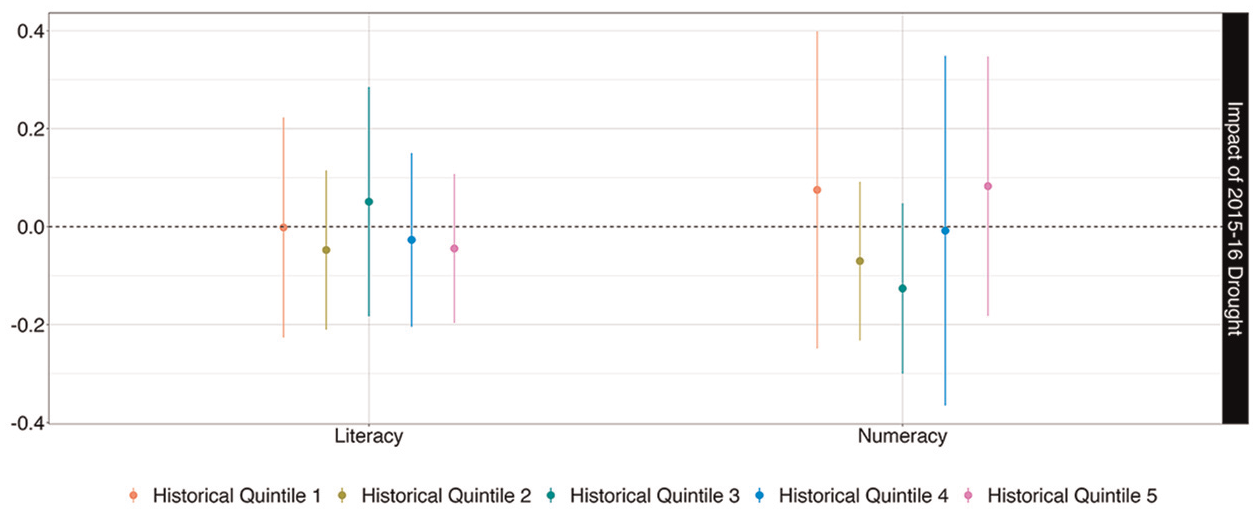
Impact on learning by historical VHI quintile.
Despite attending school more frequently when their household is experiencing a drought, these learners do not learn more overall. We also do not find statistically significant evidence that the distributions in test score changes are significant between the drought-affected and unaffected areas. This can be seen in Figures A.4 and A.5 in the Online Appendix.
Based on our conceptual framework, we know that food and vitamin insufficiency is typically associated with poorer performance on academic assessments (Alderman et al., 2006; Maccini & Yang, 2009; Taras, 2005). When we consider students who come from households who regularly experienced hunger before the drought and are therefore the most nutritionally vulnerable if there are additional shocks to their subsistence-dependent food supply, we see that the drought does have a negative impact on literacy outcomes for these students.
Table A.4 in the Online Appendix shows that a 1pp decline in agricultural conditions from the 2015–16 drought is associated with a 0.13pp decrease in literacy test scores for girls from households who were experiencing food insecurity before the drought. Alternatively, a 10pp decline in agricultural conditions is associated with a 1.3pp decrease in literacy test scores, which is equivalent to a 0.11 SD improvement. We do not observe a similar change in numeracy scores.
Program Interaction
The timing and distribution of drought-affected communities within the IGATE evaluation data also provide an opportunity to assess whether the drought had differential impacts in IGATE and non-IGATE schools. This will provide insights into the efficacy of the IGATE program in mitigating the impact of the drought. The evaluation of the IGATE program found that its engagement interventions were effective in improving education outcomes overall (Cotton et al., 2025). Here, instead, we estimate the impact of the drought on students in IGATE schools and students in non-IGATE schools. As Figures A.6 and A.7 in the Online Appendix show, there are no significant differences in the impact of the drought on either progression or learning outcomes for students in IGATE schools and students in non-IGATE schools. While students in IGATE schools do appear to have slightly lower repetition rates after exposure to the drought than non-IGATE students, we cannot conclude there is a significant difference in how the drought is affecting these groups.
Together, we interpret this as suggestive evidence that the interventions provided by IGATE did not specifically make students’ education outcomes more resilient to the drought, which may be expected since the program was not designed to focus on this. However, this finding may be useful for organizations working on improving education in similar emergency situations for which there is currently a limited body of literature available to inform program design. This also lends support to our interpretation of the main findings since it does not appear that the impact of the drought would be mitigated by the presence of the underlying program for which the data was collected.
Sensitivity to Timing
The analysis so far has treated the data collected at baseline as the starting period for the analysis. In this section, we adapt this to use the midline data as the base period. While the 2015–16 growing season was certainly the most significant and widespread drought that Zimbabwe had experienced in over two decades, the previous growing season also experienced poorer agricultural performance. This is demonstrated in Figure 3, which shows that the observed vegetation health was already beginning to diverge between drought-affected and unaffected areas in early 2015.
In this section, we exploit the data collection schedule followed by the IGATE project. Additional “midline” data was collected between the 2014–15 and 2015–16 growing seasons, which allows us to test the timing of household responses to the 2015–16 drought.
The nature of droughts means that they are inherently “creeping” phenomena, meaning the impacts of drought are experienced gradually (Liu et al., 2015; Wilhite & Vanyarkho, 2000). In this case, the consequences of the drought would not be expected to be isolated to the period when the drought was most severe as households adapt to early warning signals that a drought is approaching (such as decreased rainfall, increased temperatures, and declines in agricultural productivity). However, the exact timing in responsiveness to droughts is not well established in the literature, and previous research on the relationships between climate and education has not been able to exploit this kind of variation.
When we adjust the timing of our analysis, we find that much of the drought’s impact was starting to become apparent before the 2015–16 growing season began. The fact that the drought could start to be felt by households before the 2015–16 growing season explains why the results do not necessarily hold when we use the midline data as our starting period. The drought was already beginning to impact households during the end of the 2014–15 growing season, which may have led to changes in behavior that affect educational outcomes. Table 4 shows the marginal change in repetition rates between baseline to midline and midline to endline. We observe a significant decrease in repetition rates before midline, when the first signs of the drought were becoming apparent, with smaller but statistically insignificant declines in repetition after midline, when the more significant part of the drought took place. This suggests that students respond very quickly to the first signs of drought and that these changes persist as the drought progresses.
Timing of Impact on Grade Repetition
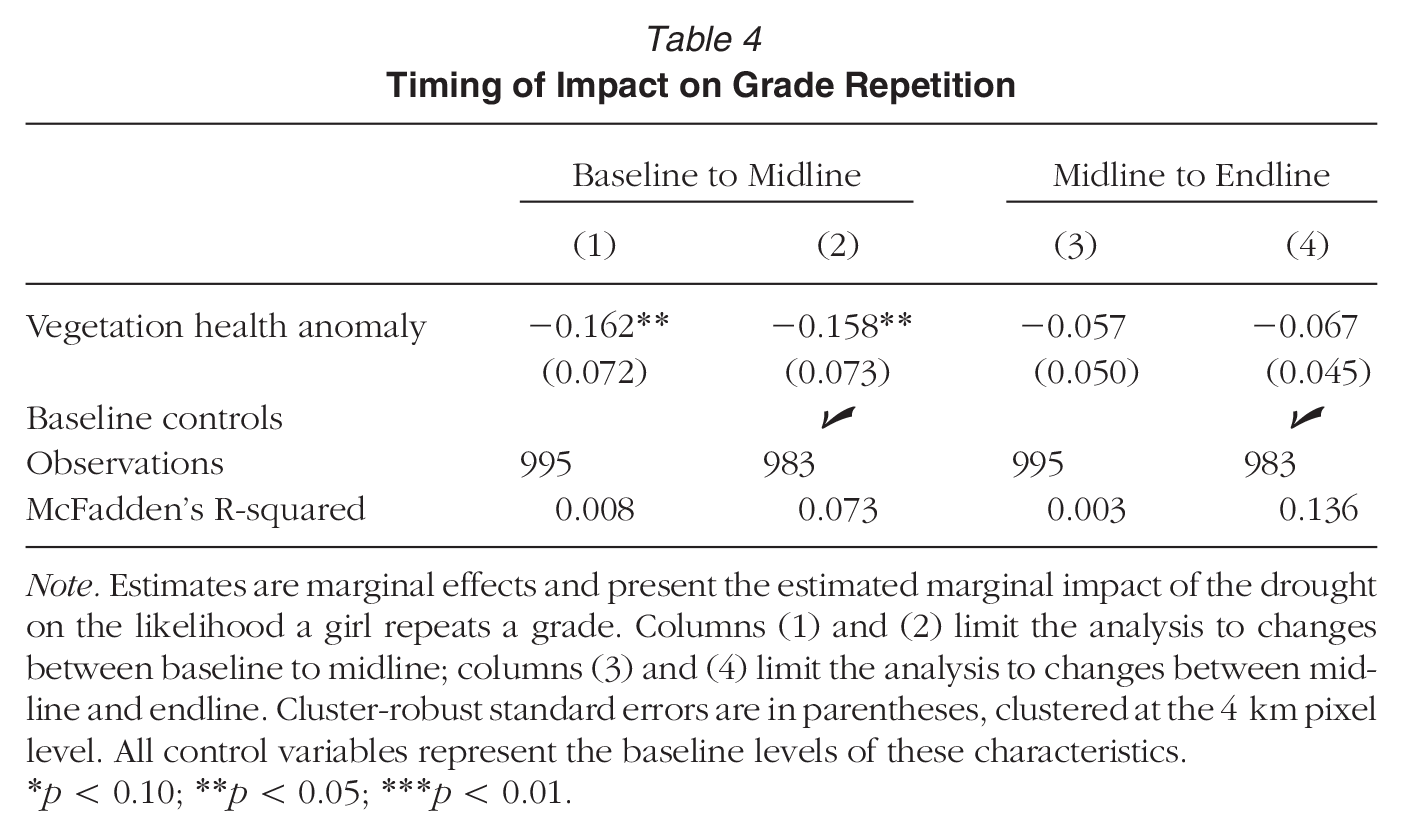
Note. Estimates are marginal effects and present the estimated marginal impact of the drought on the likelihood a girl repeats a grade. Columns (1) and (2) limit the analysis to changes between baseline to midline; columns (3) and (4) limit the analysis to changes between midline and endline. Cluster-robust standard errors are in parentheses, clustered at the 4 km pixel level. All control variables represent the baseline levels of these characteristics.
p < 0.10; **p < 0.05; ***p < 0.01.
Using midline data as our starting point, we again find no evidence of a significant impact on learning outcomes overall when we separate the impact between baseline to midline and midline to endline, as shown in Tables A.5 and A.6 in the online appendix.
Combined with our main results, this suggests that households respond very quickly to changes in vegetation health and that these changes persist throughout the drought. Based on the findings presented in Table 4, students repeated grades less often immediately after the drought began to take hold at the beginning of 2015. We know from Table A.4 that learners from households that had already experienced food insecurity before the drought experienced significant declines in learning. Based on our conceptual framework, we know this could be due to a multitude of factors, including malnutrition, psychological stress, and inadequate resources in schools from higher attendance, which are all possible consequences of a drought. Many Zimbabweans were already experiencing food insecurity by May 2015, before the most severe portion of the drought had taken place (Dzirutwe, 2015).
By the time the 2015–16 growing season began, millions of dollars of food aid had been sent to Zimbabwe in response to this, which may explain why most of our findings are not concentrated to the 2015–16 growing season. It is possible that some other event that was unrelated to the drought was also taking place in these regions before early 2015, which would explain why households in these areas are more likely to send their daughters to school. However, we think this is unlikely based on our review of contemporaneous news articles from the region during this period, as well as consultations with multiple local experts, which indicate that the drought is the only systematic change that all of these communities would have faced.
In Online Appendix F, we conduct a placebo test to determine if the differences in outcomes would have been predicted at baseline (i.e., before the drought even occurred). If we assume the drought had already taken place before baseline, this does not significantly explain any difference in baseline levels of outcomes we consider in the paper (literacy, numeracy). Progression outcomes cannot be included in this analysis, since by construction, everyone in the sample was enrolled at baseline, and we cannot accurately determine if someone had repeated a grade before baseline with the available data.
Conclusion
The severe drought that affected a large part of Zimbabwe in the 2015–16 growing season led to more girls progressing through school. We show that children in drought-affected areas also spent less time on chores and activities that helped support the household, which lends support to the idea that the drought reduced work opportunities for adults and children in the communities, keeping girls in school. Learners from the poorest areas were the most sensitive to these fluctuations.
The drought, despite increasing the amount of schooling, did not lead to a significant average change in learning, as demonstrated by performance on standardized tests. However, girls who were already experiencing food insecurity before the drought showed declines in learning despite attending school more often.
Our conceptual framework shows how economic shocks and droughts impact attendance and learning through numerous channels. The lack of work opportunities can help keep students attending school. However, financial hardship and reduced food access may lead to learning losses that more than offset any learning gains associated with more schooling. Our analysis contributes to emerging literature highlighting a disassociation between the quantity of schooling and learning (e.g., Pritchett & Sandefur, 2020).
The analysis has several implications for the research literature and for policy. First, through its conceptual framework and results, the paper clearly illustrates why student attendance or enrollment is a poor proxy for student learning. We show that during an economic shock or drought, increases in attendance in no way guarantee increases in learning. This insight has implications for the evaluation literature, which often relies on enrollment and progression (without data on learning outcomes) to assess the impact of a program or policy on student outcomes.
Second, the paper highlights the advantages of using satellite data to measure agriculture shocks and development program data to assess aspects beyond the programs themselves. We provide a methodology for future researchers interested in using satellite data. Additionally, development programs and projects are collecting more and better data on education, health, and economic outcomes than ever before. Often, this data is forgotten after the endline performance evaluation conducted by the funder or implementer. However, such data may be well-suited to provide insights beyond just their intended program evaluation to the extent that they were collected during periods of unexpected shocks or broader policy changes.
Third, our analysis may provide guidance on the best allocation of additional resources to support education during an economic or drought. Among other things, the results suggest that preventing at-risk kids from leaving school during a crisis may not be enough to prevent the crisis from causing these students to fall further behind. To the extent that shocks increase school attendance while decreasing learning gains, this suggests that increasing subsidies or financial incentives to support education enrollment may not result in substantial benefits. Based on our conceptual framework, we expect that resources may be more effectively allocated to providing direct food and financial assistance to families to reduce the hardships faced, to ensure that schools have the resources necessary to maintain quality as enrollments increase, and to provide school meal programs directly to children, which were not available to the schools in our sample during this period.
The conceptual framework suggests that the impact of shocks on attendance and learning may be highly context dependent. Additional research is required to understand the extent to which the impacts of droughts on girls in Zimbabwe extend to boys and other contexts.
Supplemental Material
sj-pdf-1-aer-10.3102_00028312251331025 – Supplemental material for The Impact of a Severe Drought on Girls’ Attendance and Learning
Supplemental material, sj-pdf-1-aer-10.3102_00028312251331025 for The Impact of a Severe Drought on Girls’ Attendance and Learning by Ardyn Nordstrom and Christopher S. Cotton in American Educational Research Journal
Footnotes
Notes
A
C