
Abstract
In this paper we use novel data to test the direct and indirect paths between teacher self-efficacy and student outcomes. This includes how teacher self-efficacy is linked to student, teacher, and expert rater views of lesson quality. Our results illustrate how the link between teacher self-efficacy and instructional quality is sensitive to how lesson quality is measured, with large effects when based on teacher reported outcomes but no association when based on the ratings of expert observers. Virtually no relationship is found between teacher self-efficacy and student outcomes. We thus conclude that while there is probably some positive association between teacher self-efficacy and the quality of their instruction, the strength of this relationship is relatively weak.
Introduction
Teachers are perhaps the most valuable resource available to schools. Multiple studies have shown how students taught by the “best” teachers make substantially more progress over the course of an academic year than their peers taught by an “average” teacher (Hanushek, 2011). Despite relatively few observable characteristics proven to be robustly associated with teacher quality (Hanushek & Rivkin, 2006), nevertheless, there has been extensive research into teacher effectiveness and school improvement. This vast literature has covered a wide array of topics, including teaching methods (Savelsbergh et al., 2016), personality characteristics (Rushton et al., 2007), various aspects of the workplace environment (Sims, 2020), and the role played by school leadership (Yeigh et al., 2019).
One such issue is the potentially important role of teacher self-efficacy. Put simply, this is the idea that teachers who believe that they have the capacity to influence student outcomes tend to be more effective in their jobs. Students’ learning—and their broader socioemotional development—is then enhanced as a result. Educational psychologists have long promoted this idea, drawing on the theoretical foundations laid by Rotter (1966) in locus of control and Bandura's work on self-efficacy (Bandura, 1977).
Yet, the empirical evidence regarding the link between teacher self-efficacy, teacher effectiveness, and student achievement remains mixed (Lauermann & ten Hagen, 2021). Several studies have reported there to be a positive—and substantively important—relationship. For instance, in their meta-analysis, Klassen and Tze (2014) reported the relationship between teacher self-efficacy and teaching effectiveness to be of “practical, as well as statistical, significance” (p. 72). Burić and Kim (2020) supported this view, with their study of 94 high school teachers emphasizing “the robustness of the positive link between teachers’ self-efficacy and instructional quality” (p. 9). Likewise, a recent study by Perera and John (2020)“yielded support for the main propositions that teachers’ self-efficacy beliefs play a role in classroom interaction quality, students’ achievement, and their job satisfaction” (p. 11). Others, however, have reported there to be very small—or otherwise null—results. For instance, Jerrim et al. (2023) reported “clear and consistent findings of null effects” (p. 220). Zee and Koomen (2016) noted how “many scholars have come to claim that teacher self-efficacy is a particularly powerful predictor of students’ academic adjustment” (pp. 1008–1009) but go on to caution that “the body of research looking into this specific relationship is not nearly as large as can be expected from this general assertion” (p. 1,009) and that most evidence “seem[s] to be theoretical in nature [rather than empirical] (p. 1,009). Lauermann and ten Hagen (2021) argued that the evidence of a link between teacher self-efficacy and student-reported lesson quality (along with other outcomes) is particularly thin.
This paper contributes novel evidence to this ongoing debate by drawing on data from eight countries that took part in the 2018 Teaching and Learning International Survey (TALIS) Video Study (OECD, 2019). The particularly rich nature of these data allows us to provide unique evidence on the relationship between teacher self-efficacy and a wide array of student outcomes. Critically, we are also able to explore the potential mechanisms via which teacher self-efficacy is thought to influence student achievement, including whether more confident teachers deliver lessons of higher quality (based on multiple criteria and perspectives). While we are unable to establish whether teacher self-efficacy, instructional quality, and student outcomes are causally related, we can address several other limitations with the existing evidence base. In particular, we address the criticism made by Lauermann and ten Hagen (2021), who noted how there is a paucity of empirical evidence investigating “the associations between different types of beliefs about teaching competence, mediating processes such as instructional quality, and student outcomes in authentic K–12 settings” (p. 265).
Theoretical Background and Research Questions
Theoretical Background
The theoretical background underpinning research into self-efficacy stems from the pioneering work of Bandura (1977), building on Rotter’s (1966) prior research into locus of control. In particular, Bandura identified a distinct psychological construct that reflects the belief an individual has in their capacity to achieve a specific task (Hussain et al., 2022). Individuals who believe that they can succeed at a task are more likely to do so, with their positive mindset leading them to become more motivated, committed, and interested in achieving their goal. They are also more likely to recover from setbacks and overcome obstacles that stand in their way.
Most studies into teacher self-efficacy have been based on these foundational ideas, focusing on the extent that teachers believe that they can achieve specific tasks (e.g., controlling classroom behavior) and how this then relates to student outcomes. The first way that this may occur is via a role-modeling process—what Jerrim et al. (2023) described as its direct path to student outcomes. Here greater levels of teacher self-efficacy rub off onto their students, who go on to develop greater levels of self-efficacy themselves (along with, potentially, other areas such as subject interest and confidence). In other words, students internalize their teachers’ beliefs that they can improve learning outcomes and thus work harder toward their (shared) goal. This will feed through into improved test scores.
However, perhaps the most obvious driver of any relationship between teacher self-efficacy and student outcomes occurs through the instruction that teachers provide. This is what Jerrim et al. (2023) describe as the indirect path. Within this study, we drawn on the three basic dimensions framework (Praetorius et al., 2018) to focus on three specific aspects of teacher instructional practice, considering how these may mediate the relationship between teacher self-efficacy and student outcomes.
The first of these three dimensions is classroom management. This broadly refers to the extent that teachers can maintain order in the classroom. It is supposed that teachers who are more confident in their skills—particularly in their ability to control behavior—are more likely to take the appropriate action to do so and persist if students attempt to challenge their authority. This then translates into a more conducive learning environment, with students’ skills developing more rapidly as a result.
The second dimension—student support—captures social interactions between teachers and students in the classroom. This includes showing one another warmth, encouragement, and respect. In situations where teachers lack confidence in their abilities, it is likely to be more challenging for them to gain the respect of students in their classes. Previous research also has suggested that teachers with higher levels of self-efficacy may help to improve relationships between students by—for instance—effectively managing instances of bullying (Van Aalst et al., 2021). Efficacious teachers also may be more persistent and tolerant with students (Zee & Koomen, 2016) and thus go further to support their learning. Praetorius et al. (2018, p. 409) note how “these factors are mostly emotional or social and thus are expected to trigger socio-emotional outcomes such as student well-being and learning motivation.” It is thus likely that it is mainly through boosting students’ socioemotional outcomes that the socioemotional support offered by teachers leads to eventual gains in student achievement.
The final dimension within this framework is cognitive activation, capturing the extent to which teachers set challenging tasks to students, motivating them to think deeply about questions and problems, which, in turn, will deepen their understanding. Teachers who have greater confidence in their teaching abilities may be more likely to set their students such challenging tasks and be more persistent in helping them to overcome difficulties they face in finding the correct solution. However, while previous research has considered this link between teacher self-efficacy and cognitive activation, results have been somewhat inconclusive (Holzberger & Prestele, 2021; Holzberger et al., 2013). Yet, if a link between teacher self-efficacy and cognitive activation does exist, then this is likely to support student interest and motivation in a subject (e.g., students will be motivated and enjoy the need to think deeply about problems) as well as boosting their knowledge and achievement.
An overview of these hypothesized relationships is presented in Figure 1. The figure illustrates how, although teacher self-efficacy may be directly related to student's socioemotional competencies, its link with the three basic dimensions of teaching quality also may play a key mediating role. We note, however, that several of the paths presented in the figure have not found consistent support in the existing literature. Indeed, the existing evidence on many of the associations presented is somewhat mixed. This holds true both for the links between teacher self-efficacy and instructional practices (e.g., inconsistent findings regarding whether teacher self-efficacy is positively related with cognitive activation) and for how the three basic dimensions of instructional quality are associated with student outcomes. For instance, in their analysis of this framework, Praetorius et al. (2018, p. 419) concluded that it is “only partly supported by the current evidence.” This, in turn, highlights the need for further research into the relationships between teacher self-efficacy, instructional practices, and student outcomes displayed in Figure 1.
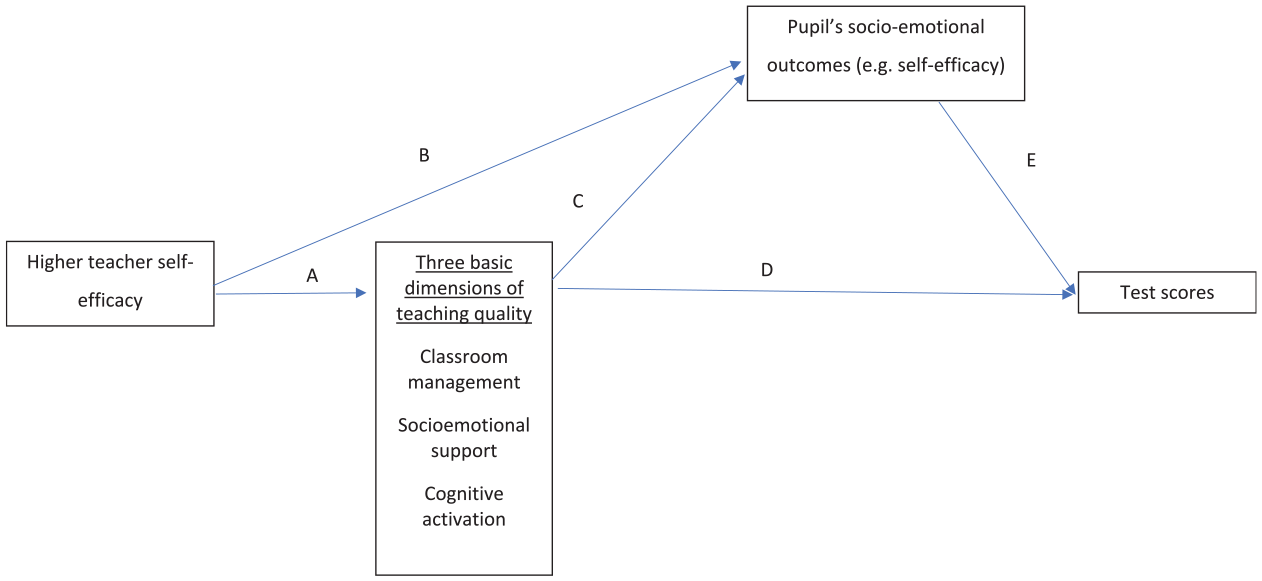
Hypothesized relationship between teacher self-efficacy and student outcomes.
Although the relationships in Figure 1 are hypothesized to work in this way, previous literature has “struggle[d] to establish a reliable empirical link between teachers’ competence beliefs and students’ academic outcomes” (Lauermann & ten Hagen, 2021, p. 265). Lauermann and ten Hagen (2021) highlight several possible explanations that we review here, including (a) variation across raters of teaching quality, (b) predictor-outcome specificity—or generality—correspondence, (c) context- and situation-specific influences, and (d) further methodologic and design considerations.
Variation Across Raters of Teaching Quality
Previous studies—largely outside the teacher self-efficacy literature— have found there to be only modest correlations in measures of teaching quality across student, teacher, and expert observers. For instance, in a study of 80 teachers by Donker et al. (2021), the social influence and friendliness of the teachers was independently rated by students, teachers, and experts. They noted how there are important differences in their perspectives of teacher behavior and that triangulating evidence from across different perspectives is a necessary step for understanding the influence of teachers on students’ emotional outcomes. Kunter and Baumert (2006) used German data to argue that there was considerable agreement between students and teachers with respect to classroom management but only low agreement on measures regarding cognitive autonomy and whether lessons were correctly paced. This led them to argue that both students’ and teachers’ perspectives on the learning environment should be captured, with each better suited to tapping into different aspects of it.
Wagner et al. (2016) investigated the consistency of teacher and student reports of lesson quality over time. Their study suggested that assessing instructional quality over several time points may reduce the discrepancy in the reports across different raters, which may then enhance the predictive power of instructional quality for student outcomes. Kelly et al. (2020) focused specifically on the limitations of global teaching observation protocols via an analysis of the Measures of Effective Teaching study. They argued that such measures can be an imprecise discriminant of lesson quality; give rise to halo effects,” which create artificial consistency across different domains; and may only partially capture the contribution of teachers to the quality of lesson instruction. Reviewing student reports of lesson quality, Göllner et al. (2021) concluded that they can provide a valid perspective on teaching quality and are not inferior to alternative methods such as classroom observations or teacher reports.
These studies have implications for our understanding of the association between teacher self-efficacy and student outcomes, as depicted in Figure 1. For instance, the self-efficacy of teachers may help shape their beliefs of the quality of instruction they provide (regardless of whether these beliefs are correct). This could lead to spuriously strong estimates of the teacher self-efficacy–instructional quality relationship if the latter are based solely on teacher reports. Indeed, because most studies in the teacher self-efficacy literature measure outcomes drawing on information from a single rater—often teacher-reported indicators of lesson quality (e.g., Holzberger & Prestele, 2021)—this may lead one to question the robustness of the results. An assumption is implicitly being made that such information is a sufficiently useful and reliable indicator of lesson quality.
This very point was noted in a recent review of the teacher self-efficacy literature by Lauermann and ten Hagen (2021). These authors observed how “researchers have consistently documented positive links between teachers’ competence beliefs, such as self-efficacy and self-generated judgments of teaching success, teacher-reported or externally evaluated teaching quality, and teacher-rated student outcomes such as perceived student engagement” (p. 265) but that “studies focusing on analogous associations with student-rated teaching quality and academic outcomes are relatively scarce and have produced mixed results” (p. 266). This leads them to conclude that “the available evidence points to rater-specific differences in these associations” (p. 265) between teacher self-efficacy, instructional quality, and student outcomes. Unfortunately, however, there is a dearth of existing studies that explore how these relationships vary when information is reported by different raters within the same dataset, a gap this paper aims to fill.
Predictor-Outcome Specificity—or Generality—Correspondence
According to the principle of specificity or generality correspondence, the alignment between the scope of teacher self-efficacy and predicted outcomes increases the predictive power of teacher self-efficacy (Pajares, 1996). The consistency between the level of specificity or generality of the predictor and the outcome can be referenced to a task, domain, or level of analysis (Lauermann & ten Hagen, 2021).
Studies finding a significant association between teacher's self-efficacy and students’ outcomes have similar generality/specificity of the constructs. Jimmieson et al. (2010) used general teachers’ job efficacy to explain general measures of students’ satisfaction, student–teacher relationships, and students’ confidence in their ability. Others have examined teachers’ self-efficacy in specific domains such as mathematics (Perera & John, 2020) and reading (Corkett et al., 2011), in a specific task such as student engagement (Zee & Koomen, 2020), or at the same level of analysis (Zee et al., 2018). Zee et al. (2018) pointed out that the definition of the dimensions at the same level increases the predictive power; in particular, they found that teachers’ student-specific self-efficacy was linked with students’ improvement in emotional engagement and behavior. Conversely, the discrepancy between the specificity/generality of teacher self-efficacy (TSE) and students’ outcome tends to lead to nonsignificant associations (Lauermann & ten Hagen, 2021). For instance, Burić and Kim (2020) used a general measure of TSE to predict students’ motivation in a specific subject, which may contribute to their null effect.
In this paper, TSE and student outcomes are assessed specifically in terms of mathematics classes, so the constructs are defined at the same level. We consider both a generalized measure of TSE and also one with respect to particular areas of teaching (e.g., classroom management, instruction, and student engagement).
Context- and Situation-Specific Influences
The link between TSE and students’ outcomes is mediated by contextual and situational factors (recall Figure 1). Evidence shows that a closer student–teacher relationship bolsters the influence of TSE. Lev et al. (2018) argued that the association between TSE and students’ ratings of teacher quality was stronger in classes where the teacher was also a tutor, due to more time spent together and increased interactions. When the teacher is also the tutor, there are unobservable factors linked to the task of tutoring, such as the teacher's involvement in social, personal, and emotional issues of pupils, which cannot be measured and may bias the estimation of the association.
Similarly, Lazarides et al. (2021) hypothesized that the nonsignificant influence of teacher enthusiasm at the beginning of year 5 could be due to the fact that students do not yet know their teachers. The age of the student is strongly related to the kind of relationship established between students and teachers. In this respect, the literature provides support that in primary education the influence of TSE is higher than in secondary education because the larger classrooms and higher number of teachers teaching different subjects decrease student–teacher interactions (Eccles & Roeser, 2009; Zee & Koomen, 2016). The lower influence of TSE as students grow also may be related with the developmental process in adolescence, in which students increase their relationship with peers while reducing their connectedness with their parents and teachers (Lazarides et al., 2021; Lynch & Cicchetti, 1997).
The potential effects of TSE on students’ outcomes also may vary depending on the challenges or impediments that teachers face. Empirical evidence found that TSE has stronger effects when instructing low-achieving students compared with regular/advanced students in math because under such circumstances the teacher can have a greater influence on students’ beliefs and behaviors (Miller et al., 2017).
In this paper, our statistical models control for a selection of potentially important contextual and situational influences. First, the models control for students’ grade. In the sample, all students are in secondary education, specifically between grades 8 and 11. Second, to assess how well the students and teachers know each other, the models include an explanatory variable for the time during which students have been taught by the teacher. This is important given the variation in data-collection timelines between participating countries. In some countries, such as Japan, Spain, and Mexico, the collection period started in the middle of the academic year (OECD, 2021), when students and teachers may know each other well. In other countries, the data collection started at the beginning of the academic year (e.g., in Chile, China, England, and Germany), when students and teachers may know each other less well (OECD, 2021). Third, regarding the complexity of the task that the teacher faces, the models account for teachers’ responses on whether the class has traits that limit their instruction as well as the class-average test score in math. We recognize, however, that there are likely to be relevant context- and situation-specific influences that our analysis (as in previous studies) is unable to control, meaning that our estimates will capture conditional associations rather than establishing cause and effect.
Further Methodologic and Design Considerations
The validity of results exploring the relationship between TSE and student outcomes also may be questioned due to other features of the study design, such as small sample size and self-selection or failure to establish causality in this relationship. Previous empirical evidence mostly relied on small sample sizes; about a third of studies reviewed in Lauermann and ten Hagen (2021) reported samples with fewer than 50 classrooms. In addition, relying on nonrandom selection methods such as selecting specific teachers based on some criteria or volunteering selection criteria leads to biased results. In the study design of Corkett et al. (2011), the head teacher oversaw choosing the classes according to their academic performance. Another instance is the selection of students based on teachers’ perceived self-efficacy, as seen in Mojavezi and Tamiz (2012).
Finally, most studies that explore the influence of TSE demonstrate correlations (Klassen et al., 2011; Lauermann & ten Hagen, 2021; Morris et al., 2017). Therefore, it is not appropriate to categorize TSE as a predictor of student outcomes. As Morris et al. (2017) pointed out, “only limited causal inferences can be drawn from longitudinal or one-group pretest–posttest designs” (p. 825). Thus, despite the longitudinal design of the data used in this research, our study also establishes robust associations rather than necessarily capturing cause and effect.
Research Questions
The theoretical background outlined earlier—along with what is known from the previous literature—leads us to the following research questions. Our broad epistemological method is to use an argument-based approach to validity, which is “to validate an interpretation . . . to evaluate the rationale, or argument, for the claims being made” (Kane, 2006, p. 17). In reference to the literature on TSE, the claim often made is that teachers with higher levels of self-efficacy deliver higher-quality instruction to their students, whose socioemotional and learning outcomes benefit as a result (recall Figure 1). In this paper we seek to evaluate this argument. In particular, we seek to establish whether the supposed relationship between TSE and the three basic dimensions of instructional quality holds regardless of the source of information on the latter (i.e., student, teacher, or expert observers).
To begin, we explore the relationship between TSE and the three basic dimensions of lesson quality—the key mediating channel depicted in Figure 1. As noted by Lauermann and ten Hagen (2021), there is a dearth of evidence on this issue, particularly when the outcome (lesson quality) is not solely based on teacher reports. Indeed, their review stated how “there is an urgent need to account for rater-specific effects in analyses of the implications of teachers’ competence beliefs for their students” (Lauermann & ten Hagen, 2021, p. 279). We thus advance the literature by investigating how the relationship between TSE and the three basic dimensions of lesson quality varies across the views of teachers, students, and expert observers. Thus, we ask
We then proceed to investigate the link between TSE and students’ socioemotional competencies—the other key intermediate outcome depicted in Figure 1. As noted earlier, it has been suggested previously that higher self-efficacy levels among teachers may directly rub off on their students, who then become more confident in dealing with subject tasks as a result. These intermediate student outcomes, of course, also may be conditioned by improved lesson quality. Under either scenario, the association between TSE and student self-efficacy (and broader socioemotional competencies) should be positive. We test these associations by asking
Next, we turn to how TSE relates to student test scores. If we identify a link between TSE and our intermediate outcomes (i.e., improved lesson quality, student self-efficacy, and other socioemotional outcomes), we might anticipate this to translate into learning gains. Moreover, if such a relationship is found, it would be of interest to know the extent that it is being driven by enhanced lesson quality (as compared with possible alternative channels). Thus, we ask
We then explore the issue of nonlinearities—a somewhat underexplored topic across the TSE literature. In particular, if a teacher has very low levels of self-efficacy, is this particularly detrimental to the quality of their teaching and their student's educational and socioemotional outcomes? As noted by Lauermann and ten Hagen (2021), one possible reason why such nonlinear associations may exist is because “a teacher's (displayed) lack of confidence in being able to teach effectively might undermine students’ confidence in their own capability to learn, especially for those students who struggle academically and rely on their teacher's support” (p. 271). Moreover, knowing the answer to this question is important from a policy perspective: Should school leaders attempt to increase the self-efficacy of their staff across the board or only focus on those who lack any real conviction in their pedagogic skill? Thus, we ask
Data
Our analysis draws on data from the TALIS Video Study, conducted by the Organisation for Economic Co-Operation and Development (OECD) in 2018 (OECD, 2019). These data were designed to understand how teaching processes are associated with students’ cognitive and socioemotional outcomes. A unique feature is that the information gathered is not limited to self-reports; direct observations through video recorded lessons are also available. The study was administered in eight countries (regions)—Chile, Colombia, England, Germany, Japan, Spain (Madrid), Mexico, and China (Shanghai).
Participants were sampled using a stratified two-stage probability design, with schools as the primary sampling unit and mathematics teachers the second-stage units (OECD, 2019). There were, however, some departures from this sample design in some countries. For instance, Germany selected a nonrandom sample of schools, whereas Japan and Chile targeted schools in specific regions (OECD, 2021). Moreover, teachers were not randomly selected within schools in Germany, Japan, Madrid, and Shanghai, whereas response rates in England were relatively low (35% of the initially selected teachers agreed to take part). To maximize the alignment between teaching practices and student outcomes, the study focused on a single, common curricular topic: quadratic equations.
A total of 679 teachers (between 50 and 103 per country) and 17,554 students (between 1,140 and 2,783 per country) participated. Online Appendix A illustrates the missing data for each variable. In the main body of the text, we report estimates using missing dummy variables to limit the number of observations dropped due to missing data.
A key feature of the TALIS Video Study was its longitudinal design, with data collected from students and teachers before and after teaching the topic of quadratic equations. As part of the baseline survey, teachers and students completed a background questionnaire including information about their education, beliefs, motivation, and perception of the school setting. Students also undertook a baseline assessment measuring their general mathematics skills (i.e., a pretest). This took place during a 2-week period before instruction on quadratic equations started. Once the topic of quadratic equations had been completed, students undertook a further (post) test focused on their knowledge and understanding of the material taught. Students and teachers also completed endpoint questionnaires.
The study also collected observation data on teaching. Two lessons were recorded for each teacher, one from the first half of the unit on quadratic equations and another from the second half. The lessons were divided into 16-minute segments, with each evaluated by two randomly assigned expert observers. The video-rating process attempted to maximize consistency within and across countries—a detailed description of the rating process can be found in OECD (2021, Chap. 6).
Measurement of TSE
As part of the baseline questionnaire, teachers were asked 12 questions using a four-point scale (1 = “not at all” to 4 = “a lot”) capturing their self-efficacy (e.g., the extent that they can “control disruptive behavior in this classroom”). In our main analysis, we use the general TSE scale designed by the OECD and standardized to mean zero and standard deviation one. Standardization is done within countries in country-specific analyses and across countries in pooled analyses. The same questions were included in another, larger cross-national study of teachers (the “main” TALIS study) with a metric level of measurement invariance found to hold (OECD, 2019, Table 11.6). The internal consistency (Cronbach’s alpha) of this scale is 0.89. However, in online Appendix B we test the robustness of a selection of our results using domain-specific measures of self-efficacy instead.
Table 1 provides the distribution of responses for three of the TSE questions (one from each of the three domains). The table suggests that relatively few teachers in the sample had very low levels of self-efficacy—for example, in most countries only around 5%–10% of the responding teachers felt unable to control disruptive behavior in the classroom or could not provide alternative explanations when their students were confused. However, in all countries, a nontrivial proportion of teachers did feel unable to motivate students who lacked interest in their schoolwork. There are also some clear differences across countries in responses—for example, Japanese teachers were the most likely to disagree with the statements—which may at least partially reflect differences in interpretation. Thus, while there is clear variation in the responses teachers provided to these questions, the sample only contains a limited number with a severe lack confidence in their teaching skills.
Distribution of Selected Questions from the Teacher Self-Efficacy Scale (Column Percentages)

Lesson Quality
To define instructional quality, the OECD started by drawing on measures included within the TALIS and Programme for International Student Assessment frameworks. These were then supplemented by information from (a) international research literature and (b) countries own conceptualizations of teaching quality. The latter critically included how countries saw various teaching activities being linked to student outcomes. Hence, the operationalization of instructional quality used in this study was based on both prior research evidence and expert input from the participating countries. OECD (2021, Chap. 2) provides further details.
This process resulted in six aspects of teaching practices being measured as part of the TALIS Video Study, which have been grouped by the OECD into the three broad domains (OECD, 2021, Chap. 19). In this study, we focus on the following:
Classroom management. This includes all the endeavors undertaken by teachers to establish order, enhance time utilization during lessons, and thereby maximize academic and socioemotional progress (van Tartwijk & Hammerness, 2011). An effective classroom management includes a high ratio of students’ time on task, teacher monitoring, and classroom routines (Muijs & Reynolds, 2000).
Socialemotional support. This concerns the process of student–teacher interactions within the class characterized by positive classroom climate, respect, and warmth, which are positively associated with students’ outcomes (Leighton et al., 2018). A socioemotionally supportive learning environment encourages students to share their ideas, ask questions, and seek teachers’ guidance (Micari & Calkins, 2021).
Cognitive activation. While the data collected four aspects of teachers’ teaching methods, we focus on one of these—cognitive activation—which is part of the three basic dimensions framework (Praetorius et al., 2018). This focused on the extent that teachers got their students to be actively involved with procedures and processes (Nunokawa, 2010) and to think deeply about questions and subject matters.
Each of these aspects of teaching practice has been independently judged by three separate groups: students (via endpoint questionnaire), teachers (via endpoint questionnaire), and expert observers (via ratings awarded to video-taped lessons). An overview of the information reported by these groups is provided below, with further details (including the exact wording of questions used to form each scale) provided in online Appendix C.
Teacher Views
In the endpoint questionnaire, teachers self-reported their reflections on the lessons they conducted concerning quadratic equations. From their responses, three scales are formed, with details provided in online Appendix Table C1. The first scale was classroom management, formed of 10 questions with Cronbach's alpha = 0.82 (e.g., “I lost quite a lot of time because of students interrupting the lessons”). The second was socioemotional support, formed of 16 questions, with Cronbach's alpha = 0.78 (e.g., “I showed interest in these students’ well-being”). The third was cognitive activation, formed of four questions, with Cronbach's alpha = 0.72 (e.g., “I gave tasks that required these students to think critically”).
Student Views
Within the endpoint questionnaire, students reported their views on the practices, procedures, and approaches their teacher used during the quadratic equation lessons. Three scales are again formed, based on similarly worded questions to those posed to the teachers. The classroom management scale was formed of 10 questions, with Cronbach's alpha = 0.77 (e.g., “When the lesson began, our mathematics teacher has to wait quite a long time for us to quieten down”). The socioemotional support scale encompassed 16 questions, with Cronbach's alpha = 0.95 (e.g., “My mathematics teacher was interested in my well-being”). Cognitive activation was measured via 4 questions, with Cronbach's alpha = 0.73 (e.g., “Our mathematics teacher gave tasks that required us to think critically”). The specific wording of questions can be found in online Appendix Table C2. Online Appendix D provides details about the reliability of student-reported measures of instructional quality, including the internal consistency of responses (Cronbach’s alpha), the extent that students in the same class give similar ratings of instructional quality (intracluster correlations), and the extent that their responses are correlated with the views of their teachers and expert observers (interrater reliability).
Expert Observers
The expert observers used the video recordings to assess the different domains of lesson quality. We use the scales constructed by the OECD. These used the average rating of two experts per lesson segment, with two lessons recorded per teacher (OECD, 2021). Classroom management covered three areas (i.e., disruptions, classroom monitoring, and routines)—an example being how quickly and effectively the teacher dealt with classroom disruptions. Socioemotional support covered two areas (i.e., respect and encouragement/warmth), with an example being how frequently and consistently teachers and students demonstrated respect for one another. Cognitive activation covered three areas (i.e., engagement in cognitively demanding subject matter, multiple approaches to and perspectives on reasoning, and understanding of subject matter procedures and processes)—an example being whether students in the class regularly engage in analyses, creation, or evaluation work that is cognitively rich and requires thoughtfulness. See online Appendix Table C3 for further details. Each scale is standardized to mean zero and standard deviation one.
Correspondence Across Raters
An interesting feature of the data is that the correspondence between teacher and student reports is relatively modest, with the Pearson correlation sitting around 0.35 for each of the three instructional quality measures (see online Appendix Table D4). The magnitude of these correlations is consistent with those reported elsewhere in the literature. For instance, Wisniewski et al. (2022) investigated the correlation between teacher and student perceptions of the three basic dimensions of instructional quality across 171 German classrooms. They found the correlation to stand at 0.35 for cognitive activation, 0.40 for student support, and 0.52 for classroom management. Undertaking a similar analysis, Kunter and Baumert (2006) found the correlation between student and teacher reports to stand at 0.25 for teacher-provided social support, 0.64 for classroom management, and 0.24 for supporting cognitive autonomy. Similarly, Wagner et al. (2016) reported class-level correlations between student and teacher reports of around 0.35 for goal clarity, 0.7 for classroom management, and 0.1 for support for autonomy. The same authors noted how similar findings were reported by Clausen (2002), stating that the “relative agreement between teacher and student ratings . . . ranged from –.28 to .42 for 12 different instructional quality dimensions” (Wagner et al., 2016, p. 706). The correlation between student- and teacher-reported measures of instructional quality within the TALIS Video Study thus appear to be of a similar magnitude to those reported elsewhere in the literature.
However, the correlation with the views of expert observers is much lower—often sitting close to or below zero (see online Appendix Table D4). In Appendix J, we provide an overview of the existing literature on the consistency of reports of lesson quality across different observers, noting that many other studies have found correlations with the views of expert observers to be relatively low (although usually greater than zero). We go on to explore potential reasons for the near-zero correlations between student/teacher views and those of expert observers within the TALIS Video Study, including possible floor and ceiling effects, lack of variation in the scales, issues surrounding question wording, investigating the multilevel reliability, and exploring the strength of the association in the views expressed by different expert observers. From these investigations, we conclude that our greatest concern centers around the reliability and validity of the information provided by expert observers. This is based on the following:
Expert observer reports show near-zero correlations with both student and teacher reports, whereas student and teacher reports at least show some consistency with one another (see online Appendix Table D4).
Even when different observers make judgments about the same single lesson, there is only moderate agreement in their responses (see online Appendix Table J11).
When different observers make judgments about two different lessons, the agreement in their responses is low (see online Appendix Table J11).
While random measurement error in individual student reports mostly will be averaged out due to information being pooled across many students (typically around 27 per teacher), the same does not hold true for the responses of expert observers (typically around four observations per teacher, two experts judging two lessons; see online Appendix Tables J10 and J12).
The information provided by expert observers either does not predict—or only weakly predicts—student outcomes. They thus have low levels of predictive validity (see Table 4).
Methodology
Research Question 1
To address the first research question, we estimate a set of ordinary least squares regression models. These are estimated at the teacher/class level when using teacher/observer reports of lesson quality and at the student level when using student reports (with standard errors clustered at the class/teacher level). In Online Appendix E, we test the robustness of our findings to estimating multilevel models instead, finding little substantive difference to our results. The specification of the expert/teacher models is as follows:

where
Our variable of interest is TSE. The
Research Questions 2 and 3
Similar models are used to address our second and third research questions, although with each now estimated at the student level. Formally, the model is specified as

where
With all other variables defined as earlier. The parameter of interest is again
As Abadie et al. (2023) noteed, in cases of cluster samples, standard errors should be clustered at the level of the sampling unit. With respect to the TALIS Video Study, this implies that standard errors should be clustered at the school/teacher level. (Note that because only one teacher participated per school, clustering the sample at the teacher level is equivalent to clustering the standard errors at the school level.) All standard errors are hence clustered by teacher to account for the hierarchical nature of the data.
If the

where LQijk is teacher and student measures of lesson quality.
The change in the
Research Question 4
In the models just specified, the variable of interest (
Pooled Versus Country-Level Estimates
Because the TALIS Video Study data are drawn from across eight countries, the analyses can be conducted in two ways. The first is to pool the data from across the eight countries into a single dataset and then create all scales and conduct all analyses using this international sample. This has the advantage of maximizing statistical power. However, one may question the wisdom of such an approach due to—for instance—possible cross-national differences in interpretation of the survey questions. The alternative is to treat the data from the eight countries as eight separate samples, investigating whether the sample substantive answers to our research questions emerge in each. The statistical power in any of these individual country samples, of course, will then be far more limited.
In most of our main results tables, we have chosen to present estimates from both approaches. The main exception is Research Question 4, where we only present results based on the pooled sample. This is due to the limited number of teachers in individual countries, meaning that there is not sufficient statistical power to divide national samples into TSE tertiles. Note that when we do present separate estimates for each country, we make no attempt to compare them, which we consider to be unwise (e.g., due to limited statistical power, differences in response rates and representativeness, and potential issues of measurement invariance). Rather, our focus is on whether analysis of each separate sample produces substantive findings that are consistent with those from the analysis pooled across countries.
Results
Research Question 1: How strong is the association between TSE and teacher, student, and expert reports of lesson quality?
Table 2 begins by presenting the relationship between TSE and the three dimensions of lesson quality. These estimates thus capture channel A within the theoretical framework set out in Figure 1. Results are presented when information on these outcomes is drawn from different sources—teachers (left-hand column), students (middle column), and expert observers (right-hand column). All estimates capture the standardized change in the outcome per standard deviation increase in the TSE scale.
Association Between Teacher Self-Efficacy and Measures of Lesson Quality

Notes. Pooled analysis refers to whether analysis based on the international sample includes all countries. Estimates refer to the standardized change in the outcome per one standard deviation increase in the TSE scale. Models control for teacher gender, experience, class average socioeconomic status, class average pretest score, grade, proportion of immigrant students, how long the students have been taught by the teacher, students’ interest and self-efficacy in mathematics under their previous teacher, test effort and motivation, the proportion of students in the class the teacher deemed to have characteristics limiting their instruction, and country fixed effects. Standard errors in student-level estimations are clustered at the teacher level.
Source. Authors’ own calculations using data from OECD (2019).
Statistical significance at the 10% level; **statistical significance at the 5% level.
When teacher reports are used to measure lesson quality, sizable and statistically significant estimates are produced. For instance, in the pooled sample, each standard deviation increase in TSE is associated with an ~0.5 standard deviation increase in teachers’ views of the socioemotional support they provided to their students, with an ~0.3 standard deviation increase in the classroom management and cognitive activation scale. These large, standardized differences are consistent with previous research into TSE using teacher-reported outcome measures (Lauermann & ten Hagen, 2021). If taken at face value, these results seem to suggest that TSE is an important antecedent of instructional quality.
Rather different findings emerge, however, in the middle column of Table 2 when the information on lesson quality is captured from the perspective of students. Although still reaching statistical significance in the pooled sample at the 5% level, the estimated standardized differences are now much more modest. For instance, in the pooled analysis, each standard deviation increase in TSE is associated with a 0.05 standard deviation increase in the (student-reported) cognitive activation scale—a small effect.
Table 3 extends these findings to encompass a broader set of student-reported outcome measures. Consistent with the results presented in Table 2, statistically significant associations are found in the pooled analysis, but all the estimated standardized differences (standing around 0.05 standard deviations) are relatively small.
Association Between Teacher Self-Efficacy and Additional Measures of Lesson Quality from the Student Perspective
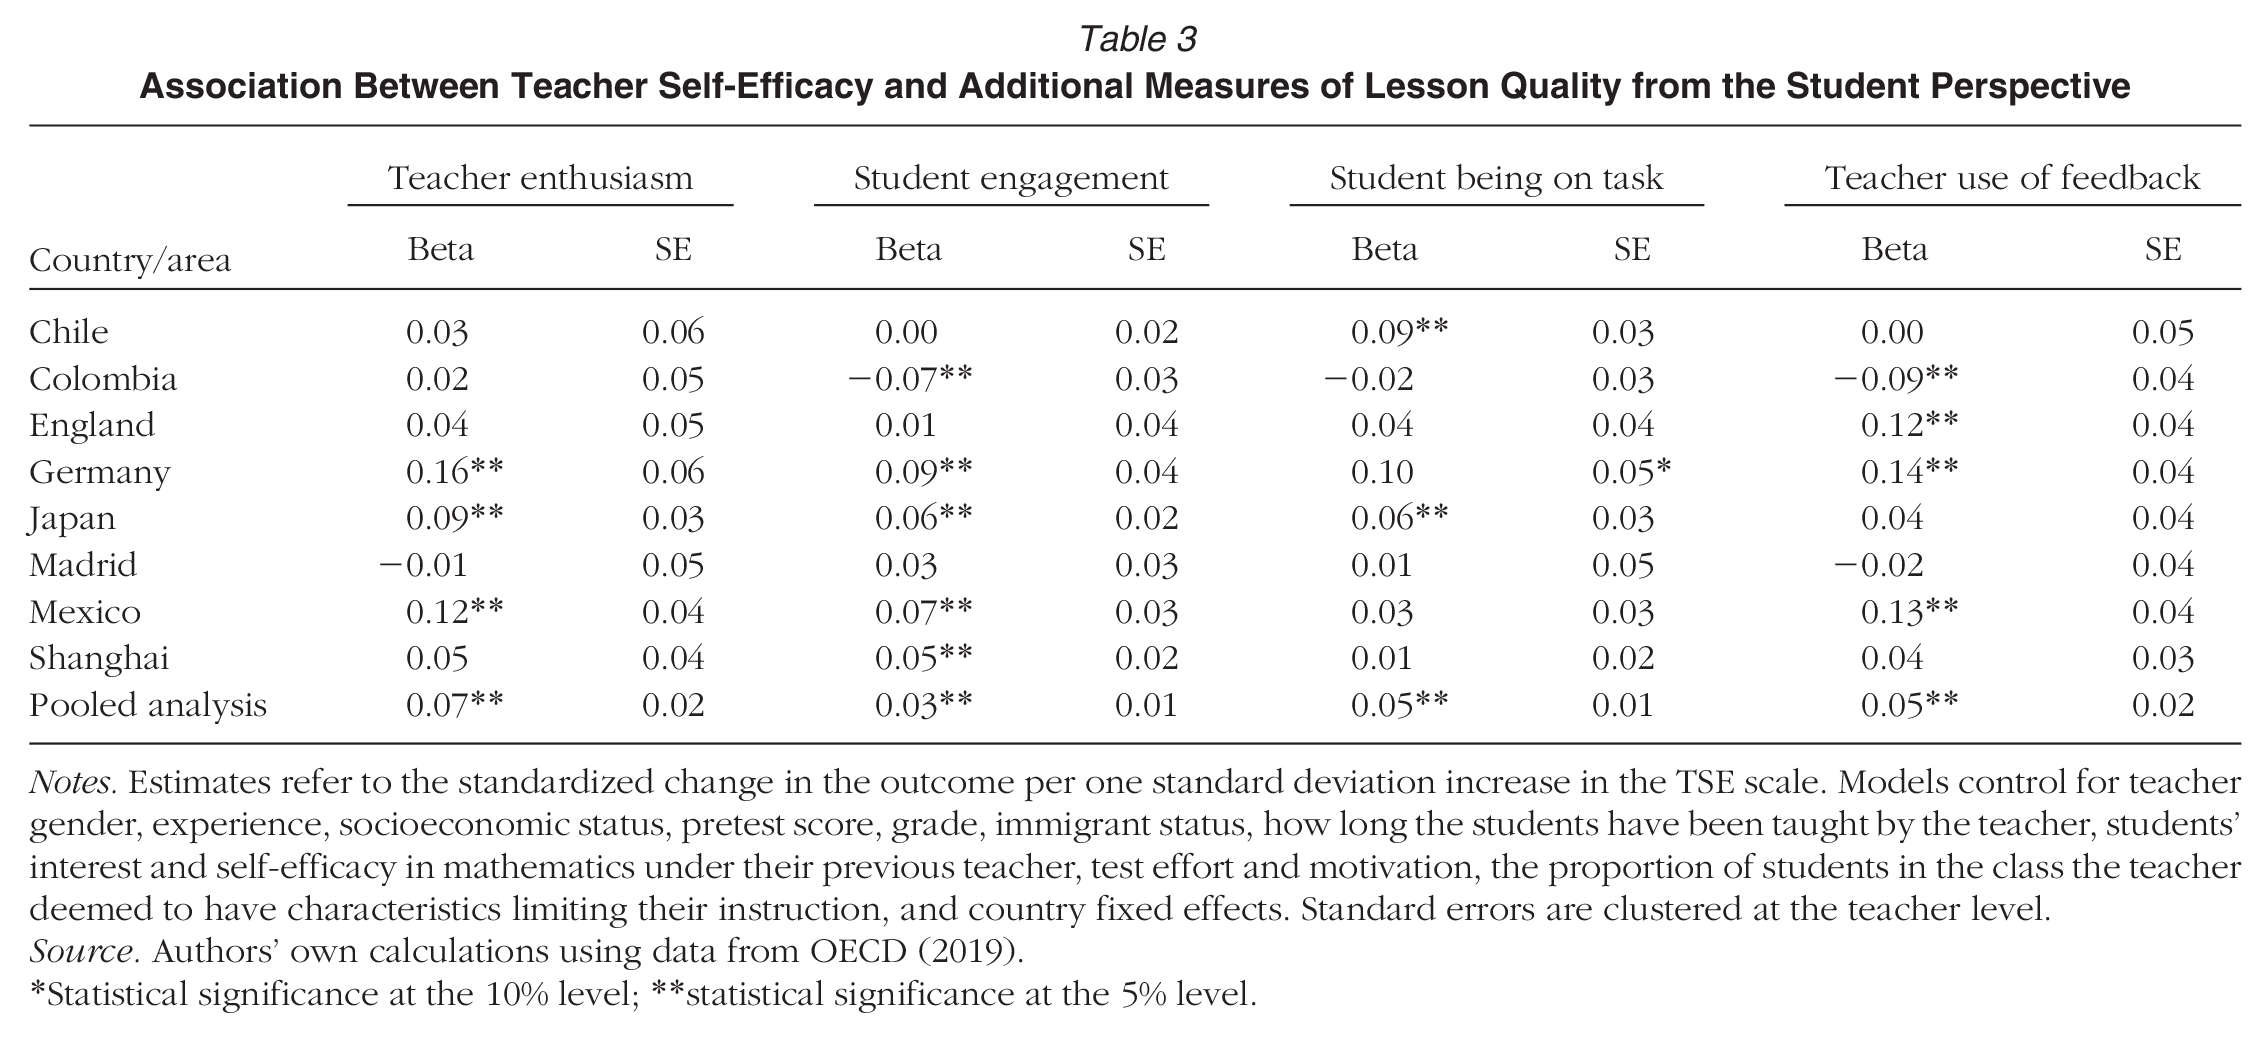
Notes. Estimates refer to the standardized change in the outcome per one standard deviation increase in the TSE scale. Models control for teacher gender, experience, socioeconomic status, pretest score, grade, immigrant status, how long the students have been taught by the teacher, students’ interest and self-efficacy in mathematics under their previous teacher, test effort and motivation, the proportion of students in the class the teacher deemed to have characteristics limiting their instruction, and country fixed effects. Standard errors are clustered at the teacher level.
Source. Authors’ own calculations using data from OECD (2019).
Statistical significance at the 10% level; **statistical significance at the 5% level.
The results based on the opinion of expert observers (right-hand column of Table 2) are even starker, with null effects typically found. Now, in the pooled analysis, all the estimates are small (~0.05 standard deviations or less) and statistically indistinguishable from zero.
The evidence with respect to Research Question 1 is hence clearly rather mixed and largely depends on the source of the outcome measure used. Given this, one may ask which—if any—of the reports (i.e., teacher, student, or expert) should be preferred? One logical way to decide is to consider which has the strongest association with students’ outcomes. We present evidence on this matter in Table 4, where we illustrate the standard deviation change in various student-level outcomes associated with a one standard deviation increase in the measure of lesson quality, based on teacher reports (column 1), student reports (column 2), and expert observers (column 3). These estimates are conditional on baseline measures of the respective outcome along with a set of additional background covariates (see table notes for further details) and based on the sample that has been pooled across countries. Online Appendix F provides alternative estimates with fewer background controls.
Association Between Teacher, Student and Expert Reports of Lesson Quality and Student Outcomes

Notes. Results based on analysis pooled across countries. Controls include a baseline measure of the outcome along with teacher gender, experience, socioeconomic status, pretest score, grade, immigrant status, how long the students have been taught by the teacher, students’ interest and self-efficacy in mathematics under their previous teacher, test effort and motivation, and the proportion of students in the class the teacher deemed to have characteristics limiting their instruction. All figures refer to the change in the outcome measure per one standard deviation increase in the lesson quality scale.
Source. Authors’ own calculations using data from OECD (2019).
Statistical significance at the 10% level; **statistical significance at the 5% level.
The results from Table 4 indicate that teacher and expert reports of lesson quality are only weakly related to student outcomes. For instance, a one standard deviation increase in teacher or expert reports of socioemotional support provided by teachers is associated with a 0.04 standard deviation increase in students’ mathematics self-confidence. However, the analogous association with the student-reported measures is notably stronger, standing at 0.22 standard deviations. Hence, of the three raters of instructional quality, it is the information reported by students that is most strongly associated with student outcomes.
Thus, our overall attempt to synthesize the findings presented across Tables 2–4 is that they generally point toward there being some positive association between TSE and instructional quality, although the strength of this link is rather weak.
Research Question 2: How strong is the association between TSE and students’ interest in a subject?
Table 5 addresses our second research question, where we explore the link between TSE and students’ socioemotional outcomes, including their self-confidence, self-efficacy, and subject interest. Referring to Figure 1, these estimates capture both the direct association between TSE and these outcomes (channel B) as well as any potential indirect association that occurs through lesson quality (channels A + C).
Association Between Teacher Self-Efficacy and Student's Socioemotional Outcomes

Notes. Estimates refer to the standardized change in the outcome per one standard deviation increase in the TSE scale. Total effect models control for teacher gender, experience, socioeconomic status, pretest score, grade, immigrant status, how long the students have been taught by the teacher, students’ interest and self-efficacy in mathematics under their previous teacher, test effort and motivation, the proportion of students in the class the teacher deemed to have characteristics limiting their instruction, and country fixed effects. Direct effect additionally adds controls for student and teacher views of lesson quality. Standard errors are clustered at the teacher level.
Source. Authors’ own calculations using data from OECD (2019).
Statistical significance at the 10% level; **statistical significance at the 5% level.
The results in the “Total effect” columns of Table 5 are in many ways similar to those produced under Research Question 1 when using student reports of lesson quality. While all estimates within the pooled sample are statistically significant at the 5% level (in part due to the large student sample size), the standardized differences are consistently very small (~0.03 standard deviations). Consequently, while there appears to be some modest association between TSE and students’ socioemotional competencies, any such link is—at best—weak.
The “Direct effect” columns in Table 5 illustrate the link between TSE and socioemotional outcomes, controlling for the three basic dimensions of teaching quality in students’ and teachers’ views. Relative to Figure 1, these estimates attempt to capture the direct association between TSE and these outcomes (channel B). Results show that the direct association between TSE and students’ interest in a subject is essentially zero. Thus, we do not find evidence that there may be a direct influence of TSE on students’ socioemotional outcomes. This implies that higher TSE leads to better instruction, which ultimately fosters students’ interest in a subject (although the magnitude of these associations is consistently small).
We extend this part of our analysis in online Appendix G using a structural equation model to estimate the total, direct, and indirect associations between TSE and student outcomes using a mediation model. Results from this SEM analysis support the findings reported in Table 5; there is a small total association between TSE and students’ socioemotional outcomes, which almost entirely operates through the indirect channel of lesson quality.
Research Question 3. Is there a relationship between TSE and students’ test scores?
Table 6 turns to the total association between TSE and student test scores. It clearly points toward a null result. The point estimate is essentially zero (0.01 standard deviations in the pooled analysis) and not statistically significant. Given the findings from our first two research questions—weak associations between TSE and intermediate outcomes (lesson quality and students’ socioemotional competencies)—it is perhaps unsurprising that we then find little association with student test scores.
Association Between Teacher Self-Efficacy and Student's Test Scores

Notes. Estimates refer to the standardized change in the outcome per one standard deviation increase in the TSE scale. Models control for teacher gender, experience, socioeconomic status, pretest score, grade, immigrant status, how long the students have been taught by the teacher, students’ interest and self-efficacy in mathematics under their previous teacher, test effort and motivation, the proportion of students in the class the teacher deemed to have characteristics limiting their instruction, and country fixed effects. Standard errors are clustered at the teacher level.
Source. Authors’ own calculations using data from OECD (2019).
Statistical significance at the 5% level.
Research Question 4: Is there any evidence of nonlinearity in these relationships?
Thus far our models have implicitly assumed that the relationship between TSE and our outcomes is linear. We now relax this assumption in Table 7, where we investigate how each outcome differs across teachers with low, average, and high self-efficacy levels (with the average category as the reference group).
Exploration of Potential Nonlinearities in the Relationship Between Teacher Self-Efficacy with (a) Lesson Quality and (b) Pupil Outcomes
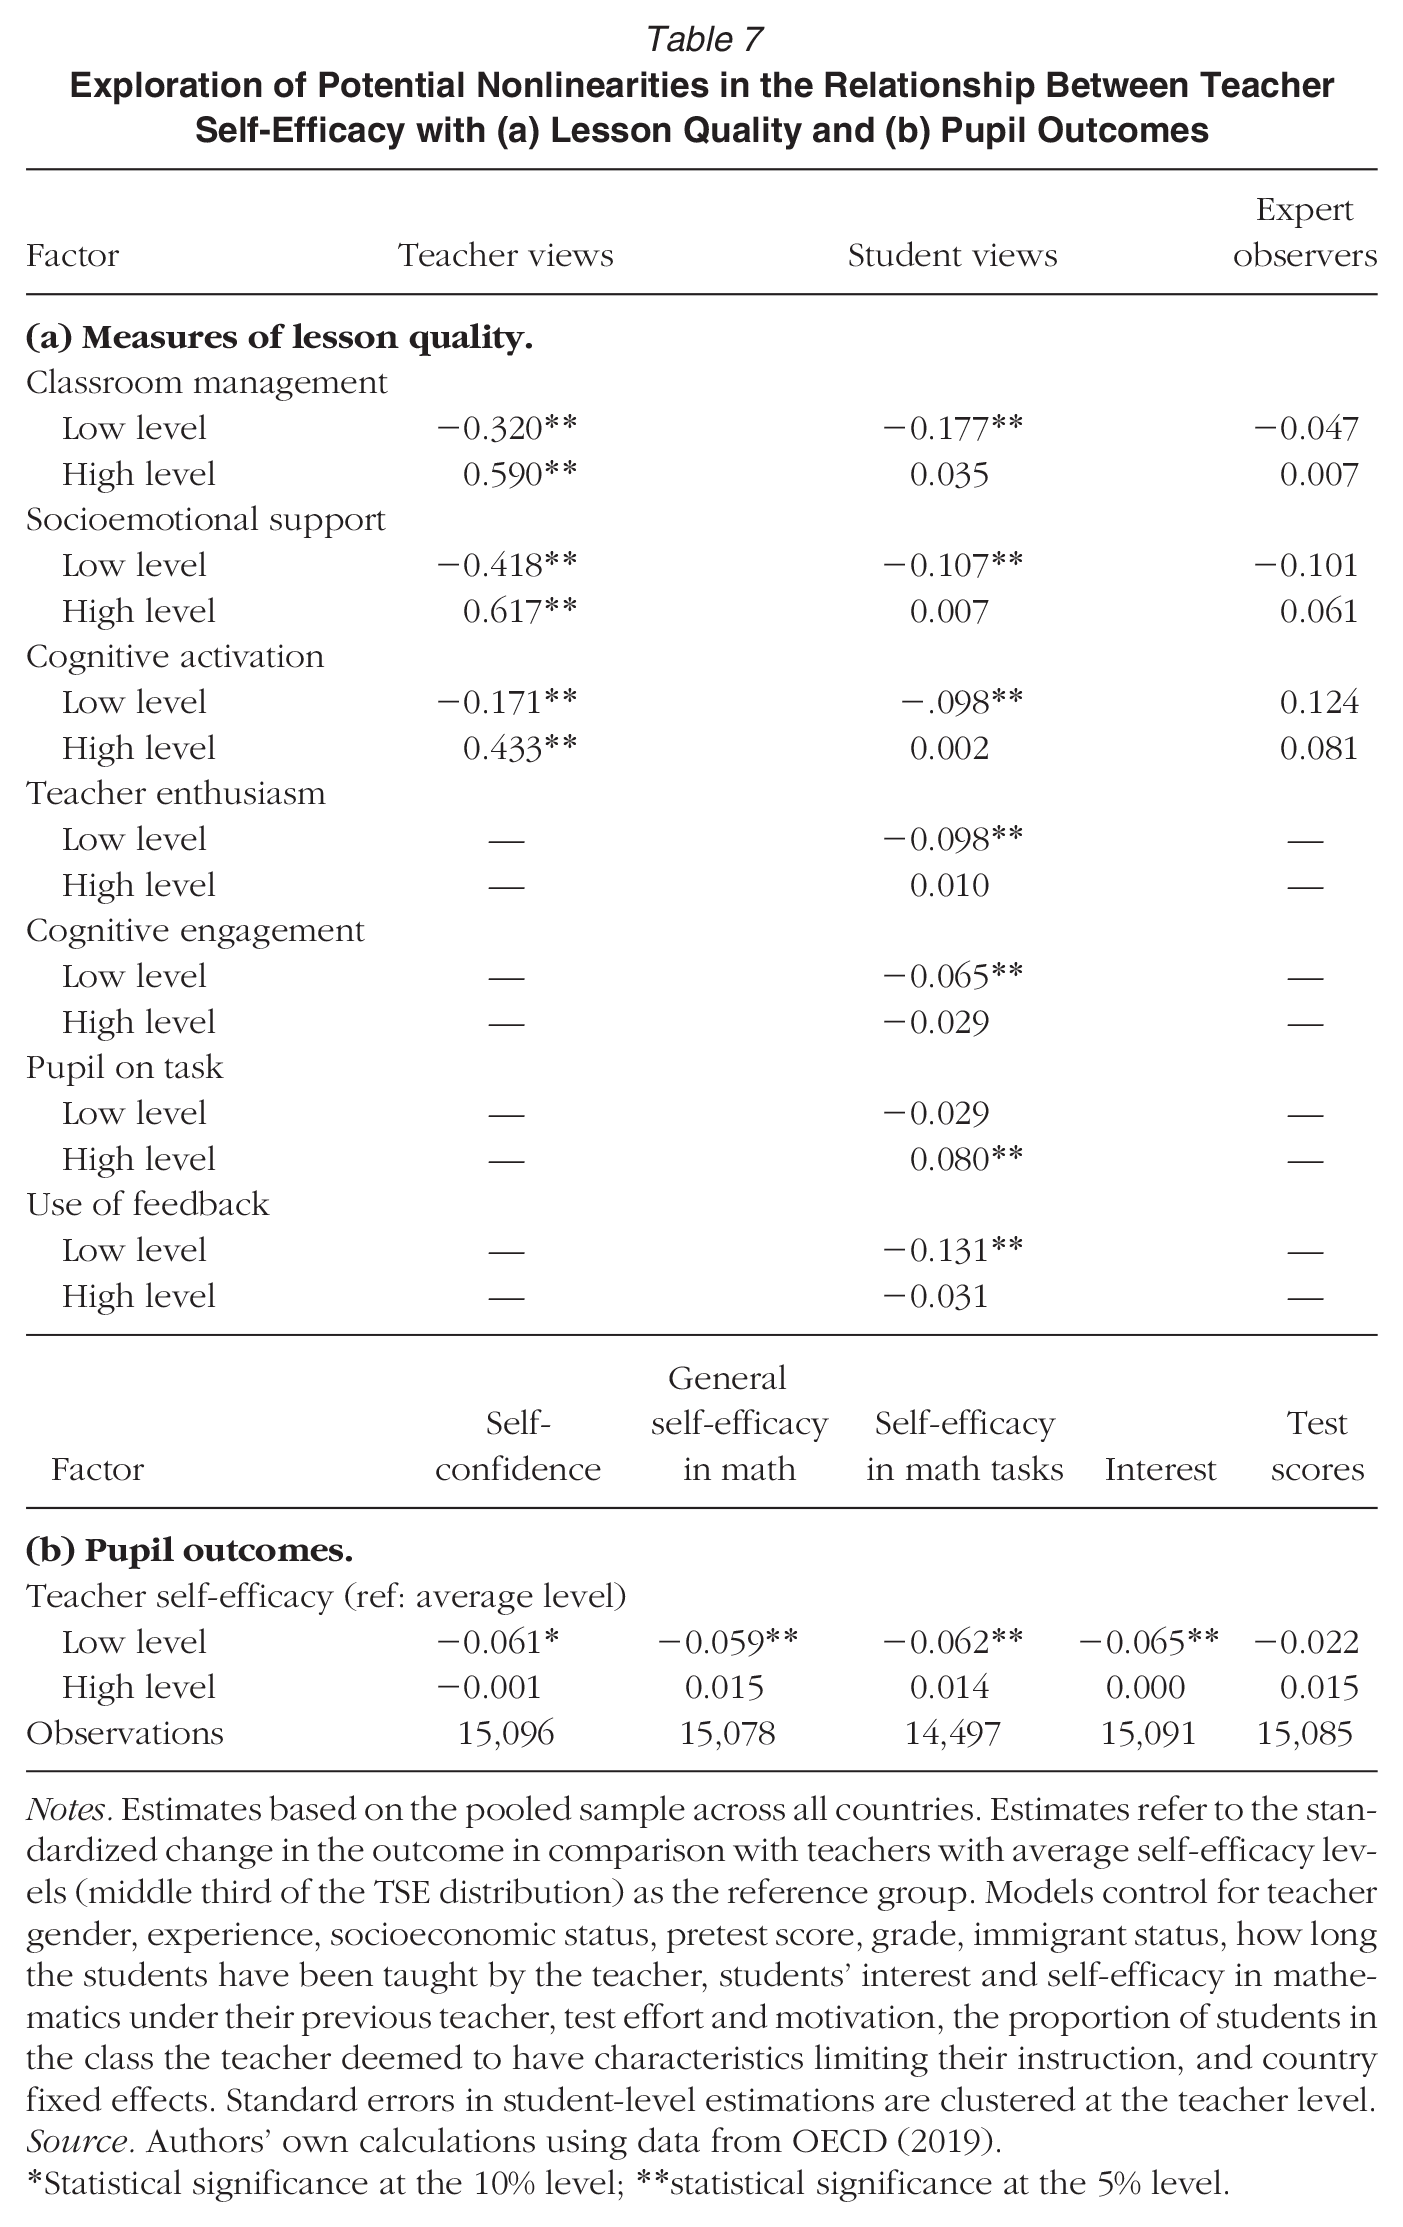
Notes. Estimates based on the pooled sample across all countries. Estimates refer to the standardized change in the outcome in comparison with teachers with average self-efficacy levels (middle third of the TSE distribution) as the reference group. Models control for teacher gender, experience, socioeconomic status, pretest score, grade, immigrant status, how long the students have been taught by the teacher, students’ interest and self-efficacy in mathematics under their previous teacher, test effort and motivation, the proportion of students in the class the teacher deemed to have characteristics limiting their instruction, and country fixed effects. Standard errors in student-level estimations are clustered at the teacher level.
Source. Authors’ own calculations using data from OECD (2019).
Statistical significance at the 10% level; **statistical significance at the 5% level.
There are three key points of note. First, similar broad substantive findings hold, as reported under Research Questions 1 to 3. That is, there are strong associations between TSE and teacher reports of lesson quality, only weak relationships with student reports of lesson quality, and essentially no link with the views of expert observers.
Second, to the extent that there is an association between TSE and student reports of lesson quality, it is being driven by differences between the low versus middle TSE groups. In particular, note how most of the standardized differences for the low-TSE group in the middle column of Table 7 are around 0.1, with most being statistically significant at (at least) the 10% level. In contrast, the standardized differences for the high-TSE group versus the average group are smaller (typically standing at 0.05 or below) with only one reaching statistical significance.
Finally, the results in panel (b)—for student outcomes—exhibit a similar pattern. To the extent that there is any link between TSE and student outcomes, it is restricted to the low- versus middle-TSE groups and only for socioemotional competencies (not test scores). For instance, there is around a 0.06 standard deviation difference in student self-confidence and self-efficacy when they are taught by a teacher with average compared with low levels of self-efficacy but no difference between the average- and high-TSE groups.
Overview of Results from Alternative Analytic Approaches
The overarching principle we have followed has been to apply widely used statistical techniques that are understood across disciplinary audiences. This has the advantage of making the analysis as transparent and accessible as possible. We appreciate, however, that other methodologies can be applied that may offer some technical advantages. A series of alternative estimates is thus presented in the online supplementary material.
An assumption implicitly made within the regression analyses presented earlier is that all variables are measured without error. If this assumption does not hold, then it may bias the estimated associations between TSE and student outcomes. In particular, if there is random noise in our measure of TSE, then estimates of its association with later outcomes are likely to be attenuated (i.e., bias downward). Structural equation modeling can be used to relax this assumption. This approach treats the measure(s) in question (e.g., TSE) as a latent variable. The correlation between the questions used to capture this latent indicator provides an indication of how well it is measured. This can be used to deattenuate estimates of its association with our outcomes.
Online Appendix H consequently presents alternative estimates using a structural equation model (SEM). The use of SEM instead of ordinary least squares typically leads to a slight increase in the estimated standardized differences. Indeed, the only potential exception is with respect to the association between TSE and teacher reports of socioemotional support and cognitive activation during their lessons, where the association becomes somewhat larger. This further strengthens our finding that the link between TSE and the three basic dimensions of teaching quality is much stronger when using teacher self-reports. Otherwise, the use of SEM only leads to rather modest changes to our parameter estimates.
Another limitation with the TALIS Video Study data is that in some participating countries response rates were low (e.g., England), whereas others deviated from the intended sample design (e.g., in Germany, teachers were not randomly selected within schools). This may limit the national representativeness of the sample and thus the external validity (generalizability) of our results. One way to test the sensitivity of estimates to this issue is to construct a set of weights to improve the representativeness of the data. In essence, this approach increases the influence of some students/teachers on the estimates if they are underrepresented in the sample (compared with the broader population). In online Appendix I, we follow the approach of Jerrim (2024), developing and applying a set of weights that attempt to enhance the representativeness of the data. The application of these weights leads to little change to the substantive conclusions drawn.
In our primary model specifications, we also have used missing dummy flags to limit the number of observations dropped from the analysis due to missing data. There are, however, known challenges with this approach that could bias estimates of the association between TSE and our outcomes of interest (Groenwold et al., 2012). In particular, missing data may bring selection bias into the sample. In online Appendix A, we use multiple imputation as an alternative approach. This has the advantaged of predicting—as far as possible—the likely values of the data that are missing, with the standard errors adjusted upward to reflect the extra uncertainty that missing data bring into the analysis. As online Appendix A illustrates, this also does not lead to any substantive change to our conclusions.
Discussion and Conclusions
Teachers are the key actors that deliver instruction to students through which learning gains are made. Consequently, there has been much research into the role played by teachers, including how their psychological and personality constructs are related to instructional quality and student achievement (Klassen & Tze, 2014). Particular interest has been shown in their self-efficacy (Woolfolk et al., 1990). Yet, existing evidence is mixed (Lauermann & ten Hagen, 2021; ten Hagen et al., 2022). While some studies promote the narrative that TSE boosts student achievement (Perera & John, 2020; Zee & Koomen, 2020), the empirical findings of others have cast such claims into doubt (e.g., Jerrim et al. 2023).
This study has contributed new evidence on this matter. We have contributed to the literature by exploring how TSE is linked to the theoretical channels by which it is thought to influence student achievement and by comparing its relationship with instructional quality as measured from three separate perspectives (i.e., students, teachers themselves, and expert observers). Our results illustrate how the TSE–instructional quality relationship is sensitive to who reports the outcome measures; while the link is strong when using teacher reports, it is weak when using student reports and nonexistent when drawing on the ratings of expert observers. To the extent that there is any relationship between TSE and instructional quality, it is likely to be toward the lower end of the distribution (i.e., teachers with low versus average levels of self-efficacy). It is then perhaps unsurprising that we find only a weak relationship between TSE and students’ socioemotional competencies and no link with test scores.
One possible explanation for our finding that different results emerge depending on whether student or teacher reports of instructional quality are used is that they may interpret the survey questions differently. Alternatively, they may have different experiences in the lesson (e.g., students disrupting each other, which the teacher is unaware of). Our null results when using observational data collected from expert observers may say more about the quality of such measures than about the role of TSE. Prior research has questioned the usefulness of such global observation protocols (Kelly et al., 2020), with our analysis showing that they often do not correlate with student or teacher reports of lesson quality (see online Appendix Table D4) and are weak predictors of student outcomes (see Table 4).
On a related matter, it is worth reflecting on whether the measures used are a complete measure of instructional quality. Although the three basic dimensions are a widely used framework, it is important to recognize that they will only partially capture this somewhat broader construct. This then has some potential implications for the generalizability of our findings to other unmeasured areas. For instance, while we find only limited evidence of a link between self-efficacy and these specific measures of instructional quality, we cannot rule out the possibility of there being stronger associations with other aspects of teaching quality that have not been considered in our study.
Nevertheless, our results are more in tune with studies that have questioned the relevance of TSE for student outcomes (e.g., Kim & Seo, 2018) than studies suggesting that it plays an important role (e.g., Klassen & Tze, 2014). As noted by Lauermann and ten Hagen (2021), one reason for this potential discrepancy is the tendency for many studies to rely on outcome measures drawn from a single source (usually the teachers themselves). They argue that the link between TSE and student views—including their experience of the instruction they receive—is likely to be the more relevant issue, and here the association tends to be much weaker. Our findings are consistent with this view.
In our conceptual framework outlined in Figure 1, we identified channel A as the impact of TSE on instructional quality, which then goes on to influence students’ socioemotional outcomes (via channel C) and students’ test scores (via channel D). Of course, this is an association, and we cannot ascribe causality in this context. It is possible that the relationship between TSE and instructional quality works in both directions reciprocally. Successful classroom management, socioemotional support, and cognitive activation may reinforce notions of TSE and thereby raise it. The possibility that high instructional quality raises TSE has been found in prior work using longitudinal data (Holzberger et al., 2013). Theoretically, this is supported by Bandura and National Institute of Mental Health's (1986) system of triadic reciprocal causality, whereby the triad of the classroom environment, teachers’ behavior, and teachers’ cognition affects each other in a dynamic system.
In terms of our conceptual framework and findings, such a reciprocal relationship would mean that teachers who deliver better lessons develop higher levels of TSE and therefore have a strengthened association between TSE and students’ socioemotional outcomes (channel B in Figure 1). This direct effect likely would become stronger over time. However, with data at just two time points, we are unable to explore such dynamic relationships between TSE and instructional quality. As Zee and Koomen (2016) point out, this highlights the need for further research and attention on classroom processes to better understand the direction of the relationships among the dynamic triad.
We do find some support for the argument that particularly low levels of TSE are problematic (Midgley et al., 1989) due to, for instance, this undermining students’ own capacity to learn. School leaders thus may decide to focus their efforts on raising the self-efficacy of particularly underconfident teachers. A recent systematic review by Täschner et al. (2024) considered how this might be achieved in practice. They noted how both “mastery experiences and vicarious experiences play an important role in promoting teacher self-efficacy” (p. 34). Practical examples of the former include role play, teaching mini lessons to peers, and engaging in other forms of microteaching, whereas the latter encompasses observing more experienced teachers and the use of teaching vignettes. Leaders may look to target such approaches toward underconfident teachers in their schools. It has been recommended that at least 7 hours of such activities is needed for the self-efficacy of teachers to be promoted (Täschner et al., 2024).
The results should be considered given the limitations of our work. First, the data we analyze focus on mathematics teachers during their teaching of one specific topic (quadratic equations). Future research thus should seek to further enhance the external validity of our results. Second, the sample size of teachers is relatively modest (~600 in total), particularly for individual countries or regions (~80). Estimates produced for individual countries therefore have only modest levels of statistical power. Third, our focus has been the link between TSE and student outcomes and not the future outcomes of teachers. We recognize, however, that if low self-efficacy leads (good) teachers to leave their jobs, then this may affect student achievement over the longer term (Ronfeldt et al., 2013). We argue that more attention should be paid to this issue in the future so that a better understanding of the link between TSE and teacher retention can be developed. Fourth, it is possible that TSE may vary between students within a given class—but this is not something that is captured within our data. This could lead to underestimation of associations with teacher-reported variables as a result. Fifth, the naturalistic variation in self-efficacy that we investigate—from a single class for each teacher—perhaps does not provide the optimal test of efficacy effects. Future research might seek to exploit the fact that the self-efficacy of individual teachers may vary across the classes they teach, with this within-teacher between-class variation potentially providing opportunities for alternative research designs. Sixth, relatedly, the sample analyzed includes few teachers with major problems of efficacy, judging by the limited number of respondents who disagreed with many of the questions asked (recall Table 1). The generalizability of our findings hence may be improved via replication of our analysis drawing on data that oversamples teachers who are very underconfident in their teaching skills. Finally, while we have investigated the repercussions that various analytic decisions have on our estimates, there are some issues—such as the nonrandom allocation of students to teachers—that may continue to have some impact on our results. Consequently, as with most studies in this literature, our use of observational data means that it is prudent to interpret the estimates as conditional associations rather than necessarily capturing cause and effect.
What, then, do our results imply for education policy and practice? Despite our largely null results, we continue to believe that it may be important for schools to monitor their staff's self-efficacy levels. Why? As noted earlier, it seems likely that if teachers do not believe that they can do much to influence student outcomes, then they will be likely to decide to leave their jobs. With ongoing challenges with teacher retention and recruitment in many countries, losing good staff is something most schools can ill-afford. This, in our view, should now become the focus of the TSE literature. Accompanied by the fact that we find some evidence that particularly low levels of TSE may be linked with lower instructional quality (albeit only weakly), identifying staff who are particularly underconfident in their teaching skills still may be important for schools to do.
Supplemental Material
sj-pdf-1-aer-10.3102_00028312241300265 – Supplemental material for Teacher Self-Efficacy, Instructional Practice, and Student Outcomes: Evidence from the TALIS Video Study
Supplemental material, sj-pdf-1-aer-10.3102_00028312241300265 for Teacher Self-Efficacy, Instructional Practice, and Student Outcomes: Evidence from the TALIS Video Study by John Jerrim, Claudia Prieto-Latorre, Oscar David Marcenaro-Gutierrez and Nikki Shure in American Educational Research Journal
Footnotes
Authorship is listed alphabetically. All authors contributed equally to the manuscript.
This work has been supported in part by the Andalusian Regional Government (SEJ-645) and Fundación Ramón Areces.
J
N
O
C
References
Supplementary Material
Please find the following supplemental material available below.
For Open Access articles published under a Creative Commons License, all supplemental material carries the same license as the article it is associated with.
For non-Open Access articles published, all supplemental material carries a non-exclusive license, and permission requests for re-use of supplemental material or any part of supplemental material shall be sent directly to the copyright owner as specified in the copyright notice associated with the article.