
Abstract
Teachers of color often work in schools with few colleagues from the same racial or ethnic background. This racial isolation may affect their work experiences and important job outcomes, including retention. Using longitudinal administrative and survey data, we investigate the degree to which Tennessee teachers who are more racially isolated are more likely to turn over. Accounting for other factors, we find that racially isolated Black teachers are more likely to leave their schools than less isolated teachers. This turnover is driven by transfers to a different district and exiting the profession altogether. Consistent with an explanation that isolated teachers’ work experiences differ, they also report less collaboration with colleagues and receive lower observation scores.
High rates of turnover among teachers of color 1 present multiple challenges to educational equity. Teachers of color work in schools serving higher proportions of students from low-income households and students of color (Ingersoll & May, 2011; Murnane et al., 1991), with consequences for students in those schools when teachers leave (Ronfeldt et al., 2013). Moreover, exits among teachers of color stymie efforts to build a racially and ethnically diverse teacher workforce. This goal grows in importance as the student population rapidly diversifies (Irwin et al., 2021), especially given that students of color benefit from exposure to teachers with similar racial/ethnic characteristics (e.g., Gershenson et al., 2022; Lindsay & Hart, 2017; Redding, 2019). Insofar as turnover reflects job dissatisfaction or poorer working conditions, higher rates of turnover among teachers of color raise concerns about whether the public education system justly provides the same quality of work experiences as those provided to White teachers. 2
For these reasons, understanding the factors that drive turnover among teachers of color is a key topic for education research. Conditions in schools— such as financial resources, access to mentoring and support, and quality of leadership—affect turnover probabilities across all teachers, including teachers of color (Achinstein et al., 2010). Yet other factors may be more relevant for teachers of color than their White colleagues. For example, teachers of color may feel a greater sense of commitment to working with students from marginalized backgrounds (Dixson & Dingus, 2008; Irizarry & Donaldson, 2012; Ríos & Montecinos, 1999; Su, 1997). Teachers of color are also much more likely to report experiencing racial discrimination at work (e.g., Frank et al., 2021; Milner, 2020; Steiner et al., 2022).
Another factor that may differentially affect turnover for teachers of color is racial isolation, or the condition of working in a school with few other teachers of the same racial or ethnic background. In a teacher workforce that remains close to 80% White nationally (National Center for Education Statistics, 2022), teachers of color are much more likely to be racially isolated than their White colleagues; the degree of isolation varies across state contexts and by group (The Education Trust, n.d.). Isolation may affect workers’ job experiences across different kinds of organizations, including a tendency to be tokenized, challenges bridging relationships with numerically dominant groups, constrained access to social capital within the school, and discrimination (e.g., Kanter, 1977; Nelson, 2019; Smith & Calasanti, 2005). Negative job experiences may lead to different job outcomes, including heightened turnover.
Building directly on research on racial isolation in organizations outside education (e.g., Leonard & Levine, 2006; Turco, 2010) and in schools (e.g., Bristol, 2018, Patrick & Santelli, 2022), we investigate the degree to which teachers of color are more likely to leave racially isolated environments. We also explore potential mediators that may connect racial isolation and turnover. Specifically, we ask two questions. First, to what extent does racial isolation increase the probability that teachers leave their schools? Second, to what extent is racial isolation associated with other measures of teacher work experiences?
We answer these questions using large-scale administrative and survey data from Tennessee, spanning 2007 to 2019. We use teacher demographic and job history data to construct measures of racial isolation and turnover, including movement within and across school districts and exits, for each teacher in each year. Beginning in 2012, we also observe teacher observation scores. We augment these data with 5 years of data (2015 to 2019) from the Tennessee Educator Survey (TES), a statewide survey of teachers. TES data allow us to capture teachers’ perceptions of their schools’ climates and their frequency of collaboration with their fellow teachers. We estimate models with multiple fixed effects strategies to isolate the role of racial isolation in turnover, reported job experiences, and classroom observation ratings.
Racial Isolation, Workplace Dynamics, and Teacher Turnover
Research on predictors of teacher turnover identifies school characteristics as particularly salient for teachers generally (Borman & Dowling, 2008; Grissom et al., 2016; Guarino et al., 2006) and teachers of color specifically (Achinstein et al., 2010). Teachers of any racial background are more likely to leave schools with fewer resources, poorer facilities, or less effective leadership (e.g., Kraft et al., 2016; Murnane et al., 1991). Teachers of color, however, appear to respond differently to some school characteristics. For instance, Black and Hispanic teachers are more likely than White teachers to stay in schools serving larger numbers of Black and Hispanic students (Hanushek et al., 2004; Renzulli et al., 2011; Sun, 2018).
The demographic makeup of other adults in the school building may also influence teacher work experiences and retention. For example, teachers who work for a same-race principal report higher job satisfaction and greater administrative support, receive higher supplemental pay, and turn over at lower rates (Bartanen & Grissom, 2023; Grissom & Keiser, 2011), particularly Black teachers in the South (Viano & Hunter, 2017). Research considering the racial composition of one’s teacher colleagues, however, is less conclusive. Studies find positive, negative, and null associations between congruence with colleagues and outcomes such as job satisfaction, school commitment, and retention for both teachers of color and White teachers, depending on the context, specific groups studied, and how researchers operationalized congruence (e.g., Fairchild et al., 2012; Mueller et al., 1999; Strunk & Robinson, 2006).
We offer a new perspective on this latter body of research by focusing on the impact of teacher racial isolation, which we define as being in a racial or ethnic numerical minority among colleagues. 3 Drawing on perspectives from sociology, social psychology, and industrial-organizational psychology, we propose a conceptual framework linking racial isolation to turnover (summarized in Figure 1). As we discuss below, our framework suggests that racially isolated teachers experience different workplace dynamics, which impact their workplace outcomes and, subsequently, their probability of staying in the role. Importantly, our framework emphasizes that isolation and its effects operate within broader sociohistorical and organizational contexts. We begin our development of this framework with these contexts.
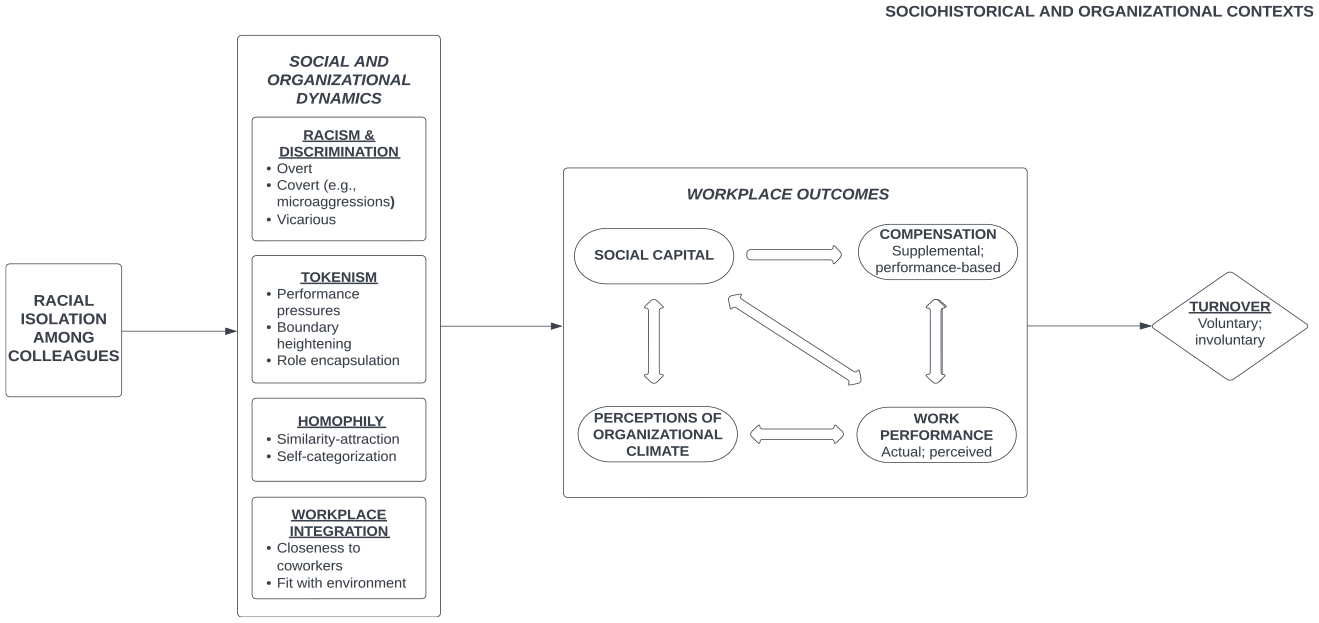
A framework for understanding how racial isolation shapes teacher turnover.
Sociohistorical and Organizational Contexts
Teacher racial isolation is not an idiosyncratic phenomenon. Rather, it results from historical and contemporary social and political forces, such as segregation and patterns of immigration. This broader context shapes local organizational conditions. As we describe later, our empirical focus is Black teachers in Tennessee. Thus, here we discuss some of the relevant sociohistorical context of racial isolation for Black teachers in the American South. The relevant context for isolation among teachers from other racial groups or in other states would differ. 4
In the South, the twin legacies of segregation and desegregation are especially salient to understanding the contemporary educator workforce and its distribution. Prior to the Supreme Court’s 1954 ruling in Brown v. Board of Education that dismantled de jure segregation, Southern schools that enrolled Black students were almost exclusively staffed with Black teachers, long considered community pillars and the backbone of the Black professional middle class (Fenwick, 2022; Irvine & Irvine, 1983; Walker, 2000). Although desegregation positively impacted Black students in many ways, such as improving graduation rates, attainment, earnings, and health (Ashenfelter et al., 2006; Guryan, 2004; Johnson, 2011, 2012; Reber, 2010), it also decimated the employment of Black teachers. In the wake of Brown and the 1964 Civil Rights Act, which accelerated desegregation efforts, Black schools were shuttered and Black educators were fired and demoted en masse (Ethridge, 1979; Haney, 1978). Thompson (2022) estimates that a district transitioning from fully segregated to fully desegregated 5 —approximating the experience of the modal Southern district between 1960 and 1972—led to a 42% reduction in Black teacher employment. Black teachers who remained in previously all-White schools saw their expertise receive less respect from White students and parents (Milner & Howard, 2004).
The mass reduction of the Black teacher workforce constituted a great loss for Black communities (Foster, 1997; Morris et al., 2022). It deprived students of meaningful relationships with dedicated, skilled educators who provided acceptance, high expectations, and support while serving as “surrogate parent figures … disciplinarians, counselors, role models, and overall advocates for their academic social, cultural, emotional, and moral development” (Milner & Howard, 2004, p. 286). As Irvine and Irvine (1983) put it, “Black children no longer were assured that those who taught or administered them would represent their best interest” (p. 418). Moreover, this displacement likely dissuaded subsequent cohorts of potential Black teachers from entering the profession (Hudson & Holmes, 1994; Thompson, 2022), compounding the shrinking of the Black teacher workforce in the South.
In recent decades, schools across the South—and indeed, across the nation—have resegregated, particularly as court-mandated desegregation orders have come to an end (Fiel, 2013; Reardon et al., 2012; Richards, 2014). Teachers are also segregated somewhat by race, with Black teachers working in schools with higher proportions of Black students and teachers than their White colleagues (Frankenberg, 2009). Such patterns may be driven by heightened commitments to working with marginalized students among teachers of color (Achinstein et al., 2010) or biased hiring processes that sort teachers of color into more challenging school environments (D’Amico et al., 2017), among other factors. Many districts have driven additional compensatory resources to schools with high concentrations of Black students as resegregation has occurred (e.g., Billings et al., 2014; Gamoran & An, 2016), but disparities remain between those schools and others with low concentrations of Black students in certain resource categories, such as leadership quality and adequacy of facilities (e.g., Grissom, 2011; Loeb et al., 2005).
To summarize, desegregation drastically shrunk the Black teacher workforce in the South and often left the remaining Black teachers in previously all-White schools with fewer Black colleagues, creating the conditions for racial isolation where they had not existed. As schools have resegregated, a Black teacher workforce that has not recovered to its earlier size has sorted such that (a) Black teachers often group together, but (b) Black teachers still working in predominantly White schools have fewer same-race colleagues. At the same time, the distribution of tangible and intangible resources across increasingly resegregated schools means that these racially isolated teachers in schools serving more advantaged student populations may enjoy benefits that counterbalance or outweigh potential consequences of isolation itself for their work experiences. We return to this possibility in our empirical analysis.
Social and Organizational Dynamics of Racial Isolation in the Workplace
Against this contextual backdrop, we now turn to the within-school dynamics that shape a racially isolated teacher’s experiences and, ultimately, whether they stay in their schools. Multiple theoretical perspectives developed from studies of schools and other organizations help shed light on these dynamics. We focus on four: discrimination, tokenism, homophily, and workplace integration.
Discrimination
As in broader society, people of color confront race-based discrimination in the workplace (Bonilla-Silva, 1997; Desmond & Emirbayer, 2009), ranging from covert or subtle (e.g., microaggressions) to overt or obvious discrimination (Lennartz et al., 2019; Pérez Huber & Solorzano, 2015). 6 Individuals may also experience secondhand or vicarious discrimination by witnessing the encounters of other people of color in their environment (Nuru-Jeter et al., 2009; Truong et al., 2016). Employees may be less likely to experience discrimination when the majority of their coworkers are of the same race (Stainback & Irvin, 2012). Conversely, racial isolation may be associated with greater discrimination at work and may mean less access to same-race peers whose support helps buffer against the impacts of this discrimination (Mawhinney et al., 2021). Perceived discrimination appears to negatively affect workers’ experiences and outcomes—such as job stress, perceptions of justice, health—and predict turnover intentions (Dhanani et al., 2018; Triana et al., 2015). For teachers of color, experiences with discrimination and race-based stress are associated with decreased feelings of school membership and satisfaction, and increased intent to leave the profession (Frank et al., 2021; Grooms et al., 2021; Steiner et al., 2022).
Tokenism
Tokenism offers another lens on racial isolation. According to Kanter (1977), workers who are extreme numerical minorities in their organization—Kanter suggested below 15%—experience negative treatment that dissipates as they become more proportionately represented. This treatment can include additional performance pressures due to hypervisibility, boundary heightening and out-group exclusion from the dominant group, and stereotyping role encapsulation that constrains their opportunities. Bristol (2020) extends this theory to highlight how workers who are the only one of their social group may face even more adverse experiences than others who have at least a few same-group colleagues. Research in both the private sector (e.g., Jackson et al., 1995; Leonard & Levine, 2006; Zatzick et al., 2003) and in education (e.g., Bettini et al., 2022; Dworkin et al., 1986; Kelly, 2007) finds evidence consistent with these theories regarding the consequences of tokenism and a nonlinear relationship between numeric composition and outcomes such as employee turnover.
Homophily
Homophily refers to the principle that social contact occurs at higher rates between similar individuals. Similarity-attraction theory provides one potential mechanism: People prefer interacting with others with similar traits and attributes because of lower likelihood of conflict and discomfort (Byrne, 1971; Sherif, 1958). Self-categorization theory provides another: People use race and other characteristics to define their own social identity, encouraging interaction within that group to reinforce that identity (Tajfel & Turner, 1986; Turner et al., 1987). Research finds evidence of homophily across attributes such as age (Feld, 1982), gender (Ibarra, 1992), and education (Marsden, 1987), but race/ethnicity appears to produce the strongest social network divides (McPherson et al., 2001). Racially isolated teachers may be especially susceptible to these in-group/out-group dynamics because they have few same-race colleagues.
Workplace Integration
Experiences with discrimination, tokenism, or exclusion arising from homophily can alter how an individual feels about coworkers within their organization. A workplace integration lens focuses on this affective connection and posits that more integrated workers experience a better fit with their environment, increasing closeness to coworkers and job enjoyment, making them less likely to leave (Kreiner, 2006; O’Reilly et al., 1989). Employees can engage in “integration behaviors” by engaging socially at work, producing stronger connections to coworkers and the organization, especially if individuals feel like all aspects of their identities are welcomed (Nippert-Eng, 1996; Pratt & Rosa, 2003). Employees who are more racially dissimilar from coworkers may have fewer integration opportunities and may not experience greater closeness even when they actively attempt to integrate more (Dumas et al., 2013). Racially isolated teachers may face challenges in becoming integrated within the social dynamic of the workplace, making them feel less connected to their fellow teachers and schools.
Workplace Outcomes
Challenging workplace dynamics experienced by racially isolated workers may lead to negative workplace outcomes. We argue that these outcomes, in turn, increase turnover. We discuss four outcomes relevant to the isolation–turnover linkage in schools: social capital, perceived school climate, job performance, and compensation.
Social Capital
Social capital refers to benefits and resources derived from social networks and group membership, such as reciprocal obligations, information channels, or effective norms that help an individual achieve their interests (Bourdieu, 1986; Coleman, 1988). Theories of homophily and workplace integration suggest that same-race networks are stronger and accrue more benefits to an employee. Racially isolated teachers are thus disadvantaged in building up reserves of social capital (Nelson, 2019). Even small increases in representation can predict improved social conditions for Black and Latinx teachers, evidenced by more equitable social networks, higher levels of perceived influence over school policy, and more frequent teacher collaboration (Bristol, 2018, 2020; Bristol & Shirrell, 2019; Patrick & Santelli, 2022). Studies outside education find that consequences of limited social capital, such as exclusion from decision making and perceived powerlessness, predict turnover intentions (Chiaburu et al., 2014; Shore et al., 2011; Smith & Calasanti, 2005). In other words, restricted access to social capital may lead racially isolated teachers to turn over at higher rates.
Perceptions of Organizational Climate
In industrial-organizational psychology, organizational climate refers to shared perceptions of and meaning attached to workplace policies, practices, and procedures (Schneider et al., 2013). In education, climate encompasses the academic, community, safety, and institutional character of a school (Cohen et al., 2009). Assessment of an organization’s climate is a key facet of working conditions that researchers in education and elsewhere have linked empirically to employee retention (e.g., Ehrhart & Kuenzi, 2017; Kraft et al., 2016). Racial isolation may produce negative experiences with and impressions of climate. Experiences with tokenism, for example, can lead employees to perceive their organization’s climate as inequitable (King et al., 2010). Similarly, isolated teachers of color who experience discrimination may view school climates as hostile and feel steadily pushed out from both the school and the field (Kohli, 2018; Pizarro & Kohli, 2020).
Work Performance
Cumulatively, adverse affective experiences and increased stress from challenging workplace dynamics may negatively impact teachers’ workplace performance. Industrial-organizational psychology research finds that hindrance-based occupational stressors have a negative relationship with job performance (Beehr et al., 2000; Gilboa et al., 2008; Motowidlo et al., 1986). Racially isolated teachers may have to divert energy to managing stress from negative social interactions or general racial hostility that they would otherwise be able to devote to improving instruction. Inhibited access to social capital may also affect performance. For instance, Black numerical minority teachers in Nelson’s (2019) study were unable to secure professional resources through their networks that might make them more effective teachers. Alternatively, isolated teachers may be perceived as less effective when compared to the numerical majority teachers in their schools, which may have consequences for their observation ratings (Grissom & Bartanen, 2022). Lower job performance or perceived performance can reduce job satisfaction, making turnover more likely, or lead to dismissal or counseling out.
Compensation
This link to job performance may also reduce compensation for racially isolated teachers in systems where a component of pay is performance-based (as it often is in Tennessee school districts). Even under traditional salary schedules, overall teacher compensation may be reduced by more limited access to knowledge about supplemental pay opportunities or the micropolitical power to access those opportunities, both forms of social capital (Nelson, 2019). Such dynamics may be why studies find that supplemental pay is higher for teachers with racially similar principals (Grissom & Keiser, 2011). Higher pay can reduce teacher turnover (Hendricks, 2014).
Turnover
Adverse workplace dynamics and outcomes may push racially isolated teachers to voluntarily leave their positions. As a result, these teachers may transfer schools within or outside of their districts to seek better working environments or may exit the profession entirely. Alternatively, performance challenges that arise from these conditions may make involuntary dismissal or displacement more likely. Conceptually, this distinction is critical, though data limitations prevent this study from distinguishing voluntary from involuntary turnover.
In sum, our framework hypothesizes that racially isolated teachers of color will face challenging workplace dynamics that may negatively impact their outcomes in their schools, in turn raising the likelihood that they turn over. The next two sections describe our empirical approach to testing the connection between racial isolation and turnover, plus several other predictions this framework generates.
Data and Measures
This study uses administrative and survey data from Tennessee, both collected through a partnership between the Tennessee Department of Education (TDOE) and Tennessee Education Research Alliance (TERA) at Vanderbilt University. Tennessee is situated in the American South, educates approximately one million students within 1,800 public schools in 147 districts, and employs roughly 65,000 classroom teachers.
Administrative Data
Longitudinal staff data files capture demographic and work history information for all K–12 public school employees beginning in the 2002–2003 school year. Demographic information includes gender identification (male or female) and race/ethnicity classification (White, Black, Hispanic/Latino, Asian, Native American, Native Hawaiian/Pacific Islander, or other). 7 Highest degree is also available. Work history information includes, in each year, each educator’s job title, location, and accumulated years of work experience. It also includes compensation information and, following the implementation of the state’s required multiple-measure educator evaluation system in 2011–2012, annual average classroom observation scores for each teacher.
We merge staff data with files containing school- and district-level characteristics such as student demographics, enrollment, and achievement levels. Because complete data on these characteristics are only available beginning in 2006–2007, we restrict our main analysis to the school years from 2006–2007 to 2018–2019. Our final analytic sample consists of 742,340 teacher-by-year observations.
Column 1 of Table 1 presents descriptive statistics for all teachers in the sample. Mirroring national trends, Tennessee’s teacher workforce is considerably less racially/ethnically diverse than its student population. Eighty-four percent of the teachers in our sample are White, 14% are Black, and other racial/ethnic groups compose less than 1% each of the sample. In comparison, 61% of the state’s students are White; 24% are Black; 12% are Hispanic/Latino; and the remainder are Asian, Native American, or Native Hawaiian/Pacific Islander (NHPI). Seventy-eight percent of Tennessee teachers are female.
Descriptive Statistics for Full Sample
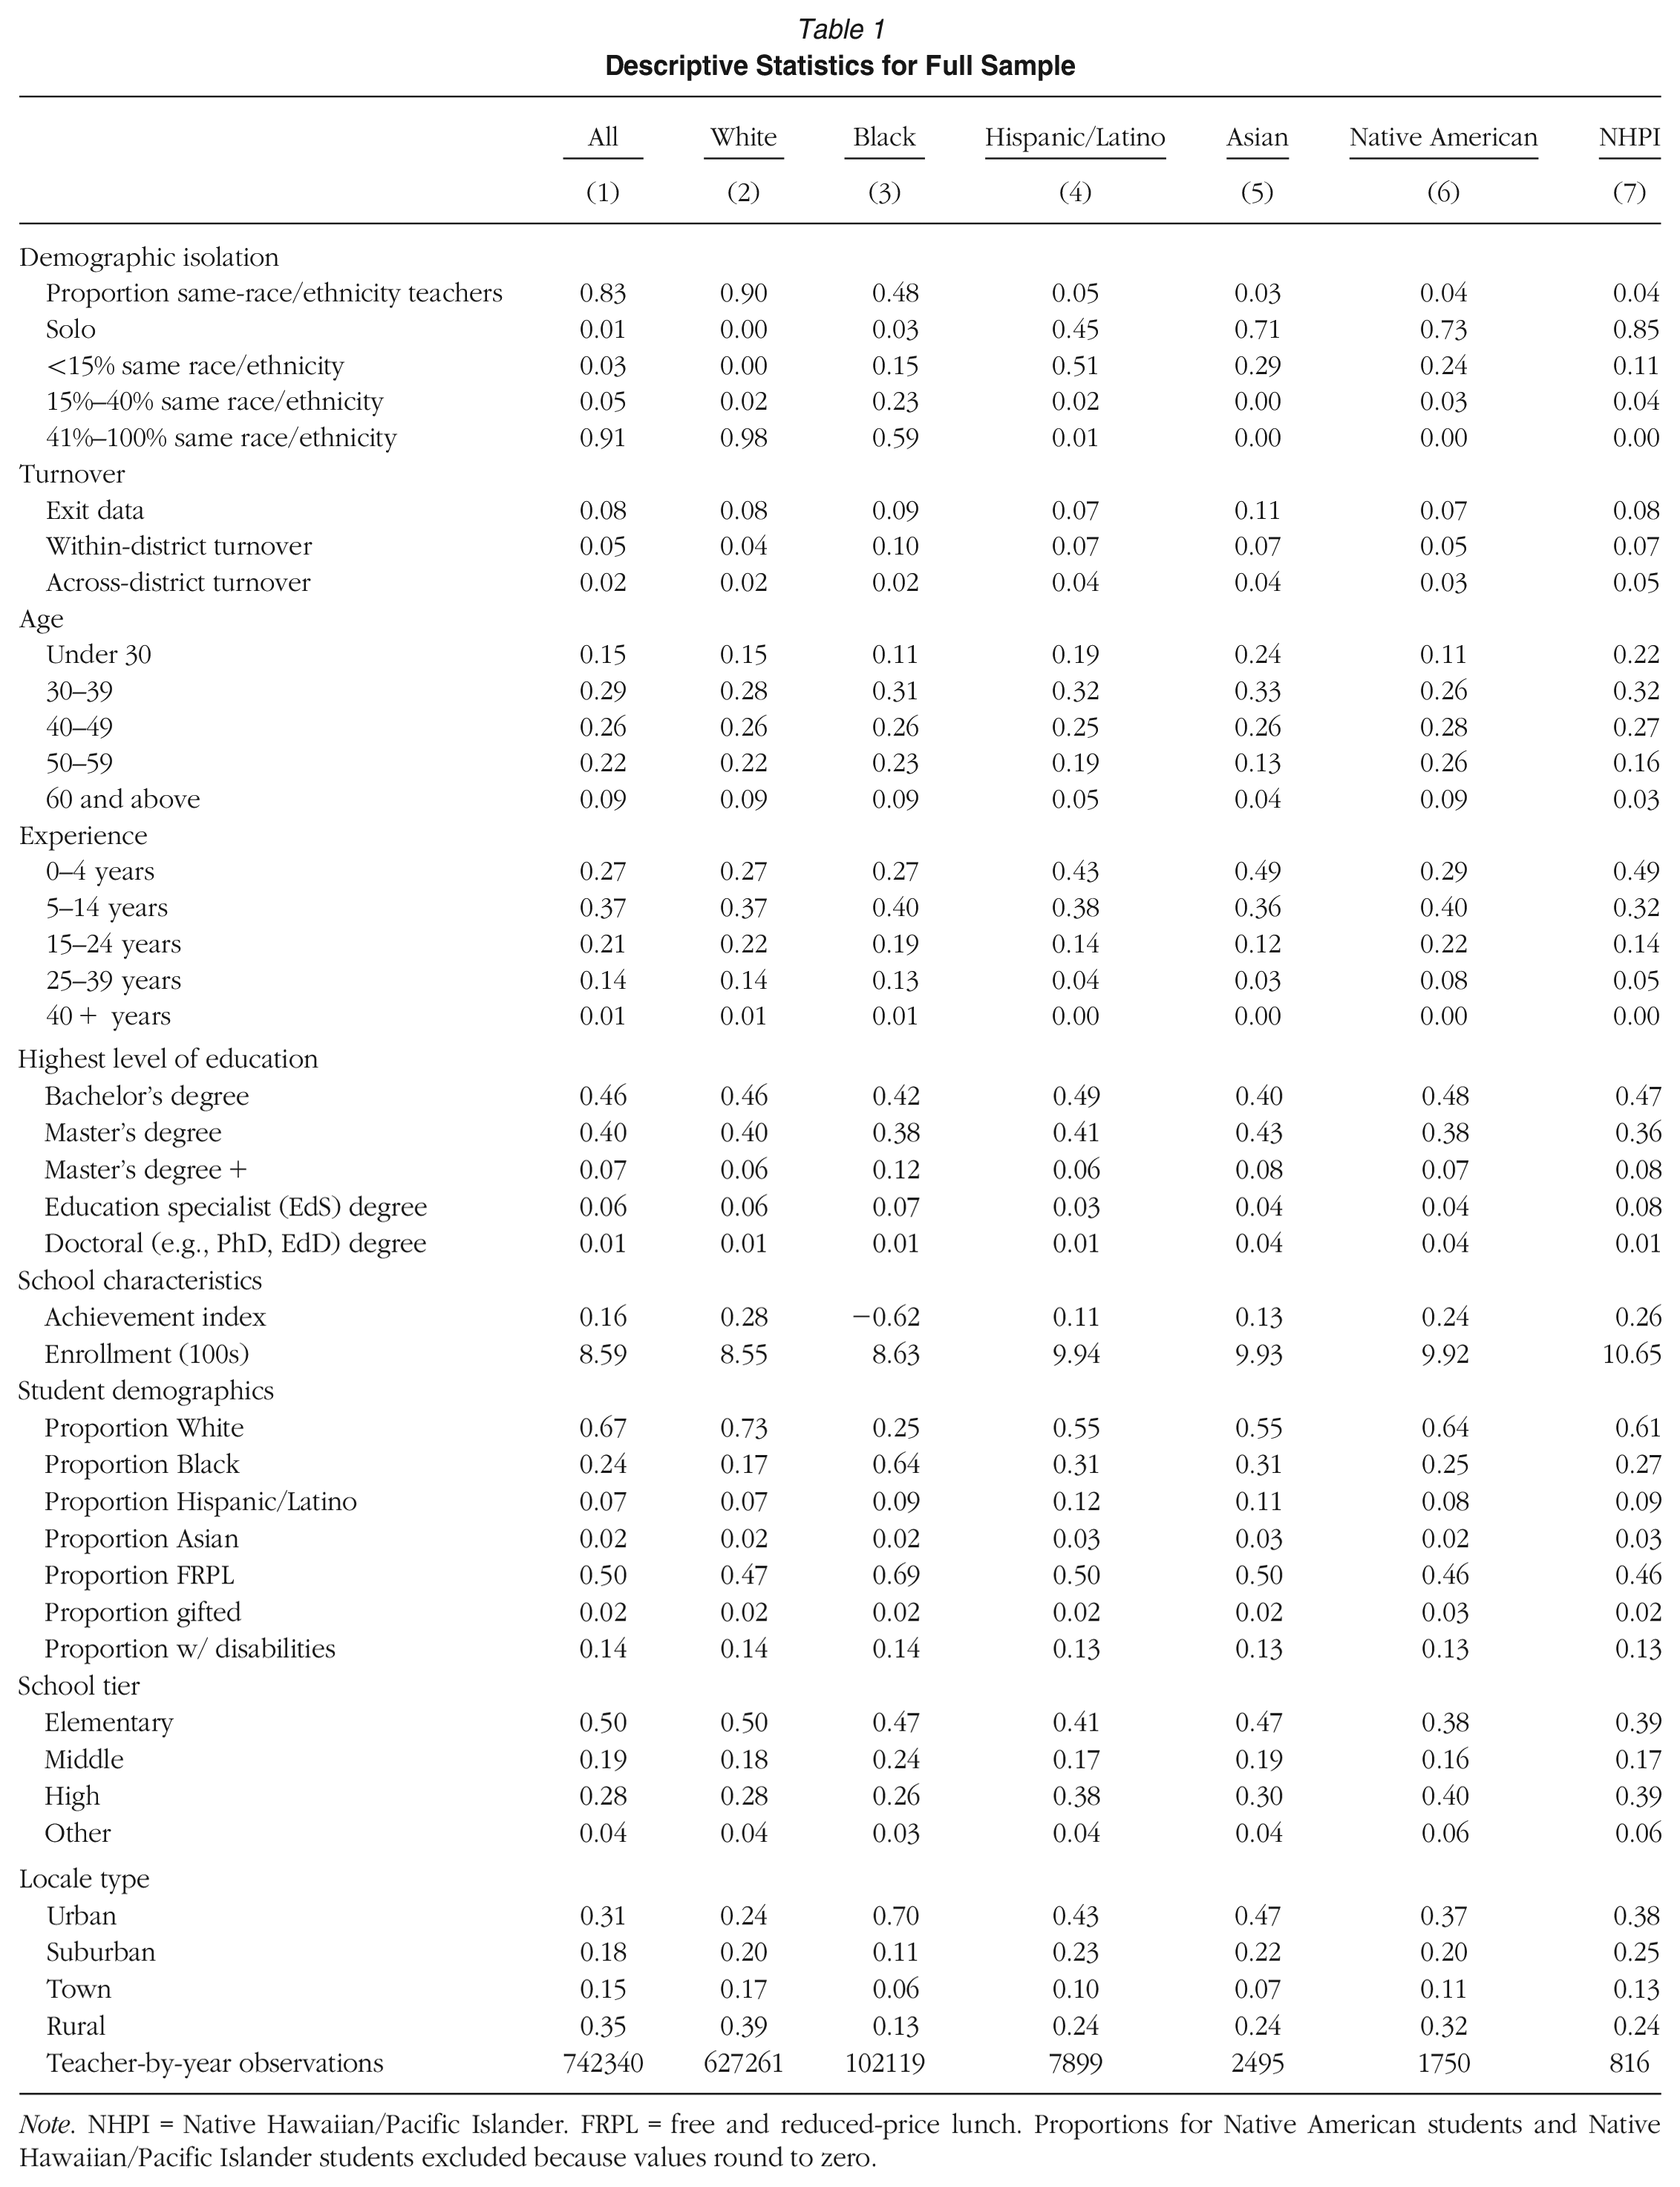
Note. NHPI = Native Hawaiian/Pacific Islander. FRPL = free and reduced-price lunch. Proportions for Native American students and Native Hawaiian/Pacific Islander students excluded because values round to zero.
Survey Data
We also make use of data from 5 years of the TES: 2014–2015 through 2018–2019. The TES is an online survey distributed in March of each year to every public-school educator in the state. The TES includes a core set of questions administered to all teachers that gathers feedback about school climate, leadership, instruction, and evaluation, plus randomly assigned modules that ask about specific professional issues. Anonymized identifiers permit linking responses to other administrative data for research purposes. Response rates over this time period averaged 49% (see Appendix Table A1 in the online version of the journal for more information on response rates).
Measures
Racial Isolation
To operationalize racial isolation, we first construct a continuous measure by calculating the school-level percentage of teaching staff in each racial/ethnic group. We then create a theory-aligned ordinal measure based on the categories developed by Kanter (1977) and Bristol (2020) to explore differences based on proportional representation of teachers in the school with the same race/ethnicity (see Patrick & Santelli, 2022). After some preliminary analyses, we simplified those six categories to four: (a) solo, (b) less than 15% same-race/ethnicity but not a solo, (c) 15% to 40% same-race/ethnicity, and (d) 41% to 100% same-race/ethnicity. 8 Table 1 displays descriptive patterns of isolation for our sample. In the aggregate, 91% of Tennessee teachers work in schools where 41% to 100% of teachers belong to their same race/ethnicity, although, as we discuss later, there are notable differences by teacher racial/ethnic subgroups.
Teacher Turnover
We construct both binary and categorical measures of teacher turnover using work history information in the staff files. For both kinds of measures, we compare job and work location at the end of school year t to the same information in year t+1. If the teacher is in the same job (teaching) in the same school, they are coded as a stayer. If they are not, they are coded as turning over for the binary indicator. For both measures, teachers who move to nonteaching positions (about 1% of all teacher-year observations) are dropped. For the categorical measure, we disaggregate turnover into three types: turnover within the same district, turnover across districts, and exits from the system. A teacher is coded as turning over (within or across districts) in year
Workplace Outcomes
As shown in Figure 1, we hypothesize that racial isolation could impact several workplace outcomes. We create multiple measures of such outcomes.
Survey-based measures of organizational climate and colleague collaboration
TES data permitted building two scales aligned to elements in our conceptual framework. First, we create a measure of organizational climate that captures teachers’ general perceptions of the workplace and school leadership after exploratory factor analysis revealed that items measuring these perceptions loaded onto a single factor (results not shown). Some survey items associated with these constructs changed across years (see Appendix Table A2 in the online version of the journal for items), so we created year-specific measures and standardized them for comparability.
9
These measures displayed a high degree of reliability (Cronbach’s
Second, to capture a key avenue through which teachers accrue social capital within the school, we constructed a standardized frequency of collaboration scale. Items in this scale captured how often teachers meet together for various instructional purposes (e.g., to develop materials or activities for classes, to review student assessment data). Again, variations in collaboration questions asked on the TES across years required creating year-specific measures and standardizing (see Appendix Table A3 in the online version of the journal for items). These measures had acceptable levels of internal consistency (Cronbach’s
Observation ratings
Classroom observations provide one measure of work performance. The state evaluation system requires that such ratings are assigned by raters (almost always the principal or assistant principal in the teacher’s school) using a state-approved rubric, typically two to five times per year. Roughly 80% of teachers are evaluated with the state’s TEAM rubric, which defines levels of performance on 19 indicators in the domains of instruction, environment, and planning, plus four indicators describing teacher professionalism. 11 Each indicator is scored on a discrete 1 to 5 scale. We average scores over the school year to form a summative classroom observation rating, then standardize across teachers. 12
Compensation
From the administrative files, we capture each teacher’s total compensation. This value combines teachers’ base salaries with other pay sources, such as supplemental pay (e.g., for increased responsibilities) and performance-based compensation, which is provided in some districts. 13 We take the natural logarithm of total compensation to reduce the influence of outlier values.
Methods
The primary question we seek to answer is, Does racial isolation increase the likelihood that a teacher leaves their position? Answering this question requires overcoming two key empirical challenges. First, the racial composition of a teacher’s colleagues likely is related to other characteristics of the school (e.g., working conditions, the local labor market) that also affect turnover rates. Second, teachers who choose to work in schools where they face greater isolation may have higher (or lower) propensity to leave their positions. Our primary empirical strategy is to employ school fixed effects to account for unobserved school-level differences that may otherwise confound our estimates of the effect of racial isolation. We further control for a set of teacher characteristics and time-varying school characteristics. The base model is represented by Equation (1).
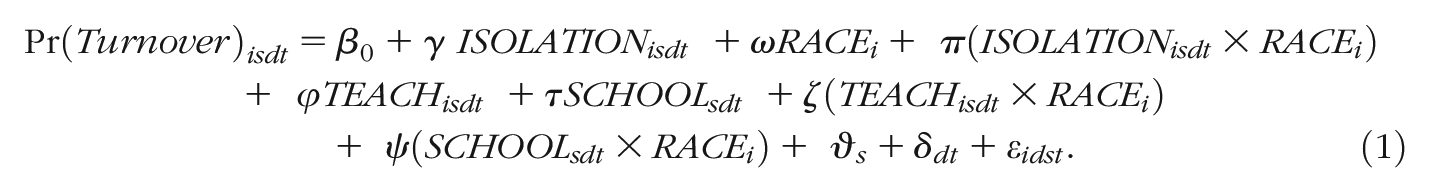
The model estimates the probability of turnover for teacher i in school s in district d in school year t as a function of the racial isolation they experience in their school that year, captured by vector ISOLATION, which denotes the category of isolation (e.g., solo, less than 15% same-race/ethnicity) into which the teacher falls. We interact ISOLATION with teacher race (RACE) to allow the association between teacher turnover and racial isolation to vary by racial (or ethnic) group. Initially, we allowed RACE to include indicators for Black, Hispanic/Latino, Asian, Native American, and NHPI, though as we discuss later, statistical power challenges associated with small cell sizes led us to adjust this approach.
Our preferred specification includes school fixed effects (
To account for other teacher- or school-level factors that could confound our estimate of the impact of isolation on turnover, we control for a vector of teacher characteristics TEACH (gender, age, experience, highest degree) and time-varying school characteristics SCHOOL (average achievement as measured by an index of test score levels; enrollment size; proportions of Black, Hispanic/Latino, Asian, Native American, and NHPI students; proportions of students who are free/reduced price lunch eligible, gifted, or classified as having a disability; and the race/ethnicity of the school’s principal). Teacher characteristics account for potential nonrandom sorting of teachers to schools. For instance, new teachers (who tend to have higher turnover rates) may have fewer job opportunities and are thus more likely to accept a position in a school where they are racially isolated. In robustness checks, we also estimate models with teacher fixed effects, which further accounts for sorting on unobservable teacher characteristics, to the extent that they are fixed over time.
School characteristics account for time-varying factors that could drive changes in staff racial composition and turnover (e.g., neighborhood gentrification). Also, given evidence that teachers of color may prefer to work in schools with different characteristics or experience differential treatment with respect to those characteristics (Grissom & Bartanen, 2022; Sun, 2018), we interact the covariates in TEACH and SCHOOL with teacher race to allow associations with turnover to vary by racial group. These interactions ensure, for instance, that our estimates of the impact of colleague isolation are not driven by preferences of teachers to work in schools with more same-race students. Finally, we include district-by-year fixed effects (
We supplement our models of binary turnover with multinomial turnover models that separate turnover into within-district moves, across-district moves, and exits. We estimate each of these outcomes as linear probability models relative to the probability of staying.
Following our investigation of turnover, we consider possible mediators of the association between racial isolation and turnover. We fit models predicting organizational climate and leadership ratings, frequency of collaboration, observation scores, and salaries with isolation using an approach parallel to the one described by Equation (1).
Results
The Landscape of Racial Isolation in Tennessee
As an important framing for our analysis of racial isolation and turnover, we begin by describing the contexts in which teachers of different racial/ethnic groups work in Tennessee, then how the contexts of racially isolated teachers vary by their race/ethnicity. For this descriptive look, we include White, Black, Hispanic/Latino, Asian, Native American, and NHPI teachers.
Table 1 shows descriptive statistics first for the full sample (column 1), then disaggregated by teacher race or ethnicity (columns 2–7), where the unit of observation is a teacher-year. The top rows show the fraction of colleagues at one’s school who are of the same race. On average, Tennessee teachers work at a school in which 83% of teachers are racially similar, and just 9% work at schools in which they share racial background with fewer than 40% of their colleagues, suggesting that, overall, racial isolation is uncommon. Importantly, however, there is large variation by teacher race/ethnicity. Whereas the average White teacher works in a school where 90% of teachers are White, the average Black teacher works in a school where 48% of teachers are Black, and the mean fraction of same-race colleagues for Hispanic/Latino, Asian, Native American, and NHPI teachers ranges from 3% to 5%. Racial isolation is thus much more common among teachers of color. A vanishingly small fraction of White teachers in Tennessee work in a school in which fewer than 15% of teachers are of the same race; compared to 18% of Black teachers; and 96% or more of Hispanic/Latino, Asian, Native American, and NHPI teachers. Indeed, the modal teacher from any of the latter three groups is the only teacher of their racial/ethnic background in their school.
Table 1 also shows important differences in school characteristics by teacher race. Notably, 70% of Black teachers work in urban schools, compared to just 24% of White teachers (and 37% to 47% of teachers from other groups). This comparison begins to highlight the racial segregation of Tennessee’s teachers. It also parallels geographic segregation among Black and White students. Indeed, White teachers, on average, teach in schools where White students constitute the large majority of enrollment (73% for the typical White teacher), while Black teachers tend to work in school where Black students constitute the majority (64% for the typical Black teacher). Hispanic/Latino, Asian, Native American, and NHPI teachers in Tennessee generally teach in more racially and ethnically diverse schools than White teachers do, though most students in their schools still are White. Also, Black and Hispanic/Latino teachers work in schools in which student achievement is typically lower than the schools where White, Native American, and Asian teachers work; Black teachers teach in schools with higher average levels of economic disadvantage than other teachers.
Table 2 presents school characteristics and turnover rates by race and ethnicity, divided by degree of racial isolation. Turnover patterns vary by teacher race and ethnicity and level of racial isolation. Descriptively, Black teachers who work in schools where they constitute 41% to 100% of teachers exit and turn over within-district at higher rates than Black teachers who are more racially isolated. Conversely, White teachers turn over within-district at lower rates as their racial isolation decreases. Black and White teachers experiencing higher levels of racial isolation are more likely to exit or move schools within a district at a higher rate than those who are less racially isolated. More isolated Hispanic/Latino teachers are more likely to move within their districts, though patterns for the other kinds of turnover are less clear. Although shown for completeness, turnover patterns for Asian, Native American, and NHPI teachers are unclear because essentially all teachers from those groups are isolated.
School Characteristics by Race and Ethnicity and Level of Isolation
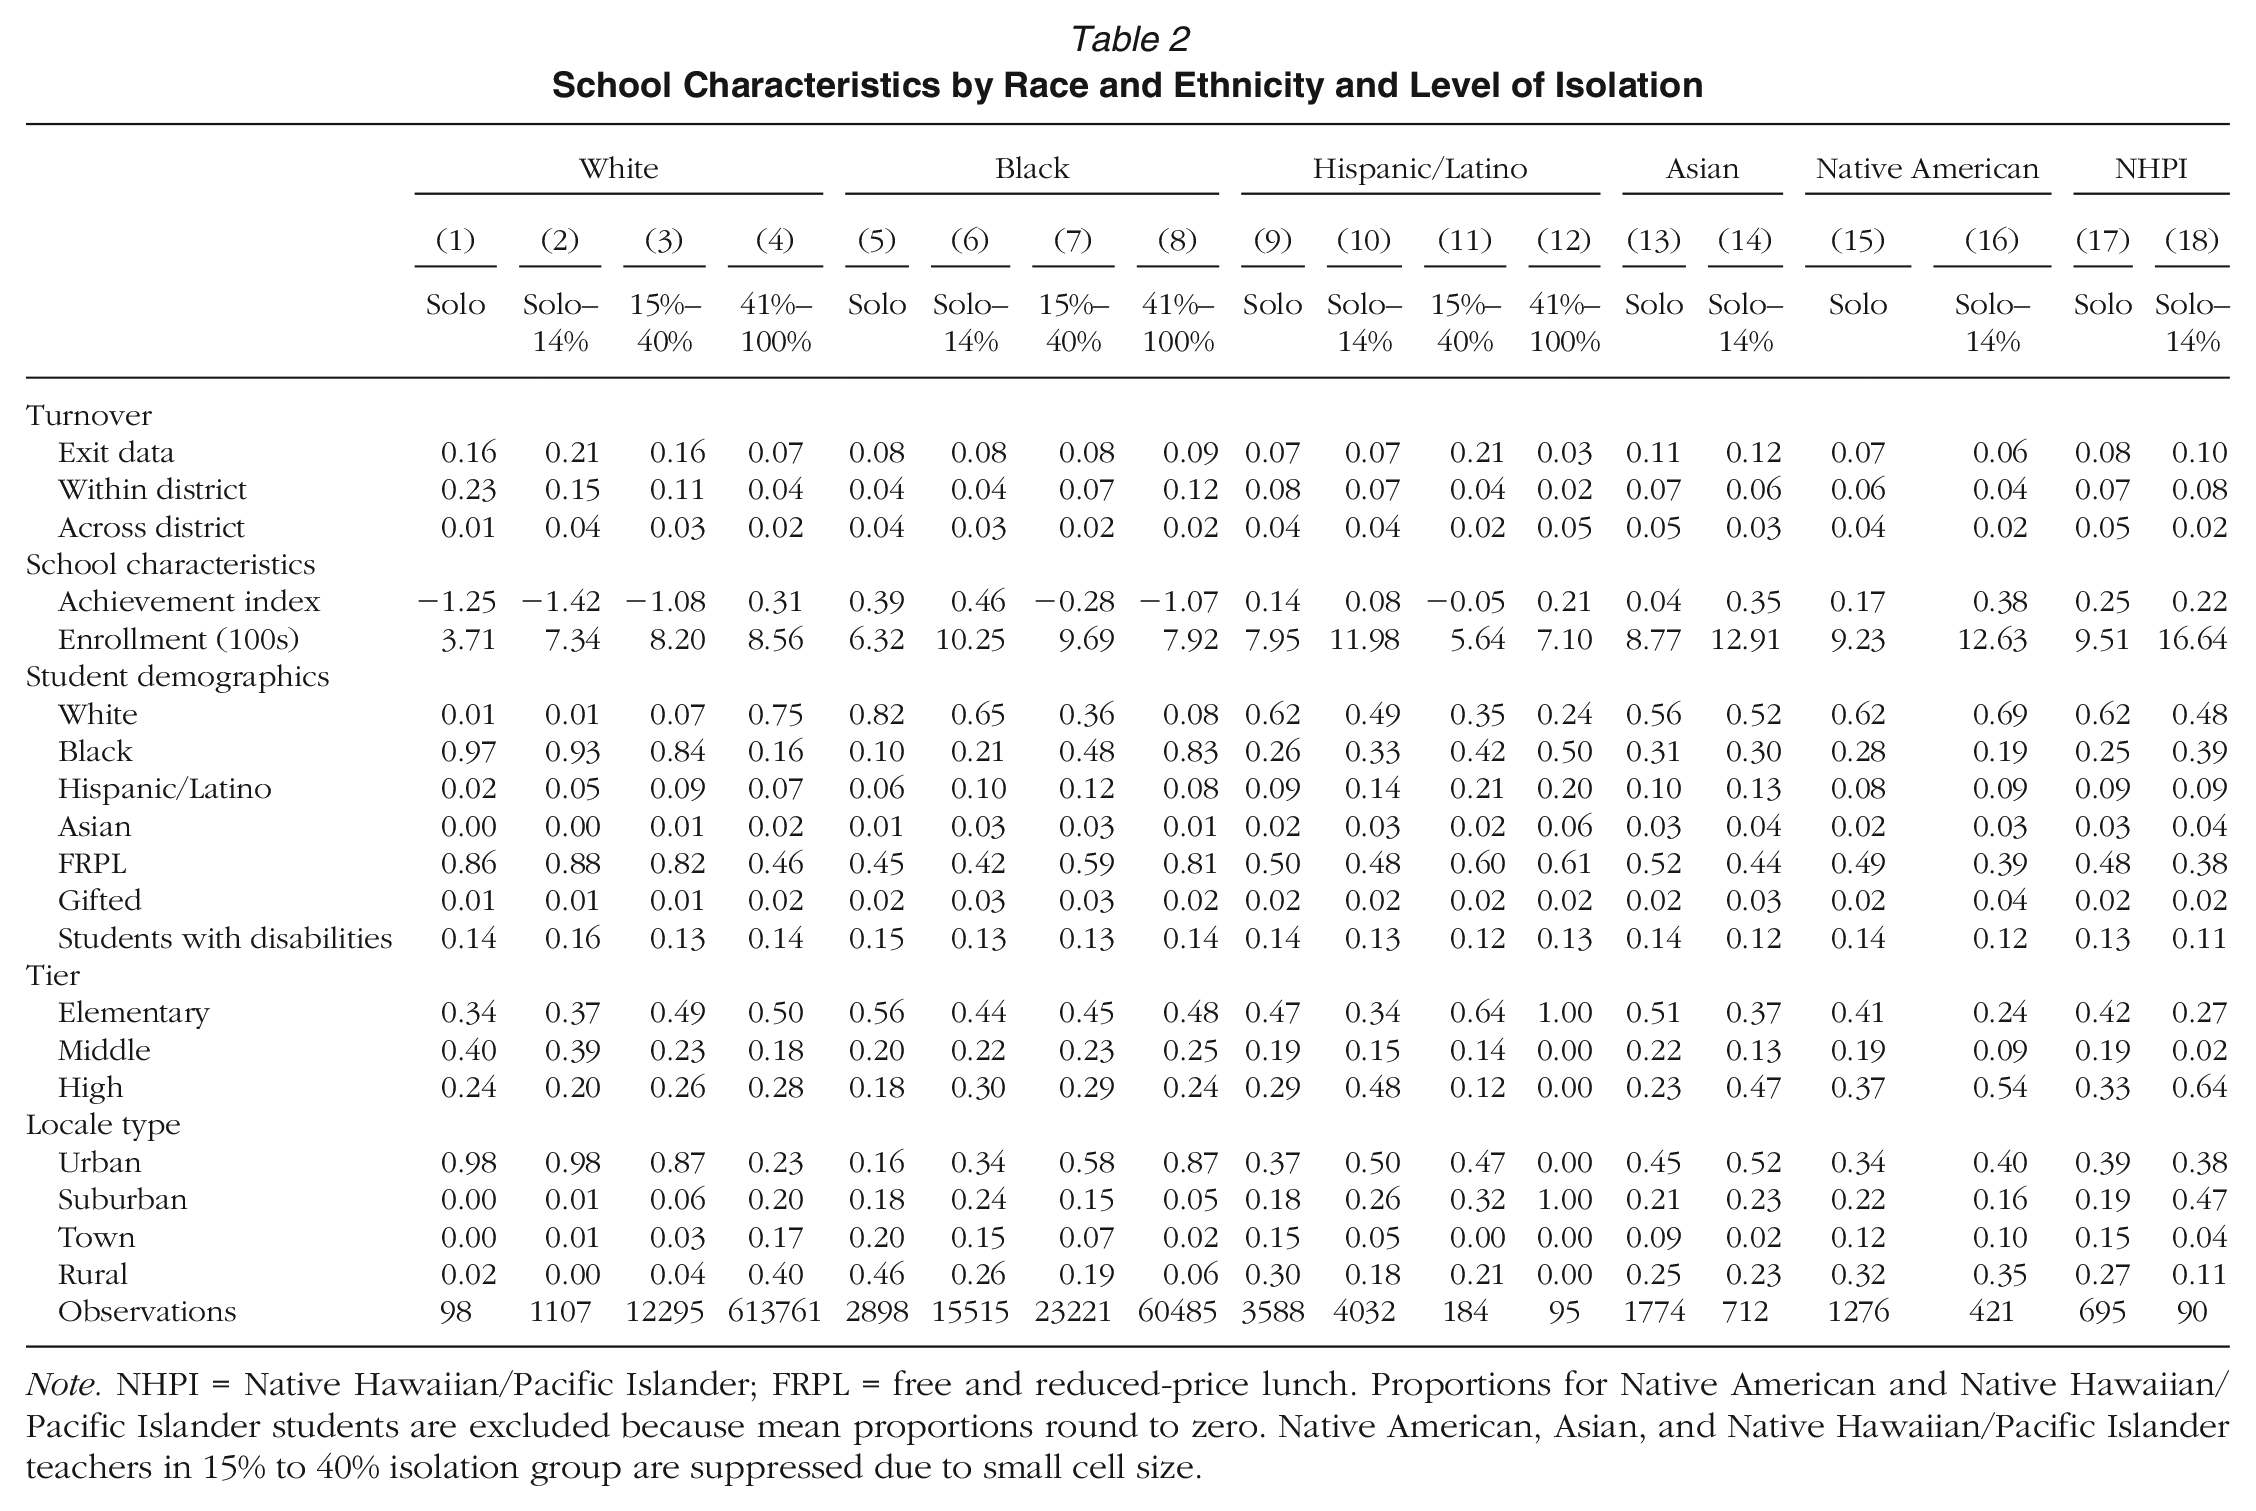
Note. NHPI = Native Hawaiian/Pacific Islander; FRPL = free and reduced-price lunch. Proportions for Native American and Native Hawaiian/Pacific Islander students are excluded because mean proportions round to zero. Native American, Asian, and Native Hawaiian/Pacific Islander teachers in 15% to 40% isolation group are suppressed due to small cell size.
The different turnover patterns for Black and White teachers, in particular, likely are due to the differences in the school contexts in which racially isolated Black and White teachers work, given patterns of segregation. Isolated Black teachers are less likely than their nonisolated Black colleagues to be found in urban school districts—whose larger number of schools make moving within district more feasible—and more likely to be in schools with markers of advantage, such as fewer students receiving subsidized lunches and higher achievement, which typically are associated with lower turnover. Racially isolated White teachers, in contrast, are almost all in urban schools serving higher concentrations of students living in poverty and with lower levels of achievement. Notably, racially isolated teachers, whether White or Black, work in more racially segregated schools than their less isolated colleagues, with isolated White teachers working in schools serving almost 100% Black students, and isolated Black teachers working in schools with very high proportions of White students.
Implications of This Landscape for Analyzing the Isolation–Turnover Relationship
Our main analyses consider teacher racial isolation and turnover. Our description of the landscape of racial isolation in Tennessee has at least two implications for these analyses.
First, it requires narrowing our analytic sample. Ideally, we would estimate Equation (1) over the range of available teacher racial categories. However, Table 1 demonstrates that there is little variation in racial isolation for teachers from smaller racial/ethnic groups, and sample sizes are often small. Thus, unsurprisingly, initial estimates including interactions over all racial/ethnic categories produced large standard errors, making them difficult to interpret. For completeness, we provide results that include school and district-by-year fixed effects in Appendix Table A4 in the online version of the journal (noting that the table shows that relatively isolated Hispanic/Latino and Native American teachers indeed are more likely to turn over, despite the comparison to a small, potentially idiosyncratic set of nonisolated teachers). For the remainder of the analyses, however, we limit samples to just Black and White teachers, who made up 98% of the Tennessee teacher workforce over the years included.
Second, it reinforces our focus on school fixed effects models. Racially isolated teachers systematically work in different school contexts. Some of these contextual differences are observable in our data (see Table 2). Other differences, however, may be unobservable. If the more racially segregated schools in which isolated teachers tend to work have different financial or community resources, for example, the covariates available to us may do a poor job of accounting for these important differences, potentially biasing estimates of the effect of isolation on turnover. For this reason, we present, as our main specification, models that include school fixed effects, which better account for (time-invariant) unobservable factors.
Substantively, the turnover of racially isolated White teachers is not the focus of this study; White teachers are almost never isolated. Practically, however, our school fixed effects models rely on White teachers as a source of variation to capture unobserved school factors. To focus us on the experiences of Black teachers, we replace RACE in Equation (1) with an indicator for whether the teacher is White but present only
Racial Isolation Predicts Higher Turnover Among Black Teachers
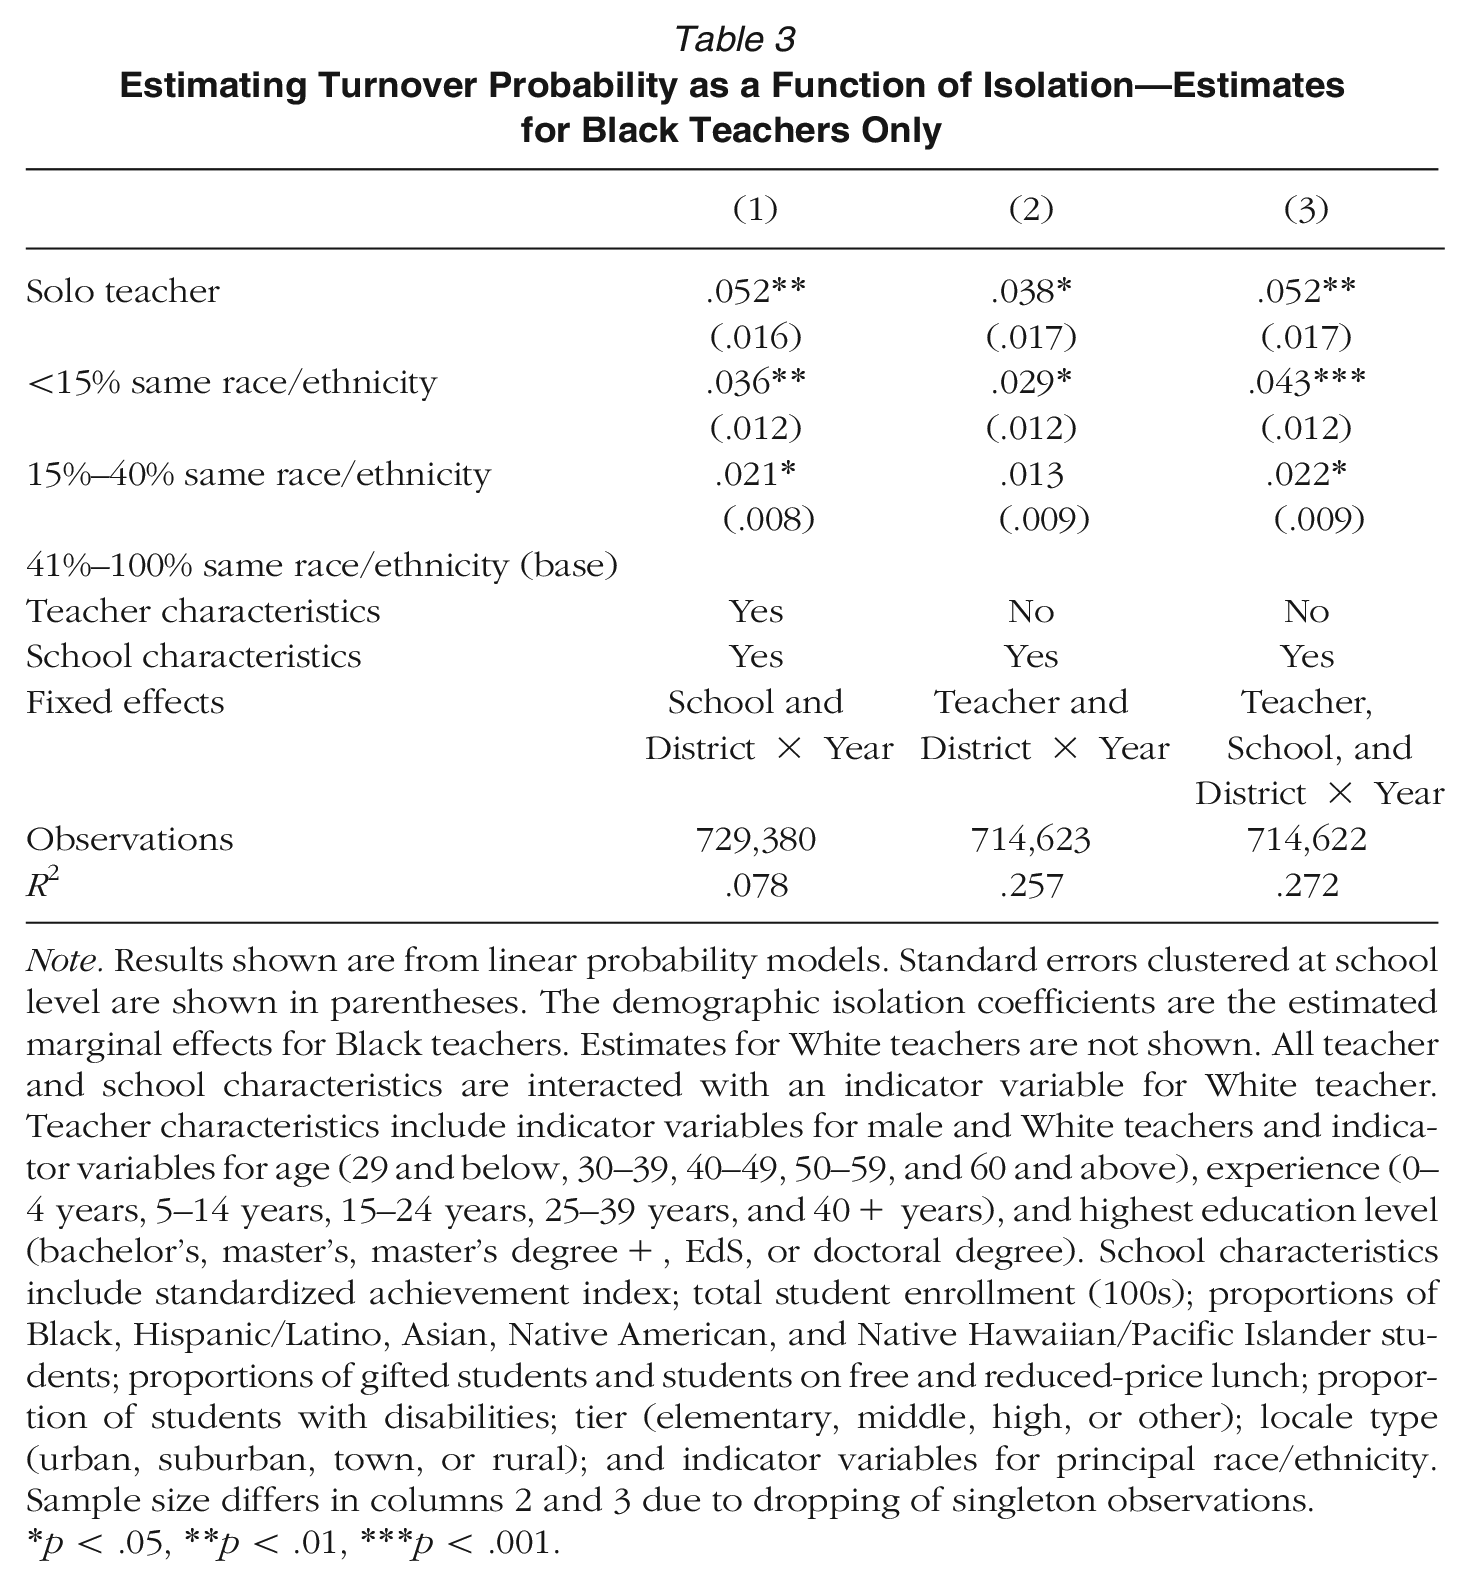
Table 3 shows how racial isolation among Black teachers predicts their likelihood of turnover. The coefficients for each level of racial isolation capture the difference in turnover probability between Black teachers in schools where 41% to 100% of teachers are also Black and Black teachers working in schools in each of the other three isolation categories.
Estimating Turnover Probability as a Function of Isolation—Estimates for Black Teachers Only
Note. Results shown are from linear probability models. Standard errors clustered at school level are shown in parentheses. The demographic isolation coefficients are the estimated marginal effects for Black teachers. Estimates for White teachers are not shown. All teacher and school characteristics are interacted with an indicator variable for White teacher. Teacher characteristics include indicator variables for male and White teachers and indicator variables for age (29 and below, 30–39, 40–49, 50–59, and 60 and above), experience (0–4 years, 5–14 years, 15–24 years, 25–39 years, and 40+ years), and highest education level (bachelor’s, master’s, master’s degree+, EdS, or doctoral degree). School characteristics include standardized achievement index; total student enrollment (100s); proportions of Black, Hispanic/Latino, Asian, Native American, and Native Hawaiian/Pacific Islander students; proportions of gifted students and students on free and reduced-price lunch; proportion of students with disabilities; tier (elementary, middle, high, or other); locale type (urban, suburban, town, or rural); and indicator variables for principal race/ethnicity. Sample size differs in columns 2 and 3 due to dropping of singleton observations.
p < .05, **p < .01, ***p < .001.
Column 1 shows our preferred specification, which includes both school and district-by-year fixed effects.
16
We find that a completely isolated Black teacher’s predicted turnover rate is 5.2 percentage points higher than a Black teacher working with 41% to 100% Black colleagues (
We check the robustness of this main result by adding teacher fixed effects in columns 2 (without school fixed effects) and 3 (with school fixed effects). The patterns are similar; Black teachers have higher turnover rates in years when they are the only Black teacher in their school than in other years when they have many Black colleagues, with the magnitudes of the coefficients suggesting that their turnover rates fall as they become less isolated. Teacher fixed effects account for unobserved teacher characteristics that do not change over time, such as, for example, a general predisposition towards turnover or towards working with colleagues with similar characteristics. 17
More Isolated Black Teachers Are More Likely to Exit or Move Across Districts
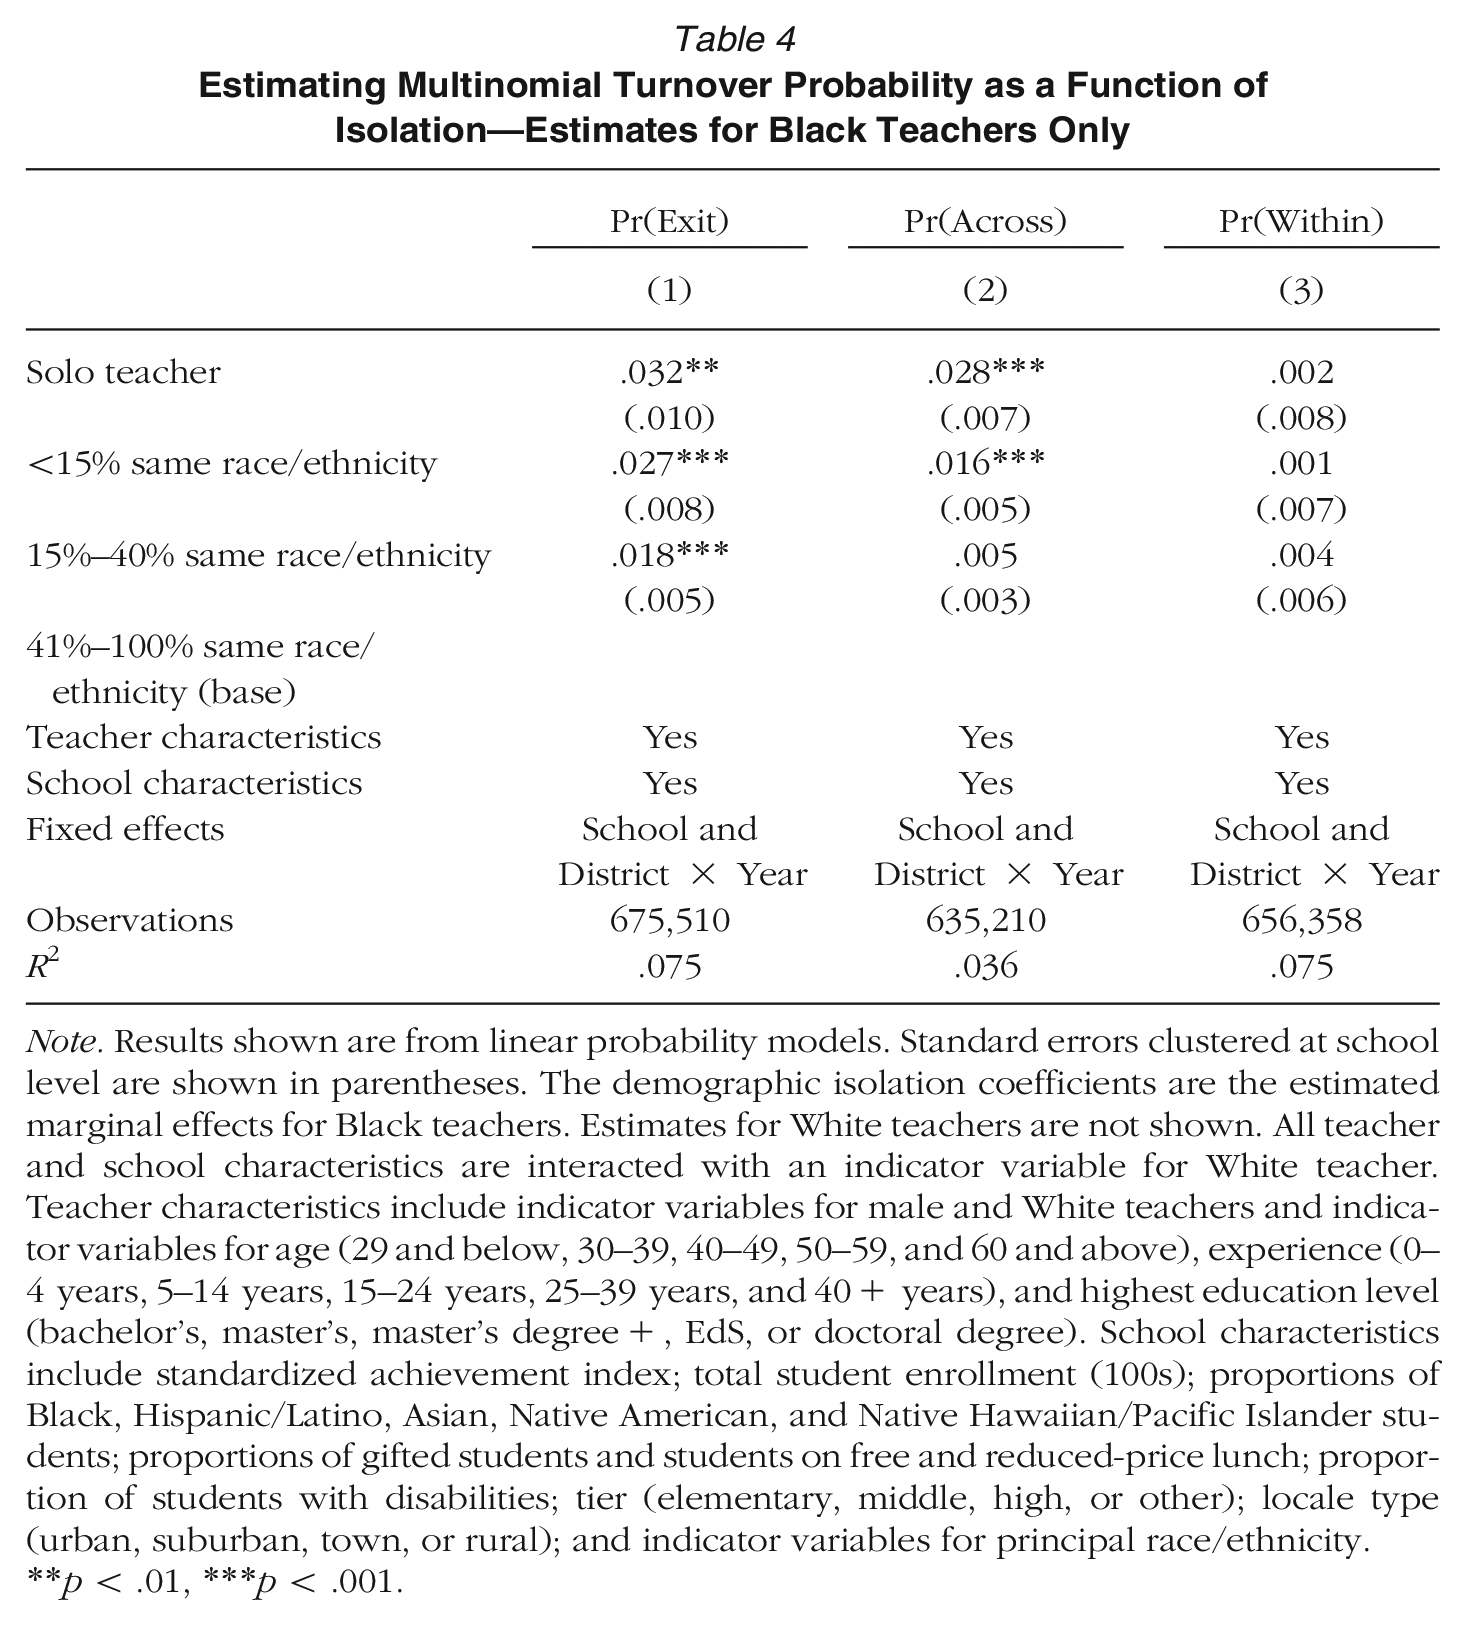
To better understand the relationship between racial isolation and turnover, we fit multinomial models predicting different types of teacher turnover: exits, across-district moves, and within-district moves. Table 4 shows estimates from our preferred specification with school and district-by-year fixed effects.
Estimating Multinomial Turnover Probability as a Function of Isolation—Estimates for Black Teachers Only
Note. Results shown are from linear probability models. Standard errors clustered at school level are shown in parentheses. The demographic isolation coefficients are the estimated marginal effects for Black teachers. Estimates for White teachers are not shown. All teacher and school characteristics are interacted with an indicator variable for White teacher. Teacher characteristics include indicator variables for male and White teachers and indicator variables for age (29 and below, 30–39, 40–49, 50–59, and 60 and above), experience (0–4 years, 5–14 years, 15–24 years, 25–39 years, and 40+ years), and highest education level (bachelor’s, master’s, master’s degree+, EdS, or doctoral degree). School characteristics include standardized achievement index; total student enrollment (100s); proportions of Black, Hispanic/Latino, Asian, Native American, and Native Hawaiian/Pacific Islander students; proportions of gifted students and students on free and reduced-price lunch; proportion of students with disabilities; tier (elementary, middle, high, or other); locale type (urban, suburban, town, or rural); and indicator variables for principal race/ethnicity.
p < .01, ***p < .001.
Overall, the results suggest that the relationship between racial isolation and turnover for Black teachers is largely driven by exits and across-district moves, not within-district moves. Column 1 shows that the probability Black teachers leave the state’s K–12 education system increases when they are racially isolated. For example, compared to when 41% to 100% of their colleagues are same-race, a Black teacher with zero Black colleagues is 3.2 percentage points more likely to exit. Point estimates fall across the other isolation categories. We find similar patterns for across-districts moves in column 2, where completely isolated Black teachers are 2.8 percentage points more likely to switch districts, relative to nonisolated Black teachers, with an even clearer reduction in the coefficients as isolation decreases. Degree of isolation appears uncorrelated with within-district moves (column 3).
If Black teachers’ experiences in schools in which they are more racially isolated are driving turnover, we might expect teachers who move to seek less isolated environments. Appendix Table A8, Panel A, in the online version of the journal presents results of a descriptive analysis showing, for Black teachers who moved, the difference in the proportion of Black teachers in school B (receiving school) at time t+1 minus the proportion of Black teachers in school A (sending school) at time t. Panel B shows movement across isolation categories for these same teachers. Panel C shows changes in school characteristics. On the left are teachers who moved across district lines; the right shows teachers who turned over within-district. The latter group may have fewer options for finding less isolated schools, given relative similarity of school environments within school districts.
Columns 1 and 6 show that, overall, Black teachers who turn over, whether across or within districts, move to schools with similar proportions of Black teachers—just a 2-percentage-point difference. However, this mean masks heterogeneity across categories; solo Black teachers, Black teachers in schools with fewer than 15% Black teachers, and Black teachers in schools with 15% to 40% Black teachers move to schools with substantially larger fractions of Black colleagues, on average (see columns 2–4 and 7–9). Gains in the share of Black colleagues are larger for teachers moving across districts than those moving within districts. Similarly, Panel B shows that Black teachers in these ranges move to environments that are less racially isolated more often than they move in the opposite direction. For teachers coming from schools with fewer than 15% Black teachers, Panel C shows that these moves have the consequence of movement to schools with fewer markers of advantage; for example, the receiving schools have larger fractions of Black students, more students from economically disadvantaged families, and lower average achievement. 18
Racially Isolated Black Teachers Report Less Collaboration and Receive Lower Observation Ratings
Having established that racial isolation appears to be an important contributing factor to turnover among Black teachers, we next turn to workplace outcomes, which our conceptual framework suggests may contribute to isolated teachers’ turnover propensities. We begin with the two survey-based measures from the TES: perceptions of the organizational climate and leadership and frequency of collaboration. These measurements are standardized scales developed from the full sample of TES survey respondents, though only Black and White teachers responding to these items are included in the analysis.
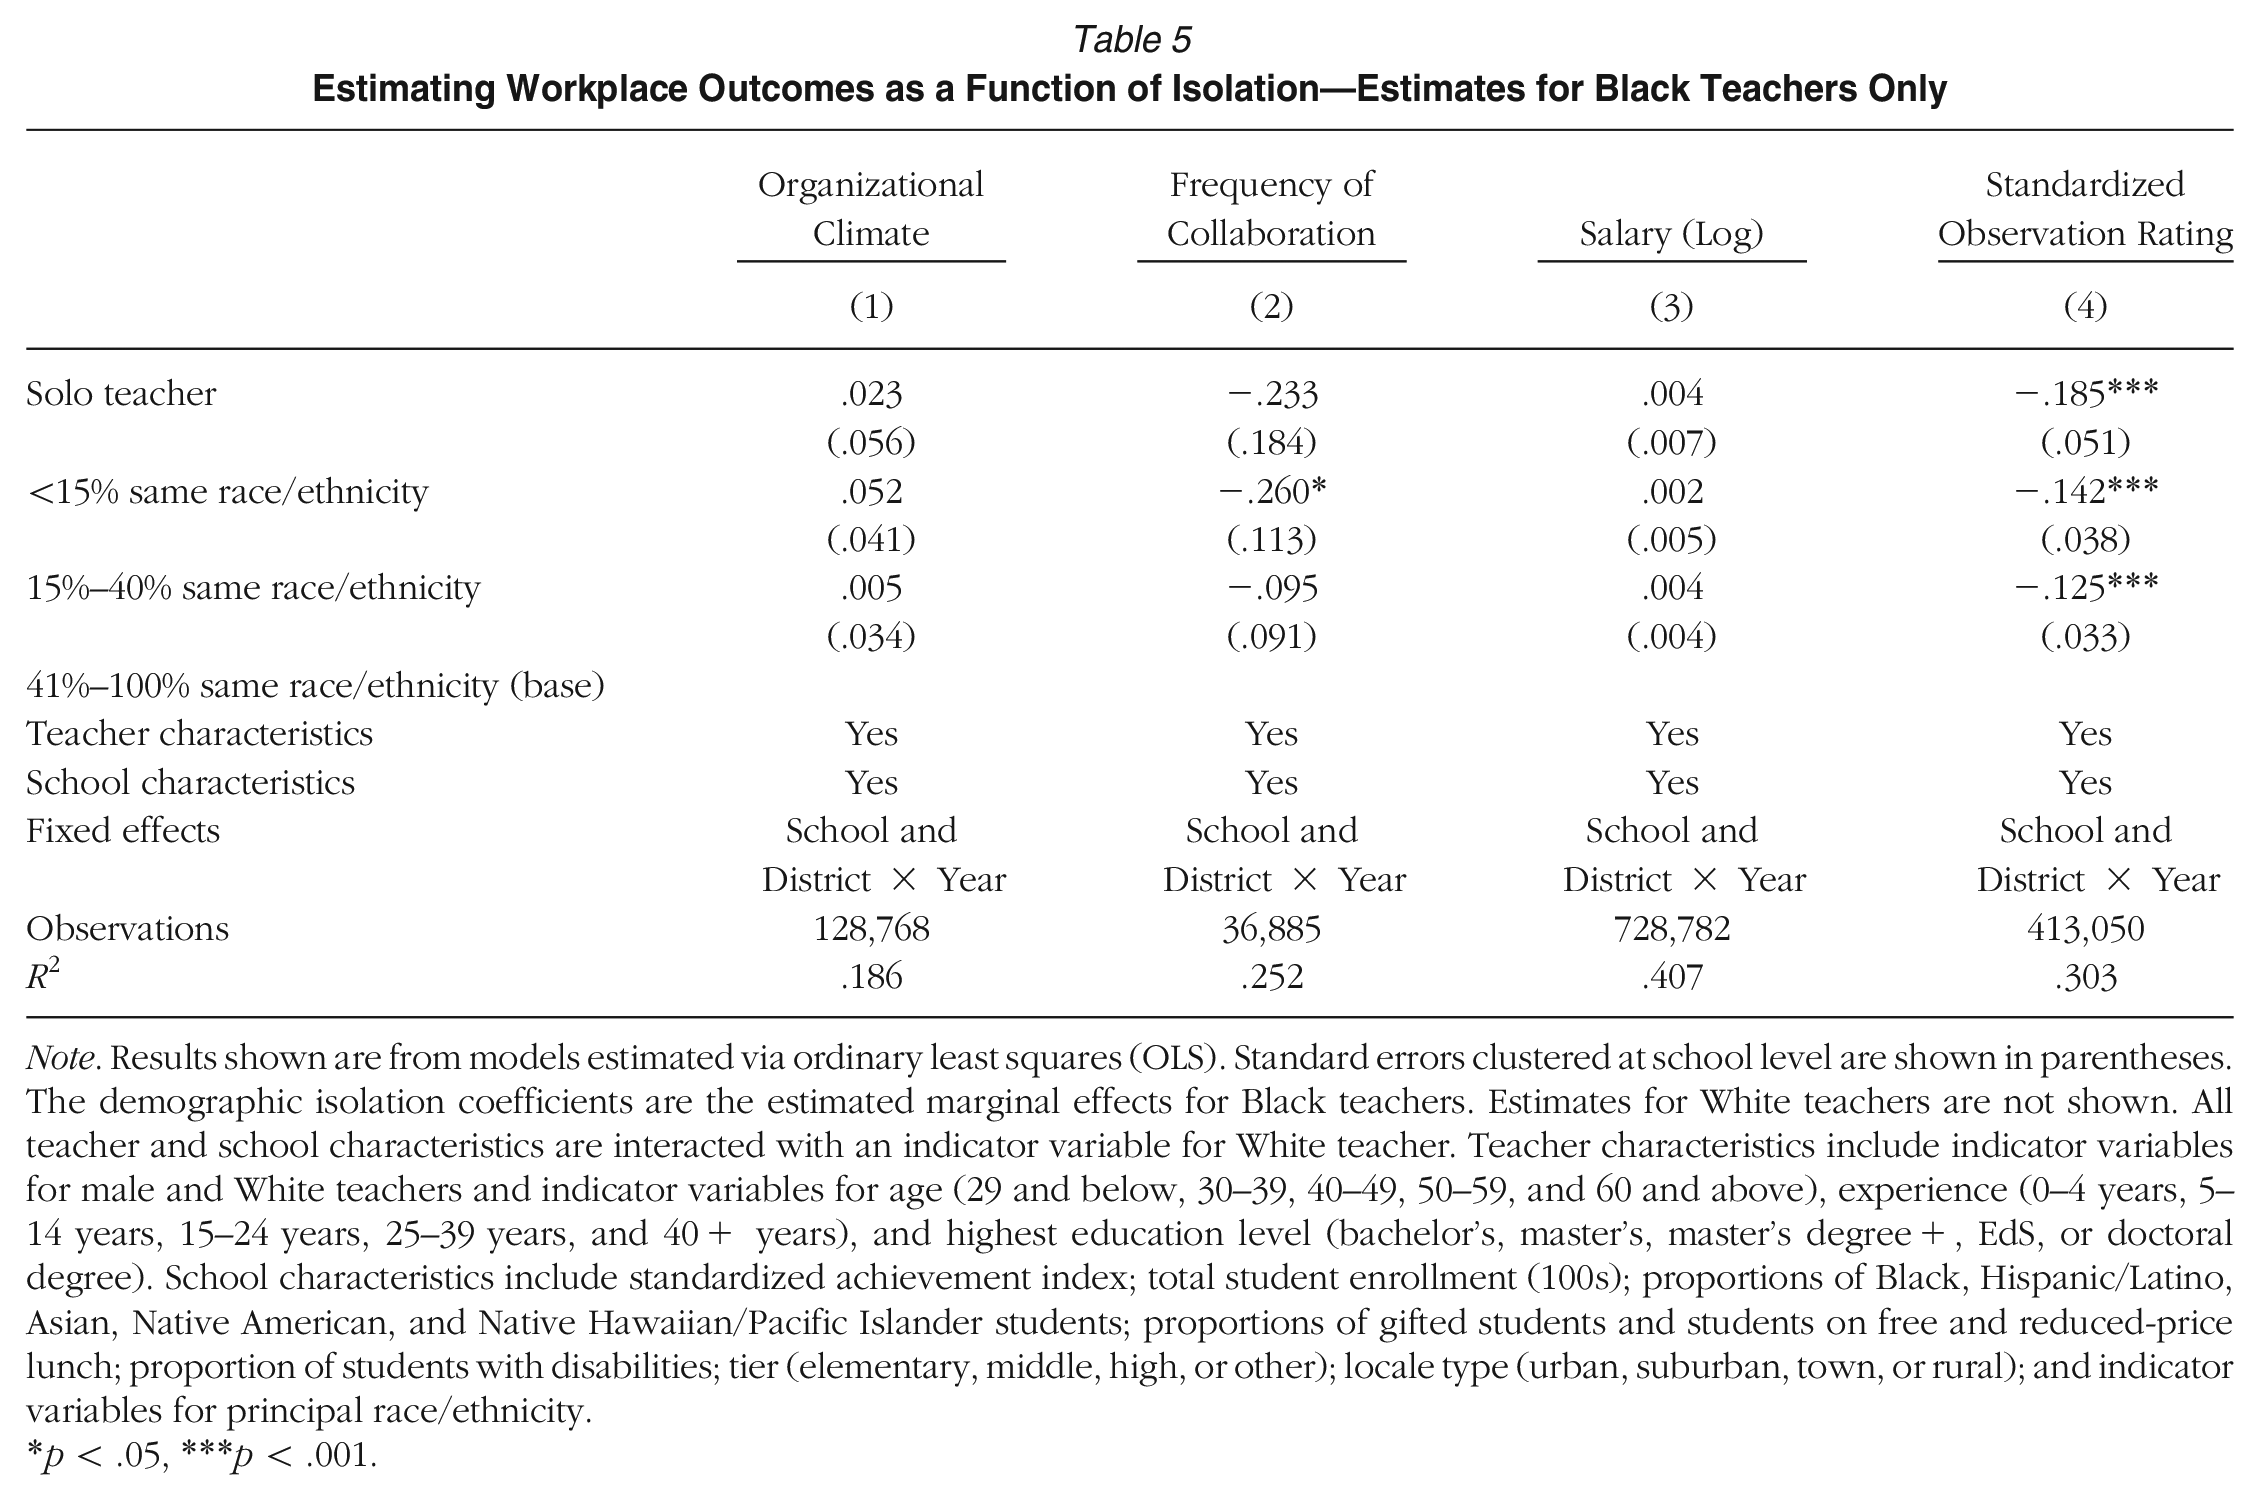
Columns 1 and 2 of Table 5 show results from these analyses; we again only show results from models that include school and district-by-year fixed effects. The coefficients represent standard deviation differences on each survey scale between Black teachers in schools where 41% to 100% of teachers are Black and teachers in each of the other three categories.
Estimating Workplace Outcomes as a Function of Isolation—Estimates for Black Teachers Only
Note. Results shown are from models estimated via ordinary least squares (OLS). Standard errors clustered at school level are shown in parentheses. The demographic isolation coefficients are the estimated marginal effects for Black teachers. Estimates for White teachers are not shown. All teacher and school characteristics are interacted with an indicator variable for White teacher. Teacher characteristics include indicator variables for male and White teachers and indicator variables for age (29 and below, 30–39, 40–49, 50–59, and 60 and above), experience (0–4 years, 5–14 years, 15–24 years, 25–39 years, and 40+ years), and highest education level (bachelor’s, master’s, master’s degree+, EdS, or doctoral degree). School characteristics include standardized achievement index; total student enrollment (100s); proportions of Black, Hispanic/Latino, Asian, Native American, and Native Hawaiian/Pacific Islander students; proportions of gifted students and students on free and reduced-price lunch; proportion of students with disabilities; tier (elementary, middle, high, or other); locale type (urban, suburban, town, or rural); and indicator variables for principal race/ethnicity.
p < .05, ***p < .001.
Column 1 shows that Black teachers who are more racially isolated do not assess their schools’ climates as statistically different from teachers who are less isolated. The coefficients for greater isolation are positive but do not approach conventional levels for rejecting a difference with the 41% to 100% group.
Column 2 suggests that Black teachers who are more racially isolated collaborate less frequently their colleagues. In particular, non-solo Black teachers working in schools when fewer than 15% of teachers were Black report a collaboration frequency that is 0.26 standard deviations lower than when 41% to 100% of teachers were Black. The coefficient for solo Black teachers is also negative (β = −0.23) but imprecisely estimated, leaving us unable to rule out statistically the possibility that collaboration frequency for solo Black teachers is similar to the reference group.
The remainder of Table 5 turns to two other workplace outcomes: compensation and observation ratings. Column 3 shows the results of a model predicting the natural log of total salary as a function of racial isolation. It finds no evidence that Black teachers’ total salary varies with their degree of isolation, at least not within the same school over time.
Column 4 turns to standardized observation ratings as the outcome variable. The findings mirror those in prior research—namely, that racial isolation is associated with receiving lower observation scores (Grissom & Bartanen, 2022). Black solo teachers face the largest predicted penalty; their predicted observation scores are 0.19 standard deviations lower than Black teachers who are not racially isolated (i.e., those in schools with 41%–100% Black colleagues). As isolation decreases, the pattern of coefficients suggests that scores go up.
Discussion and Conclusions
Efforts to desegregate schools in the U.S. South post-Brown have been incomplete not only with respect to student race but for their teachers as well (Frankenberg, 2009; Parker, 2008). The mass displacement of Black teachers as Black school systems were dismantled left many Southern schools with overwhelmingly White faculties (Milner & Howard, 2004; Thompson, 2022). As these schools respond to calls to diversify their teachers, the few teachers of color they hire initially—or perhaps at all—become, by construction, a numerical racial minority within their schools. Drawing on research on workplace dynamics, we hypothesize that such racially isolated teachers may face organizational headwinds ranging from discrimination to challenges with workplace integration (see Figure 1) that lead to less positive work experiences and outcomes, and higher turnover.
Using administrative and survey datasets from Tennessee, we provide the first large-scale, quantitative evidence in favor of these hypotheses. Our results align with findings from previous qualitative studies (e.g., Bristol, 2018; Nelson, 2019). Although we cannot test the full theoretical chain linking isolation to turnover, we do find that racial isolation substantially increases the probability that Black teachers leave their schools, a pattern driven by across-district turnover and exits. The annual turnover rate for the typical Black teacher in Tennessee is 21% but is approximately 4 to 5 percentage points higher among the subset of Black teachers working in the most racially isolated contexts (i.e., schools in which fewer than 15% of their colleagues are Black), accounting for other characteristics of those schools. 19 We also find that racially isolated teachers report less frequent collaboration with their colleagues—consistent with less workplace integration and lower access to social capital within the school—and receive lower observation ratings. We cannot be sure whether this latter finding reflects actual lower job performance resulting from dynamics such as less access to organizational resources (e.g., support) or perceived lower performance on behalf of raters arising from social comparisons (Grissom & Bartanen, 2022; Nelson, 2019)—a question that would be helpful to address in future studies. Regardless, it is a concerning result given the stakes for personnel decisions often attached to teacher evaluation.
Our results present a challenge to diversifying the teacher workforce in schools with overwhelmingly White faculties. School leaders seeking to enhance the racial diversity of an all-White (or nearly all-White) teaching staff by hiring a very small number of Black teachers—perhaps because these teachers are the only teachers of color available to them in their applicant pool—may see their efforts stymied by the organizational dynamics such hiring could manifest. Racially isolated teachers have higher likelihoods of moving on than they would in less isolated settings. Worse, they have higher propensities to exit the K–12 workforce altogether, perhaps suggesting that the adverse work experiences they have as racially isolated teachers leads them to give up on teaching. These exits constitute losses of teachers that research suggests can be instrumental in improving the education experiences and outcomes of Black students through interpersonal relationships, high expectations, role modeling, culturally responsive teaching, and empowerment of new and liberating scripts of knowledge (e.g., Blazar, 2021; Dee, 2005; Givens, 2021; Holt & Gershenson, 2019; Milner, 2006; Shirrell et al., 2023).
Although not the focus of this analysis given small samples, the situation for teachers of color other than Black teachers may be even bleaker. As Table 1 shows, nearly all Hispanic/Latino, Asian, Native American, and NHPI teachers in Tennessee are racially isolated. To the extent that this isolation similarly drives them to exit, the dynamics that are the focus of this study may undermine macro-level efforts to grow the workforce of teachers of color in Tennessee and similarly situated states.
Yet the response to these results for local leaders cannot be to cease efforts to hire Black teachers and other teachers of color into predominantly White schools. Instead, we suggest that leaders implement strategies to address the underlying dynamics to which our results point. For example, cluster-hiring of teachers of color within a school may be an approach to reduce racial isolation, especially in concert with sustained efforts to hire teachers of color over successive years. Once teachers are hired, school leaders can take steps to ensure that racially isolated teachers have better and fairer workplace experiences by, for example, encouraging and facilitating inclusive collaboration and leadership structures among teachers, monitoring evaluation processes for equitable treatment (Grissom & Bartanen, 2022), and taking affirmative steps to connect teachers of color to the kinds of organizational resources (e.g., networks, professional supports) that isolation can inhibit (Nelson, 2019; Bristol & Shirrell, 2019). Leaders can take care not to create stereotypical expectations for teachers of color, such as overrelying on Black teachers for disciplinary work (Bristol & Mentor, 2018) or asking Hispanic/Latino teachers to also serve as translators (Bettini et al., 2022; Flores, 2011). They can try to counter the effects of race-based microaggressions and other forms of racial stress (Grooms et al., 2021; Frank et al., 2021) through targeted supports to isolated teachers and work to build a more tolerant, inclusive culture in the school.
Districts and state policymakers can build supports for racially isolated teachers as well. School cluster-hiring strategies depend on a racially diverse teacher applicant pool available to schools with less diverse teaching staffs, which may require districts to better target recruitment (e.g., to historically Black colleges), to invest in residency or grow your own programs, or to build other strategies for creating more robust pathways for teachers of color that states can help facilitate (Carver-Thomas, 2018). For current teachers, policymakers can cultivate affinity networks that connect teachers of color across schools and districts for professional connection, reflection, experience sharing, and emotional support (Pour-Khorshid, 2018). They can work to reduce potential biases in mandated observation processes, including by ensuring that observation rubrics and observers are attuned to effective teaching practices employed by Black teachers and other teachers of color (e.g., Achinstein et al., 2010; Brown, 2012; McKinney de Royston et al., 2021).
Several limitations characterize the study. First, small samples of teachers not identified as either White or Black—and limited variation in their isolation categories given that nearly all of these teachers are isolated—make Tennessee a poor context for studying workplace outcomes for Hispanic/Latino, Asian, Native American, and NHPI teachers using this kind of quantitative approach. We anticipate that the conceptual dynamics we summarize in Figure 1 may generalize to other racial/ethnic groups and contexts, making racial isolation and associated outcomes among other groups fruitful avenues for future study. Qualitative research suggests that isolated teachers from other groups of color face challenges distinct from those of Black teachers; demographically isolated Latina teachers, for example, may face expectations that they serve as language translators or see unique forms of social exclusion (Flores, 2011) that future quantitative research in different contexts could explore and elaborate.
Second, even for Black teachers, our workplace outcome results may not speak to the experiences of teachers in all contexts across the state. The TES obtains lower response rates among Tennessee’s largest districts, which tend to employ more Black teachers, suggesting some caution in interpreting results that rely on survey data. Even with better coverage, the survey data do not capture some kinds of adverse work experiences described by racially isolated teachers in qualitative research, such as experiencing microaggressions or racialized stress (Endo, 2015; Pizarro & Kohli, 2020), or others that link to our conceptual framework (e.g., feelings of tokenism). Studies using tools to better capture the racial climate of a school (see Frank et al., 2021; Grooms et al., 2021) or that explore other dimensions of racially isolated teachers’ experiences that research theorizes would enhance our understanding and perhaps provide more guidance to policymakers and practitioners seeking to address the workplace conditions of racially isolated teachers. Alongside better data capturing teachers’ experiences, we suggest more explicit modeling of these workplace outcomes as mediators of turnover, which is beyond the scope of the current manuscript.
This analysis is also constrained by how the data systems it uses capture racial/ethnic identity. A simplistic conceptualization in which teacher are only assigned one racial/ethnic category may not accurately capture how teachers themselves would describe their own identity nor allow for more nuanced analysis of racial and ethnic identity. Such constraints are common in administrative datasets (Viano & Baker, 2020). Future analyses using data systems with more robust reporting on racial and ethnic identities would be better positioned to examine how isolation operates differently for teachers of specific ethnic identities (e.g., Chinese American) or how isolation operates at the intersection of race and ethnicity (e.g., teachers who identify as Hispanic/Latino and Black).
More broadly, we face limits on external validity. The sociohistorical context of every state or region is different. We anticipate that our results may be more likely to generalize to other Southern states that share much of Tennessee’s history of spatial segregation and displacement of Black teachers, but we cannot be sure; nor can we know whether our results represent what we might observe in contexts outside the South in which patterns of segregation or racial isolation among Black teachers may have different drivers, or in which other racial/ethnic groups may have a larger numerical presence among teachers. We encourage future research to explore these dynamics in other settings.
Future analysis also should consider the experiences of teachers at the intersection of race and gender identity. For example, Bristol and Mentor (2018) and Brown (2012) both find that Black male teachers specifically are expected to police the behavior of Black boys and serve as positive role models, while also contending with historically derived social constructions that cast Black men as dangerous and undervalue their general pedagogical skills. Especially given that teachers are overwhelmingly White women, documenting isolation at the intersection of race and gender and how it is associated with workplace experiences and job outcomes would be worthwhile next steps for this research.
Finally, attention should be given to the larger social context in which teachers of color work. School-based interventions are only one piece of the puzzle in improving the workplace experiences of teachers of color and improving retention of teachers of color in the teacher workforce. The relational demography literature has pointed to numerous ways that larger community contexts inform the workplace context (e.g., King et al., 2017; Nelson, 2019). It follows that improving social conditions for people of color generally is a key step to improving experiences for teachers of color in their schools.
Supplemental Material
sj-pdf-1-aer-10.3102_00028312241278597 – Supplemental material for (Dis)connection at Work: Racial Isolation, Teachers’ Job Experiences, and Teacher Turnover
Supplemental material, sj-pdf-1-aer-10.3102_00028312241278597 for (Dis)connection at Work: Racial Isolation, Teachers’ Job Experiences, and Teacher Turnover by Shirley H. Xu, Francisco A. Santelli, Jason A. Grissom, Brendan Bartanen and Susan K. Patrick in American Educational Research Journal
Footnotes
Acknowledgements
The authors thank the Tennessee Department of Education (TDOE) and the Tennessee Education Research Alliance for access to the data used in this study. We benefited from helpful feedback from audience members at the 2021 annual meeting of the Association for Education Finance and Policy. The research reported in the article was made possible by a grant from the Spencer Foundation (#202100068). The views expressed are those of the authors and do not necessarily reflect the views of the Spencer Foundation.
Notes
S
F
J
B
S
References
Supplementary Material
Please find the following supplemental material available below.
For Open Access articles published under a Creative Commons License, all supplemental material carries the same license as the article it is associated with.
For non-Open Access articles published, all supplemental material carries a non-exclusive license, and permission requests for re-use of supplemental material or any part of supplemental material shall be sent directly to the copyright owner as specified in the copyright notice associated with the article.