
Abstract
The Community Eligibility Provision (CEP) allows high-poverty schools to offer free meals to all students regardless of household income. Conceptualizing universal meal provision as a strategy to alleviate stigma associated with school meals, we hypothesize that CEP implementation reduces the incidence of suspensions, particularly for students from low-income backgrounds and minoritized students. We link educational records for students enrolled in Oregon public schools between 2010 and 2017 with administrative data describing their families’ household income and social safety net program participation. Difference-in-differences analyses indicate that CEP has protective effects on the probability of suspension for students in participating schools, particularly for students from low-income families, students who received free or reduced-price meals prior to CEP implementation, and Hispanic students.
“I learned I was poor on the new lunch lady's first day at work.”—Psychologist Kenneth Payne, The Broken Ladder: How Inequality Affects the Way We Think, Live, and Die (2017, p. 11)
The National School Lunch Program (NSLP) provides free or subsidized meals to some 30 million students across the United States on the average school day, at a cost of approximately $14 billion annually (U.S. Department of Agriculture [USDA], 2022). One of the largest child nutrition and development programs in the contemporary United States, NSLP feeds young people across the country who are at risk of food insecurity (A. Gordon et al., 2007).
However, NSLP is a means-tested program. To implement NSLP, schools collect data on students’ family income and use these data to determine which students are eligible to receive free or subsidized meals. In doing so, schools enact social categories that are closely linked to student socioeconomic background. Daily rituals associated with the implementation of the NSLP such as lunch lines and meal tickets likely reinforce these income-based categories (Best, 2017; Poppendieck, 2011).
In this article, we investigate the consequences of the Community Eligibility Provision (CEP) of NSLP. Authorized as part of the 2010 Healthy, Hunger-Free Kids Act and rolled out nationally beginning in the 2014–2015 school year, CEP allows high-poverty schools to offer free meals to all students regardless of their family's household income, suspending processes that distinguish between students who receive free or subsidized meals and those who must pay full price. As of the 2022–2023 academic year, nearly 82% of eligible schools participated in CEP, and nearly 20 million children attended a school that had adopted the program (Food Research and Action Center [FRAC], 2023).
Our work conceptualizes CEP as an intervention that alleviates a source of socioeconomic stigma in participating schools. Prior research suggests that the implementation of CEP and other universal school meal programs boost student achievement (Gordanier et al., 2020; Kitchen et al., 2013; Ruffini, 2021, Schwartz & Rothbart, 2020) and attendance (Bartfeld et al., 2019). Drawing upon prior scholarship that positions stigma at the heart of a vicious cycle that drives exclusionary discipline (Okonofua et al., 2016), we focus attention on the effects of CEP on student suspensions. Consistent with the limited available evidence on the program's disciplinary consequences (N. Gordon & Ruffini, 2020; Kho, 2018), we hypothesize that CEP reduces the incidence of suspensions in treated schools. We further hypothesize that the program's benefits will be particularly pronounced for students from racially or ethnically minoritized backgrounds and students from socioeconomically disadvantaged families, since these students were most likely to encounter the stigma associated with means-tested lunch provision.
Our analyses take advantage of a unique dataset consisting of administrative data describing all students enrolled in Oregon public schools between 2010 and 2017 merged with household-level data from the U.S. Census Bureau describing Internal Revenue Service (IRS)–reported earnings and Supplemental Nutrition Assistance Program (SNAP) participation. Since schools that implement CEP report free or reduced-price lunch (FRL) enrollment data unevenly (Spiegel et al., 2022), these merged data provide unprecedented opportunities to understand the extent to which the effects of CEP implementation vary with student socioeconomic background.
We use a difference-in-differences (DiD) study design, which takes advantage of CEP's staggered implementation across eligible schools to estimate changes in the probability of suspension associated with CEP implementation for all students in participating schools. We further examine the way these changes vary with student household income and race/ethnicity. Assuming suspension trends for schools that implement CEP would move in parallel to trends for schools that do not, if not for the implementation of CEP, this strategy generates unbiased treatment effect estimates. Although CEP rolled out in a period of rapid decline in the use of suspensions in Oregon schools, our analyses indicate that this identifying assumption holds.
CEP implementation corresponds with a further decline in suspensions for treated schools following the dramatic decline in suspension rates for Oregon's public schools generally in the years prior to CEP's launch (Hwang et al., 2022). We estimate a statistically significant treatment effect equivalent to an approximately 10% decline in suspension probability generally, and nearly a 22% decline for students in Grades 9 through 12. We find that CEP has a particularly pronounced protective effect for low-income students, as well as Hispanic students (the state's largest minoritized student group). Supplementary analyses estimated on a balanced panel of high school students indicate that the effect of CEP implementation was substantially larger for students who received free or reduced-price meals in the year before their school implemented CEP than for their peers who did not receive free or reduced-price meals prior to program implementation. While we are unable to directly measure lunch stigma and its consequences, these subgroup findings are consistent with the idea that CEP reduces suspensions by ameliorating the stigma associated with school meals in means-tested environments.
Community Eligibility Provision and Universal School Lunch
Meal Programs in U.S. Schools
Founded in 1946 and expanded considerably in the late 1960s and early 1970s, the NSLP targets free and low-price meals to students at risk of food insecurity (Levine, 2008). Under program regulations, schools must provide NSLP applications to all students at the beginning of the school year and make applications available upon request at any time. These applications instruct potential applicants to report their household's total income from all sources in the most recent month. Students qualify for free lunches if their families report household incomes less than 130% of poverty and reduced-price lunches if they report income between 130% and 185% of poverty. Students who do not apply for the program or whose families report income greater than 185% of poverty must pay for school lunches. Students who demonstrate income-eligibility remain enrolled for the entirety of a school year. Prior research indicates that enrolling in FRL programs increases students’ consumption of calcium, meat, and vegetables (A. Gordon et al., 2007) and a wide array of essential vitamins and minerals (Gleason & Suitor, 2003), though school meals are associated with excessive sodium consumption (Clark & Fox, 2009).
Several policy initiatives implemented since the 1970s have attempted to streamline the process of enrolling in FRL. Students whose families participate in SNAP, Temporary Assistance for Needy Families (TANF), and other means-tested federal programs are automatically enrolled to receive free lunches without submitting an application (USDA, 2008). Other policy initiatives allow participating schools to automatically reenroll students who had previously demonstrated income eligibility without completing an annual application.
Authorized as part of the 2010 Healthy, Hunger-Free Kids Act of 2010, CEP dramatically expanded and accelerated the policy movement to streamline access to free school meals. Schools, groups of schools within a district, or entire districts in which at least 40% of students are directly certified or whom school districts identify as homeless, migrant, or foster children can opt into CEP. Once they do so, participating schools offer free lunch and breakfast to all students, regardless of their demonstrated need, and receive reimbursement based on the percentage of their students in the aforementioned categories. 1 Since this formula reimburses eligible schools and districts with high concentrations of poor students at a higher rate than eligible schools and districts with lower concentrations of poor students, some participating schools must access other revenue sources to cover universal breakfast and lunch expenses. As a result, CEP participation decisions vary both across schools and districts and within schools and districts over time.
Existing Evidence on the Effects of Universal School Meals
Recent evaluations of CEP implementation in U.S. schools as well as studies of universal meal provision in other policy contexts indicate that universal meal provision boosts student participation in school meals (Gordanier et al., 2020; Kitchen et al., 2013; Pokorney et al., 2019; Rothbart et al., 2020; Ruffini, 2021; Schwartz & Rothbart, 2020; Turner et al., 2019) and student body mass index (Davis et al., 2023). While it is difficult to directly compare the magnitude of changes in meal participation across settings, the results typically suggest that students in schools with universal lunch provision are 5 to 10 percentage points more likely to participate in school lunch than they were in means-tested lunch provision. This literature provides some evidence to suggest that increases in meal participation are particularly pronounced for the relatively economically advantaged students who would have previously had to pay for meals. However, these studies find positive effects in meal receipt for lower-income free or reduced-price eligible students as well.
This growing research literature further indicates that universal meal provision positively affects students’ academic and behavioral outcomes. Several studies indicate that universal meal provision modestly but significantly boosts student math achievement, with average effect size estimates ranging from 0.04 to 0.06 standard deviations (Bartfeld et al., 2019; Gordanier et al., 2020; Kitchen et al., 2013; Ruffini, 2021). While there is some evidence to suggest that universal meals have similar positive effects on reading achievement (Schwartz & Rothbart, 2020), other studies show no effects on this achievement outcome (Gordanier et al., 2020; Ruffini, 2021). Further, the existing literature indicates that universal meal provision improves elementary school student attendance (Bartfeld et al., 2019; Gordanier et al., 2020), though it is unclear whether these positive effects generalize to secondary school settings.
Relatively little evidence is currently available regarding the effects of universal meals on student disciplinary outcomes. Using data from New York City, Gutierrez (2021) demonstrates that school-level universal free meals program adoption drives notable improvements in student perceptions of school climate, including reported declines in bullying and fighting in schools. N. Gordon and Ruffini (2020) take advantage of the fact that eight states participated in a CEP pilot program starting in 2012 (before the program extended nationwide in 2015) to estimate the effects of attending a CEP-eligible school on suspension rates and other disciplinary outcomes using data from four waves of the Department of Education's Civil Rights Data collection. Their analyses suggest that suspension rates for elementary and middle school students in CEP-eligible schools fall modestly when CEP becomes available to schools in their states, though this decline is only statistically significantly different from zero for White males. While informative, these estimates likely understate the effect of school-level CEP participation, since only half of eligible schools had opted into the program by 2017. More directly relevant are findings from Kho’s (2018) work using data from Tennessee. Using a DiD approach, Kho finds that student suspension rates remain unchanged during a school's 1st year of CEP participation but decline by 1.5 percentage points in their school's 2nd year in the program and 2.3 percentage points in their school's 3rd year in the program.
Lunch Stigma and the Effects of Universal Meals
The above-referenced evaluations of CEP and other universal meal programs typically invoke stigma as a mechanism for program effects. Link and Phelan (2001, p. 367) provide a helpful definition of this widely-used term, writing that “we apply the term stigma when elements of labeling, stereotyping, separation, status loss, and discrimination co-occur in a power situation that allows the components of stigma to unfold.”
Several studies suggest that the means-tested distribution of free or reduced-priced meals creates stigma by associating school meals with poverty. Students who come of age in schools that provide free or reduced-price meals to income-eligible students often use terms such as “disgusting” and “welfare food” to describe school meals (Poppendieck, 2011). In these contexts, participation in means-tested FRL school programs may mark students as disadvantaged in the eyes of their teachers and peers (Best, 2017; Weaver-Hightower, 2011). This stigma may lead many students to opt out of school-provided meals (Mirtcheva & Powell, 2009). Further, it likely raises the salience of student social class and other ascriptive student characteristics associated with social class in school status hierarchies, negatively affecting free lunch participants’ achievement and other school-related outcomes (Yu et al., 2019).
School Meals and Teacher Perceptions
Generations of scholarship in the sociology of education draws attention to the ways student social class structures the relationship between teachers and administrators, who typically hail from middle-class backgrounds, and their socioeconomically diverse students. Rist (1970) documents how information from social workers, fellow teachers, and interactions with parents about students’ family backgrounds shapes teacher expectations of student behavior and ability even before they interact substantially with students. In schools in which school meal distribution is means-tested, teachers may distribute applications for FRL to students and their families; encourage families to apply, collect, and submit applications; and organize students into lines at meal time. These activities may lead teachers to make inferences about students’ socioeconomic status (SES) that can shape their evaluations of students’ academic ability (Ready & Wright, 2011), motivation (Auwarter & Aruguete, 2008; Jussim et al., 1987), and behavior (Calarco, 2018; Dunkake & Schuchart, 2015).
School Meals and Student Social Dynamics
Furthermore, while much of the school day is highly structured and adult supervised, school meal periods provide students with extensive and relatively independent social time. Student experiences during these periods influence both the way students see themselves and the way they are seen by others in the school environment (Best, 2017; Calarco, 2018; Milner, 2013). As students sort into school lunch groupings, they often develop peer subcultures, distinguished by distinct norms of dress and self-presentation, behavior, and status ranking in the school's social hierarchy. Reflecting on the school lunchroom's role in his high school's social life, one student recounts, “I always felt that my level of coolness was being judged by the respective status of each individual I was with” (Milner, 2013, p. 61).
Means-tested lunch distribution may increase the salience of social class at mealtime and throughout the school day. Students must line up for school meals and collect their food before they sit and eat. Students who opt out of school meal programs, meanwhile, can often proceed straight to their meals. Furthermore, as a growing number of schools begin to offer unsubsidized a la carte meal options, students who can afford to do so may pay cash for more desirable snack foods (Best, 2017; Poppendieck, 2011). These means-tested school meal distribution processes sort and spatially segregate students, influencing how students socialize in the lunchroom (Best, 2017).
Free School Meals and School Discipline
By allowing participating schools to offer free meals to all students, CEP renders means-tested meal distribution mechanisms unnecessary, arguably mitigating meal stigma and its consequences for students. Doing so, we hypothesize, has downstream consequences for the disciplinary climate in participating schools. We imagine two mechanisms through which these consequences might emerge.
First, universal meal provision may improve student behavior by improving student nutrition. Prior research clearly demonstrates that CEP and other universal meal provision programs boost student participation in school meal programs (Gordanier et al., 2020; Gutierrez, 2021; Kitchen et al., 2013; Pokorney et al., 2019; Rothbart et al., 2020; Ruffini, 2021; Schwartz & Rothbart, 2020; Turner et al., 2019). While part of this effect is likely attributable to the reduction in the cost associated with school meals for students who would have had to pay for school meals as well as a reduction in the administrative burden associated with free or reduced-price meal receipt, stigma reduction is likely also an important driver of increased meal take-up (Gutierrez, 2021; Holford, 2015; Schwartz & Rothbart, 2020). A separate literature indicates that youth hunger and malnutrition are associated with externalizing behaviors (Howard, 2011; Kimbro & Denney, 2015), and nutritional supports protect at-risk youth from suspensions and other forms of school discipline (Gennetian et al., 2016).
Second, CEP may interrupt vicious cycles that contribute to high rates of exclusionary discipline, particularly for Black, Native American, and Hispanic youth. Since SES varies with race and since race is associated with poverty in society more broadly, school-based practices that increase poverty's salience in school social organizations and highlight the association between race and poverty can trigger broader racial stigmas. Such stigmas may lead educators to scrutinize minoritized students’ behaviors unsympathetically (Gilliam et al., 2016; Okonofua & Eberhardt, 2015) and cause students of color to believe that school is not for them and behave accordingly (Borman et al., 2021; Goyer et al., 2019; Kupchik, 2010). Together, these responses may widen racialized disciplinary disparities.
Hypotheses
Consistent with prior research regarding the effects of universal meal provision on student outcomes, we hypothesize that:
Our account emphasizes the reduction of meal stigma as a primary mechanism for program effects. We acknowledge, however, that stigma is only one of several potential mechanisms that could account for CEP effects. The remaining hypotheses examine patterns that, at least indirectly, reveal the potential role that stigma plays in CEP effects.
If CEP changes student outcomes by reducing administrative burden in schools, we would expect the benefits of CEP to be shared across school populations. Similarly, if CEP changes outcomes by providing cost reductions in school meals for children from previously ineligible families, we would expect its effects to be most pronounced for these relatively affluent students. By contrast, if CEP affects outcomes by reducing the stigma associated with school meals, we would expect its effects to be most pronounced for children from low-income households. The means-tested distribution of free school meals likely forced these students to either face stigma associated with receiving a free meal or avoid the stigma by foregoing school meal (and its nutritional benefit). In either case, our focus on stigma as a mechanism for CEP effects leads us to hypothesize that:
Previous research provides evidence consistent with this second hypothesis (Bartfeld et al., 2019; Gordanier et al., 2020; Kitchen et al., 2013; Mirtcherva & Powell, 2009). However, this study's unique link between school and tax data makes it the first, to our knowledge, to directly investigate the ways the effects of universal school meal provision vary with student economic background.
Finally, in light of existing scholarship on disciplinary disparities focusing extensive attention on pronounced and persistent racial disparities in exposure to school discipline (Anderson & Ritter, 2017; Barrett et al., 2021; Freidus, 2020; Gregory et al., 2010; Lindsay & Hart, 2017; Owens & McLanahan, 2020), we might expect CEP's stigma-reducing effects to be most pronounced for racially minoritized students. If CEP implementation reduces the salience of these racial stereotypes, we hypothesize that:
Existing research on this point is limited. N. Gordon and Ruffini (2021) find evidence to suggest that the disciplinary consequences of attending a CEP eligible school are most pronounced for White male elementary-aged students, though, as noted above, this study is based on CEP eligibility, not participation.
Data
To test these hypotheses, we link student-level educational administrative data from the Oregon Department of Education (ODE) with confidential microdata stored at the Census Bureau including SNAP records from the state of Oregon and income tax records from the IRS. The ODE data provide annual records on all students enrolled in Oregon public K–12 schools between 2009–2010 and 2016–2017. Included in these records is an indicator flagging each academic year in which a student has received either an in-school or out-of-school suspension. This indicator is the focal outcome for our article. Additional measures include indicators of student race/ethnicity and annual indicators flagging students who were enrolled in FRL enrollment for each year 2010–2014. 2 Students appear in SNAP records when they are listed as members of households that receive SNAP benefits; they appear in IRS records when they are claimed as dependents on IRS tax returns.
Merging across these data sources is possible using Census's Protected Identification Keys (PIKs), which are assigned to the three administrative data sources using the Person Identification Validation System. 3 As noted in Table 1, 96% of K–12 students in the ODE data are assigned PIKs in this process. We exclude students without PIKs from our analyses. Hispanic children and children in nonmarried households are overrepresented among these excluded students. We use inverse probability weights to address these nonresponse biases. 4
Population and Sample Summary
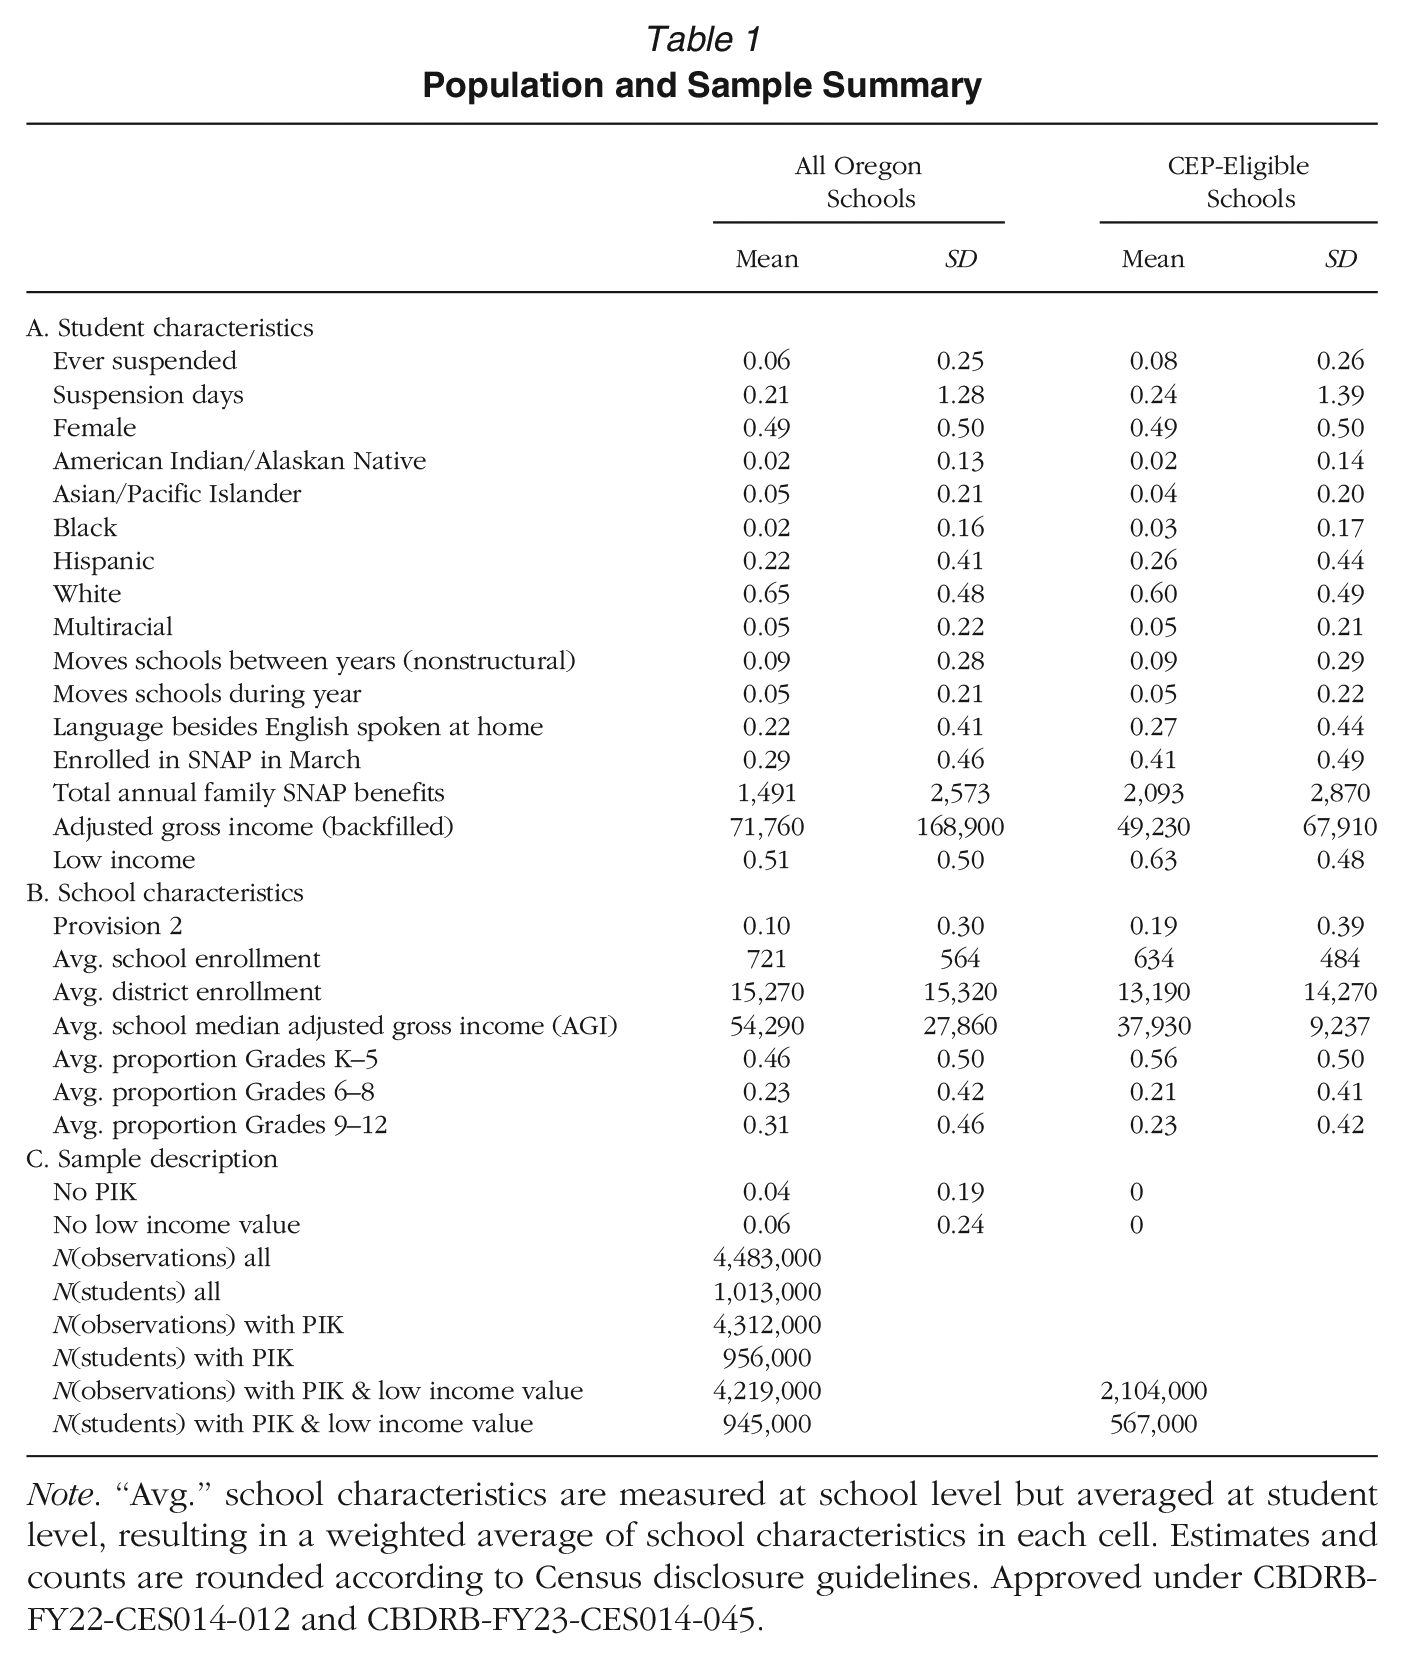
Note. “Avg.” school characteristics are measured at school level but averaged at student level, resulting in a weighted average of school characteristics in each cell. Estimates and counts are rounded according to Census disclosure guidelines. Approved under CBDRB-FY22-CES014-012 and CBDRB-FY23-CES014-045.
Appendix A provides details on the variables we construct using the linked data. One variable of particular importance is the low-income indicator, which leverages both SNAP and IRS data to identify students who likely live in households with income below 1.85 times the federal poverty line (and are, thus, eligible for FRL). In addition to restricting our sample to students who have PIKs, we further require a nonmissing value of the low-income variable, since this variable is central to our heterogeneity analyses. Six percent of Oregon students do not have a low-income value, either because they do not have a PIK or because they do not appear in the IRS Form 1040 or SNAP records in the relevant years. By dropping students with missing data, we proceed with the implicit assumption that they are missing at random, which is supported by related research. 5 After restricting based on the availability of PIK and income information, the data is reduced to 4.2 million student-year observations.
To create our analytic sample, we additionally exclude students enrolled in schools that are not eligible to participate in CEP, as well as a small number of students enrolled in schools with fewer than 20 students, specialty schools managed directly by their district or the ODE, and schools that either opened or closed at any point during the study period. Schools are eligible for CEP if 40% or more of enrolled students directly certified for free school meals or identified by the school district as homeless, foster, or runaway youth in the prior academic year. Data on this measure, which the USDA refers to as the Identified Student Percentage (ISP), are available for Oregon between 2014–2015 and 2016–2017 from the FRAC and the Center on Budget and Policy Priorities. However, since these data may be incomplete, we additionally use data on school SNAP rates, because SNAP participation is the main characteristic used to calculate ISP. Schools are marked as eligible for CEP if SNAP percentages are greater than 40% in the prior school year. Finally, because districts can group schools into CEP-eligible clusters based on the group ISP rate, we consider all schools in districts where the entire district has a SNAP percentage of at least 40% to be CEP eligible, regardless of the concentration of SNAP participating students in the school. These sample restrictions exclude roughly one-half of the full data, for an analytic sample of 567,000 students and 2,104,000 student-year observations.
Table 1 highlights the ways that students in CEP-eligible schools differ from the average Oregon student. Our analytic sample includes a higher proportion of low-income students, English language learners, and Hispanic students than the state overall. The analytic sample also has somewhat higher average suspension rates compared to excluded schools. Elementary schools are disproportionately likely to be eligible for CEP, and, accordingly, CEP schools have lower enrollment than the state average.
Approximately one in five students in CEP-eligible schools are exposed to NSLP's Provision 2 in our data. Provision 2 provides free meals to all students, though less than 7% of Oregon schools provided universal free lunch via Provision 2 in 2014. Most participating schools opt to only provide free breakfast. Unlike CEP, Provision 2 requires use of the traditional school lunch application process to establish initial reimbursement rates, and the USDA does not provide additional funds to support school meals for students that are not income eligible (USDA, 2002, (2014). Thus, the program is most financially viable for extremely high-poverty schools. Perhaps reflecting the lack of financial incentive, many schools drop into and out of Provision 2 year over year. We view Provision 2 as a substantially weaker treatment than CEP and one concentrated in extremely high-poverty schools where free lunch is the norm and lunch stigma may be less salient. Our analyses do not differentiate between the effects of CEP implementation for schools that had previously participated in Provision 2 and schools that had not. In supplementary analyses, available by request, we exclude schools who participated in the Provision 2 from the analytic sample. These analyses return substantively similar results to the analyses reported here.
Empirical Methodology
We employ a DiD approach to estimate the effects of CEP implementation on suspension probabilities for students in CEP-eligible schools, with particular attention to heterogeneous treatment effects across the student subgroups most likely to confront stigma. We discuss our primary model below. Appendix B provides details on supplementary analyses that test for treatment effect variation with the timing of program implementation and the number of years schools have implemented the program.
Because the use of suspension is more common in middle and high school compared to elementary school, we estimate models separately for Grades K–5, 6–8, and 9–12, by splitting the sample based on student grade, in addition to estimating treatment effects for the full sample. We further estimate treatment effects for two panels of students—those in Grades K–2 in 2013–2014, and those in Grade 9 in 2013–2014—the details of which we describe in the student fixed effects section below.
Finally, we modify the models to allow treatment effects to vary by student characteristics, including low-income status and race. Thus, we offer estimates of the overall effect of CEP on suspension, broadly, as well as estimates by school level, student subgroups, and subgroups by school level.
Estimating the Effect of CEP Implementation
First, we model the treatment-on-the-treated effect for CEP overall. That is, if we assume the treatment effect of CEP is constant across cohorts and treatment periods, we can identify the treatment effect of CEP on student outcomes with the following model:
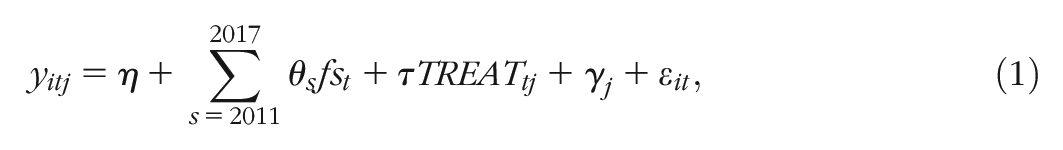
where
Implicit in Model (1) is an assumption that treatment effects are constant across cohorts and treatment periods (Goodman-Bacon, 2021; Wooldridge, 2021). We need not make this assumption. Thus, we estimate versions of Model (1) in which we break out the treatment indicator into three treatment period indicators and, in its most disaggregated form, by treatment cohort-by-period indicators. 7 Both models provide insight into the suitability of assuming a single constant treatment effect in this setting. The details of these disaggregated models are in Appendix B.
Three key assumptions must hold for Model (1) to generate unbiased causal treatment effect estimates: (a) schools did not adjust policies and practices in advance of program implementation; (b) in the absence of CEP implementation, outcomes in treatment schools would have followed parallel trends to outcomes in untreated schools; and (c) students did not select non-randomly into schools on the basis of their CEP participation.
The first assumption is reasonable in this setting since eligible schools and districts act in late spring to enroll in CEP for the subsequent school year. It is unlikely that students, teachers, or administrators change their behavior with respect to suspension because they anticipate universal free lunch provision the next year. It is also unlikely that schools change their lunch practices prior to their official enrollment in CEP, since their reimbursements do not change until after enrollment.
The second assumption is somewhat more restrictive. The CEP program rolled out during a period in which educators, policymakers, scholars, and activists were directing considerable attention to school discipline practice and the ways these practices contribute to educational inequalities. As we discuss in more detail below, this scrutiny appears to have contributed to broad-based declines in school suspension rates. These trends do not in and of themselves constitute a threat to the unbiased estimation of the effects of CEP implementation using a DiD approach. However, if declines in CEP implementation correlate with school decisions to implement CEP, they may confound our treatment effect estimates. To address this potential threat to valid inference, we provide a detailed comparison of pretreatment suspension trends across participating and nonparticipating CEP eligible schools, including estimating interaction analyses that test for significant variation in overall and group-specific suspension trends by treatment cohort. 8
The third assumption is also somewhat restrictive. When schools opt into CEP, they position themselves to provide material benefits for students and their families. Students who would not have been income-qualified for free meals benefit by receiving free lunches; students who would have been income-qualified for free meals benefit from a reduction of administrative and social barriers around the take-up of these free meals. These benefits may attract new students to CEP-participating schools and/or increase the attachment of existing students to the school. To the extent these forces change the composition of the student body to include more students with disproportionately low suspensions rates, nonrandom selection into CEP-participating schools could modestly bias DiD estimates of the effects of CEP implementation in favor of finding a suspension-reducing effect. To address this possibility, we estimate a supplementary version of Model (1) with student fixed effects.
The Student Fixed Effects Model
In a variation on Model (1), we employ a panel dataset in which we observe students for 4 consecutive years in the same school. This offers two advantages: first, we can use student fixed effects to estimate the within-student effect of CEP; and second, we can define student subgroups by their pre-CEP income and lunch status, to examine how pre-treatment labels may factor into the CEP treatment effect.
We estimate:
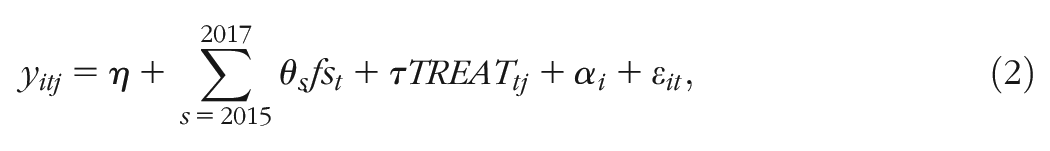
where
This approach addresses the threat of nonrandom selection into CEP schools by eliminating students who move schools and focusing analytic attention on within-student changes in suspension outcomes associated with CEP implementation. However, the sample restrictions required to arrive at a perfectly balanced panel yields a nonrepresentative sample of ODE students. In addition to excluding students who switch schools, we also exclude students missing a low-income value in any of the 4 years in order to maintain a balanced sample while matching the low-income exclusion of the main model. The grade spans we can examine are also limited: this sample includes only students who are in kindergarten, first, second, or ninth grade in 2014, so we can observe them in the same school for 3 additional years. As such, we estimate this student fixed effect model separately for the elementary (Grades K–2) panel and the ninth-grade panel.
Estimating Variation in Effects of CEP Across Subgroups
Our second and third hypotheses predict differing effects of CEP for different subgroups of students. To test these hypotheses, we estimate an elaborated version of Model (1), in which treatment and academic year indicators are additionally interacted with subgroup indicators. For simplicity, consider subdividing students into two groups according to binary indicator
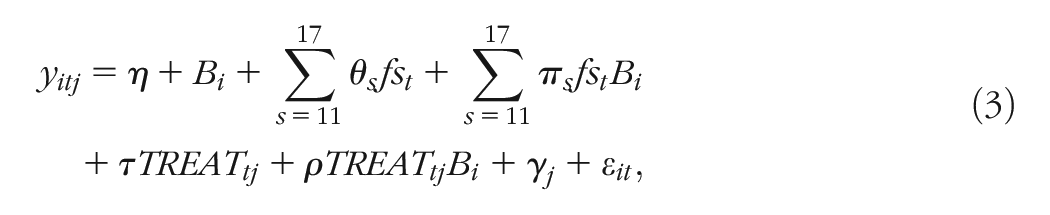
The difference in the treatment effect of CEP for students in Group B compared to students not in Group B is
We test our second hypothesis by estimating a version of Model (3) that compares the effects of CEP implementation on students from low-income households and students from households that are not low income. We test our third hypothesis by estimating a version of Model (3) that compares the effects of CEP implementation on American Indian/Alaska Native, Asian/Pacific Islander, Black, Hispanic, Multiracial, and White students. Because we are interested in how the net treatment effects vary across subgroups, rather than present lengthy regression results, we estimate linear predictions of treatment effects for different subgroups. For example, when we estimate the regression where
We run the same analyses using the student fixed effects model, with analogous modifications to Model (2). The panel data in the student fixed effect model also allow us to test a more nuanced version of our second hypothesis, by comparing treatment effects for subgroups defined by their FRL enrollment and low-income status in 2014, prior to the implementation of CEP. This is important because prior research demonstrates that many income-eligible students do not enroll in means-tested meals programs while many seemingly income-ineligible students do, making the low-income measure an imperfect proxy of FRL enrollment and, thus, an imperfect indicator of which students might have experienced FRL-related stigma (Domina et al., 2018). Moreover, means-tested meal enrollment status can only be reliably observed prior to CEP implementation (Spiegel et al. 2022). We therefore use the student fixed effects model to test CEP's disciplinary effects separately for students in four categories based on their 2014 statuses: (a) students who are not enrolled in FRL and are not income-eligible, (b) students who are not enrolled in FRL but are income-eligible, (c) students who are enrolled in FRL but not income-eligible, and (d) students who are enrolled in FRL and income-eligible. Like all of the student fixed effect estimates, this approach sacrifices external validity, but these estimates provide a unique opportunity to separate CEP's stigma-reduction mechanisms from its nutrition-provision mechanisms. We would expect a nutrition pathway to particularly benefit low-income students not previously enrolled—who may be less likely to bring or purchase a nutritious lunch—while a stigma pathway would benefit students previously enrolled, regardless of their income status.
Results
Patterns in CEP Implementation
Figure 1 maps schools that implemented CEP across Oregon from 2014–2015 to 2016–2017. This figure represents CEP participating schools as black diamonds and nonparticipating schools as white circles. Of the 316 Oregon public schools that took up CEP during our student period, 242 did so in 2015, 63 joined in 2016, and 11 joined in 2017. As the figure illustrates, CEP schools are distributed widely across the State of Oregon. The second map included in Figure 1 represents CEP participation in the greater Portland region. Most larger school districts in Oregon such as the Portland and Salem-Keizer school districts include both CEP-participating and nonparticipating schools. Approximately 40 school districts throughout Oregon include a mixture of participating and nonparticipating schools. In 22 districts, all schools participated in CEP.
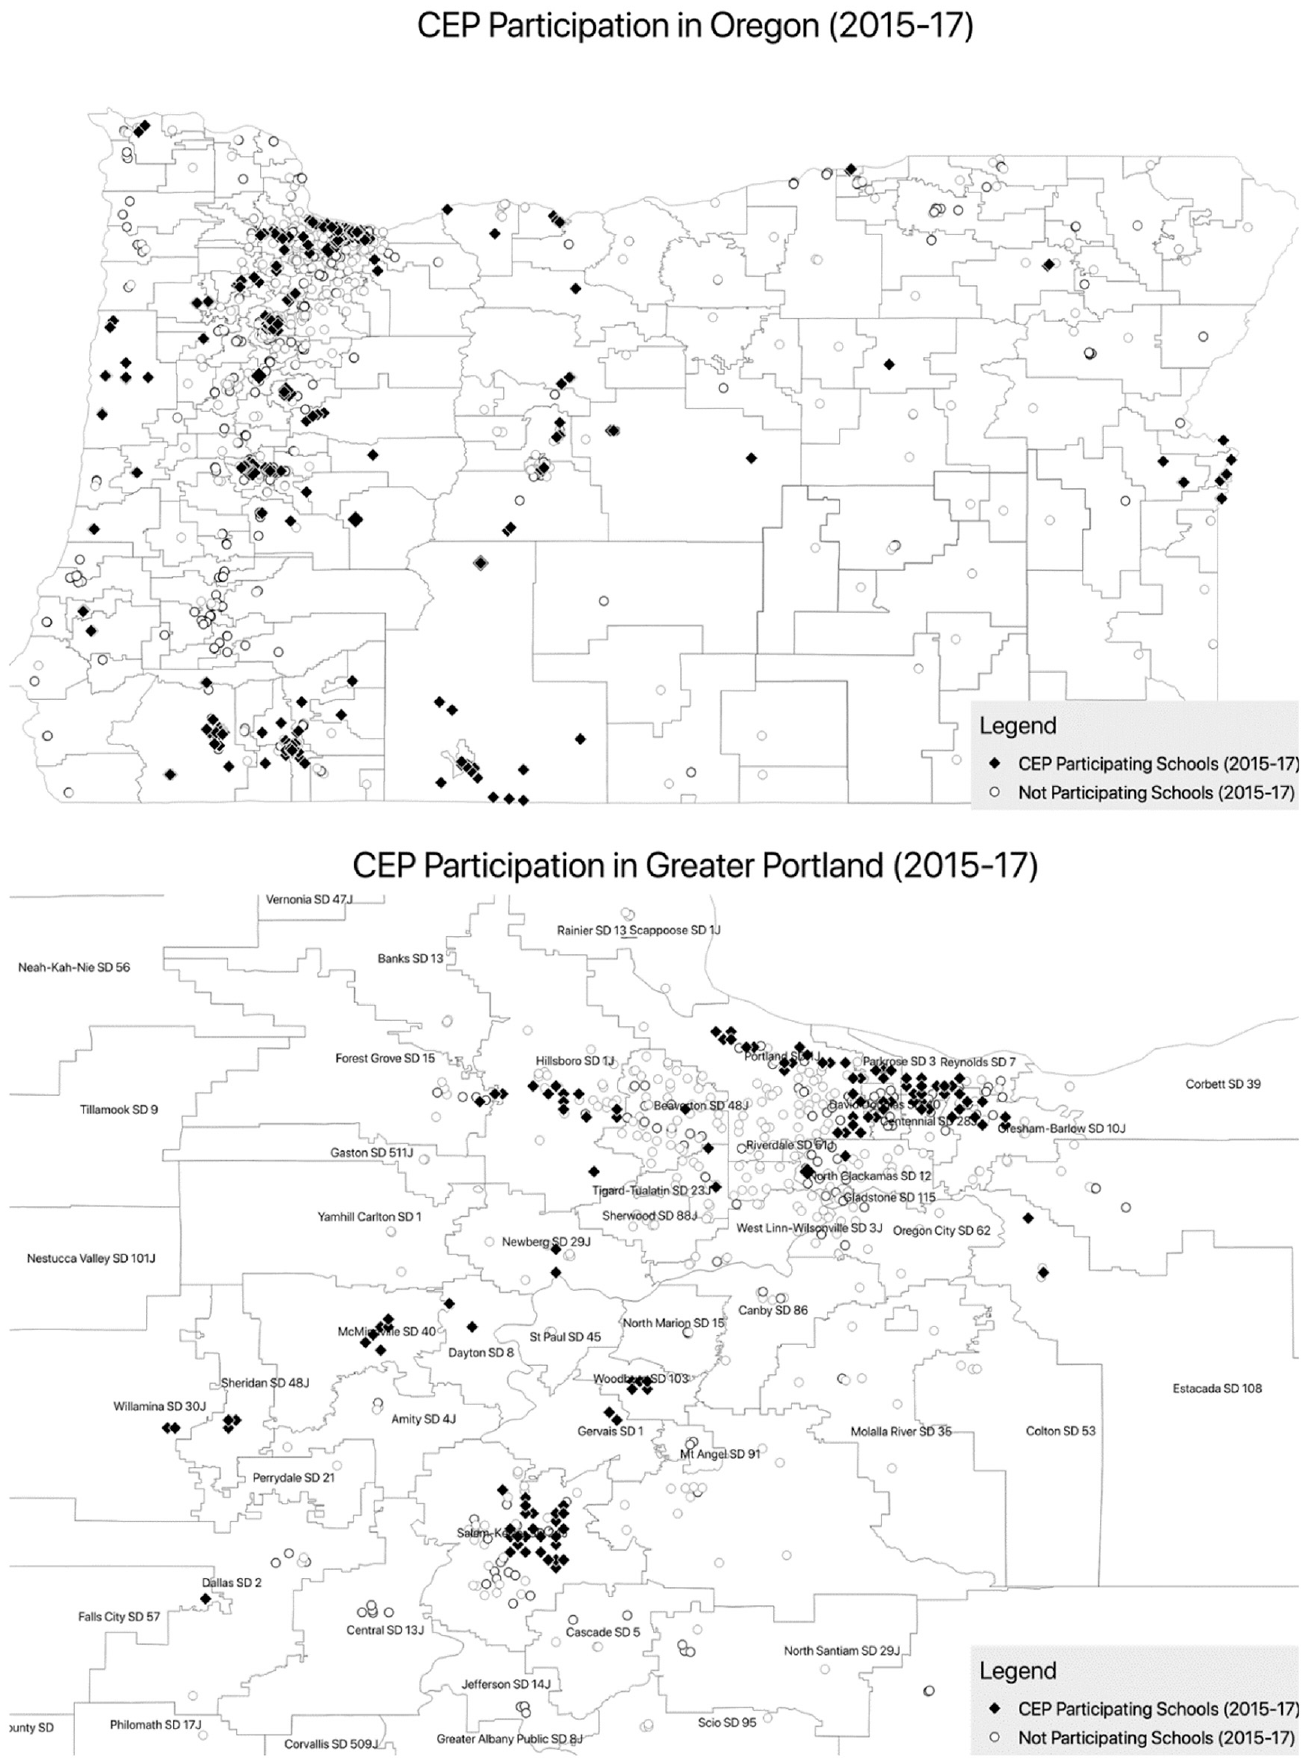
Map of Oregon public schools by CEP participation.
As noted in Table 1, CEP-eligible Oregon public schools enroll more low-income students and more students of color than CEP-ineligible schools since federal policy only allows schools and districts with high proportions of economically disadvantaged students to participate in CEP. This pattern, however, also extends to program take-up among eligible schools, as shown in Table 2, which compares the demographic profile of schools that implemented CEP during our study period (our treatment schools) with that of schools that were eligible to enroll in the program, but did not do so (our control schools). On average, treatment schools enroll a higher proportion of low-income students and students of color than control schools. For example, in 2014, treatment schools are 51% White and 34% Hispanic, compared to control schools, which are 66% White and 21% Hispanic. Forty-nine percent of students in treatment schools are enrolled in SNAP in March 2014 compared to 37% of students in control schools. The mean family income for students in treatment schools is $10,000 lower than for students in control schools. CEP's funding formula, which reimburses participating schools based on the proportion of students who participate in SNAP and other means-tested social safety net programs, likely accounts for these patterns.
Trends in Covariates for Treatment and Control Schools
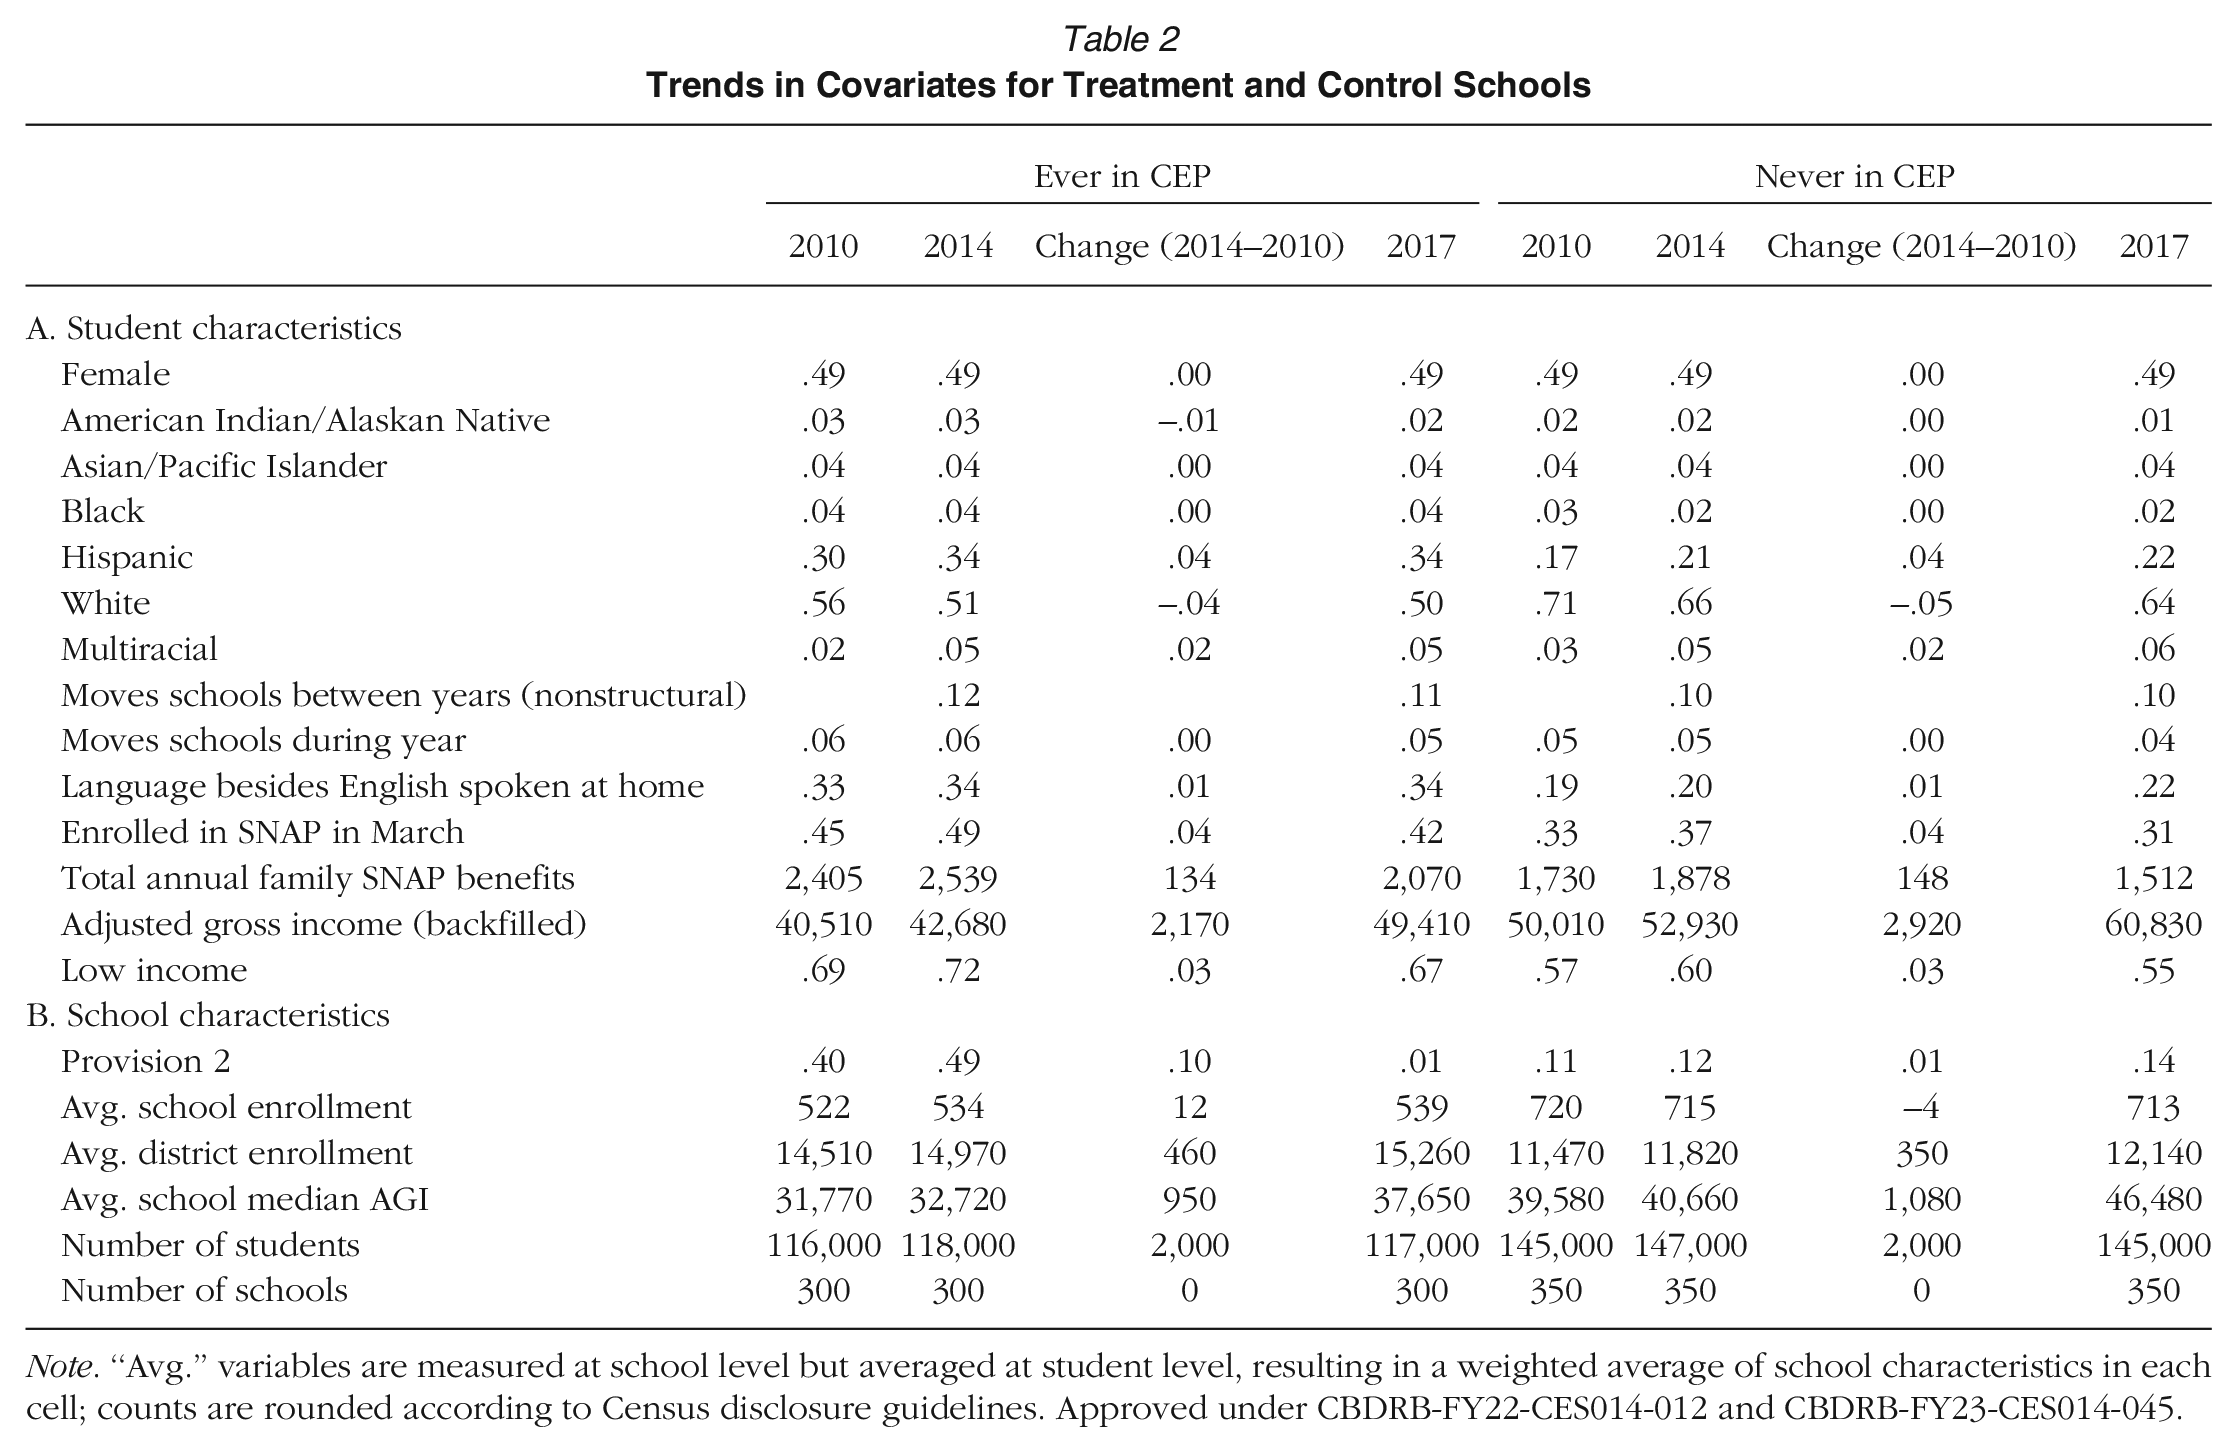
Note. “Avg.” variables are measured at school level but averaged at student level, resulting in a weighted average of school characteristics in each cell; counts are rounded according to Census disclosure guidelines. Approved under CBDRB-FY22-CES014-012 and CBDRB-FY23-CES014-045.
Patterns of Change in Treatment and Control Schools: Testing the Parallel Trends Assumption
While our DiD approach effectively accounts for time-invariant differences between the treatment and control group, causal inferences based on this design rely on the assumption that trends between treatment and control groups would move in parallel if not for the treatment. While the parallel trends assumption is ultimately untestable, the descriptive data reported in in Table 2 is consistent with parallel trends. The data reported here reveal little divergence in covariate trends between treatment and control groups, suggesting that these groups of schools were exposed to similar pressures during the pretreatment period and that—by extension—divergences in outcomes that emerge during the posttreatment period are likely attributable to the effects of CEP enrollment. The percentage of Hispanic students rises by 4 percentage points in both treated and untreated schools over the 4-year pretreatment time frame. Schools in both groups also see small parallel increases in the proportion of students who speak a language other than English in the home between 2010 and 2014. Similarly, although the mean IRS-reported income for students in both sets of schools increases by approximately 5% between 2010 and 2014, the percentage of students enrolled in SNAP increases by 4 percentage points in each group during this pretreatment period. 10
Figure 2 reports trends in suspension rates, our outcome variable. These unconditional trends provide additional evidence to support the parallel trend assumption. In 2010, the percentage of students ever suspended was 1.3 percentage points higher for students attending treatment schools compared to students attending schools that never participated in CEP. While suspension rates remain largely unchanged between 2010 and 2011 for schools in the control group, we observe substantial declines in suspension rates for both treated and control groups between 2011 and 2014. This rate of decline corresponds to a broad national trend in school discipline (Hirschfield, 2018). As Hwang et al. (2022) point out, these declines largely preceded the passage of two laws passed by the Oregon state legislature in 2013 and 2014 designed to eliminate zero tolerance school disciplinary policies and reduce the incidence of school suspensions for relatively minor infractions. In 2015, however, the first year of CEP, suspension rate trends for students in treatment and control schools begin to diverge. Students in schools that implemented CEP see a sustained decline in suspension rates, while the trend in suspensions among students in control schools levels off and even ticks upward in 2017. By 2017, despite having higher rates of poverty and attending schools with higher concentrations of poverty, students in schools that implemented CEP have lower rates of suspension compared to students in schools that declined to participate in CEP.
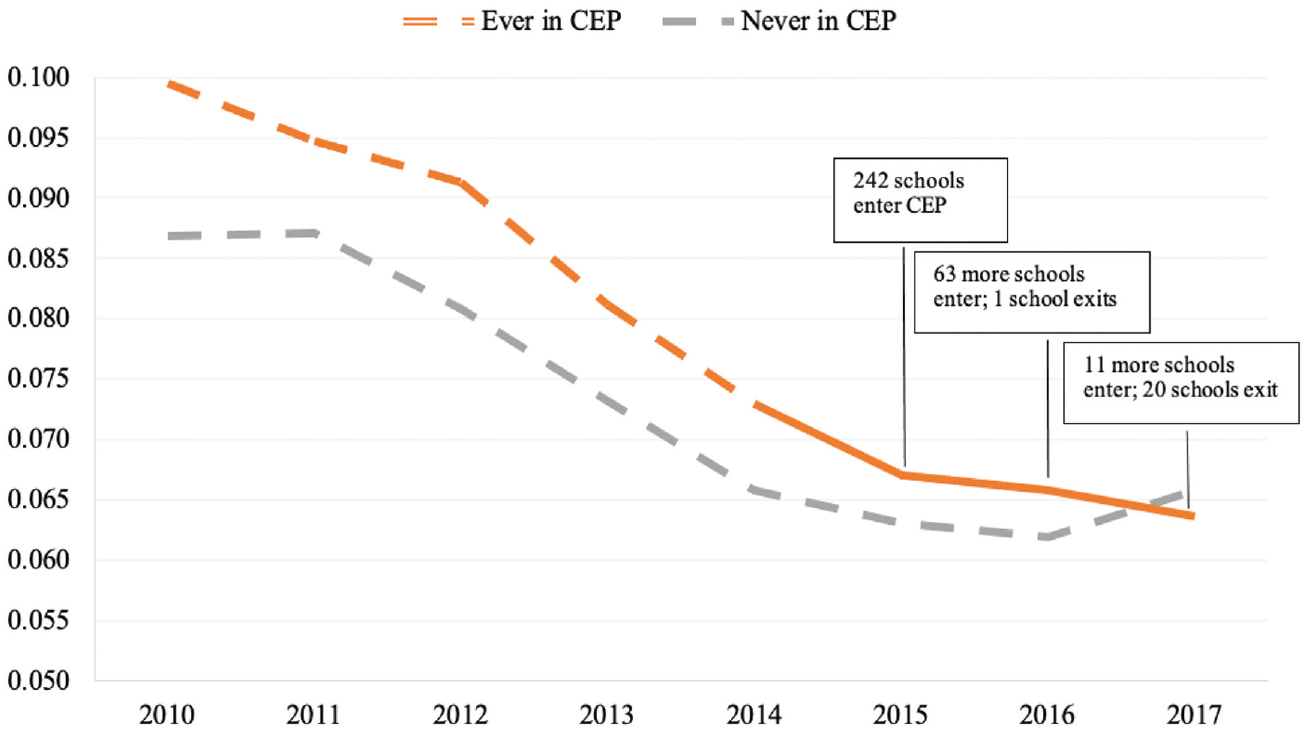
Suspension rate trends for Oregon public schools, by CEP participation.
Table 3 reports the results of a more formal test of the parallel pretrends assumption. We conduct this test by running a single regression of suspension on indicators for academic year, treatment cohort, and the interaction of the two, omitting academic year 2014 as the refence category. The first column of coefficients in Table 3 represents the difference in suspension probabilities for each year compared to 2014 for students in control group schools. Consistent with the results reported in Figure 2, this column indicates that suspension probabilities declined by approximately 2 percentage points between 2010 and 2014 but remained largely unchanged from 2014 to 2017 for students in control schools. The coefficients reported in the remaining columns show the deviation from the control group differences for each treatment cohort. Specifically, the coefficients in bold offer our test of pretrends. These coefficients are consistently small in magnitude and not statistically significant. As such, they provide no evidence of systematic divergence in suspension outcomes between treatment and control groups in the periods prior to treatment. 11 We see in Table 3 strong evidence in support of the parallel trends assumption that underlies the DiD analyses that we present below.
Suspension Probability Pretrends Analysis, Linear Probability Model Coefficients for Academic Year Indicators Interacted With CEP Implementation Cohort
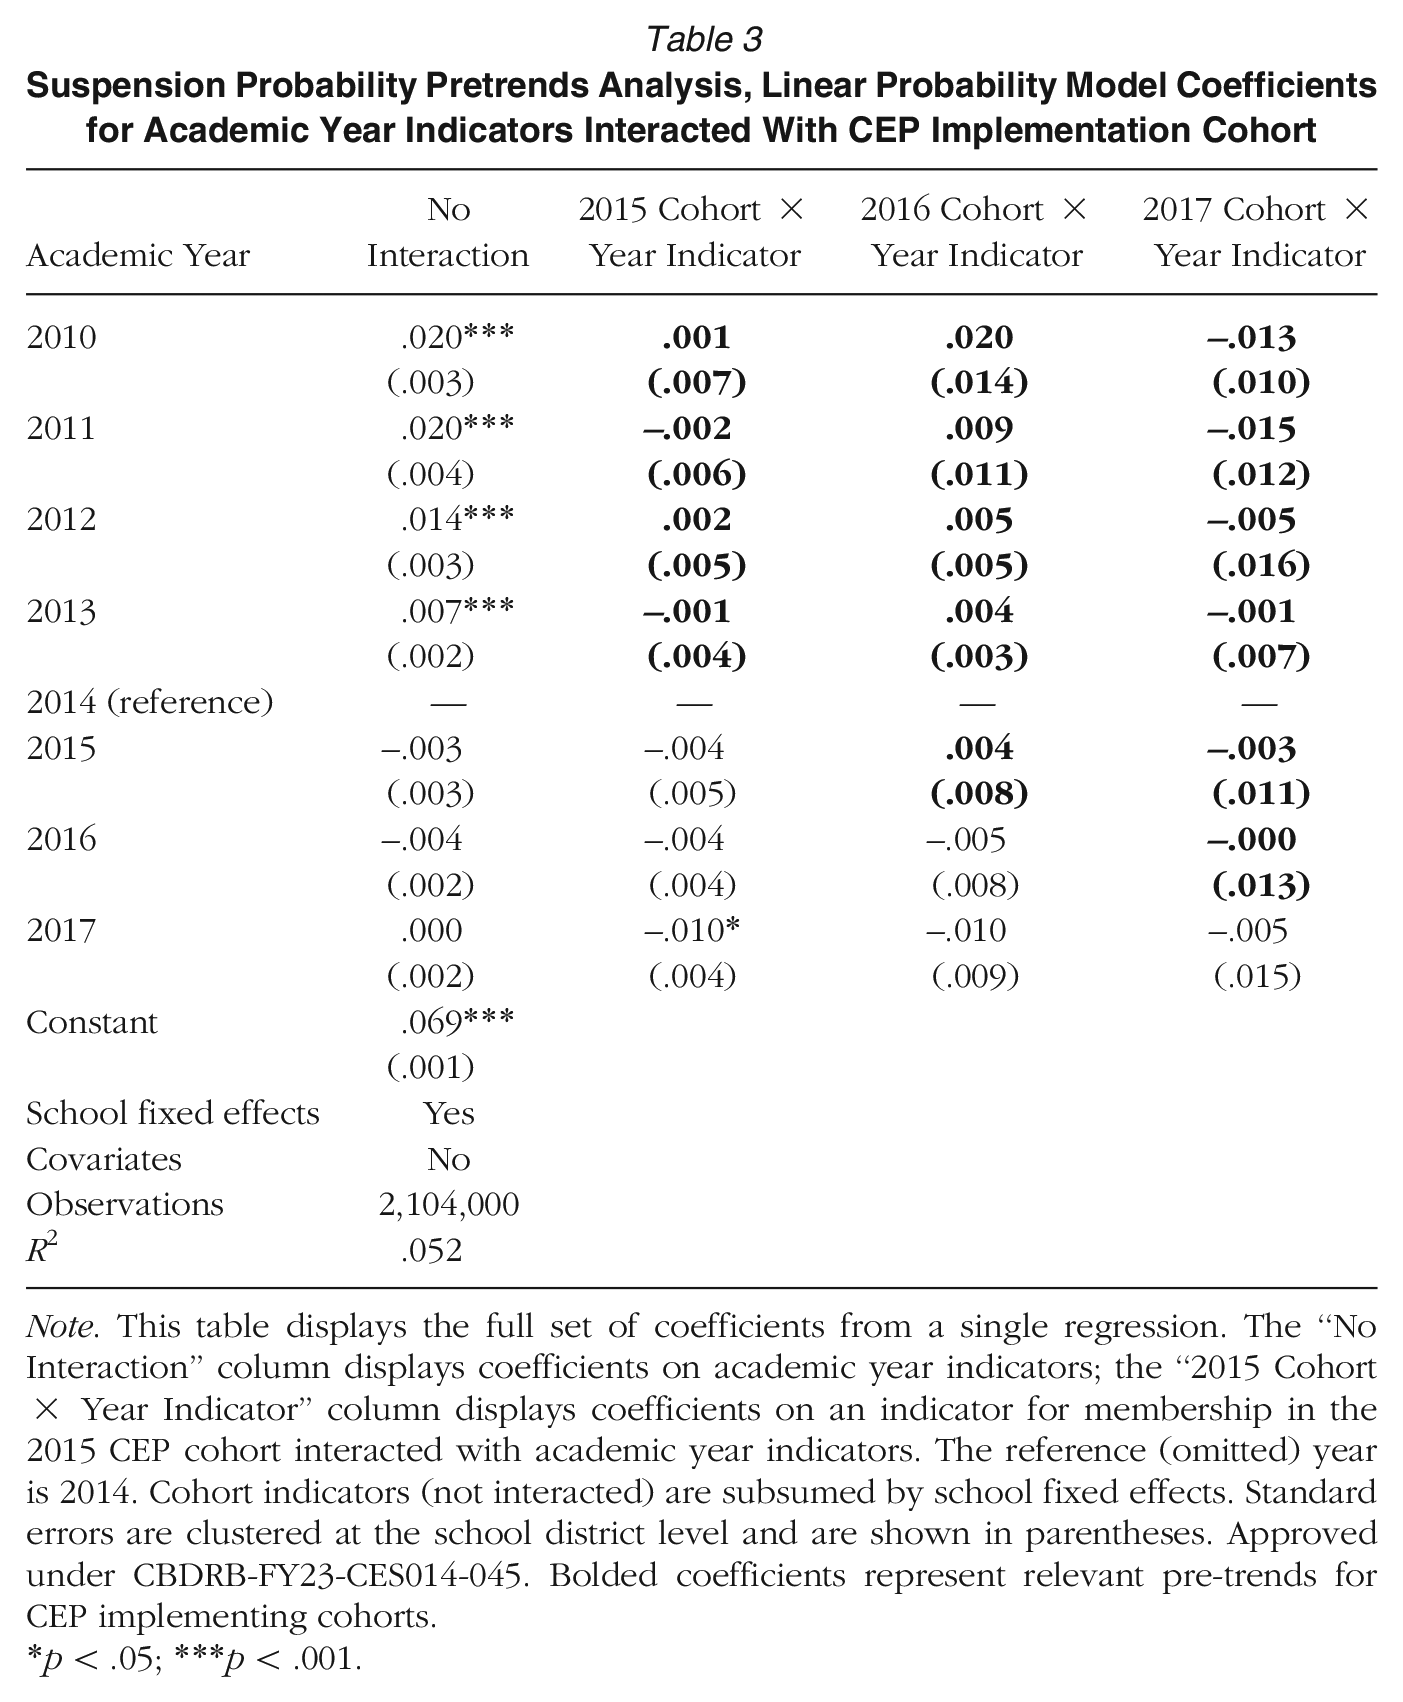
Note. This table displays the full set of coefficients from a single regression. The “No Interaction” column displays coefficients on academic year indicators; the “2015 Cohort × Year Indicator” column displays coefficients on an indicator for membership in the 2015 CEP cohort interacted with academic year indicators. The reference (omitted) year is 2014. Cohort indicators (not interacted) are subsumed by school fixed effects. Standard errors are clustered at the school district level and are shown in parentheses. Approved under CBDRB-FY23-CES014-045. Bolded coefficients represent relevant pre-trends for CEP implementing cohorts.
p < .05; ***p < .001.
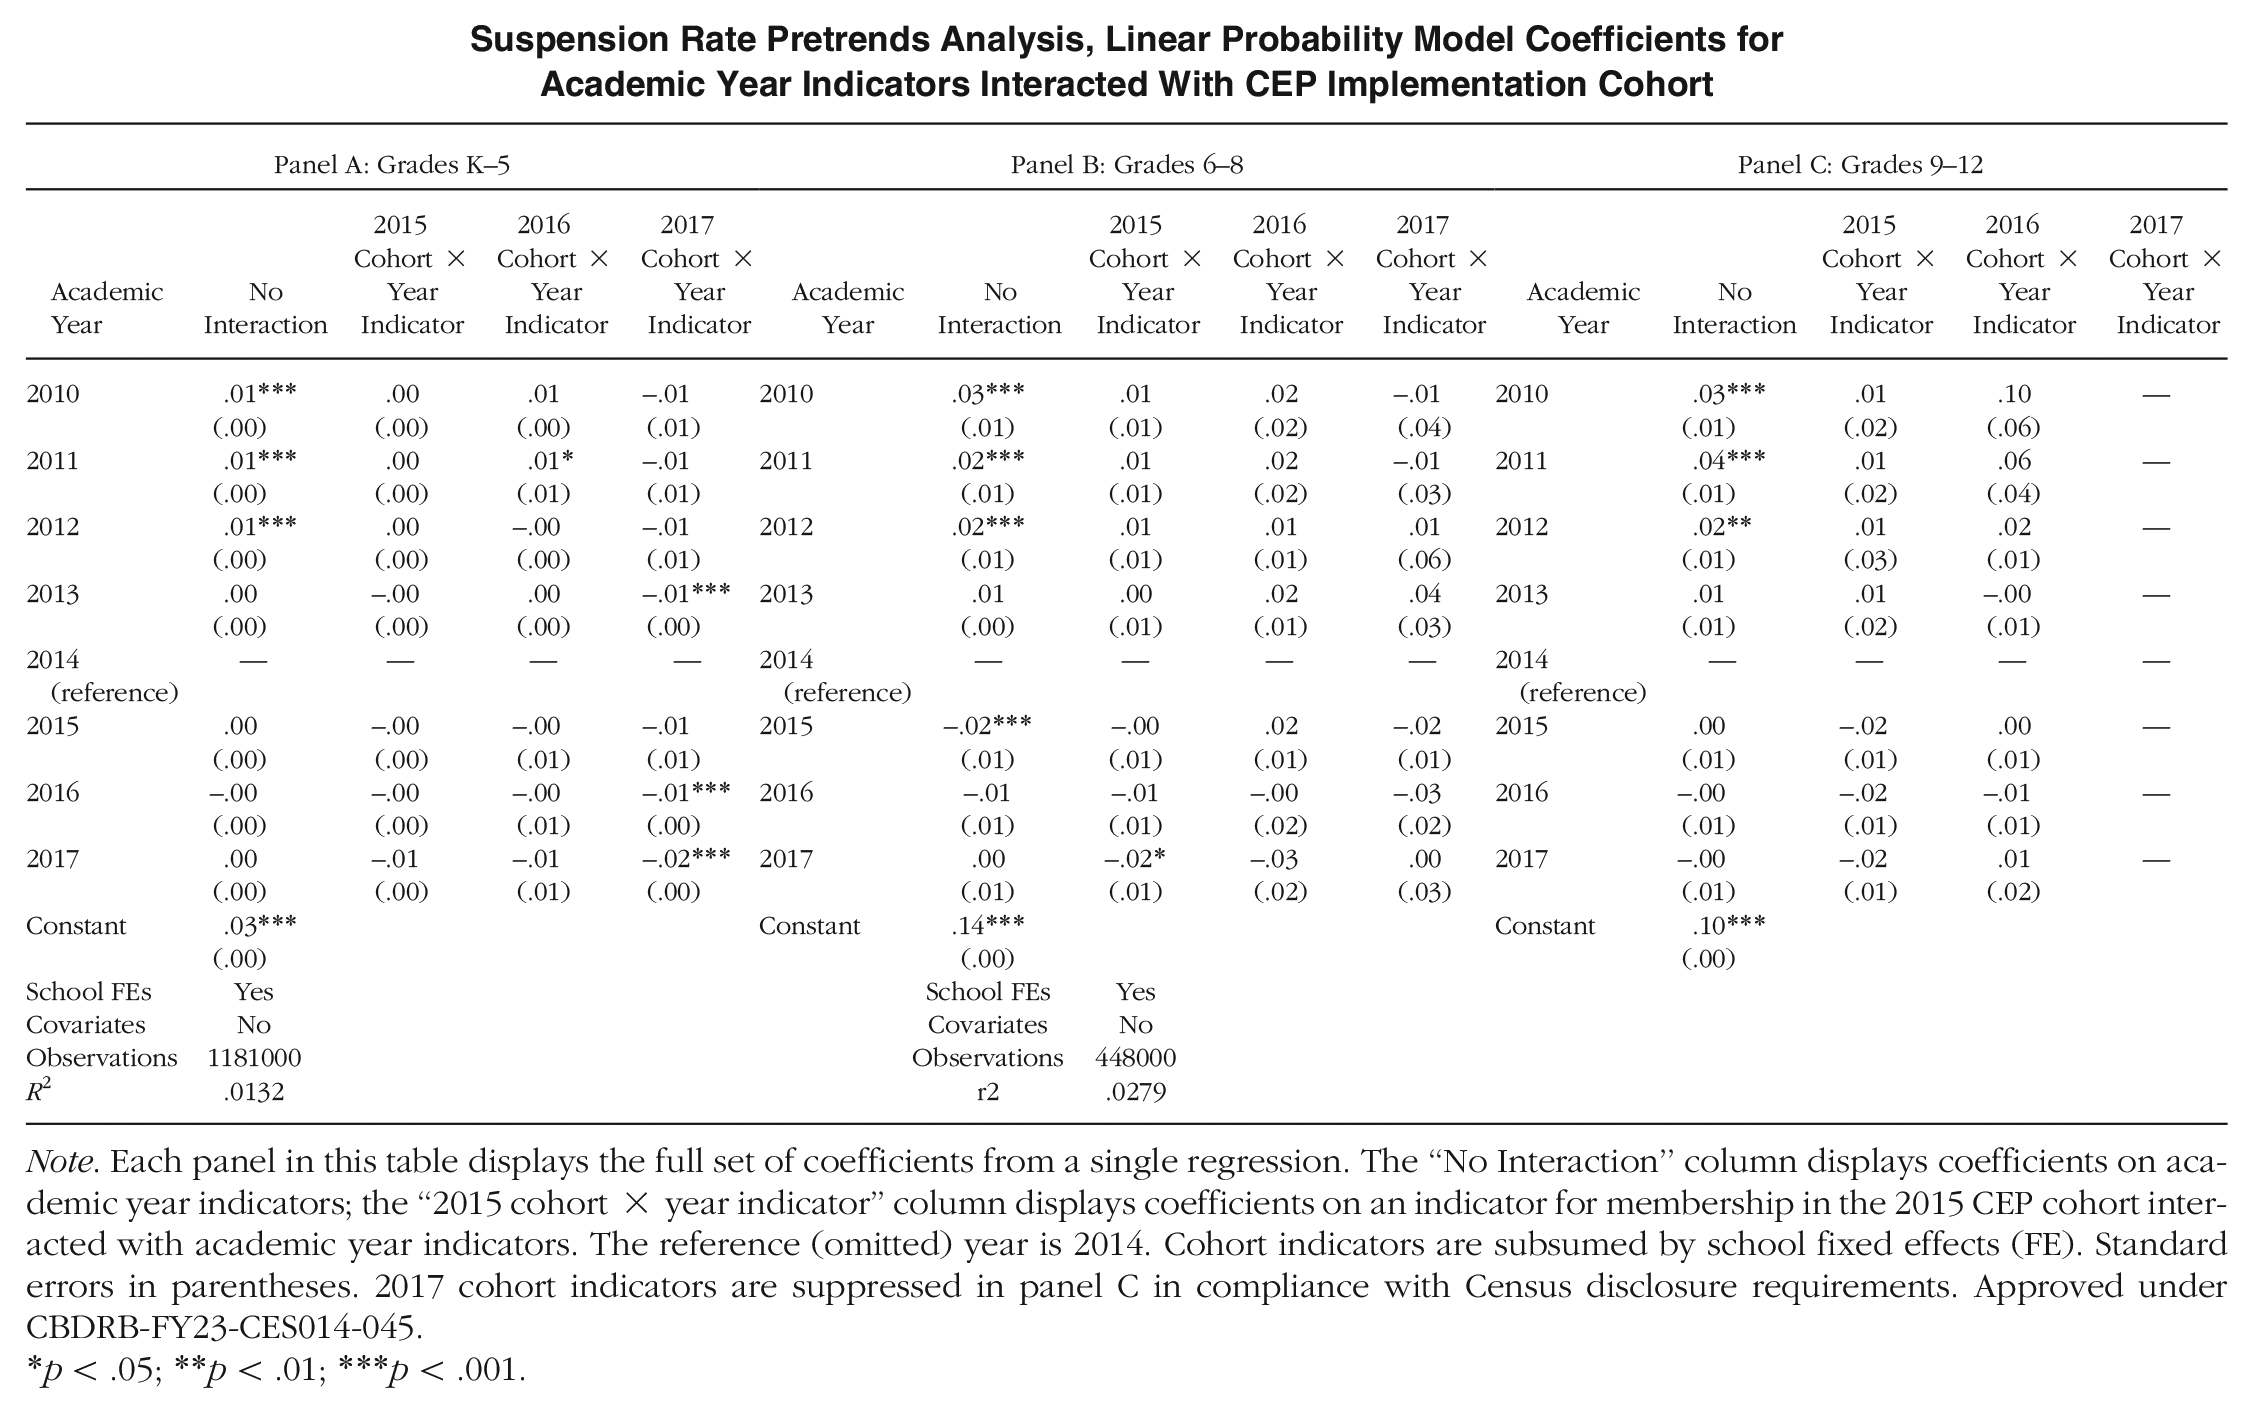
In Appendix C, we replicate these analyses for subsamples of students in elementary, middle, and high school grades. While these subgroup-specific pretrend analyses are somewhat less precise than the main analyses, they return largely similar null results. We additionally test the parallel pretrend assumption using a series of linear pretrend tests conducted on a sample that is limited to pretreatment academic years for each given cohort, These analyses, which are available by request, suggest suspension trends in treated schools did not significantly diverge from suspension trends in control schools, and pretrends are parallel among low-income and racially minoritized students.
Estimating the Effects of CEP Implementation
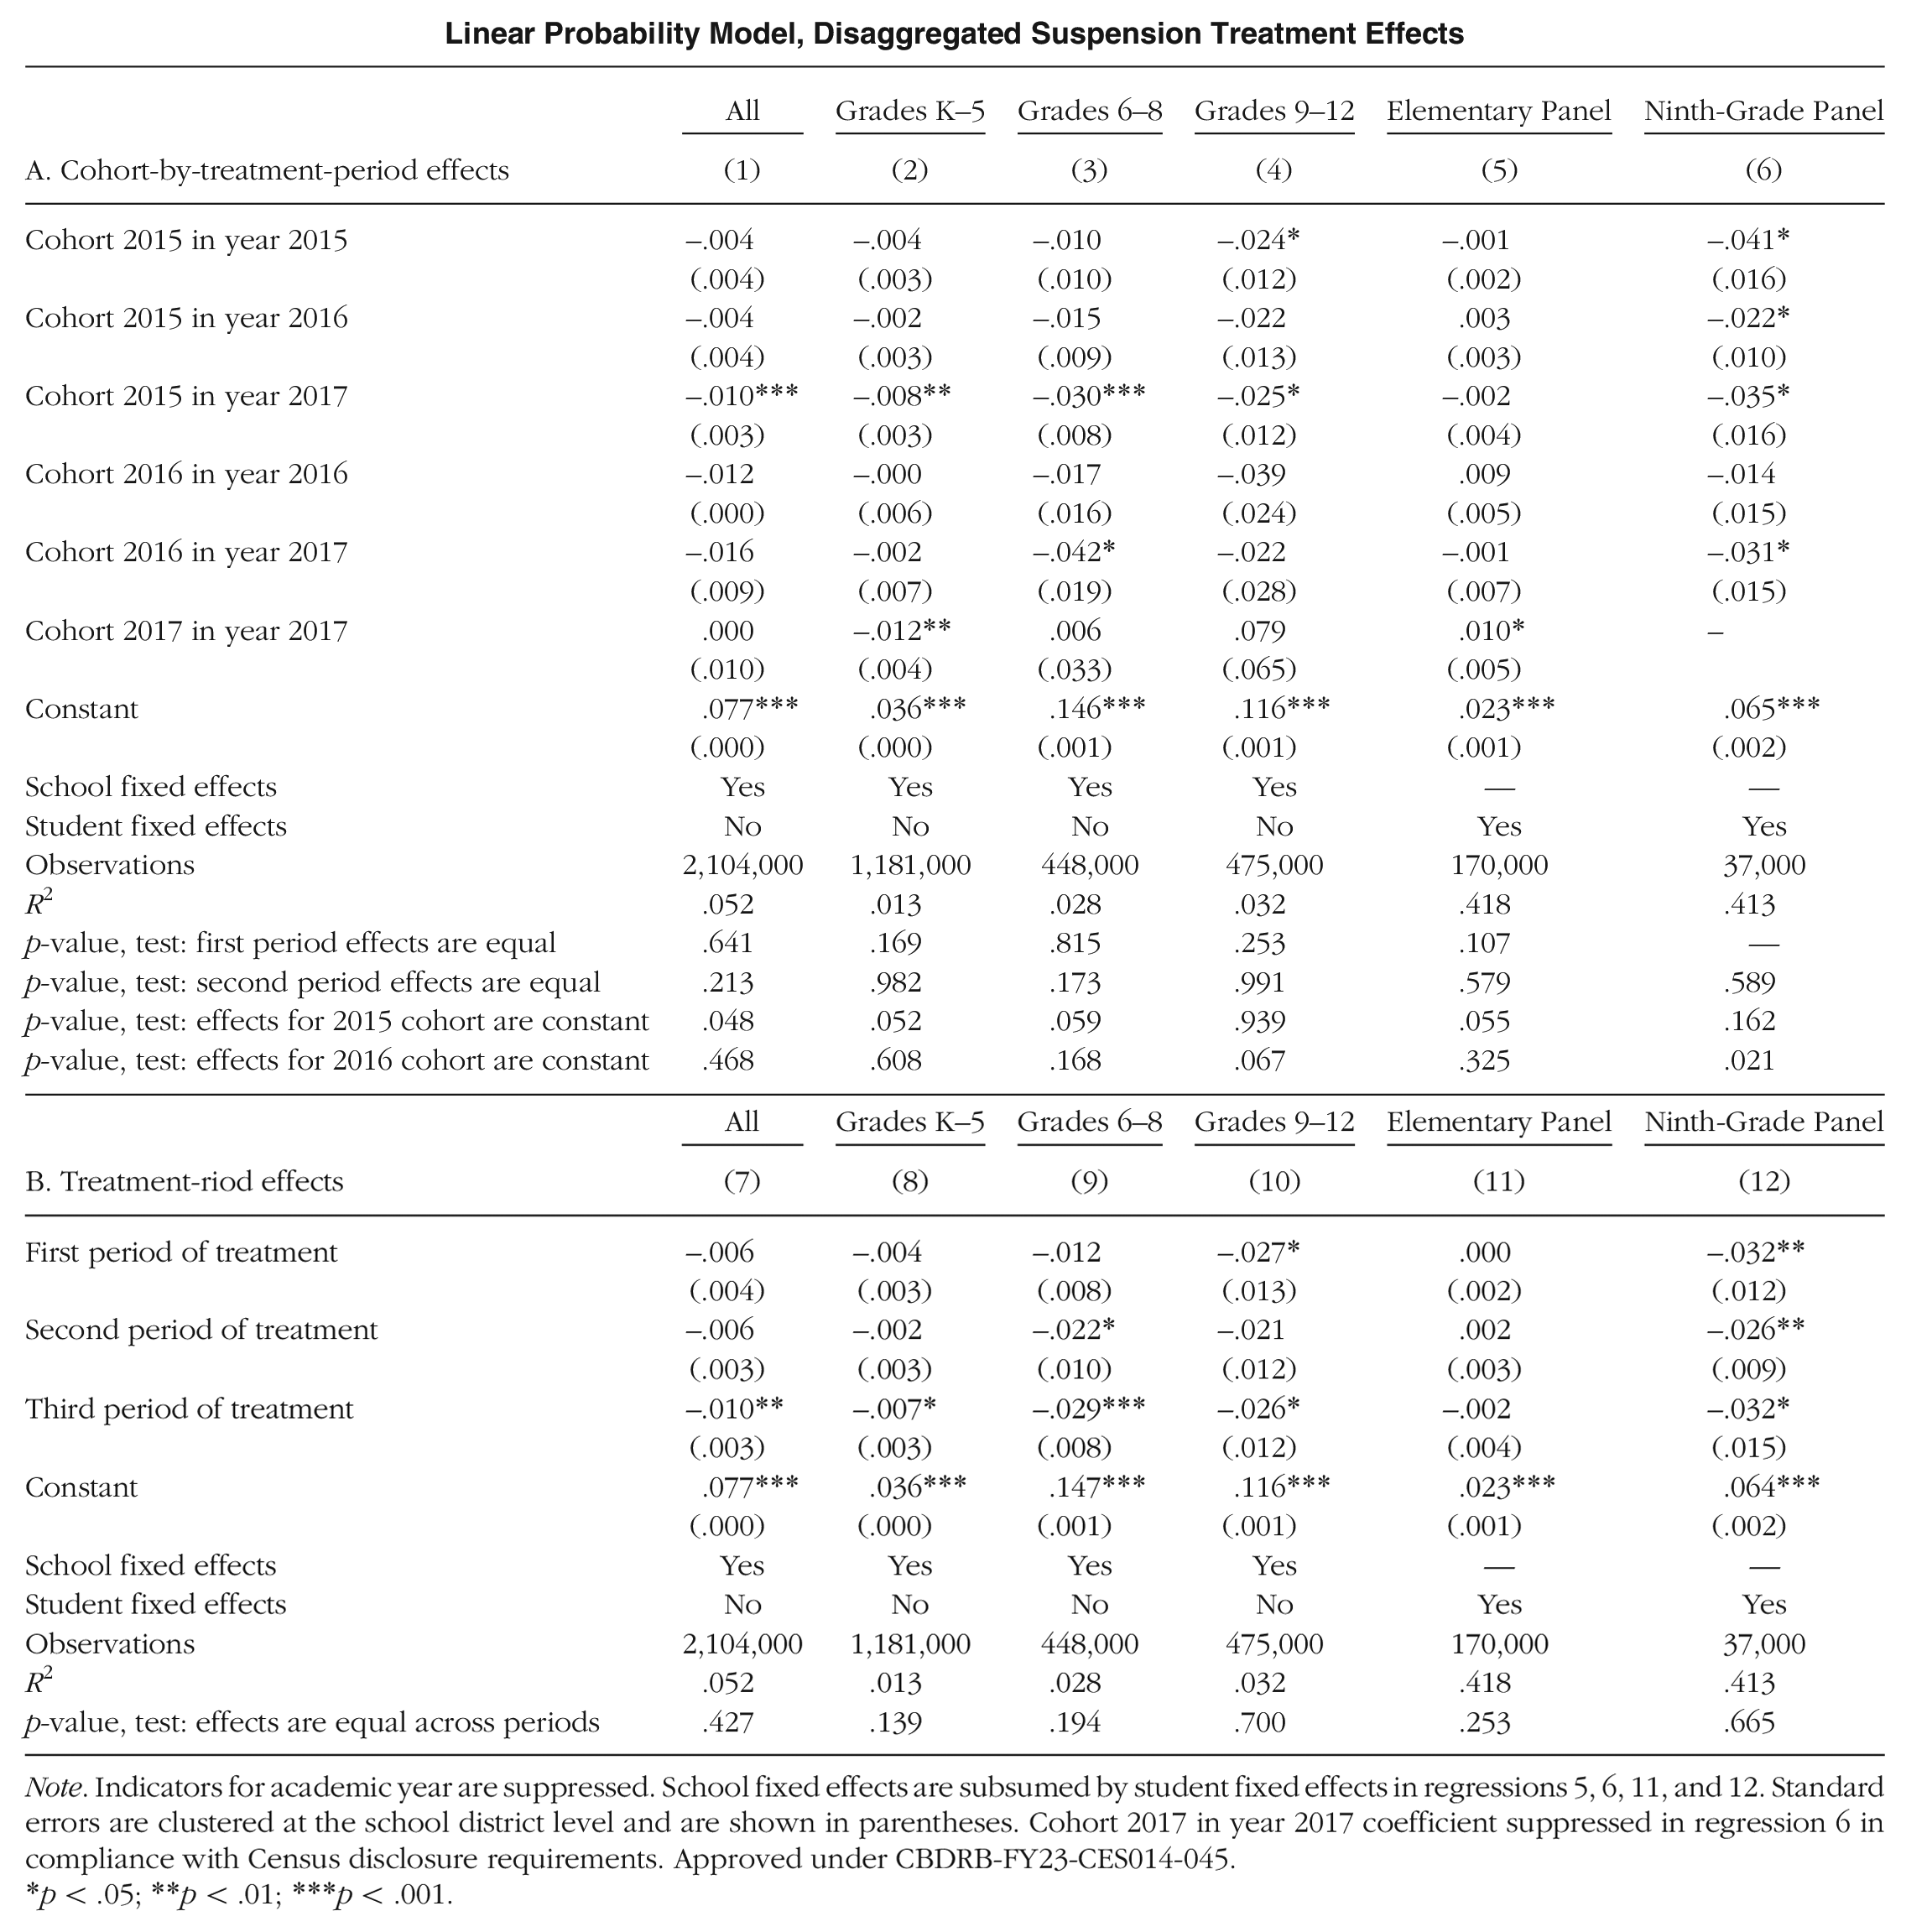
We next present the results of DiD models that assess the average effects of CEP implementation and estimate the extent to which these effects are sustained or grow in the years after treatment. Table 4 summarizes two sets of effects for the full sample: those from the three-period model, which allows treatment effects to vary across treatment period, and those from the Model (1), which assumes a common treatment effect across cohorts for each period of treatment. Appendix D reports the more detailed cohort-by-period results, as well as the three-period results for all subsamples.
Linear Probability Model, Treatment Effects on Probability Of Suspension
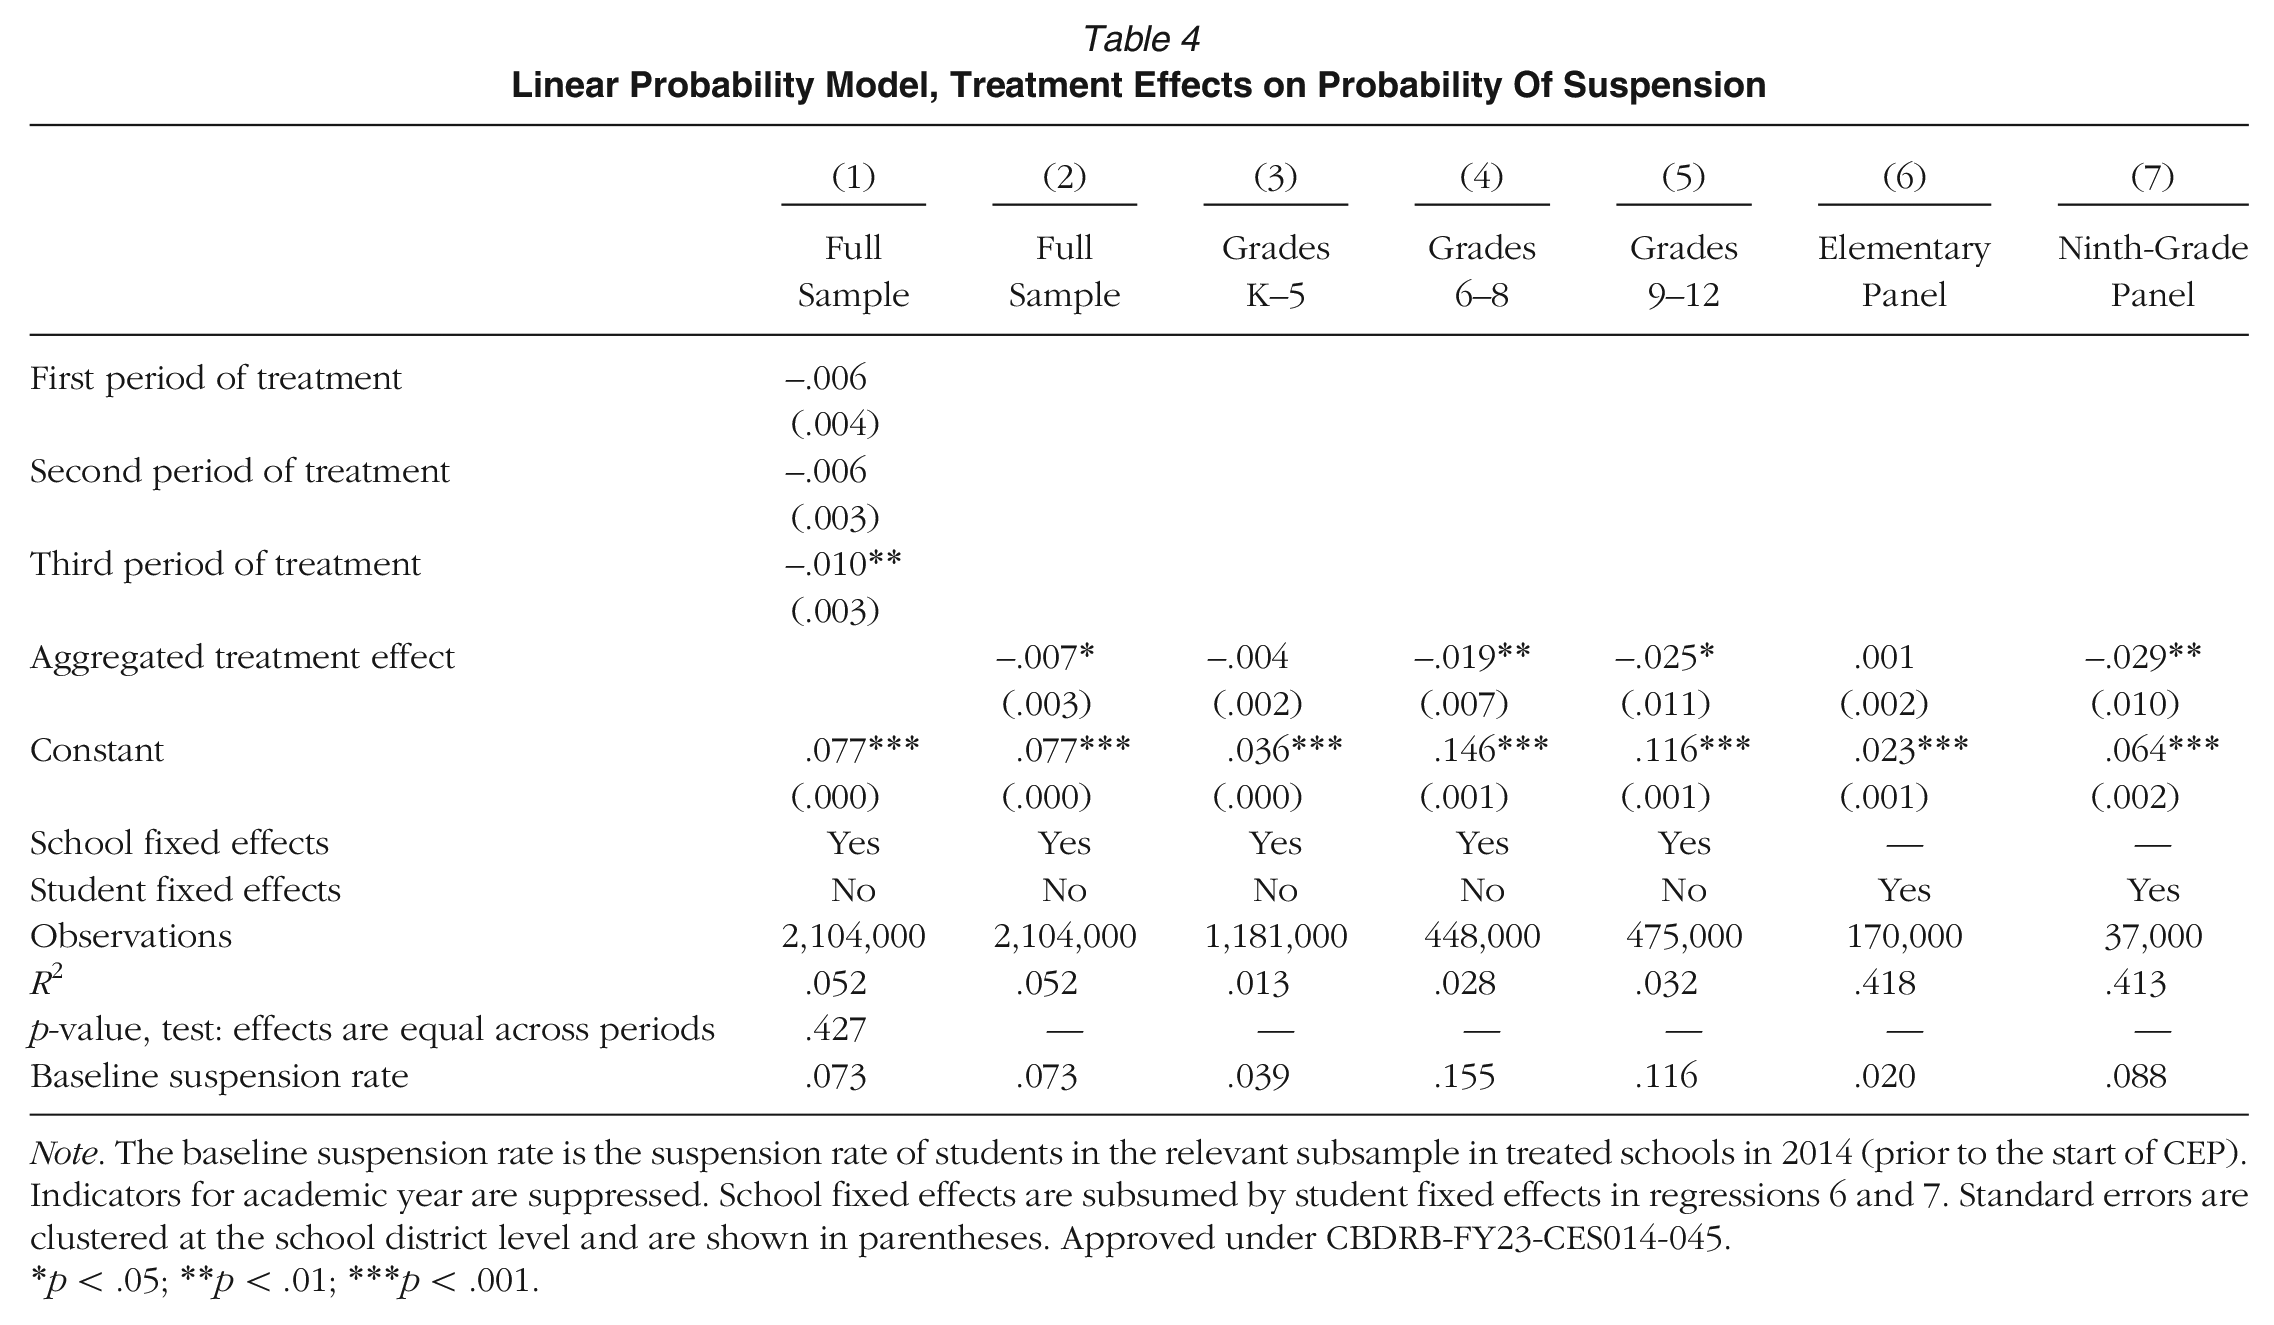
Note. The baseline suspension rate is the suspension rate of students in the relevant subsample in treated schools in 2014 (prior to the start of CEP). Indicators for academic year are suppressed. School fixed effects are subsumed by student fixed effects in regressions 6 and 7. Standard errors are clustered at the school district level and are shown in parentheses. Approved under CBDRB-FY23-CES014-045.
p < .05; **p < .01; ***p < .001.
In the period-specific model, only the third treatment period yields a statistically significant negative effect for the full sample. This negative coefficient suggests that in its 3rd year of implementation, CEP reduced suspension probabilities by approximately 1 percentage point (from a baseline of approximately 7.3%). The coefficients for the first two treatment periods are negative, but not quite statistically significant. However, we cannot reject the null hypothesis that treatment effects are the same in each period (as reflected in the p-value at the bottom of three-period model results in column 1). In Appendix D, we replicate this finding for grade-level specific subsamples. The constant treatment effect hypothesis is particularly compelling in Grades 9 through 12, which experience the largest overall treatment effects from CEP. Based on this finding, we report single CEP treatment effects, as described in Model (1) in all subsequent analyses. Column 2 of Table 4 reports this single treatment effects estimate for the full sample, which indicates that the average effect of CEP implementation is a 0.7 percentage point reduction in student suspension probabilities.
The analyses reported in columns 3, 4, and 5 of Table 4 consider CEP's disciplinary effects separately for students in elementary, middle, and high school grades. We find no significant effect of CEP implementation on suspension in the elementary school grades but substantial and statistically significant protective effects on suspension in middle and high school grades. We find that CEP implementation reduces the probability of suspension for students in middle school grades by nearly 2 percentage points (a 12% reduction from the pre-CEP mean). For students in high school grades, CEP implementation reduces the probability of suspension by nearly 2.5 percentage points (a 22% reduction from the pre-CEP mean).
Although the student fixed effect models are estimated on sharply reduced sample of students who remain in the data and in the same school from 2014 through 2017, the results of these models, reported in columns 6 and 7 of Table 4, are largely consistent with our primary school fixed effect model findings. We find no evidence of a CEP effect on suspension in the elementary student fixed effect model, in which students were generally first exposed to CEP in Grades 1 through 3. However, the 9th-grade student fixed effect model, in which most students experienced CEP starting in 10th grade, indicates that CEP implementation reduces student suspension probabilities by nearly 3 percentage points. This is a very large effect given this selected sample has a lower baseline suspension rate than students in Grades 9 through 12 generally. Not only is the prevalence of suspension much higher in higher grades, but we suspect the experience of stigma is also more pervasive in higher grades.
In summary, consistent with our first hypothesis, we find that CEP implementation reduces suspensions in participating schools, though effects in elementary schools are not statistically significant.
Evidence of Effect Heterogeneity
Our second and third hypotheses suggest that reductions in suspensions following the introduction of universal free lunch should be concentrated among students most likely to experience lunch-related stigma: low-income students and students of color. A unique contribution of our article comes in our ability to test these hypotheses by analyzing heterogeneity in CEP treatment effects across socioeconomic and racial subgroups. To do so, we estimate Model (3) using linear probability models with school or student fixed effects, and then report linear predictions of subgroup-specific treatment effects in Table 5. These estimates can be interpreted as the treatment effect on suspension of CEP for students in participating schools depending on their subgroup membership.
Linear Predictions, Heterogeneous Treatment Effects
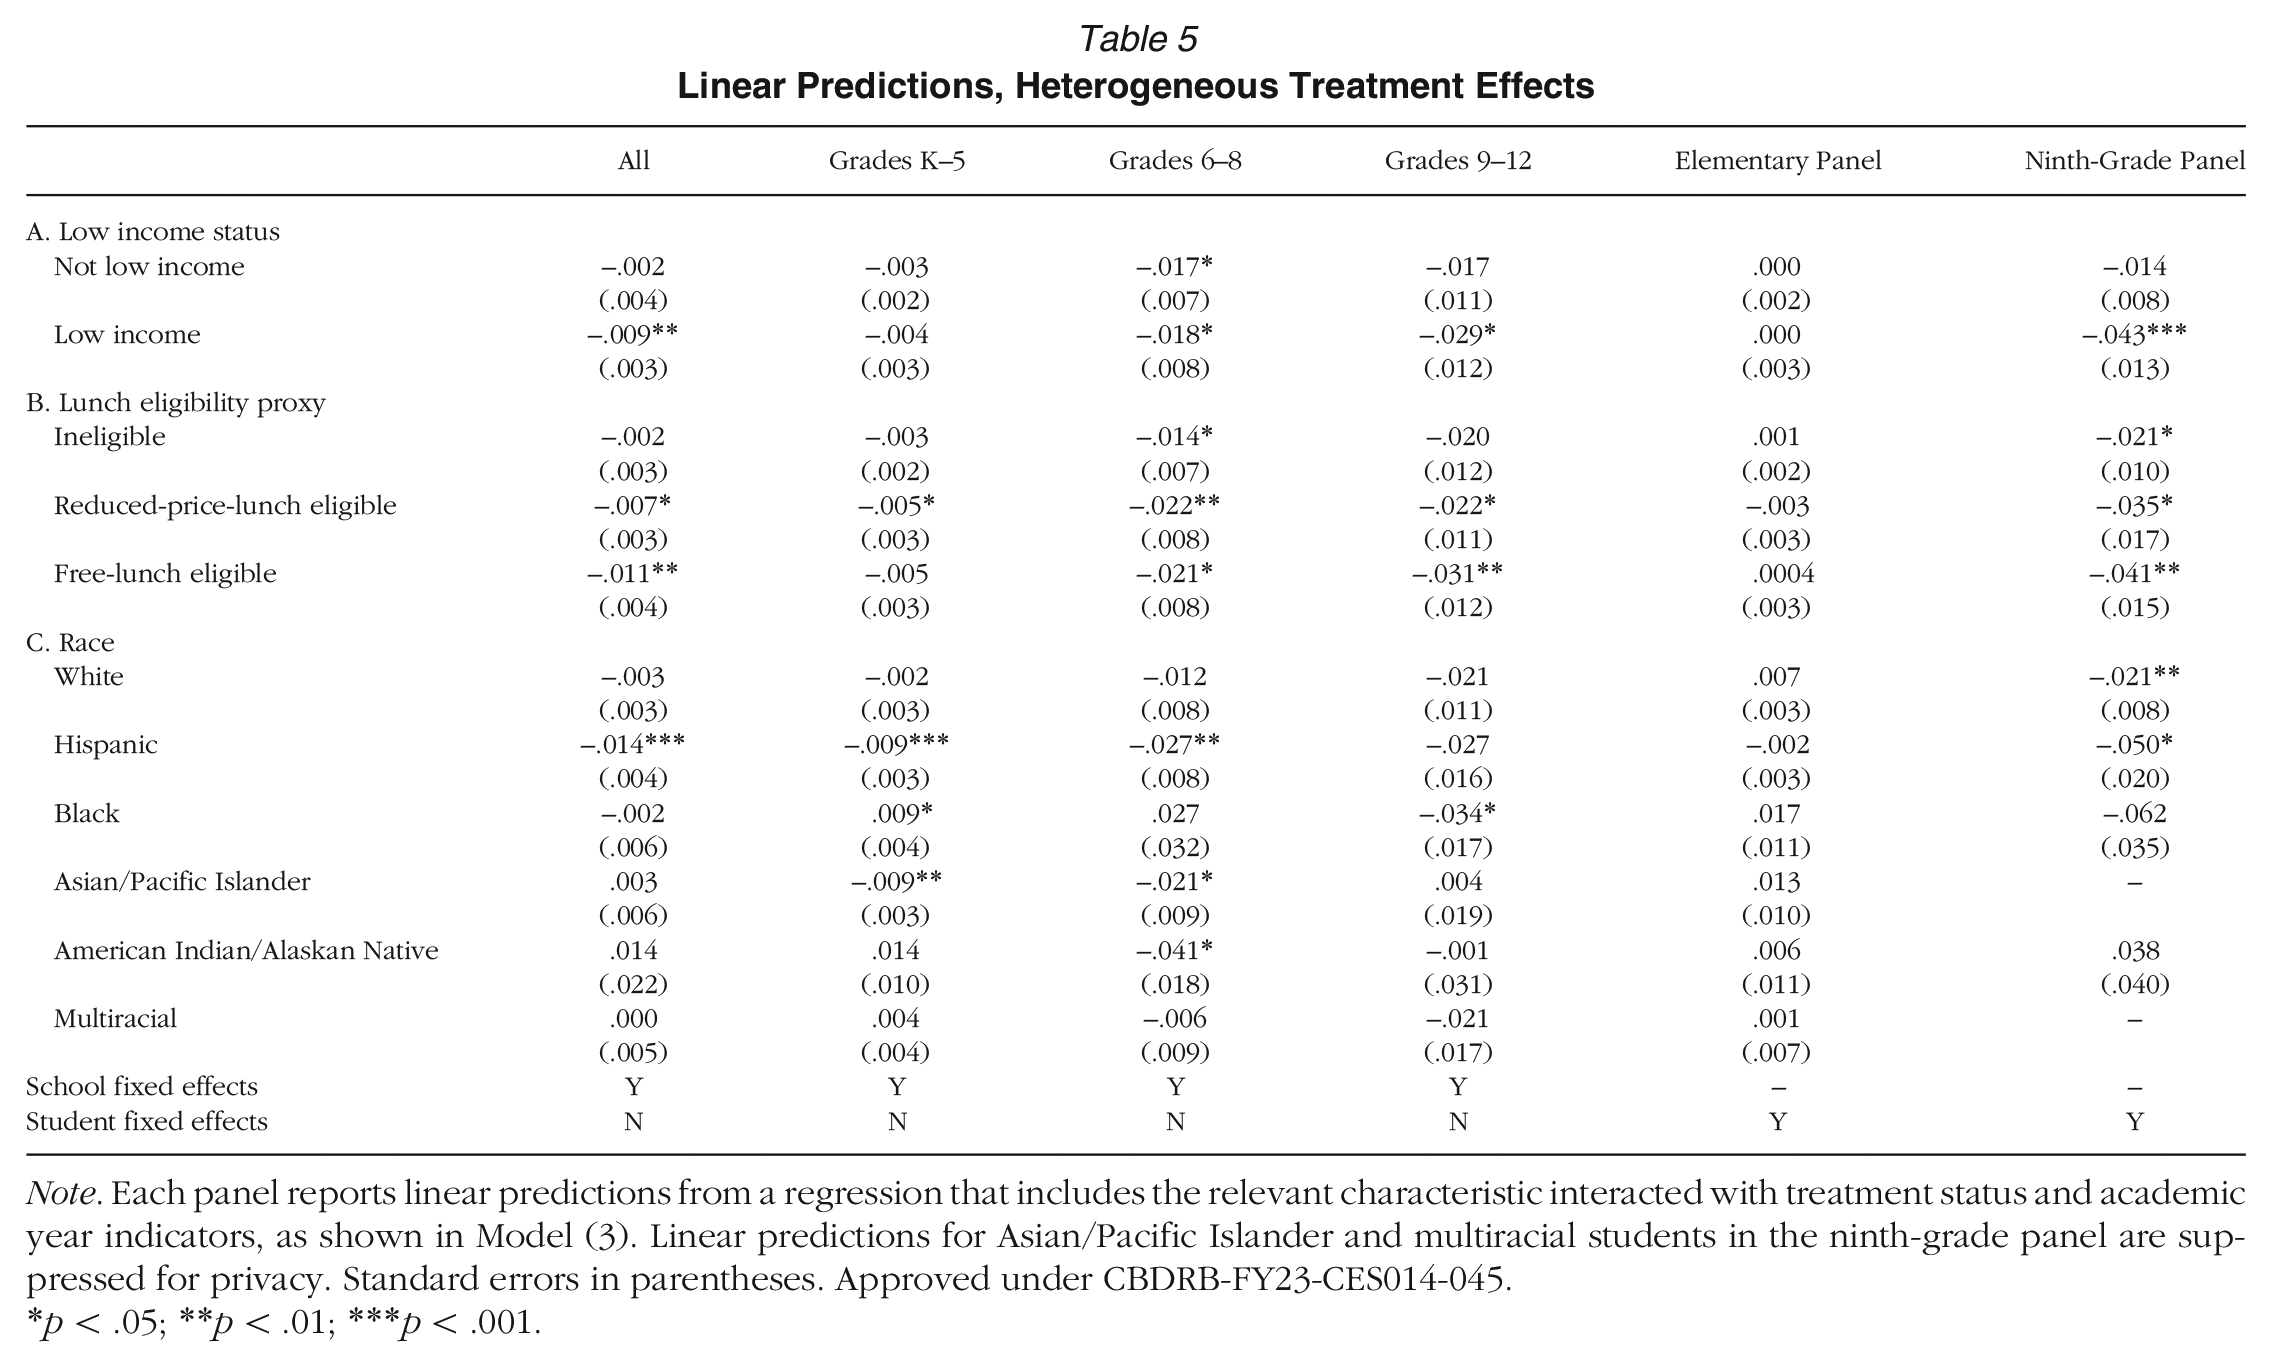
Note. Each panel reports linear predictions from a regression that includes the relevant characteristic interacted with treatment status and academic year indicators, as shown in Model (3). Linear predictions for Asian/Pacific Islander and multiracial students in the ninth-grade panel are suppressed for privacy. Standard errors in parentheses. Approved under CBDRB-FY23-CES014-045.
p < .05; **p < .01; ***p < .001.
The analysis reported in panel A of Table 5 focuses on the extent to which the effects of CEP vary with student economic background. We find that low-income students 12 experience large and statistically significant treatment effects. The provision of universal school meals under CEP reduces suspension probabilities for low-income students by nearly a percentage point. This percentage point difference appears for high school students, too, while middle school students are unique in having a similarly sized and statistically significant effect for both low-income and not-low-income students.
In panel B, we contrast three levels of income, corresponding approximately to reduced-price and free lunch eligibility cut-offs. We find free lunch–eligible students experience the largest effects overall and in high school, but reduced-price lunch–eligible students also experience significant suspension declines. In elementary and middle school, there is no distinction between reduced-price and free lunch groupings.
In panel C, we consider the extent to which the effects of CEP vary with student race and ethnicity. These estimates show that Hispanic students experience considerably larger treatment effects than students in all other racial/ethnic groups. These models suggest that CEP implementation reduces Hispanic students’ suspension probabilities by 1.4 percentage points across the entire sample and by nearly 3 percentage points for students in middle school grades, with a similar effect size in high school that is not quite statistically significant. While the effect estimates for White students in these models are also negative, they are much smaller than the estimated effects for Hispanic students and are not statistically significant. Effects for other racial subgroups are ambiguous—likely due to their small representation in Oregon public schools. Black students show statistically significant drops in suspension probabilities similar to Hispanic students in elementary and high school, though the adverse and imprecise effect in middle school is difficult to rationalize.
In Table 6, we report results comparing effects for students enrolled in FRL in 2014 (prior to CEP introduction) to those not enrolled. These results are only available for the student fixed effect model. While we acknowledge that this model is based on a distinctive and nonrepresentative sample, we note that the findings are consistent with the idea that CEP reduces suspensions by mitigating the stigma associated with free or reduced-price school meals. Students previously enrolled in FRL experience a large drop in suspension probability in the ninth-grade panel, while the effect for those not enrolled is a precise zero. When we interact FRL enrollment with low-income status in panel C, we see that FRL-enrolled students experience large negative effects even when they are not low-income, 13 while low-income students not enrolled in FRL experience smaller (and not statistically significant) effects. The biggest effect of CEP is on those who previously received FRL, consistent with the stigma-reduction pathway. If CEP reduced suspension by improving nutrition, we would expect benefits to accrue to low-income students not previously receiving lunch supports.
Linear Predictions, Heterogeneous Treatment Effects Based on 2014 Free or Reduced-Price Lunch Enrollment
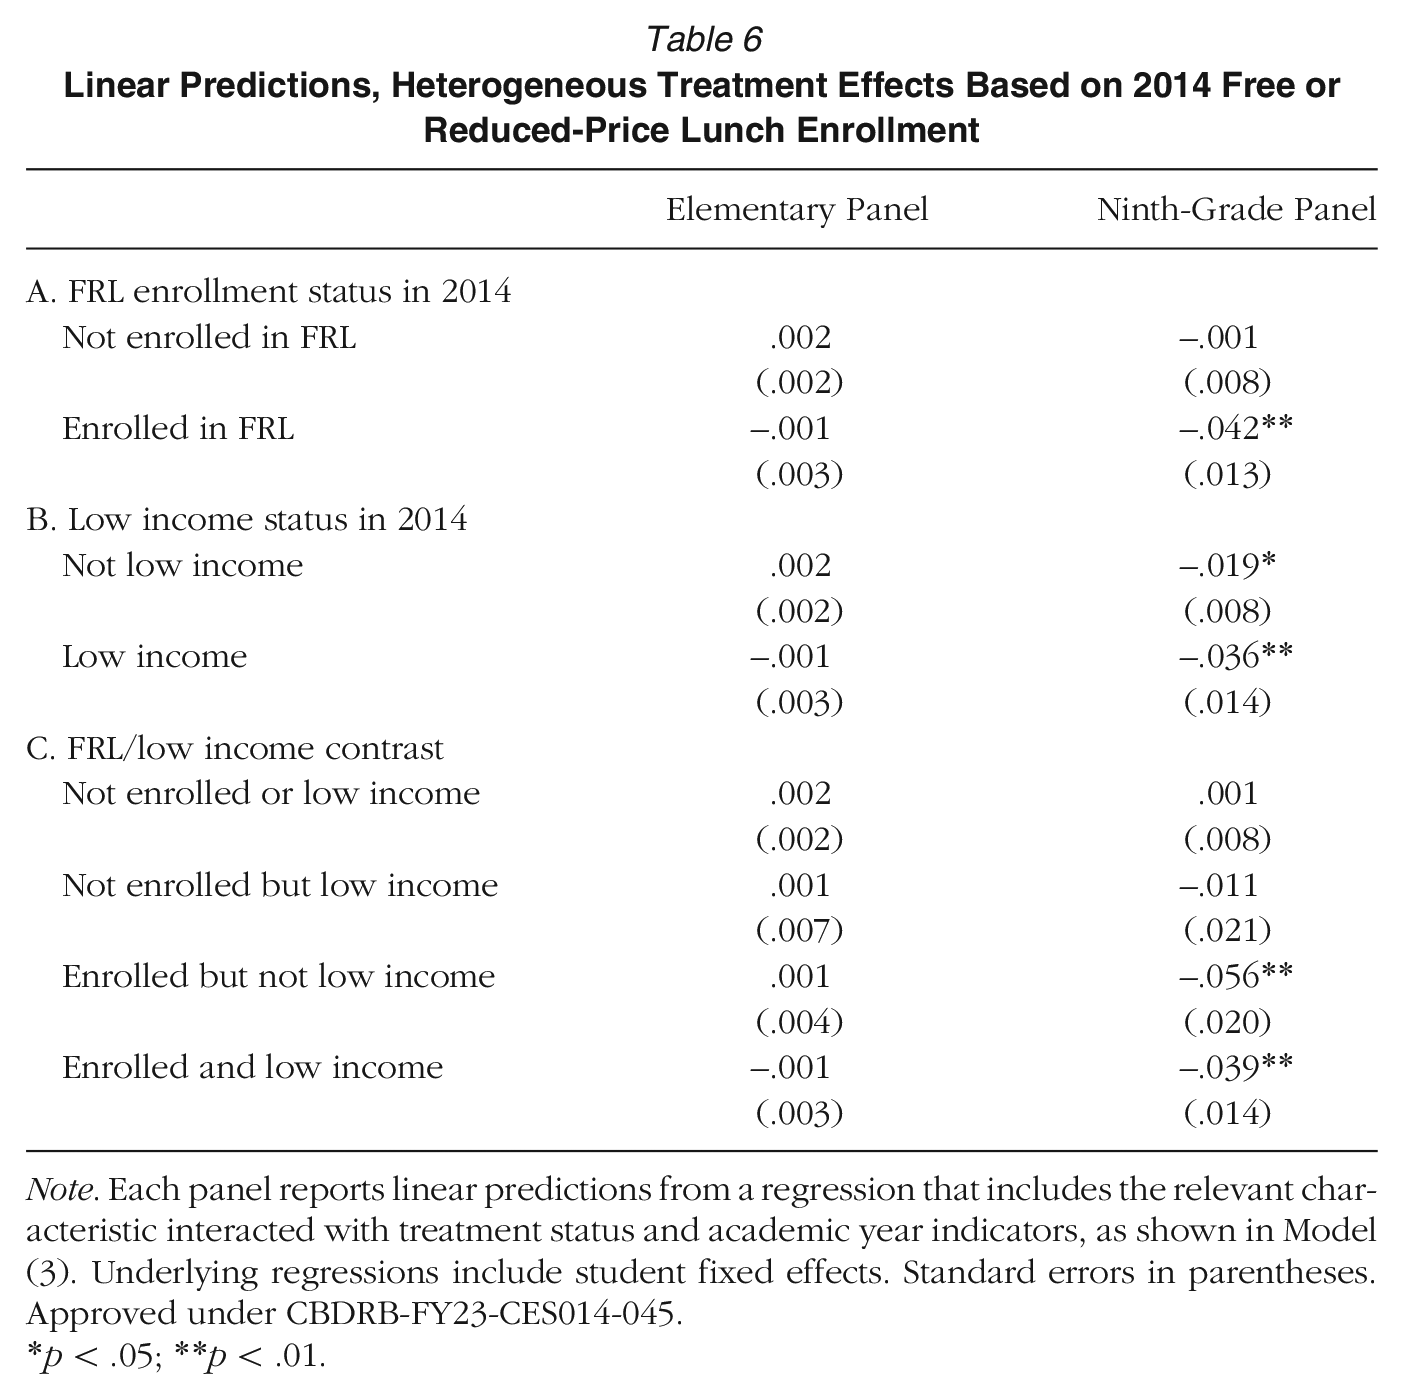
Note. Each panel reports linear predictions from a regression that includes the relevant characteristic interacted with treatment status and academic year indicators, as shown in Model (3). Underlying regressions include student fixed effects. Standard errors in parentheses. Approved under CBDRB-FY23-CES014-045.
p < .05; **p < .01.
Discussion
In this article, we investigate how CEP, a federal program that allows schools to provide free meals to all students regardless of their family's socioeconomic background, affects participating schools’ disciplinary climate. Drawing upon prior research about school meals, the operation of social class in schools, and the links between stigma and exclusionary school discipline, we hypothesize that CEP implementation (a) reduces the incidence of suspensions in participating schools, (b) particularly for students from low-income backgrounds who had previously received free or reduced-price meals, and (c) particularly for students from minoritized racial and ethnic groups.
To test these hypotheses, we construct a unique student-by-year-level panel data resource that links more than two million annual records of K–12 students enrolled in Oregon public schools between 2009–2010 and 2016–2017 with rich administrative data records describing their families’ household income and social safety net program participation. We use these data to estimate the effects of attending a school that has implemented CEP. Our models use a DiD design, in which we compare changes in student suspension probabilities in schools that implemented CEP versus those that were eligible to participate in the universal meals program but chose not to.
This estimation strategy hinges on the identifying assumption that, in the absence of CEP implementation, suspension rates in CEP-participating schools would have followed parallel trends to suspension rates in schools that did not participate in CEP. While suspension rates fell rapidly across Oregon during the years leading up to CEP's launch, we find no evidence to suggest that the pace of change diverged between schools that implemented CEP and those that did not in the pretreatment period.
Consistent with our first hypothesis, we find that suspension probabilities diverge between students enrolled in schools that implement CEP and students in eligible schools that choose not to implement the program. This finding indicates that CEP implementation has a measurable protective effect on suspension rates in participating schools. The CEP effects that we identify are somewhat smaller than the protective effect associated with rigorously evaluated large-scale restorative justice implementation efforts (Augustine et al., 2018; Davison et al., 2022). However, we do not see CEP as an alternative to these more targeted programs. Rather, we suspect that universal meal provision—a policy designed to improve student nutrition and reduce administrative burden—can contribute to a broader effort to reform school disciplinary climates by reducing the stigma experienced by economically disadvantaged students.
Consistent with our second hypothesis, we find that CEP implementation has particularly pronounced protective effects on suspensions for students from low-income families, defined as students whose families either participated in SNAP or reported total household income less than 1.85 times poverty in IRS tax filings. These findings suggest that universal meal provision can help narrow persistent educational opportunity gaps associated with family economic disadvantage.
But it is important to note that even in schools with means-tested school meals, many students from low-income families do not enroll for free or reduced-price meals, and many students from relatively high-income families do enroll for free or reduced-price meals. Further analyses that disaggregate the effects of CEP on students who had enrolled in FRL programs in 2013–2014, the year prior to the program's availability in Oregon, indicate that the program's protective effects are concentrated among students who had previously received free or reduced-price meals, regardless of their family's household income.
We further find that CEP has more pronounced protective effects for Hispanic students than White students, consistent with our third hypothesis. In summarizing these findings, we note that we are unable to estimate the effect of CEP implementation on Black students with precision. This is a major limitation, since anti-Black racism is a large and deeply embedded source of inequality, and substantial attention has been dedicated to narrowing persistent Black/White disciplinary disparities. Our findings cannot speak convincingly to whether or not CEP implementation can contribute to this effort. Future research should investigate whether these effects hold in settings with larger Black student populations.
Viewing universal meal provision as an intervention that mitigates a source of stigma in the school helps to explain how the policy's effects reach beyond student nutrition to promote equity at scale in the disciplinary arena. Traditional school meal programs create categories based on students’ reported family income and then enact those categories daily as students claim their meals (Best, 2017; Domina et al., 2018; Weaver-Hightower, 2011). But these categories are malleable. Universalizing school meals via CEP reduces the distinction between students who receive free or reduced-price meals and other students by collapsing all students into the free meal category. Our analyses indicate that the effects of this adjustment in educational categories ripple through school cultures to the particular benefit of groups of students who we might expect to be particularly at risk for socioeconomic stigma.
Of course, CEP does not just manipulate the social categories that operate in schools; it also makes it easier for all students to eat school meals. Since previous research indicates that lunch stigma is a primary deterrent to school meal consumption—for students who qualify for free meals as well as for students who would have to pay for school meals—CEP’s nutritional effects are fundamentally intertwined with its stigma-reducing effects. We find it notable that our analyses indicate that the program's effects are most pronounced for students who were already eligible to receive nutritional supports via traditional means-tested meals programs. Indeed, we believe that CEP effects on students who had previously enrolled in FRL despite coming from nonpoor families provide the clearest indication in our analyses of the link between meal stigma and school discipline, since we suspect that the nutritional and bureaucratic benefits of universal meal provision may be relatively muted for these relatively advantaged students. We acknowledge, however, that our analyses cannot conclusively separate stigma and nutrition as mechanisms for program effects. We see the examination of these two highly linked program pathways as a particularly promising avenue for future research.
Similarly, our data do not allow us to distinguish CEP's effect on student behavior from its effects on teacher responses to student behavior. After all, both administrative burden and stigma reduction channels apply to teachers. CEP could change teachers’ perceptions of students and their behavior, or it could simply free up staff time to monitor behavior in the lunch room. This is another important consideration for future work.
As more schools adopt CEP and concerns about food insecurity mount, political pressure to extend the program and offer free meals to all students is growing. In the spring of 2020, the USDA enacted a temporary waiver that allowed schools to provide free meals to all children, regardless of income eligibility, in order to support students and families during the COVID-19 pandemic. In the pandemic's wake, policymakers at the state and federal level are considering a wide range of policies to further expand access to free school meals. Our findings cannot speak directly to the potential effects of these policies, since CEP's design only allows us to estimate the effects of universal meal provision in schools with relatively high concentrations of poor students. We further note that CEP rolled out in Oregon amidst a broader effort to reform school disciplinary practices. It is possible that CEP implementation interacted with these disciplinary reform efforts in ways that we cannot model empirically.
Despite these limitations, we believe our findings highlight the potential to create more equitable schools by reducing the salience of labels that evoke stigma.
Footnotes
Appendix A
Appendix B
Appendix C
Suspension Rate Pretrends Analysis, Linear Probability Model Coefficients for Academic Year Indicators Interacted With CEP Implementation Cohort
| Panel A: Grades K–5 | Panel B: Grades 6–8 | Panel C: Grades 9–12 | ||||||||||||
|---|---|---|---|---|---|---|---|---|---|---|---|---|---|---|
| Academic Year | No Interaction | 2015 Cohort × Year Indicator | 2016 Cohort × Year Indicator | 2017 Cohort × Year Indicator | Academic Year | No Interaction | 2015 Cohort × Year Indicator | 2016 Cohort × Year Indicator | 2017 Cohort × Year Indicator | Academic Year | No Interaction | 2015 Cohort × Year Indicator | 2016 Cohort × Year Indicator | 2017 Cohort × Year Indicator |
| 2010 | .01*** | .00 | .01 | −.01 | 2010 | .03*** | .01 | .02 | −.01 | 2010 | .03*** | .01 | .10 | — |
| (.00) | (.00) | (.00) | (.01) | (.01) | (.01) | (.02) | (.04) | (.01) | (.02) | (.06) | ||||
| 2011 | .01*** | .00 | .01* | −.01 | 2011 | .02*** | .01 | .02 | −.01 | 2011 | .04*** | .01 | .06 | — |
| (.00) | (.00) | (.01) | (.01) | (.01) | (.01) | (.02) | (.03) | (.01) | (.02) | (.04) | ||||
| 2012 | .01*** | .00 | −.00 | −.01 | 2012 | .02*** | .01 | .01 | .01 | 2012 | .02** | .01 | .02 | — |
| (.00) | (.00) | (.00) | (.01) | (.01) | (.01) | (.01) | (.06) | (.01) | (.03) | (.01) | ||||
| 2013 | .00 | −.00 | .00 | −.01*** | 2013 | .01 | .00 | .02 | .04 | 2013 | .01 | .01 | −.00 | — |
| (.00) | (.00) | (.00) | (.00) | (.00) | (.01) | (.01) | (.03) | (.01) | (.02) | (.01) | ||||
| 2014 (reference) | — | — | — | — | 2014 (reference) | — | — | — | — | 2014 (reference) | — | — | — | — |
| 2015 | .00 | −.00 | −.00 | −.01 | 2015 | −.02*** | −.00 | .02 | −.02 | 2015 | .00 | −.02 | .00 | — |
| (.00) | (.00) | (.01) | (.01) | (.01) | (.01) | (.01) | (.01) | (.01) | (.01) | (.01) | ||||
| 2016 | −.00 | −.00 | −.00 | −.01*** | 2016 | −.01 | −.01 | −.00 | −.03 | 2016 | −.00 | −.02 | −.01 | — |
| (.00) | (.00) | (.01) | (.00) | (.01) | (.01) | (.02) | (.02) | (.01) | (.01) | (.01) | ||||
| 2017 | .00 | −.01 | −.01 | −.02*** | 2017 | .00 | −.02* | −.03 | .00 | 2017 | −.00 | −.02 | .01 | — |
| (.00) | (.00) | (.01) | (.00) | (.01) | (.01) | (.02) | (.03) | (.01) | (.01) | (.02) | ||||
| Constant | .03*** | Constant | .14*** | Constant | .10*** | |||||||||
| (.00) | (.00) | (.00) | ||||||||||||
| School FEs | Yes | School FEs | Yes | |||||||||||
| Covariates | No | Covariates | No | |||||||||||
| Observations | 1181000 | Observations | 448000 | |||||||||||
| R 2 | .0132 | r2 | .0279 | |||||||||||
Note. Each panel in this table displays the full set of coefficients from a single regression. The “No Interaction” column displays coefficients on academic year indicators; the “2015 cohort × year indicator” column displays coefficients on an indicator for membership in the 2015 CEP cohort interacted with academic year indicators. The reference (omitted) year is 2014. Cohort indicators are subsumed by school fixed effects (FE). Standard errors in parentheses. 2017 cohort indicators are suppressed in panel C in compliance with Census disclosure requirements. Approved under CBDRB-FY23-CES014-045.
p < .05; **p < .01; ***p < .001.
Appendix D
Linear Probability Model, Disaggregated Suspension Treatment Effects
| All | Grades K–5 | Grades 6–8 | Grades 9–12 | Elementary Panel | Ninth-Grade Panel | |
|---|---|---|---|---|---|---|
| A. Cohort-by-treatment-period effects | (1) | (2) | (3) | (4) | (5) | (6) |
| Cohort 2015 in year 2015 | −.004 | −.004 | −.010 | −.024* | −.001 | −.041* |
| (.004) | (.003) | (.010) | (.012) | (.002) | (.016) | |
| Cohort 2015 in year 2016 | −.004 | −.002 | −.015 | −.022 | .003 | −.022* |
| (.004) | (.003) | (.009) | (.013) | (.003) | (.010) | |
| Cohort 2015 in year 2017 | −.010*** | −.008** | −.030*** | −.025* | −.002 | −.035* |
| (.003) | (.003) | (.008) | (.012) | (.004) | (.016) | |
| Cohort 2016 in year 2016 | −.012 | −.000 | −.017 | −.039 | .009 | −.014 |
| (.000) | (.006) | (.016) | (.024) | (.005) | (.015) | |
| Cohort 2016 in year 2017 | −.016 | −.002 | −.042* | −.022 | −.001 | −.031* |
| (.009) | (.007) | (.019) | (.028) | (.007) | (.015) | |
| Cohort 2017 in year 2017 | .000 | −.012** | .006 | .079 | .010* | − |
| (.010) | (.004) | (.033) | (.065) | (.005) | ||
| Constant | .077*** | .036*** | .146*** | .116*** | .023*** | .065*** |
| (.000) | (.000) | (.001) | (.001) | (.001) | (.002) | |
| School fixed effects | Yes | Yes | Yes | Yes | — | — |
| Student fixed effects | No | No | No | No | Yes | Yes |
| Observations | 2,104,000 | 1,181,000 | 448,000 | 475,000 | 170,000 | 37,000 |
| R 2 | .052 | .013 | .028 | .032 | .418 | .413 |
| p-value, test: first period effects are equal | .641 | .169 | .815 | .253 | .107 | — |
| p-value, test: second period effects are equal | .213 | .982 | .173 | .991 | .579 | .589 |
| p-value, test: effects for 2015 cohort are constant | .048 | .052 | .059 | .939 | .055 | .162 |
| p-value, test: effects for 2016 cohort are constant | .468 | .608 | .168 | .067 | .325 | .021 |
| All | Grades K–5 | Grades 6–8 | Grades 9–12 | Elementary Panel | Ninth-Grade Panel | |
| B. Treatment-riod effects | (1) | (2) | (3) | (4) | (5) | (6) |
| First period of treatment | −.006 | −.004 | −.012 | −.027* | .000 | −.032** |
| (.004) | (.003) | (.008) | (.013) | (.002) | (.012) | |
| Second period of treatment | −.006 | −.002 | −.022* | −.021 | .002 | −.026** |
| (.003) | (.003) | (.010) | (.012) | (.003) | (.009) | |
| Third period of treatment | −.010** | −.007* | −.029*** | −.026* | −.002 | −.032* |
| (.003) | (.003) | (.008) | (.012) | (.004) | (.015) | |
| Constant | .077*** | .036*** | .147*** | .116*** | .023*** | .064*** |
| (.000) | (.000) | (.001) | (.001) | (.001) | (.002) | |
| School fixed effects | Yes | Yes | Yes | Yes | — | — |
| Student fixed effects | No | No | No | No | Yes | Yes |
| Observations | 2,104,000 | 1,181,000 | 448,000 | 475,000 | 170,000 | 37,000 |
| R 2 | .052 | .013 | .028 | .032 | .418 | .413 |
| p-value, test: effects are equal across periods | .427 | .139 | .194 | .700 | .253 | .665 |
Note. Indicators for academic year are suppressed. School fixed effects are subsumed by student fixed effects in regressions 5, 6, 11, and 12. Standard errors are clustered at the school district level and are shown in parentheses. Cohort 2017 in year 2017 coefficient suppressed in regression 6 in compliance with Census disclosure requirements. Approved under CBDRB-FY23-CES014-045.
p < .05; **p < .01; ***p < .001.
Notes
T
L
V
R