
Abstract
School environment plays an important role in student outcomes. Increasingly, research has also highlighted the role school environment plays in the White–Black suspension gap. We test whether magnet schools reduce the White–Black suspension gap using data from Tulsa Public Schools. Using student-level and incident-level data from Tulsa, Oklahoma, we explore whether Black students receive exclusionary discipline at lower rates in magnet schools than in traditional schools compared with White students. Using matching techniques to minimize selection bias, we find that magnet schools in Tulsa are associated with a reduction in the racial suspension gap. In magnet schools in Tulsa, we do not find a racial gap in severity of incident or days assigned.
Keywords
Research has consistently shown that there are disproportionate rates of suspensions across racial and ethnic groups (Krezmien et al., 2006). In particular, studies have demonstrated a gap of approximately 3 to 1 or 4 to 1 in the Black–White school suspension rate (U.S. Department of Education Office for Civil Rights, 2016). Racial differences in school suspensions tend to result in racial differences in educational achievement (E. W. Morris & Perry, 2016), and students in schools with higher suspension rates are more likely to have poorer educational outcomes and to be arrested and incarcerated later in life (Bacher-Hicks et al., 2019; J. Rosenbaum, 2020).
While the racial gap in discipline is well known, there are aspects that remain less understood due to limited data. For example, Gopalan and Nelson (2019) note that many data sets aggregate data to the state or national level, do not include extensive covariates, or only focus on students who received disciplinary actions. Few studies contain information at all three levels: infraction, student, and school. Welsh and Little (2018) find that the causes of the gap are many and complicated, so rich data at all levels are needed. This article uses a unique data set that includes detailed administrative data about the students and schools attended and detailed suspension records that include timing, nature of the offense, and the punishment received. We have paired this individual data with school level data to better understand how individual characteristics and the school environment predict suspension rates.
We find that Black students enrolled in magnet schools are suspended at similar rates as their White peers, while traditional schools display a more familiar, more worrisome pattern of racial differences in suspensions. We find consistent evidence that magnet schools reduce the racial suspension gap. We do not find a racial gap in severity of incident or days assigned, but we do find that magnet schools are less punitive than traditional schools. This article contributes to the existing research on the suspension gap by focusing on school environment along with individual characteristics in explaining the Black–White suspension gap. In explaining this gap and the corresponding achievement gap, too often do researchers focus on individual-level characteristics and ignore structural determinants that help create and maintain these gaps.
Magnet schools originated from a movement to address structural racism in school assignment by expanding public school choice for families. And while magnet schools have been well researched, the focus is often on school composition and academic achievement, not school discipline. This study focuses on one school district, but national data show similar trends. Data collected from Civil Rights Data Collection (2017) show that on average, suspensions in magnet schools are associated with lower suspension rates than traditional schools for middle school students in 2015 and 2017. When looking at other school choice options, Losen et al. (2016) found that charter schools have had higher suspension rates than noncharter schools. Magnet schools offer a potential window into ways of addressing the suspension gap that move beyond individual characteristics of students.
Relevant Literature
In an analysis of statewide data from Indiana, Gopalan and Nelson (2019) find that the gap in Black-White suspension rates appears as early as pre-K and only widens with each additional year of school. Students who are suspended are more likely to be engaged in the criminal justice system later in life (Fabelo et al., 2011). School suspensions also contribute to the racial disparities in academic achievement (E. W. Morris & Perry, 2016; Pearman et al., 2019). Exclusionary policies keep students out of the classroom and can have lasting, long-term negative impacts on student achievement, school climate, and student engagement (Gregory et al., 2010; Welsh & Little, 2018). In explaining why the racial gap exists in suspension rates, there have been three main areas of focus: differences in behavior, differences in treatment, and differences in school environment (Owens & McLanahan, 2020).
Behavioral differences in students could be a result of differences in exposure to environment, parenting styles, and differences in attending preschool. Several studies have found that once prior behavior, measured by teacher assessments of students, is taken into account, then the racial suspension gap decreases (Bradshaw et al., 2010). However, differences are not eliminated (Rocque, 2010). Relatedly, differences in individual background have been cited as a contributing factor to suspensions, including poverty (Brantlinger, 1991; Wu et al., 1982). Inequality can also result from differences in social capital, such as parents’ ability to advocate for the child (Lareau & Horvat, 1999). Controlling for socioeconomic status reduces the gap, but does not eliminate it (Skiba et al., 2002; Skiba et al., 2011; Wu et al., 1982). Overall, individual differences might contribute to some disparities, but they do not fully explain the gap.
An additional explanation is that Black students are treated differently than other students, a theory supported by the finding that Black students receive harsher punishments for the same incidents as White students. This could be due to racial bias among school officials (Okonofua & Eberhardt, 2015) or how teachers interpret specific behaviors differently based on the race of the student (Okonofua & Eberhardt, 2015). Dee (2005) finds that White teachers describe Black and Hispanic students as disruptive or inattentive at higher rates than teachers of the same racial/ethnic background as the student. The historical perspective of punishment in schools and how it relates to antiblackness is also extremely important; “It is irresponsible for educators to ignore this legacy of discipline for Black people while working to understand disproportionality in school discipline” (Coles & Powell, 2020, p. 116). The long-standing systemic racism in the United States cannot be ignored when trying to understand how teachers apply discipline in schools.
An alternative way to understand the racial differences in discipline is to see if the race of the teacher matters. Lindsay and Hart (2017) find evidence that having a Black teacher is associated with reduced rates of exclusionary discipline for Black students for elementary, middle, and high school grade ranges. A set of studies have found that in schools with a higher concentration of Black teachers, Black students are less likely to receive exclusionary discipline (Dilworth & Coleman, 2014; Grissom et al., 2009; Meier, 1984; Meier & Stewart, 1992).
Differences in treatment by teachers and school officials are likely related to differences in school environment. School-level factors, such as specific policies, practices, and perspectives of teachers and principals, play an important role (Welsh & Little, 2018). Exploiting a change in school attendance zones (which assign schools based on where each student lives) in Charlotte-Mecklenburg schools, Bacher-Hicks et al. (2019) find that students who are assigned to schools with “stricter” discipline policies are more likely to be suspended. Furthermore, students who attended these “stricter” schools were more likely to drop out of school, less likely to attend college, and more likely to have interactions with the criminal justice system as an adult. A key part of this research finds that the “strictness” in school discipline is due to policy choices of the administration and not characteristics of students. Similarly, Craig and Martin (2019) found that middle schools that eliminated suspensions for nonviolent, disorderly behavior saw an improvement in student achievement on standardized tests. They attribute the improvement in test scores to an improvement in school culture. Charter schools, on the other hand, have had higher suspension rates than noncharter schools. In an analysis of data from the 2011–2012 academic year, the charter school suspension rate was 16% higher than noncharter schools nationally (Losen et al., 2016). The Black–White suspension gap was also quite large: 16.4 percentage points at the secondary level.
School composition and school environment are also likely drivers of the gap (Kinsler, 2011; Ramey, 2015; Welch & Payne, 2010). Despite an array of federal and local interventions, schools today remain racially segregated, which causes between-school sorting of students. Schools that have more low-income and minority students are more likely to adopt zero-tolerance policies. These more punitive approaches at the school level contribute to the racial gap in suspensions. Gopalan and Nelson (2019) find that Black students nonrandomly sort into more punitive schools. In addition, they find that cross-school differences in disciplinary practices reduce the race-based discipline gap but do not eliminate it. Zero-tolerance policies contribute to the school-to-prison pipeline by pushing Black and Latino students out of school at higher rates (Curtis, 2013).
Magnet schools offer a unique way to understand the role that environment plays in differential suspension rates. One of the original goals of magnet schools during the 1970s and 1980s was to decrease segregation within a school district and reduce between-school sorting. By encouraging White students to attend schools with majority Black students through specialized course offerings, the goal was to achieve more racial balance across school districts (Frankenberg et al., 2008; Rossell, 2005). Magnet schools disrupt the traditional path of students attending a neighborhood school. Traditional public schools where the enrollment is based on neighborhood attendance zones are still highly segregated today (Kitchens, 2020).
Magnet schools, unlike charter schools, remain part of the school district and are subject to the same requirements as a traditional public school. Magnet schools are often located in large urban school districts but receive less attention than other types of schools (Engberg et al., 2014). During the 2014–2015 school year, 2.6 million students were enrolled in a magnet school, similar in size to the 2.7 million students enrolled in charter schools (Snyder et al., 2018).
Magnet schools have been shown to have many benefits, including improving student outcomes on testing (Bifulco et al., 2009; Gamoran, 1996; Kitchens et al., 2020; Wang et al., 2018), increasing diversity within schools (Betts et al., 2015; Riel et al., 2018), and improving student behavior (Engberg et al., 2014). But magnet schools can offer a different perspective in understanding the racial suspension gap as well: If there is a smaller suspension gap in magnet schools, this could provide more evidence that school environment should be a major focus for reform efforts. Magnet schools often focus on ensuring racially balanced student populations (Goldring & Smrekar, 2000), perhaps reducing the effect that school composition has on the suspension gap. In a study comparing magnet with nonmagnet schools in Cincinnati, J. E. Morris and Goldring (1999) found that nonmagnet schools had higher suspensions rates than magnet schools. In a case study of three schools that were recently turned into magnet schools through a federal program, Ayscue and Siegel-Hawley (2019) found a reduction in school suspensions; a school administrator of one school discussed “the ‘improved climate and culture’ that was evident through ‘increases in attendance rates and a drop in school suspensions’” (p. 18) once it became a magnet school.
Magnet schools are likely to affect the school environment in several ways that could relate to discipline practices. First, they have greater potential to disrupt traditional school patterns based on residential segregation (Esposito, 2010), because they often have a distinctive theme or area of specialization. Second, because of their history, magnet schools can be expected to have higher rates of racial integration. Koedel et al. (2009) find increased exposure to other racial and ethnic groups among Black and White students and increased integration in magnet schools, while Davis (2014) finds that magnet schools are more heterogeneous at the classroom level than traditional schools, but mainly with respect to White/Hispanic racial composition.
Third, school districts sometimes invest more resources in magnet schools. In comparing districts with and without magnet schools, per student expenditures are higher in districts with magnets, on average (Goldring & Smrekar, 2000). Evans (2002) finds that teachers in magnet schools tend to have increased autonomy and classroom control, more professional development, and higher salaries than teachers in traditional schools. These factors, especially classroom autonomy, could make it easier to recruit and retain superior teachers (Ingersoll et al., 2016). Fourth, magnet schools may be more successful in encouraging students to learn and to focus on their schoolwork. Schools with a positive school climate, defined as safe and orderly, have been shown to help insulate students from the negative effects of neighborhood violence (Laurito et al., 2019). The focus of magnet schools is to attract students based on curriculum and programs instead of forcing students to attend desegregated schools. Rossell (1990) finds that this choice model is more successful in producing interracial exposure in the long run than other strategies like mandatory busing.
One obvious concern with focusing on magnet schools is that the selection of students into magnet schools is not random. Students apply to attend magnet schools, at the urging or with the consent of their parents. The expectation is that the more motivated, higher performing students (and their parents) might be more likely to apply to and attend magnet schools. But as Wang et al. (2018) note, secondary magnet schools are more likely to reflect student choice while elementary magnet schools are more likely to reflect parent choice. In addition, magnet schools produce larger effects in secondary school than in elementary school. Because of this, and for other reasons discussed below, we focus on middle school magnets.
Tulsa’s Magnet Schools
Tulsa Public Schools (TPS) is a large, urban school district that is ideal for studying the link between magnet schools and suspensions. At the time of our study, TPS enrolled over 40,000 students who comprise a very diverse student body with respect to race/ethnicity, family income, and home language. TPS magnet schools date back to the 1970s. TPS failed to comply with Brown v. Board of Education (1954) or the Civil Rights Act of 1964 and a federal district court judge ordered in 1972 that segregated schools be shut down (Ferrell, 2008). George Washington Carver Middle School and Booker T. Washington High School were then opened as magnets with the direct goal of improving integration within the school district (McDonald, 2015). Four additional middle school magnets, two additional high school magnets, and four elementary school magnets have since opened in TPS.
TPS has magnet elementary, middle, and high schools. Four of the 52 elementary schools are magnets, five of the 14 middle schools are magnets, and three of the 10 high schools are magnets. Two of the magnet schools are housed within a standard high school. We do not focus on elementary magnet schools because we do not have discipline data from elementary schools, and magnet elementary schools make up a small percentage of total elementary schools.
TPS has two types of magnet schools: admission and lottery. The admission magnet, which is also referred to as an academic magnet, requires that students apply and are selected on the basis of grades, test scores, attendance, and teacher recommendations. In addition, TPS is divided into four geographic quadrants. Each quadrant is allowed a certain number of students into admission magnets. Because Tulsa is still highly segregated, the racial composition of academic magnet schools is more reflective of the population. For lottery magnets, students apply and are selected based on a random drawing. For standard middle and high schools, students attend based on their geographic proximity to the school. Descriptively, there is a strong relationship between magnet school status and school quality in TPS based on report cards issued by the Oklahoma Department of Education. Of the five middle school magnets, one received an A, one received a B, and one received a C. Two magnets received an F and all traditional schools received an F. These scores are based on student test scores. Table A.1 in Appendix A lists the schools, magnet status, and grade.
Table 1 illustrates the differences between magnet schools and traditional schools. 1 In terms of demographics, the percentage of students who identify as Black or White is roughly similar between magnet schools and traditional schools. Magnet schools are approximately 28% Black and 32% White, while traditional schools are 36% Black and 20% White. Although the percentage of White students enrolled is somewhat higher and the percentage of Black students enrolled is somewhat lower at magnet schools than at traditional schools, these differences are not statistically significant. However, traditional schools have a higher percentage of students on an individualized education plan (27% compared with 16%) and a lower percentage of students in a gifted program (9% compared with 25%). These means are statistically different. In addition, magnet schools have a significantly lower percentage of students on free or reduced lunch compared with traditional schools (66% compared with 91%).
Traditional Versus Magnet Schools

Note. Means are reported.
p < .1. **p < .05. ***p < .01.
This difference is also statistically significant. These differences might reflect differences in which students apply to magnet schools. Gifted students might be more attracted to magnet schools because of their academic focus. To help ease concerns about this, we focus on lottery and academic magnet schools separately. Academic magnets are more likely to be affected by this instance of selection bias than lottery magnets.
On average, magnet schools in TPS have more teachers with master’s degrees and more years of experience compared with traditional schools. However, magnet schools also have a higher student-to-teacher ratio and a lower percentage of teachers identifying as a minority. None of these teacher differences are statistically significant. These student and teacher characteristics of magnets are all important in trying to understand how the environment in a school might factor into differences in disciplinary practices.
Expectations
Based on our review of the literature, we have several expectations about the relationship between magnet schools and suspension rates, summarized in Table 2. We expect students enrolled in a magnet school to have a lower likelihood of suspension than those attending a traditional school. Within magnet schools, we expect the racial differences in suspension rates between Black students and White students to be less than the differences within a traditional public school. We expect other factors within the school environment to predict differential suspension rates as well, regardless of magnet status. We expect schools with lower student-to-teacher ratios to have lower suspension rates. In addition, we expect schools with a higher number of minority teachers to have lower suspension rates and a reduced gap between Black and White students. When we shift our focus to incident-level data, we expect to observe similar patterns. We expect magnet schools to predict less severe infractions and fewer days of suspension.
Summary of Hypotheses

Method
Data and Sample
The sample is from the TPS district in Tulsa, Oklahoma. Students have been tracked since they were enrolled in kindergarten in the Fall of 2006. We used data collected from two sources: (1) state/district administrative data from the 2006–2007 and 2014–2015 academic years for children enrolled in TPS and (2) parent survey data from children enrolled in TPS as collected in August 2006. 2 The study sample is defined by students who enrolled in TPS in seventh or eighth grade during the 2014–2015 school year and who attended TPS when they were in kindergarten. Of the original cohort of 4,033 enrolled in kindergarten, approximately 1,894 remained in the district in the 2014–2015 school year. 3 We use propensity score matching as our identification strategy. This process discards unmatched observations. In addition, some observations had missing information, which is discussed in more detail. Therefore, our final study sample is 1,638 students. 4 This is shown in Figure 1. We discuss the propensity score process and missing data in more detail.
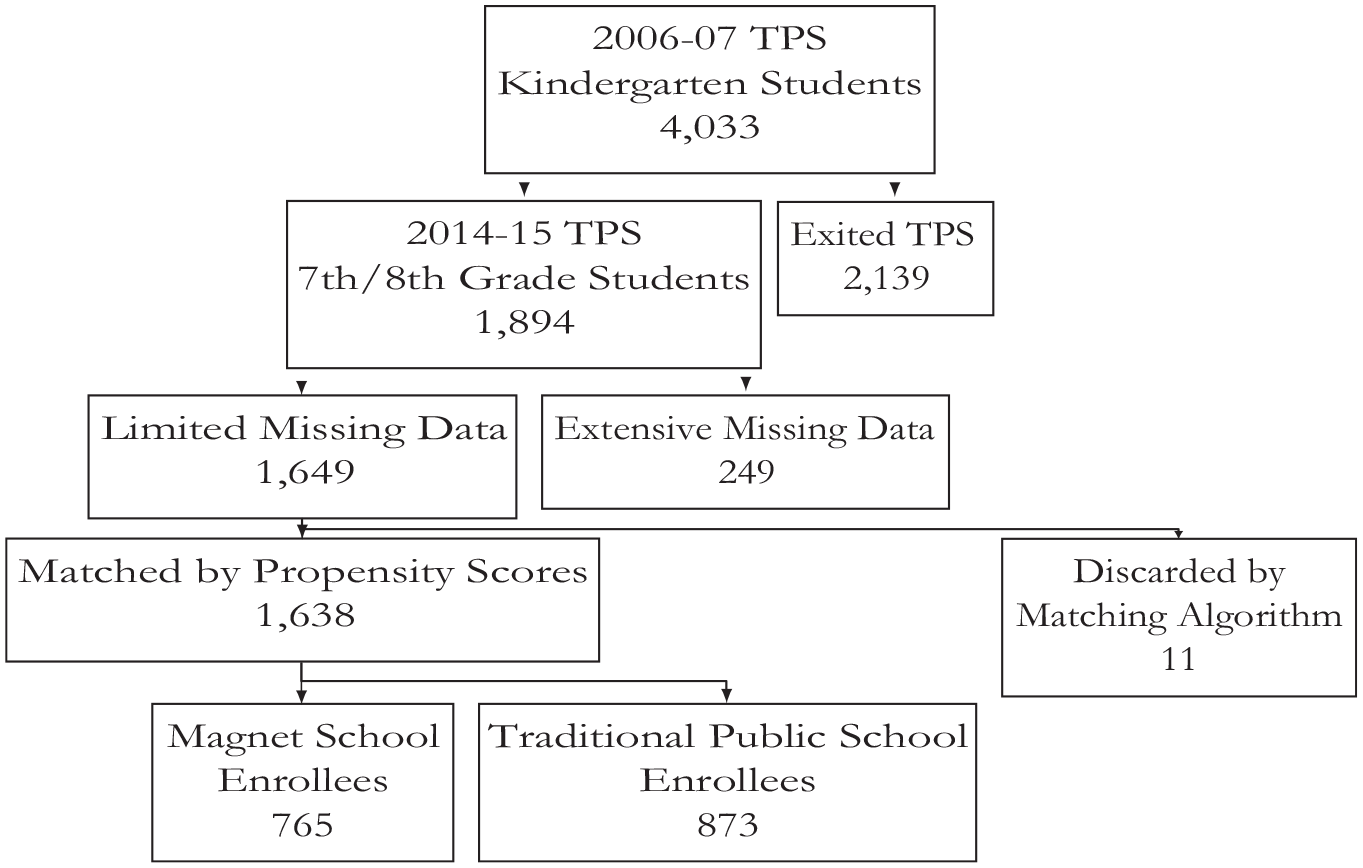
Sample selection process.
In addition to our student-level data, we have records of every suspension that occurred during the 2014–2015 school year. Records of incidents contain information about the type of infraction and the resulting punishment; however, whether the suspension was served in-school or out-of-school is not indicated. Students who have been suspended multiple times within a year have a record for each incident. We do not use the matched data in this section.
For each incident, we have information about the severity of incident coded by tiers. Tiers 1 and 2 were for minor infractions. Examples of a tier 1 infraction include tardiness and profanity. Tier 2 is for persistent violations of tier 1 infractions. Tiers 3 and 4 were for more serious infractions, including theft, drug use, and physical assault. In addition to severity of incident, information about the number of days students were suspended was recorded. The assumption is that more days indicate a harsher punishment.
As Figure 2 shows, TPS has had different approaches to suspensions over the past several years, reflecting perhaps a growing concern over the negative consequences of suspensions (Oklahoma State Department of Education, 2019). There were over 5,000 out-of-school suspensions in the 2010–2011 school year. This is primarily driven by suspensions for truancy. In 2012, the district shifted how they dealt with truancy, leading to a decline in the number of suspensions (Eger, 2013). However, the 2014–2015 school year (represented by 2015 on the graph) is consistent with the following 2 years in number of suspensions. In-school suspension rates remain fairly constant, with the exception of 2012. Given differences in in-school versus out-of-school suspension rates over time, we examine both types of suspensions in our analyses.
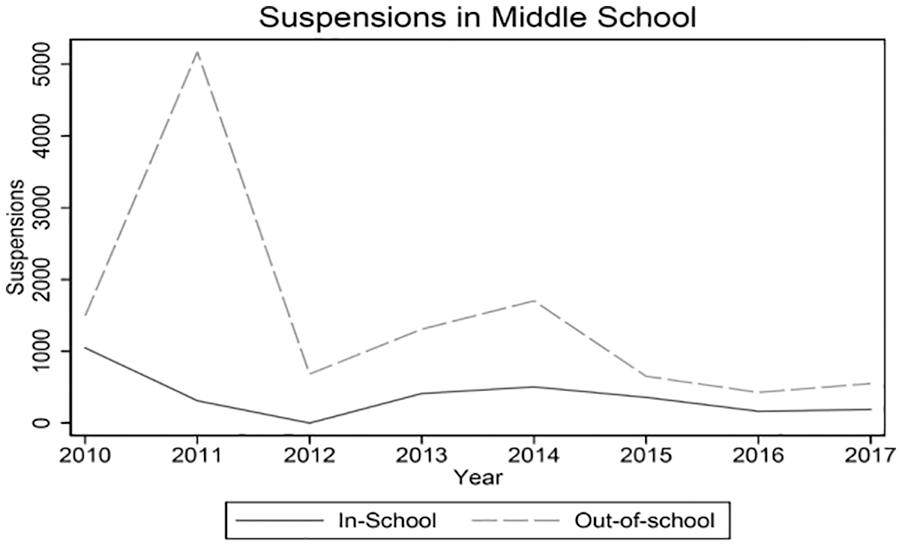
Tulsa middle school suspensions 2010–2017.
Measures
Dependent Variables
Because we are looking at both who is more likely to be suspended and whether there is differential treatment in handing out punishments, we operationalize our dependent variable in different ways. First, when we are trying to understand who is more likely to be suspended, we use a binary dependent variable coded 1 if the student was suspended during the 2014–2015 school year. We run separate models for out-of-school suspension and in-school suspension. As an alternative to out-of-school suspension, some students were sent to an alternative school with a focus on dealing with behavioral issues. Students are enrolled in this school based on recommendations from TPS’ Discipline Review Committee. If a student was sent to this program, known as TRAICE Academy, we included that as in-school suspension, because the student is still attending classes. Second, we examine outcomes for the subset of students who were suspended: severity of incident, and number of days suspended. For suspension severity, we coded minor infractions as 0 (Tier 1 or 2) and major infractions (Tier 3 or 4) as 1.
Independent Variables
We are interested in understanding the role of school environment in predicting suspensions and racial differences in suspensions. More specifically, we want to see if magnet schools vary from traditional schools in suspensions. We measure school type in two ways. The first is a binary variable coded 1 if the student attended a magnet school and 0 if the student attended a traditional school. In some analyses, we split the magnet variable into two dummy variables to indicate whether the magnet school was a lottery magnet or an academic magnet.
From TPS administrative records, we include the following student-level covariates: race/ethnicity, gender, whether they repeated kindergarten, and school lunch status. From the parent surveys, we include a binary variable on whether either parent attended college (as reported in kindergarten), and whether the student had any siblings.
We also include school-level covariates in some models. We include the percentage of students with a designation of free or reduced-price lunch status, the percentage of students who identify as Black, the percentage of the teachers who identify as belonging to a minority racial/ethnic group, staff attendance rates, and student-teacher ratios. We do not have more detailed information on the race/ethnicity of the teacher, other than whether they identify as a member of a minority group. In order to identify whether there is a differential rate of suspension between magnet schools and traditional schools for Black students, we interact the Black and magnet dummy variables.
For the incident-level sample, we use the same set of covariates as the student level plus the addition of one variable. When we are predicting the length of suspension in days, we include the tier of the incident. This covariate reflects our assumption that higher tiers correspond to more serious infractions and therefore a longer number of days assigned as punishment. Controlling for the tier of the incident allows us to assess whether magnet schools respond differently to similar incidents.
Missing Data
We have basic administrative data for all students who were enrolled in TPS. This includes race, lunch status, gender, and birth date. We also know which school a child attended and information about all traditional and magnet schools within the district. A handful of students attended alternative schools within the district, and we do not have school-level information about the alternative schools. The Woodcock Johnson test scores and the sixth-grade math and English grades have missing observations. These are only used in the matching process. The Woodcock Johnson test scores, which were administered at kindergarten entry, are missing for approximately 500 students. The math and English course grades are missing for approximately 200 students. 5 Because so many of the Woodcock Johnson scores are missing, we only use them for matching as part of the robustness checks available in Appendix B. Last, the survey used to collect parental education level has missing data. A large number of parents did not include information about their level of education: 792 out of the 1,894 students did not have parent responses. We believe that the likelihood of no response is related to missing. In our models, we include a dummy variable for whether a parent went to college. Parents who did not respond to this survey are coded as zero for this variable.
Identification Strategy
In an ideal scenario, students would be randomly assigned to magnet and nonmagnet schools. We could then compare these groups to estimate the average treatment effect. However, because students were not randomly assigned to schools, differences between students might explain both the likelihood of attending a magnet school and the likelihood of being suspended. To address potential bias due to selection effects, we match students in the treatment group to similar students from the control group. Given the difficulty of constructing exact matches on a large number of covariates, we match on each student’s propensity score—the conditional probability of selection into the treatment group (P. R. Rosenbaum, 2002). We assume that, conditional on the covariates used to model selection into the treatment group, assignment to magnet schools is ignorable.
Propensity score matching has been applied to a variety of studies using the same sample of students who attended Tulsa Public Schools during the 2006–2007 academic year. Researchers found that students who attended early childhood programs in Tulsa had improved academic and behavioral outcomes in eighth grade, including math achievement, enrollment in honors courses, grade retention, and lower levels of chronic absenteeism (Gormley et al., 2018; Phillips et al., 2016). Researchers also examined social-emotional outcomes for students who attended the early childhood programs, including enhanced attentiveness in kindergarten (Gormley et al., 2011), and differences in middle school with respect to attitudes about grit and risky sexual behaviors (Phillips et al., 2018).
The matching process should result in treatment and control groups that are balanced across average values of the covariates. A common approach is to pair each treatment unit with a control unit with a similar propensity score—its “nearest neighbor”—without replacement. This approach requires sufficient score overlap between treatment and control units, known as the region of common support (Murnane & Willett, 2011). However, simple one-to-one matching would either reduce the sample of matched pairs by half, or would result in imbalanced groups due to the large number of treatment units whose “nearest” neighbor is relatively far away. Further, weighting the regression by the inverse of the propensity score as an alternative to matching would mask the lack of common support but generate estimates with limited substantive meaning.
In lieu of one-to-one matching, we employ a full matching algorithm, which generates subclasses within which one treatment unit may be matched to one or many control units (Hansen, 2004). Full matching permits us to use as large a sample as possible and helps to reduce dependence on particular model specifications (Ho et al., 2007a). Full matching is “optimal” because it considers not only individual subclasses but also minimizes the average total distance between the treatment and control units (Gelman & Hill, 2007; Hansen, 2004). 6
We use two different matching samples due to missing data. The first is a larger sample of 1,681 units. The covariates include information about student demographics, psychological assessments, prior academic achievement, socioeconomic status, and parental education level. The best fit propensity score model includes quadratic terms for age and psychological assessment scores. We do not include academic achievement in kindergarten due to missing data. However, we do rerun the propensity scores using the kindergarten test scores. It does improve balance but at the cost of power and potential selection issues. We present the results in the appendix for the smaller sample. Results are consistent with the larger sample that does not use kindergarten test scores in matching. Approximately half of the kindergarten sample falls within the region of common support, as shown in the shaded overlapping densities of the treatment and control groups in Figure 3.

Comparison of propensity scores by treatment group.
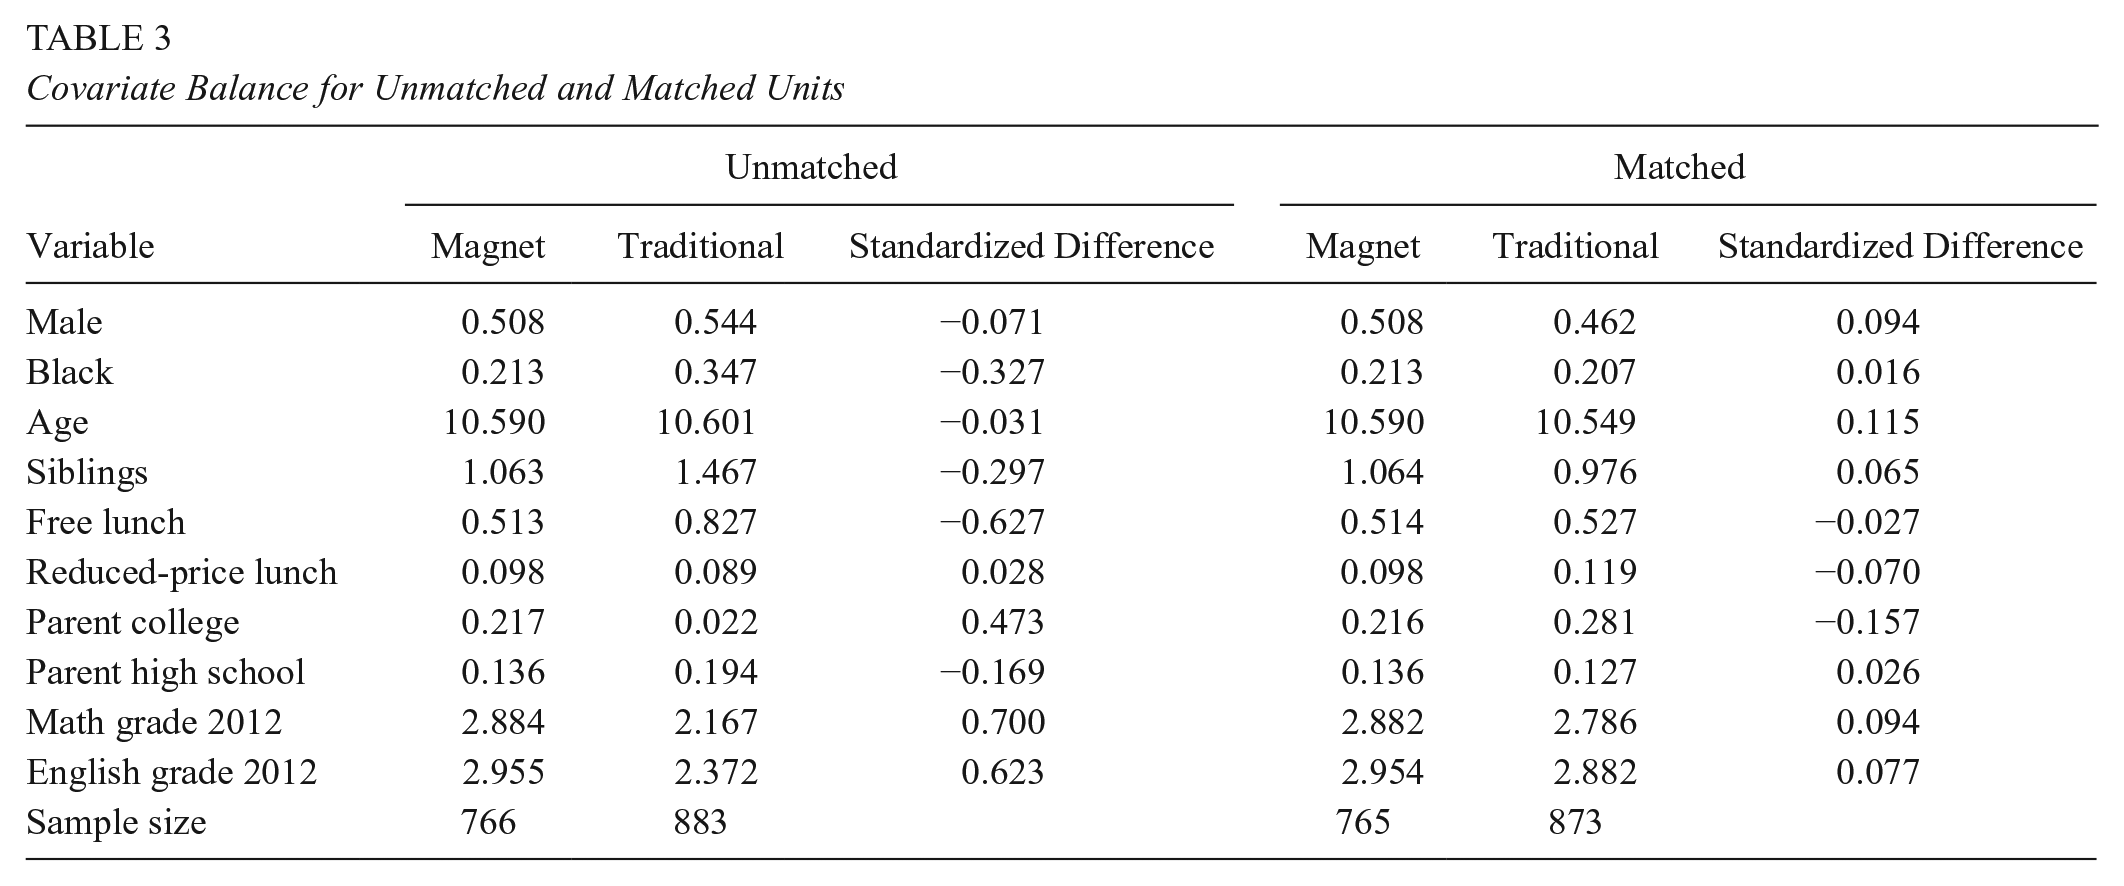
The unmatched sample consists of 1,649 units: 883 traditional public school students and 766 magnet school students. After discarding 11 units that fell outside the region of common support for each covariate, the matched sample contains 462 subclasses comprising 765 magnet students and 873 traditional students. Table 3 reports covariate balance for unmatched units and matched units. Prior to matching, the groups exhibited large differences in the proportion of Black students, the proportion of students qualified to receive free lunch, and the proportion of students whose parents graduated from high school or college. The full matching algorithm performs matching with replacement in order to produce considerably more balanced groups. Figure 4 shows the largest improvement in balance for free lunch status, parent education, and academic performance in math and English. With the exception of age and parents’ college attendance, matched units fall within a tenth of a standard deviation of their counterparts on all covariates. For age and parents’ college attendance, matched units fall within 0.12 and 0.16 standard deviations.
Covariate Balance for Unmatched and Matched Units
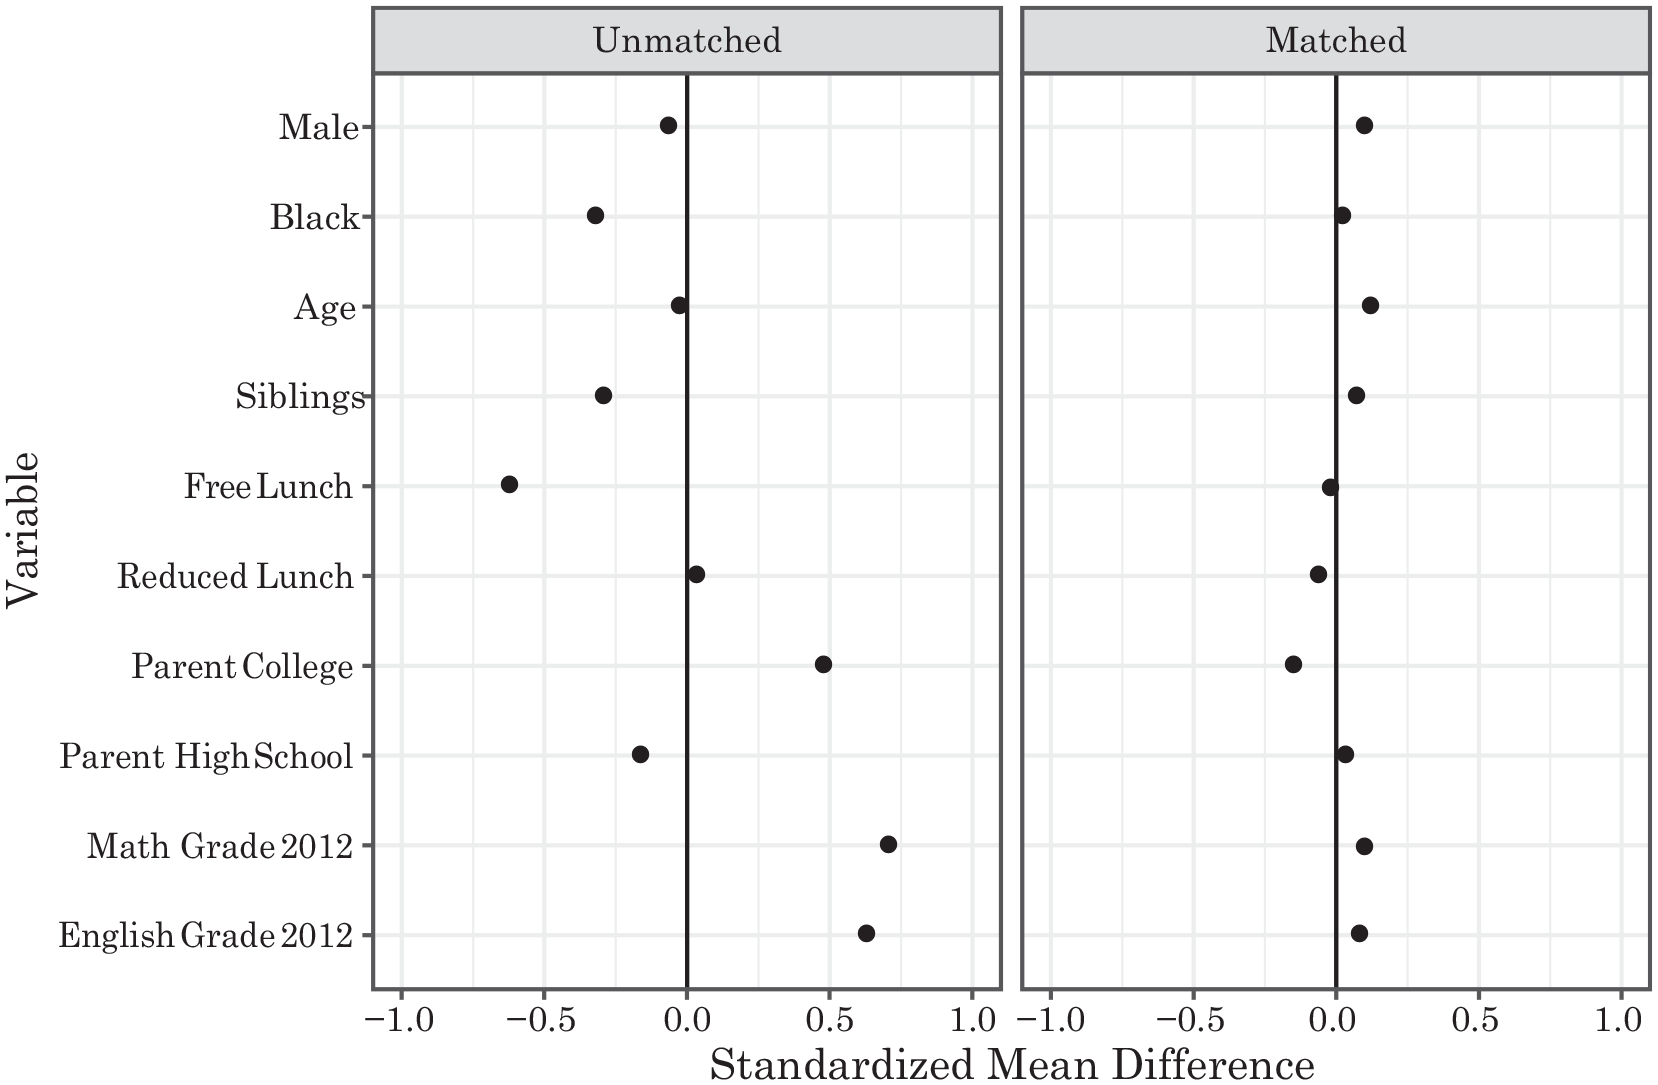
Covariate balance for matched and unmatched units.
Model Specification
Our first analytical goal is to test our hypothesis that magnet school enrollment influences disciplinary outcomes for middle school students. We therefore estimate the probability of in-school and out-of-school suspensions as a function of individual and school characteristics. Since students are clustered within schools, we specify a hierarchical linear model, as follows:

where yi is the probability of suspension for student i,
Our hierarchical model, which includes varying intercepts for each school, allows us to estimate several quantities of interest. The coefficient for magnet status tells us the extent to which the likelihood of suspension depends on a student enrolling in a magnet school. Student-level covariates allow us to examine this relationship by subgroup. We include a separate specification with an interaction term between magnet status and race—an opportunity to examine whether magnet schools exhibit wider or narrower suspension gaps between Black and White students. With the school-level model, we examine the specific school characteristics that may influence students’ suspension outcomes. Although this part of our analysis is descriptive, we consider school factors as a starting point for additional research on the underlying mechanisms that drive differential suspension rates.
Given well-documented impacts of suspension on student outcomes, our second analytical goal is to estimate the impacts of magnet schools on disciplinary outcomes for suspended students. We consider three outcomes: probability of multiple suspensions, suspension incident severity, and suspension length. Since incidents are clustered within students and schools, we considered a hierarchical specification accounting for this structure. However, the estimated within-student and within-school variances were nearly zero. For simplicity, we used linear probability models to fit the probability of a severe incident as well as the probability of multiple suspensions. For the number of days suspended, we assume zk ~ Poisson for incident k. We use a generalized linear model to fit this model, again assuming no hierarchical structure.
Results
We report findings, first focusing on predicting the likelihood of suspensions. We then focus on incident-level data. Table 4 shows the simple breakdown of percent of students suspended (in-school plus out-of-school combined) by race/ethnicity, lunch status, and magnet school attendance. Without controlling for any covariates, we observe similar patterns in the Black-White suspension gap. Approximately 26% of Black students have been suspended, compared with only 9% of White students and 13% of Hispanic students. Students who receive free lunch are also suspended at higher rates than students with reduced or paid lunch. Last, 22% of students who attended a traditional middle school had been suspended, compared with 9% who attended a magnet middle school. In Appendix B, we run robustness checks using a different matching model that uses kindergarten test scores to match students. 7 The results are very similar to what is reported.
Suspension Rates

Student Outcomes
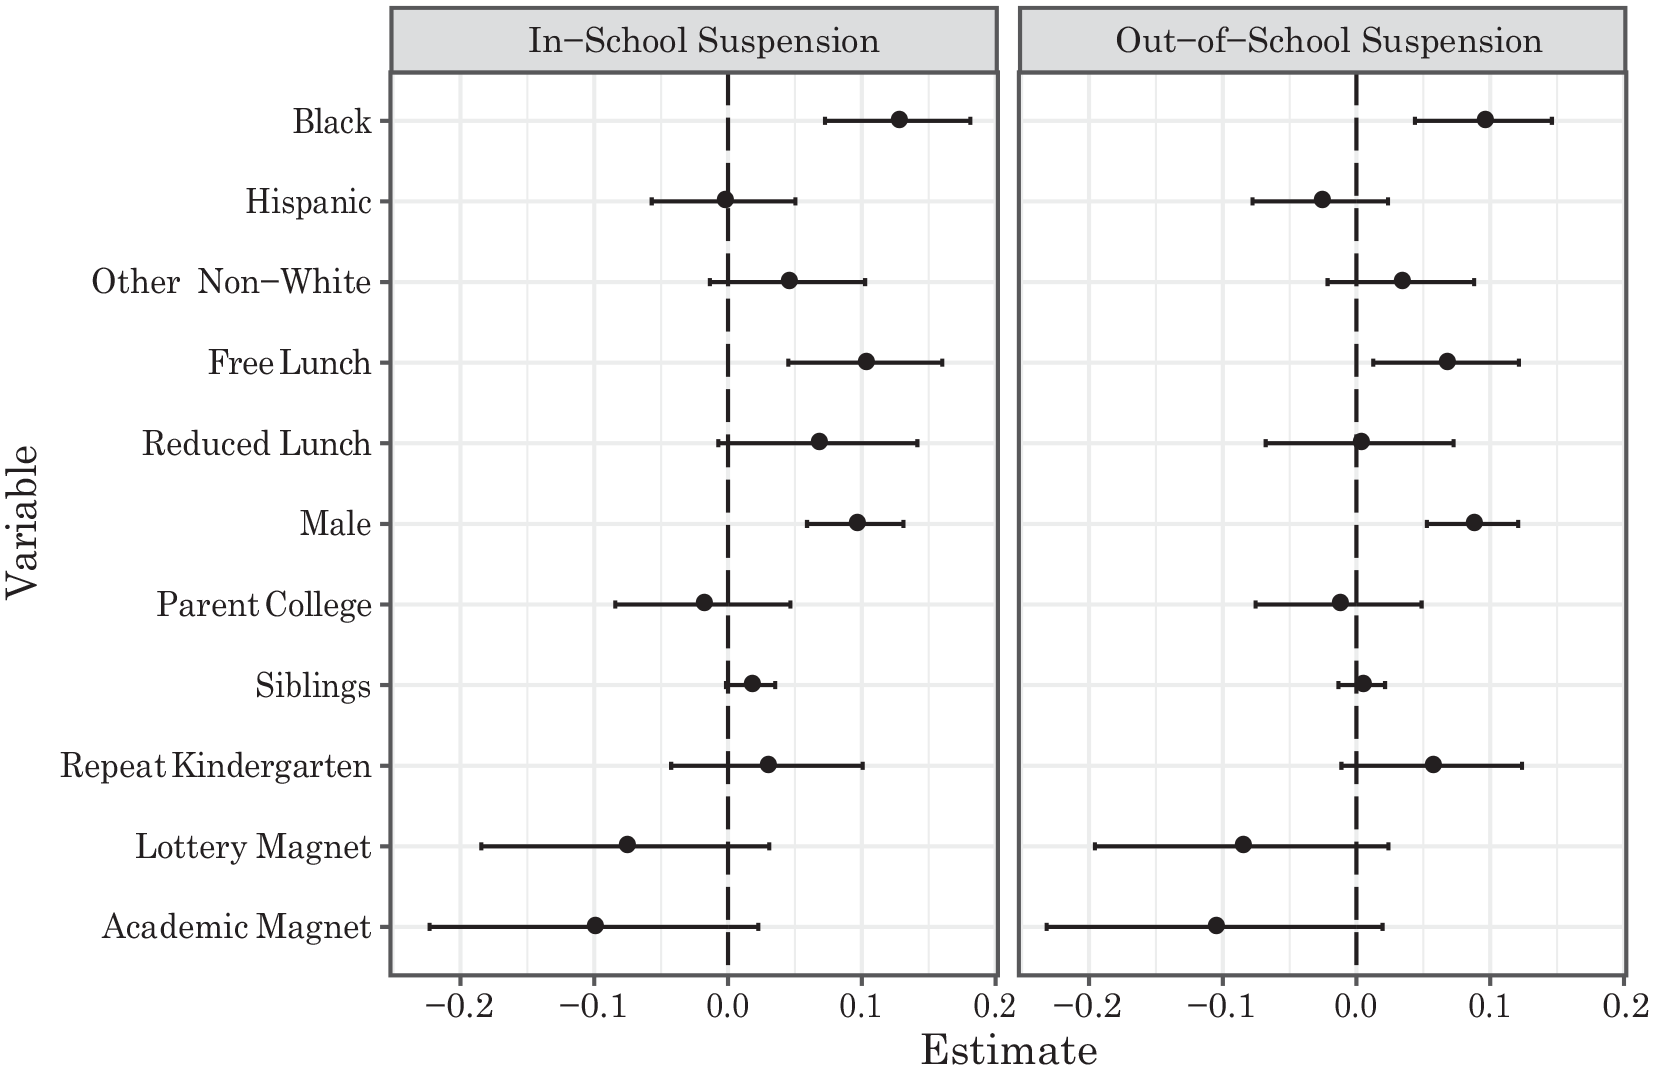
Table 5 reports estimates of the likelihood of suspension for the matched sample (Figure 5 plots the corresponding coefficients for models 1 and 3). The first two columns focus on in-school suspension while Columns 3 and 4 predict out-of-school suspensions. In all models the coefficient on Black is positive and statistically significant, indicating that Black students are more likely to receive in-school suspensions or out-of-school suspensions than their White counterparts. In Column 1, we find that while the overall probability of in-school suspension is around 5%, Black students are 12.6 percentage points more likely to be suspended than White students. We do not observe any statistical differences between White students and students of other races/ethnicities. We find similar patterns for out-of-school suspension.
Probability of Suspension
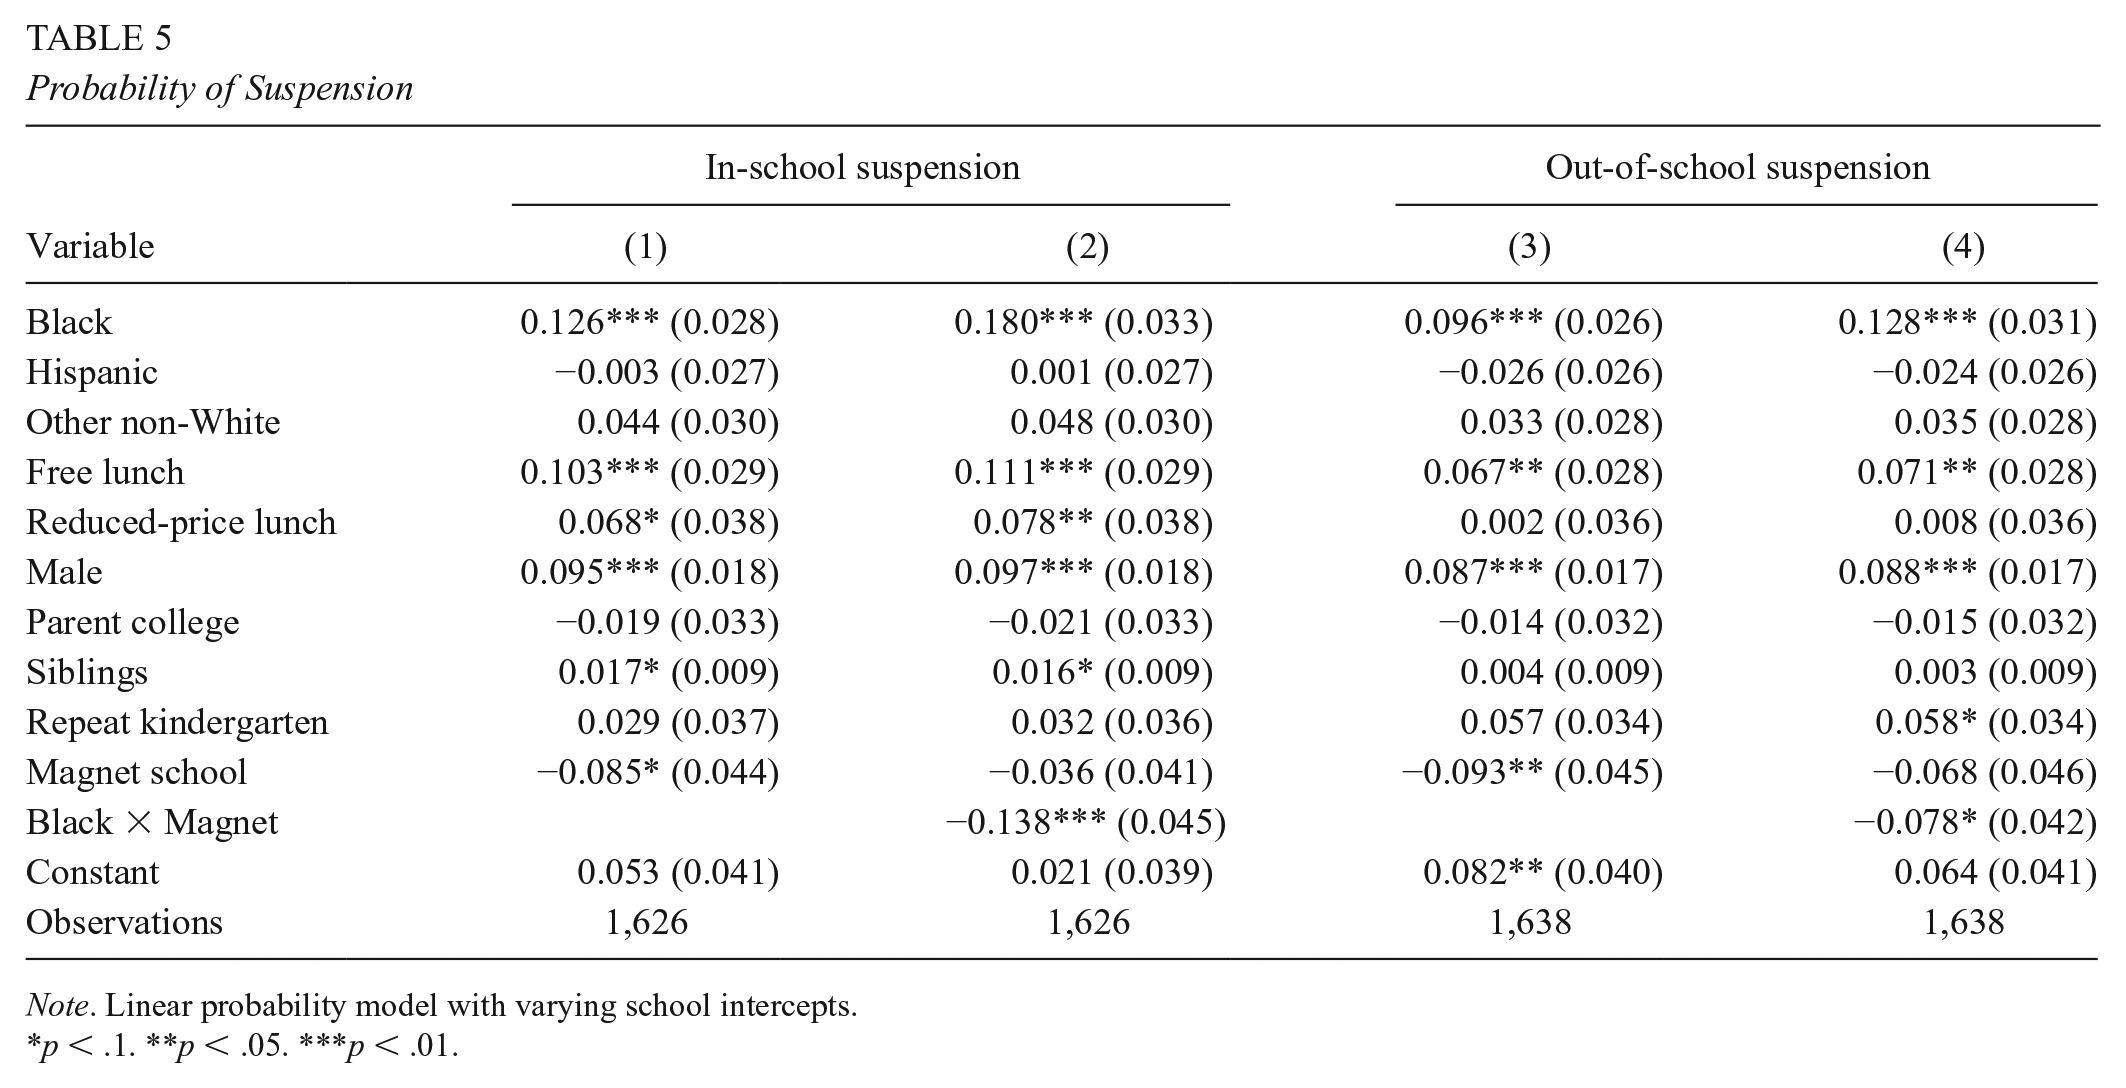
Note. Linear probability model with varying school intercepts.
p < .1. **p < .05. ***p < .01.

Estimated effects on probability suspension. Results correspond to Table 5, column 1 and 3.
Focusing on magnet schools, we find that attendance in a magnet school is associated with a lower probability of suspensions. When we add an interactive effect in Columns 2 and 4, we find that the magnet school effect is strongest for Black students. That is, Black students enrolled in magnet schools have a lower probability of suspensions than Black students enrolled in traditional schools. The probability of in-school suspension for Black students in magnet schools is 2.7%, which is similar to the probability of suspensions for White students in traditional schools (2.1%). Similar trends are also observed for out-of-school suspensions.
Gender and lunch status also predict likelihood of suspensions. Male students are suspended at higher rates than female students, and students who receive a free lunch are suspended at higher rates than those who pay for lunch. Reduced-price lunch students receive more in-school suspensions—but not more out-of-school suspensions—than those who pay for lunch.
Table 6 is set up the same as Table 5 but separates magnet schools into the two types: lottery and academic (Figure 6 plots the corresponding coefficients for models 1 and 3). If academic magnets are driving the results, then that might speak more to a selection effect of students. However, lottery magnet admission is determined based on a random process. In all models, Black students are more likely to be suspended. However, the interaction between Black students and lottery is negative and statistically significant for in-school suspension. For out-of-school suspension, it is negative but not statistically significant. For academic magnets, the interaction is negative but not statistically significant for both in-school and out-of-school suspensions. Thus, we conclude that academic magnets are not driving the overall finding.
Probability of Suspension

Note. Linear probability model with varying school intercepts.
p < .1. **p < .05. ***p < .01.
Estimated effects on probability suspension. Results correspond to Table 6, column 1 and 3.
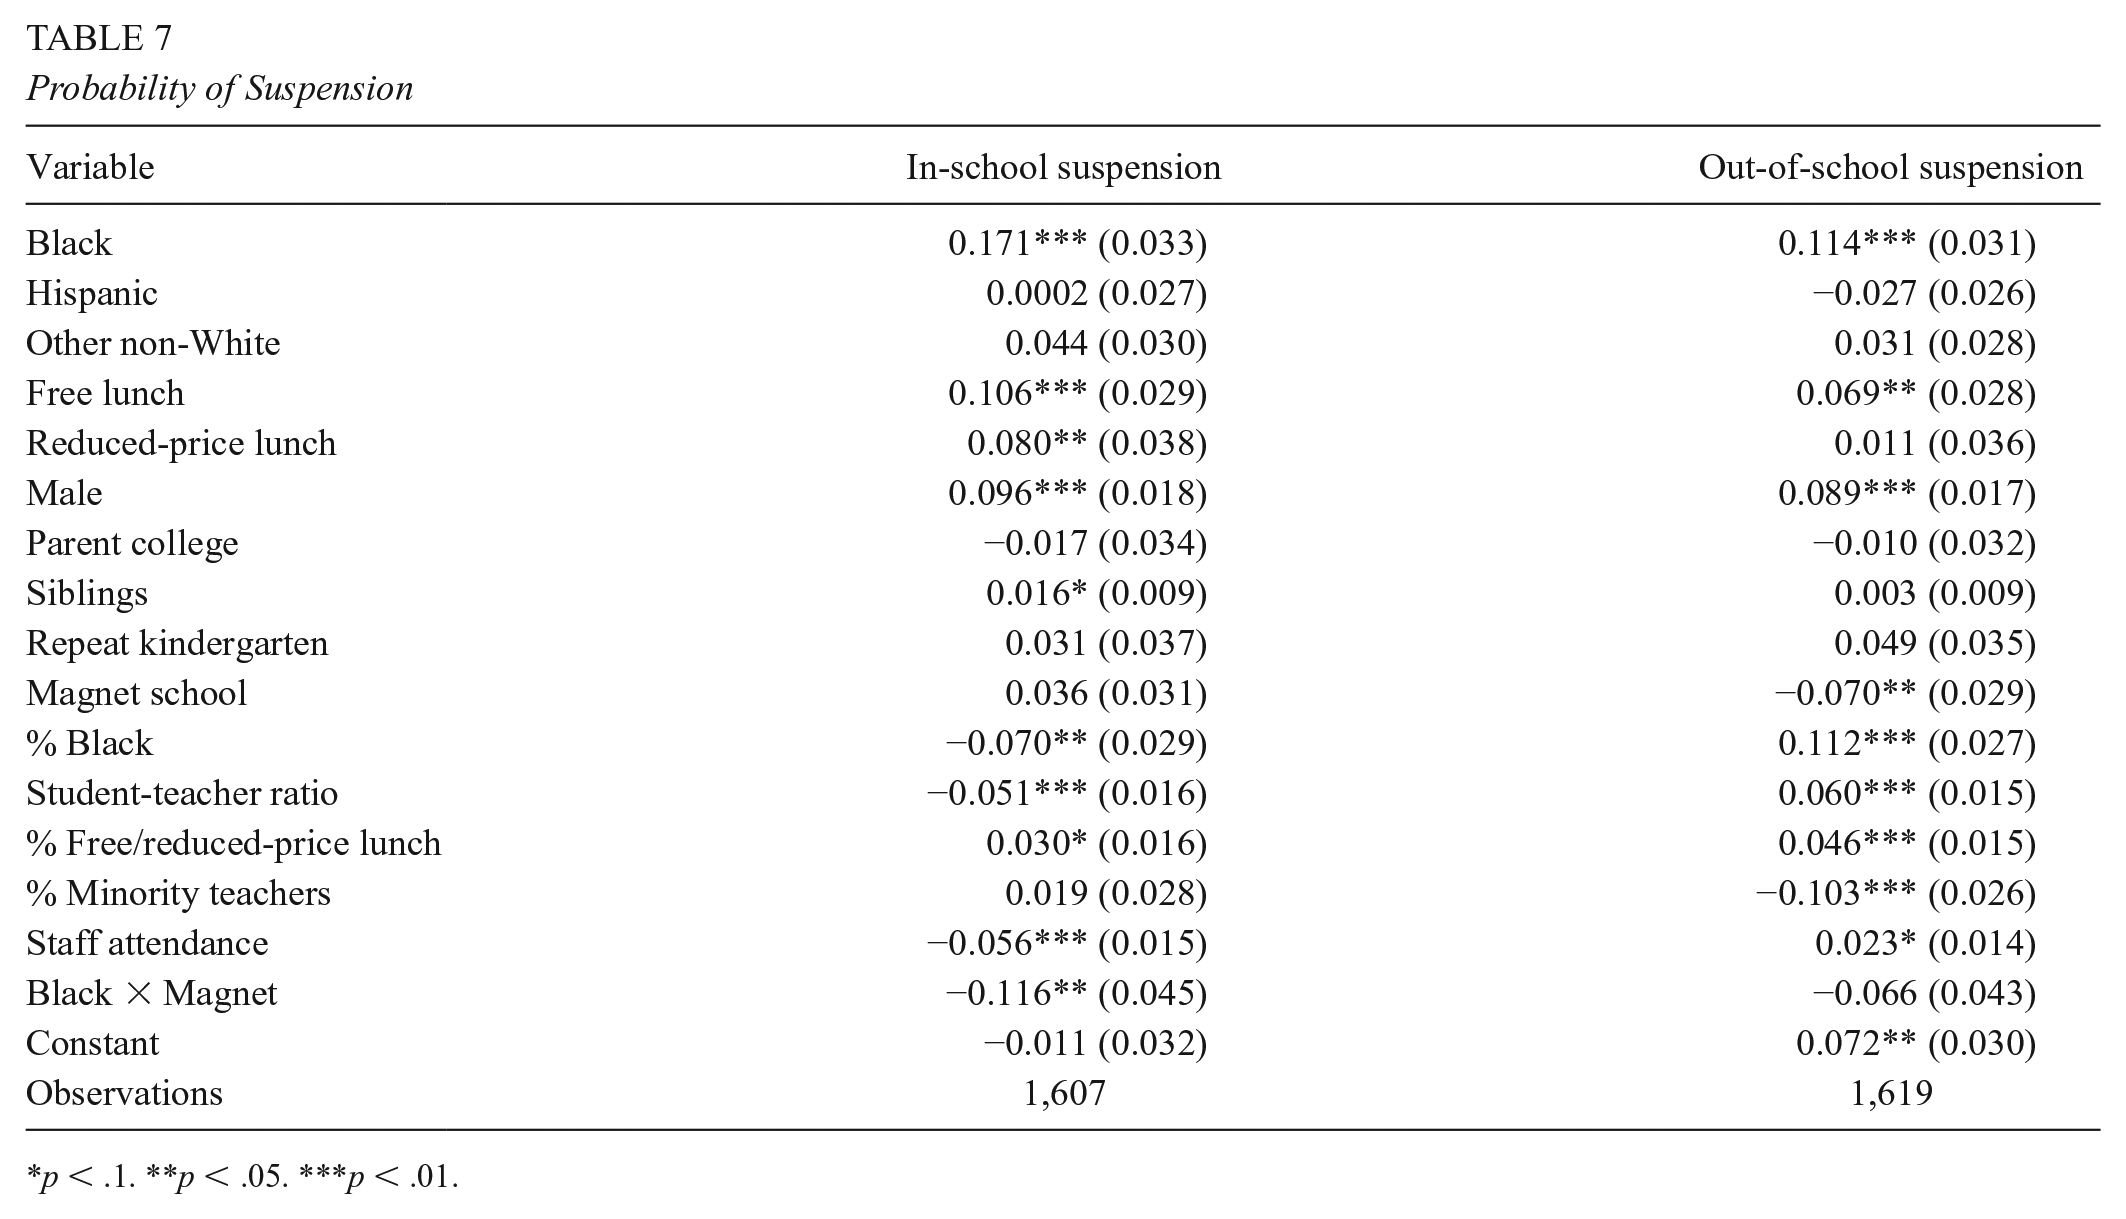
Table 7 adds the following school-level covariates to the model: student-teacher ratio, percent of students receiving free or reduced lunch, percent of the teachers who identify with a minority group, and staff attendance rates. Similar to Table 5, while magnet status by itself is not statistically significant for in-school suspensions, the interaction between magnet school and Black is useful for predicting in-school suspensions. For out-of-school suspensions, magnet status is negative and statistically significant, but the interaction between Black and magnet is not. Other school-level variables also matter in predicting suspensions. A higher percentage of minority teachers is associated with a lower probability of out-of- school suspension, consistent with previous literature. For both in-school and out-of-school suspensions, a higher percentage of students receiving free or reduced lunch is associated with more suspensions. Interestingly, student-teacher ratio and staff attendance show different relationships depending on the model. For in-school suspensions, a higher student-teacher ratio is associated with more suspensions, as is higher staff attendance. For out-of-school suspensions, the opposite is true. A larger student–teacher ratio is associated with more suspensions, as is lower staff attendance. This is perhaps because of the high correlation between these variables and the type of school, making their true effect hard to estimate. In addition, lack of variation in these variables could be a reason for this finding.
Probability of Suspension
p < .1. **p < .05. ***p < .01.
In terms of out-of-school suspensions, the interaction between magnet school and Black student is still negative but no longer statistically significant. Student-teacher ratios are in the predicted direction. That is, the more students to teachers, the greater the likelihood of out-of-school suspensions. The percent of students receiving free or reduced lunch also is predictive, with higher percentages associated with a higher likelihood of suspensions. The percent of Black students in a school also has a different relationship with suspensions, depending on the type of suspension. The sign change may indicate an issue with multicollinearity in our models. While there are various ways to address multicollinearity, we have decided to keep these variables in our models for their substantive importance, even though it may represent a trade-off with respect to model fit.
Incident Outcomes
In this section, we analyze incident-level data. This data is subset to only students who were suspended. Table 8 shows the results. Columns 1 and 2 use a linear probability model to predict the severity of incident. Columns 3 and 4 predict the number of days of suspension a student received. Columns 1 and 3 include individual-level covariates while columns 2 and 4 add in school-level covariates. For the number of days assigned, we used a Poisson model. Figure A.1 in Appendix A graphs the number of incidents per student.
Suspension Severity and Length

Note. Coefficients from columns 1 and 2 are from a linear probability model. Coefficients from columns 3 and 4 are from a Poisson generalized linear model. AIC = Akaike information criterion.
p < .1. **p < .05. ***p < .01.
Unlike the likelihood of being suspended, Black students do not receive more severe punishments compared with White students, given that the student had been suspended. Gender is the only individual-level factor that matters for severity, with male students being more likely to receive more severe suspensions than females. In terms of school-level factors, a higher percentage of students on free and reduced lunch is associated with more severe incidents. This is in line with previous research that finds that school demographics are related to how punitive a school is.
In terms of the number of days, no individual demographics predict the number of days assigned. The tier of suspension incident is the strongest predictor. However, many more school-level covariates matter in terms of the number of days suspended. Attending a magnet school is associated with fewer days, as shown in column 3. Once other school-level factors are included, magnet school is no longer statistically significant but still negative. Instead, staff attendance and student-teacher ratios are, perhaps suggesting that resources play a role. Finally, we focus on probability of multiple suspensions. Results can be found in Table 9. Column 1 includes individual-level factors. Black students, students on free or reduced lunch, and male students are all more likely to receive multiple suspensions. Magnet school attendance is associated with a lower likelihood of receiving multiple suspensions. Column 2 adds school-level factors. While individual factors remain similar, magnet attendance is no longer statistically significantly. Instead, schools with a higher percentage of minority teachers are associated with lower likelihood of multiple suspensions, and schools with a higher percentage of Black students or students on free/reduced lunch are associated with higher likelihood of multiple suspensions. This is consistent with the literature.
Probability of Multiple Suspensions

Note. Linear probability model.
p < .1. **p < .05. ***p < .01.
Limitations
There are several important limitations to highlight. First, students were not randomly assigned to magnet schools. Although some of the magnet schools do use a lottery process for admission, we do not know who applied to those schools or why. Parental motivation is likely to be a strong factor in applying to magnet schools. Parental motivation might also matter in whether a student is suspended. Magnet school parents might be more familiar with the school because they actively chose it and might be more willing to act if there is an incident at school. However, parental motivation plays a larger role in selecting elementary magnet schools than it does in secondary magnet schools where student choice is more paramount (Wang et al., 2018). Resources are likely to play an important role here as well. Magnet schools are not neighborhood schools and might require more of an effort to get students to the school. In terms of bussing policies, the school system eligibility requirements to ride the bus state that middle and high school age students must live over 2 miles from their home school in order to take the bus to school (Tulsa Public Schools, 2021). Parents might have to be more involved in transportation efforts, which affects who can attend these schools. This should be kept in mind in interpreting results.
Discussion and Conclusion
In recent years, school discipline has generated growing concern, as revelations about racial disparities have emerged from both scholarly and governmental investigations. To better understand the role of school environment in school discipline decisions we compared the suspension rates of students (for both in-school and out-of-school suspensions) to determine how different school factors might influence these outcomes. We also examined the details of a large sample of suspension incidents in an exploratory analysis of mechanisms. Our results demonstrate the importance of school environment as a key contributor to the racial suspension gap. Consistent with earlier research, we find a large racial gap in suspensions—Black seventh and eighth graders in Tulsa Public Schools are three times more likely to be suspended than their White peers. However, Tulsa’s magnet schools exhibit lower overall rates of suspension and are particularly less likely to suspend Black students than traditional public schools. In fact, in Tulsa’s magnet schools, there are no racial differences in suspensions at all once we control for other factors, such as lunch status and gender.
This study represents data from only one school district. To help contextualize our findings, we identify suspension rates for Black and White students in middle school nationally. Using data from Civil Rights Data Collection (2017), we find that, nationally, magnet schools have lower suspension rates than traditional schools as shown in Figure 7. Using this data base, we identified all schools that had either a sixth, seventh, or eighth grade for the Years 2015 and 2017. The data system also identified which schools were a magnet school or had a magnet program within it. In 2015, there were 28,539 traditional schools and 1,240 magnet schools or schools with a magnet program. We identified the percent of in-school and out-of-school suspensions for Black students and White students within each school and reported the average for each school type. As Figure 7 shows, Black students in both 2015 and 2017 were much more likely to be suspended than White students. But Black students enrolled in magnet schools had lower suspension rates than traditional schools. The one exception to this is in 2017 where in-school suspensions for Black students are lower in traditional schools. White students are also suspended at lower rates in magnet schools. The Black-White suspension gap itself is smaller in magnet schools. For example, with in-school suspensions in 2015, the Black-White suspension gap was a 6.2 percentage point difference (12.3% for Black students compared with 6.1% for White students) but it was 7.1 percentage points different for traditional schools (13.9% compared with 6.8%). While these national data are only descriptive, they do fit with our findings in Tulsa.

National trends in suspension by magnet status.
Why are magnet schools associated with lower suspension rates? There are a number of dimensions involved. First, magnet schools disrupt the traditional sorting process where students attend their local neighborhood schools. We show that the difference is not explained by selection into academic magnets; lottery magnets, which have a random component to the selection of students, also have lower suspension rates. A second dimension is the disciplinary approach. Schools may lean toward in-school suspension rather than out-of-school suspension, depending on the severity of the infraction. We show that magnet schools exhibit lower suspension rates, particularly for Black students, for both in-school and out-of-school suspensions.
Schools can also influence outcomes through staffing decisions, such as the student-teacher ratio, and the racial composition of staff. We find that student-teacher ratio and disciplinary practices are linked. Schools with a higher student-teacher ratio tend to have higher out-of-school suspensions and lower in-school suspensions. This suggests that when schools lack adequate staffing, there is a spillover effect of also lacking staff to supervise in-school suspensions. This may be an indication that students are more likely to receive more severe punishment simply because some schools lack the bandwidth to respond to student infractions in a more constructive manner.
Our findings show that Tulsa’s magnet schools suspend students for fewer days than traditional public schools, even after controlling for the severity of the infraction. Shorter suspensions mean that students’ behavior is addressed in a way that is less likely to impact their academic progress. School districts can influence racial disparities in school discipline through either direct or indirect means. Acting directly, school districts can mandate or encourage principals and teachers to suspend fewer students, to reduce out-of-school suspensions in particular, or to establish new norms aimed at reducing racial disparities. Acting indirectly, school districts can encourage racial integration of individual schools or restructure schools with racial integration as the ultimate goal. The latter approach, adopted years ago in Tulsa as a remedy for school segregation, seems to be generating positive outcomes for Black students today, provided that they are fortunate enough to attend a magnet school.
Footnotes
Appendix A
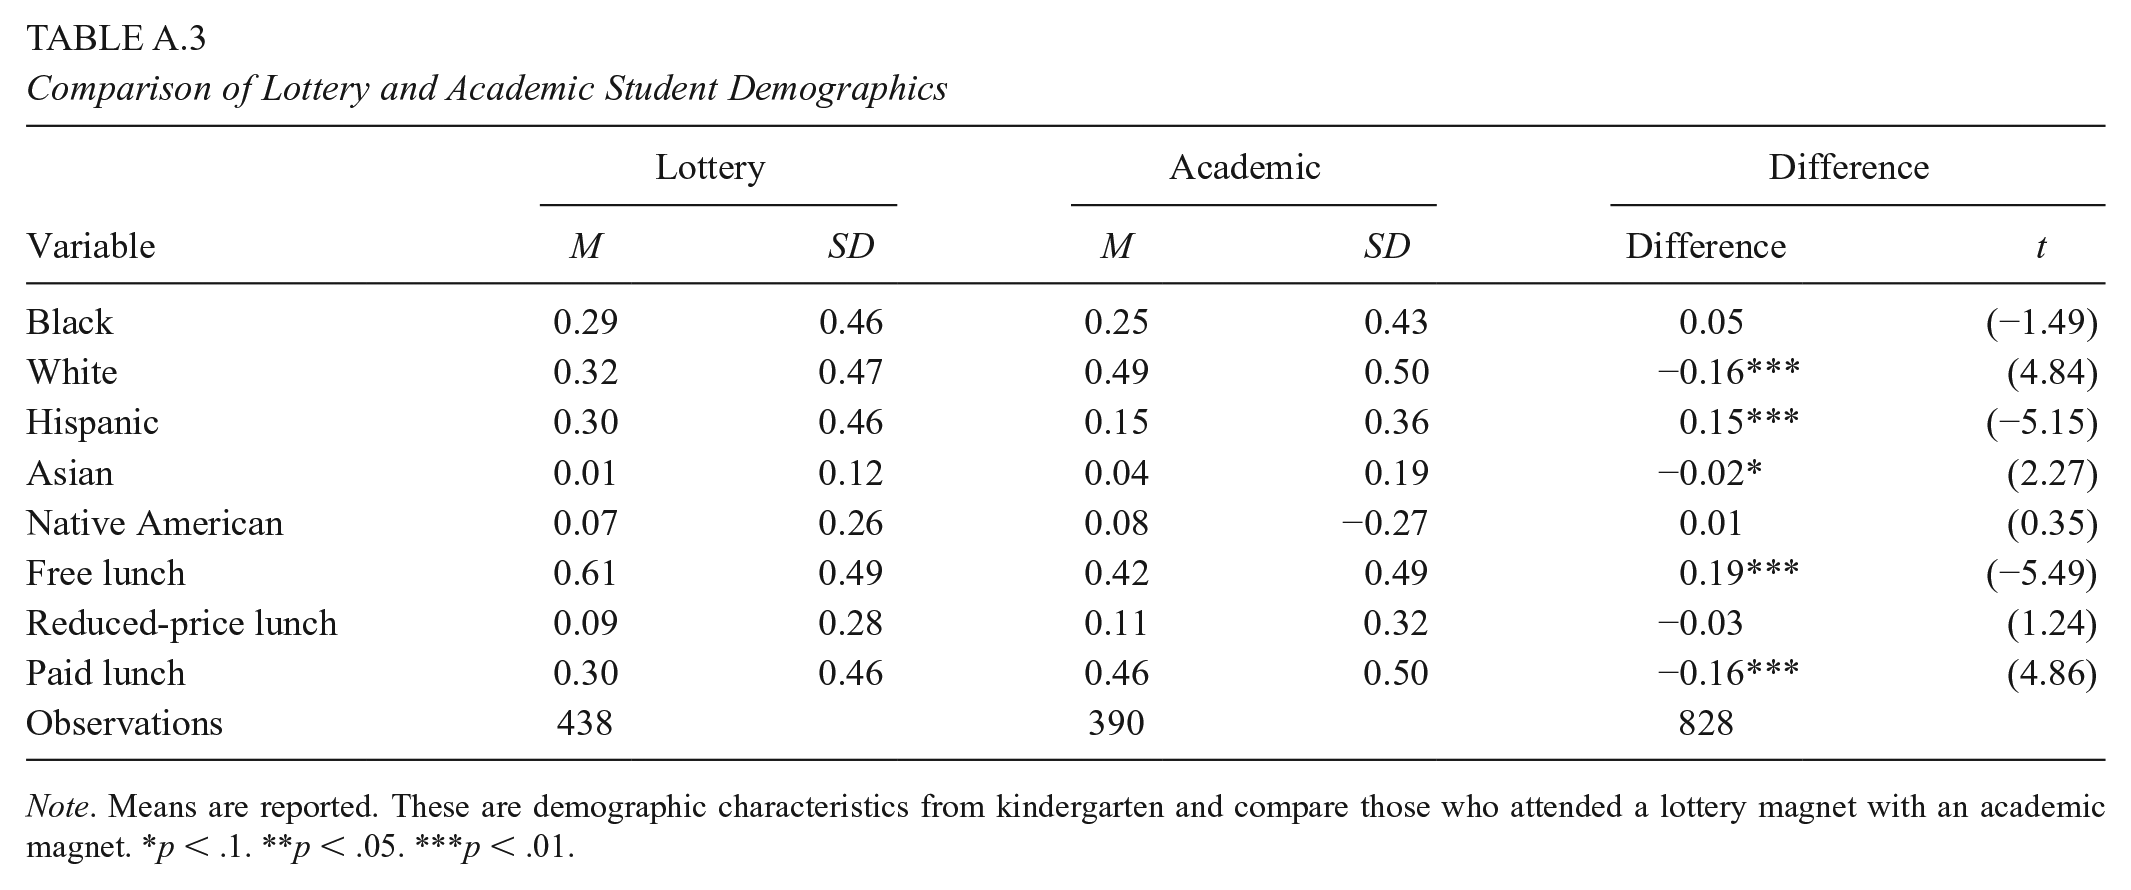
Comparison of Lottery and Academic Student Demographics
| Variable | Lottery | Academic | Difference | |||
|---|---|---|---|---|---|---|
| M | SD | M | SD | Difference | t | |
| Black | 0.29 | 0.46 | 0.25 | 0.43 | 0.05 | (−1.49) |
| White | 0.32 | 0.47 | 0.49 | 0.50 | −0.16*** | (4.84) |
| Hispanic | 0.30 | 0.46 | 0.15 | 0.36 | 0.15*** | (−5.15) |
| Asian | 0.01 | 0.12 | 0.04 | 0.19 | −0.02* | (2.27) |
| Native American | 0.07 | 0.26 | 0.08 | −0.27 | 0.01 | (0.35) |
| Free lunch | 0.61 | 0.49 | 0.42 | 0.49 | 0.19*** | (−5.49) |
| Reduced-price lunch | 0.09 | 0.28 | 0.11 | 0.32 | −0.03 | (1.24) |
| Paid lunch | 0.30 | 0.46 | 0.46 | 0.50 | −0.16*** | (4.86) |
| Observations | 438 | 390 | 828 | |||
Note. Means are reported. These are demographic characteristics from kindergarten and compare those who attended a lottery magnet with an academic magnet.
p < .1. **p < .05. ***p < .01.
Appendix B
Notes
Authors
KARIN KITCHENS is an assistant professor in the Department of Political Science at Virginia Tech and a nonresident senior fellow at the Center for Research on Children in the United States at Georgetown University. Her research focuses on the politics of public education.
NALETTE BRODNAX is an assistant professor in the McCourt School of Public Policy at Georgetown University. Her research interests include education policy, policy diffusion, and computational social science.