
Abstract
Tutoring ranks among the most versatile and potentially transformative educational tools available. Dozens of randomized experiments have evaluated preK–12 tutoring programs, varying widely in approaches, contexts, and costs. This article presents results from a systematic review and meta-analysis of tutoring field experiments. We develop a framework for understanding variation in tutoring program impact and examine effect sizes (ESs) across a range of characteristics. We find that tutoring programs yield consistently substantial positive impacts on learning, with an overall pooled ES of 0.288 SD (SE = 0.029, p < .001). ESs tend to be largest for programs that use teachers or paraprofessionals as tutors, are held in earlier grades, occur at least 3 days per week, and are held during school.
PreK–12 tutoring interventions rank among the most widespread, versatile, and potentially transformative instruments in today's educational toolkit. As school systems across the globe expand and engage with increasingly diverse student populations, the importance of tutoring continues to grow. Although researchers have long studied tutoring, the 1980s saw the emergence of a distinct body of tutoring evaluation research that has grown exponentially. Given the wide-ranging use and robust body of empirical evidence on tutoring programs, synthesizing the evidence constitutes a key priority for education researchers. The present article advances this endeavor by developing a framework of tutoring program impact and using it to guide a meta-analysis of the randomized controlled trial (RCT) evidence.
Existing studies suggest strong promise for tutoring interventions. A recent meta-analysis of education interventions targeting low socioeconomic status (SES) primary school students found average impacts of 0.36 SD on learning outcomes from tutoring, the largest pooled effect of all 14 intervention types included (Dietrichson et al., 2017). Yet tutoring program models vary widely. A framework for comparing the full range of tutoring programs could elucidate the conditions under which alternative models are effective. Existing RCT findings on tutoring programs—refracted through this framework—could enable substantial policy gains by guiding practitioners in selecting options most likely to be effective for particular circumstances.
We address two main research questions: First, what are the impacts of preK–12 tutoring interventions on learning outcomes? Second, how do these effects vary across different categories of tutoring programs? The last meta-analysis of tutoring RCTs was published more than a decade ago and focused only on volunteer tutoring programs (Ritter et al., 2009). Meanwhile, a robust meta-analysis literature has emerged that compares the effects of a variety of math and reading intervention types (e.g., Dietrichson et al., 2020, 2021; Gersten et al., 2020; Neitzel et al., 2022; Pellegrini et al., 2021; Wanzek et al., 2016, 2018). However, these reviews focus on specific subjects and grades, and the bandwidth required for comparing across multiple intervention types constrains their ability to explore variation in tutoring program effectiveness. A central goal of the present article is to explore the relative effectiveness of alternative tutoring models across the full preK–12 grade range for both reading and math.
Our study sample spans a broad terrain in terms of research designs and programs evaluated. Studies of the program Reading Recovery range from an experiment with 52 students across 10 schools in Australia (Center et al., 1995) to a full-scale impact evaluation with 6,888 students in 1,222 schools from across the United States (Sirinides et al., 2018). Randomization occurs at the student, classroom, and school levels, and the studies compare students given tutoring interventions with those participating in regular school activities or close equivalents. Interventions range from intensive high-dosage models with near-daily instruction from certified teachers or paraprofessionals like Reading Recovery and Match (Guryan et al., 2023) to weekly tutoring delivered by minimally trained volunteers (e.g., Ritter & Maynard, 2008). Interventions cover a range of pedagogical activities and may occur during or after school.
The studies in our sample showed substantial positive impacts on learning outcomes, with an estimated pooled effect size (ES) of 0.288 SD (SE = 0.029). Although impacts are significant for most study subsets, they are stronger on average for teacher and paraprofessional than for nonprofessional and parent programs and stronger for earlier versus later grades. Average effects for reading and math interventions are similar, although reading programs yield higher ESs in earlier grades. Programs conducted during school tend to have larger impacts than those conducted after school, as do programs that are held at least 3 days per week. We next lay out the study's conceptual framework before presenting our methodological approach in the third section and empirical results in the fourth section. The fifth section reviews the study's main findings, contextualizing tutoring impact relative to comparable programs and outlining policy lessons and areas for future research.
Conceptual Framework
We follow Dietrichson et al. (2017) in defining tutoring programs as “supplemental pedagogical support from an instructor, either one-to-one or in a small group” (p. 255) because this definition reflects the category as it is most widely understood. Approaching tutoring as a “technology of skill formation” (Cunha et al., 2006, p. 705), that is, a family of interrelated inputs for improving learning, we ask how impact varies across context and consider how impact can be maximized net of costs. We first consider the mechanisms by which tutoring exerts impact and then consider factors most likely to shape impact. Figure S1 (available online) depicts our framework.
Tutoring may improve learning through additional instruction time when it does not substitute for classroom time spent on a given subject. Another potential channel is the customization of learning, that is, “teaching at the right level,” for example, through targeting a student's “zone of proximal development” (Vygotsky, 1978) and “scaffolding” (Bruner, 1983). When students in a classroom span a wide range of skill levels, teachers struggle to address the needs of all at once. The productivity of classroom time may thus decline as skill variation increases (Banerjee et al., 2016). Following this logic, tutoring programs may also yield positive externalities for students who do not receive the tutoring (Berlinski et al., 2022; Schwartz, 2005). Tutoring interventions may also embody a distinct pedagogical moment from classroom education. With fewer distractions, students may spend more time on task and approach content with more focus than in a classroom setting (Gest & Gest, 2005). Another potentially important element is the human connection in the tutor-student relationships (Juel, 1996; Neitzel et al. 2022, p. 174).
Given the above set of potential mechanisms, what elements of tutoring programs are most likely to shape impact? One likely factor is tutor skill. We expect that more highly educated, trained, and experienced tutors will have stronger skills. Tutor type may thus moderate tutoring impact. Training to conduct a particular intervention and other fine-grained elements of skill may represent another dimension of skill, but we focus on tutor type in the quantitative analyses because the categorization is clearer within the literature. Four broad categories of tutor type emerged inductively from our review: teachers, paraprofessionals, nonprofessionals, and parents. In teacher tutoring interventions, certified classroom teachers serve as tutors. The most prominent of these is Reading Recovery, 1 first piloted in New Zealand in 1979. The program launched in the United States (1984–1985) in the Columbus Public Schools before spreading more widely. Training for Reading Recovery tutors is extensive: Already trained and certified teachers undergo a year-long course and ongoing development activities (Sirinides et al., 2018).
Moving to the next category, paraprofessional tutoring interventions employ educators who are not certified teachers, such as school staff members, education students, and professional development fellows. For example, Number Rockets 2 employs school staff. AmeriCorps, 3 a U.S.-government-funded fellowship program, provides tutors for other programs, from the elementary Minnesota Reading Corps (Markovitz et al., 2014) and Minnesota AmeriCorps math tutoring (Parker et al., 2019) to Saga Education secondary math tutoring in Chicago, New York City, and Washington, D.C. 4 Fellows typically remain in programs for 1 or 2 years, receiving between several days’ and a few weeks’ training and close supervision. Although paraprofessionals generally receive less training than teachers, they may be at least as skilled as teachers at tutoring given that tutoring may depend on a unique skill set (Guryan et al., 2023).
Nonprofessional or volunteer tutoring interventions deploy tutors who are not professionally engaged in education, such as community residents and retired adults. For instance, in Reading Partners, 5 unpaid community volunteers receive only about an hour of training and act as tutors, supervised by Americorps fellows. Meanwhile, the AARP Foundation's Experience Corps matches schools with adults ages 50+ who tutor children on reading. Finally, parent tutoring interventions support caretakers in tutoring their own children.
One family of interventions that we elected not to include within the meta-analysis is that of peer or cross-age tutoring, that is, programs where the “tutors” are schoolmates of the tutees. We follow previous reviews in categorizing these as “cooperative learning” (Dietrichson et al. 2017, p. 254), which constitutes a distinct policy domain (McMaster et al., 2005).
Besides tutors’ skills, the effectiveness of tutoring programs may depend substantially on the curriculum. Programs cover different subjects (all studies in our sample covered literacy or math) and grade levels. Pedagogical approach and content also vary. For instance, some literacy programs focus on phonics and others on comprehension. Programs also vary in the level of structure the tutor follows. Programs like Reading Recovery and Number Rockets consist of structured lessons with detailed directives to the tutors. Each Reading Recovery lesson begins with “rereading familiar books” aloud, followed by targeted letter/word recognition activities, story composition, and reading a new book (Sirinides et al., 2018, p. 317). Number Rockets consists of about 45 scripted lessons delivered over the course of 4 months (Gersten et al., 2015). On the other end of the spectrum, interventions like the Northern Ireland nonprofessional elementary reading program Time to Read provide significant leeway to tutors (S. Miller & Connolly, 2013). Although subject and grade level are included within our quantitative meta-analyses, pedagogical approach and level of structure were not possible to meaningfully code.
Another potentially important set of factors is delivery mode. First, tutor-student ratio can vary from 1:1 up to 1:6 (no literature that we came across referred to teaching groups of seven or more as tutoring). Interventions with more students instructed by a single tutor at the same time should incur lower costs and may reduce stigma and activate social learning. However, more students per group may also reduce impact by dividing the tutor's attention.
In addition to the number of students participating in each session, whether tutoring occurs during or outside of school hours may shape impact. In our study sample, variation in the time and location of tutoring occurs within paraprofessional and nonprofessional tutoring programs. Number Rockets, Saga Education, and Time to Read all take place during school hours. Reading Partners may take place either during or after school. Where tutoring occurs may also matter. The home environment may be more relaxed but also more distracting (Villiger et al., 2019, p. 56). Important timing distinctions may exist even among programs held during school hours, particularly whether tutoring sessions replace classroom time on the same topic. Ideally, tutoring sessions would occupy time slots with the lowest opportunity costs, but this may be difficult to discern and coordinate. Both Reading Recovery and Number Rockets ask that schools schedule tutoring sessions to avoid conflicts with the respective subject of tutoring.
Tutoring programs vary widely in frequency, length, and overall duration. More days per week may increase impact until tutoring crowds out other learning inputs. Net of opportunity costs, one might expect longer sessions to yield stronger impacts until attention span or retention becomes an issue. Reading Recovery calls for daily 30-minute sessions, whereas Number Rockets calls for 40-minute sessions three or more times per week. Saga Education consists of daily 55-minute sessions. Program durations vary from several weeks to 2 school years, although most programs in our sample lasted between 10 weeks and 1 school year. In some interventions, students who improve more end participation earlier. Reading Recovery lasts 12 to 20 weeks, depending on the reading improvement rate. Given potential counterweighting between more instruction time and potential drawbacks like opportunity costs, attention span, and stigmatization (Marston, 1996), optimal tutoring dosage likely varies with context.
Method
To synthesize findings from the RCT tutoring research, we draw on recent advances in meta-analysis methodology (Pigott & Polanin, 2019). The “study”—defined as the enactment of a research design with a particular sample—constitutes the main level of analysis. We collected all eligible articles and aggregated them by study. Most studies reported multiple estimates (e.g., different measures, treatment arms, or subsamples). A study was included if it contained one or more estimates meeting the following criteria:
compares tutored to nontutored groups (excludes estimates where tutoring is bundled with other interventions or different tutoring models are compared to one another);
intended for students in prekindergarten through Grade 12;
RCT study design;
academic learning outcomes from independently created tests; researcher-designed measures were excluded because they may inflate effect sizes (Slavin & Madden, 2011);
published between 1980 and our final searches in February 2020 (although we used updated published versions if released between February 2020 and April 2023);
data required to calculate ES included in the article;
outcomes measured 3 months or less following intervention.
To identify eligible studies, we searched academic (Academic Search Complete, APA PsycInfo, Child Development & Adolescent Studies, EconLit, Education Abstracts, ERIC, JSTOR, SCOPUS, Web of Science), working paper (J-PAL, NBER, SSRN), university thesis/dissertation (Proquest Dissertations), and evaluation report databases (American Institutes for Research, Mathematica, MDRC, and NORC). We searched each database using the terms “tutor* & random*” (with asterisks indicating wildcard) or the closest equivalent given the specific setup of each database. We also conducted backward/forward bibliographic searching for each included article and several meta-analyses. Screening and coding were conducted by the first author with spot checks from research staff. All ambiguities were discussed with the full research team. Figure S2 (available online) shows the number of articles identified within each source.
Following recent consensus, we calculated Hedges’g for the meta-analysis rather than relying on author-reported ESs (Pigott & Polanin, 2019). We used adjusted means and unadjusted standard deviations where reported and otherwise unadjusted means (Dietrichson et al., 2017, p. 255). To analyze the resulting dataset, we calculated pooled ESs and ran metaregressions using the user-written Stata program robumeta, which employs random-effects models with inverse variance weights and robust variance estimation (RVE) to avoid overweighting studies with more estimates (Tanner-Smith & Tipton, 2014). Our primary estimates consist of pooled ESs calculated for the full study sample and for relevant subsamples. To explore heterogeneity, we present 95% prediction intervals, which indicate “how widely the effects vary across populations” (Borenstein et al., 2017, p. 9). Additionally, we report Q and τ2 values to show how the dispersion of observed and true effects, respectively, changes across estimates (Borenstein et al., 2017, pp. 11–12). We further add potential moderators as controls in multivariate metaregressions to explore associations at a greater level of nuance. Moderators are tested in clusters arranged to maximize insights while allowing sufficient statistical power. Although reliable power calculation approaches using RVE have yet to evolve, we follow the guideline of omitting significance tests with fewer than four degrees of freedom (Tanner-Smith & Tipton, 2014). All variables are coded as dummies, with the reference category encompassing estimates lacking the characteristic in question. Analysis of the quantitative results is accompanied by narrative analysis.
We took several measures to guard against influence from bias within studies and bias relating to the selection of studies (e.g., publication bias and small-study effects). With regard to bias within studies, limiting the sample to RCTs eliminated many quality issues usually faced in meta-analyses. Nonetheless, we coded studies for “risk of bias” (Pigott & Polanin, 2019). Our criteria are inspired by the Cochrane framework (Higgins et al., 2011), but we focus on three dimensions: the extent to which studies systematically reported information on (a) the intervention, (b) study design, and (c) relevant statistics. We created a bias risk index ranking studies from 1 to 3 on each of the aforementioned dimensions. Summing these scores yielded a 9-point index, with 1 representing the highest risk of bias and 9 representing the lowest. We then classified studies earning 8 or 9 points as “high bias risk” and the rest as “low bias risk.” Scores for each dimension are included in our dataset.
Publication bias—“one of the biggest threats to the validity of meta-analytic results”—occurs when “studies with no novel or positive results take more time to publish or are not published at all” and are thus “less likely to be included in the meta-analysis” (Fernández-Castilla et al., 2021, p. 125). Other forms of selection bias could also affect meta-analysis results, for example, if results affect the likelihood of an article appearing in databases or if authors selectively report results. A range of selection bias tests have been widely used over the past few decades, and the last several years have seen a proliferation of simulations optimizing these tests in a range of contexts (Marks-Anglin & Chen, 2020). Two main challenges remain. First, it is difficult to distinguish publication bias from situations where smaller scale programs actually generate larger impact, as when implementation is stronger or implementers more skilled. Such dynamics are important to consider when interpreting external validity but do not constitute bias. Second, formal tests in the context of RVE (Skeen et al., 2019, p. 4) and between-studies heterogeneity (Marks-Anglin & Chen, 2020, p. 729) remain poorly understood, with fluctuations in error rates and statistical power across study designs (Fernández-Castilla et al., 2021). For heterogeneous analyses like ours, it is “unrealistic to expect to disentangle the effects of publication bias and heterogeneity reliably” (Peters et al., 2010, p. 575).
We thus take three main approaches in generating suggestive evidence on selection bias. First, we compare ESs of published articles against those of unpublished articles at several sample size levels to parse out selection bias specific to the publication process. Second, we use a modified version of the Egger's regression test to statistically assess selection bias. Traditional Egger's tests regress ES on study-level standard error, but ESs are mechanically dependent on standard errors. Although traditional Egger's tests inflate Type 1 errors, replacing the standard error with a different variance indicator can remove the problem (Pustejovsky & Rodgers, 2019, p. 59). Therefore, we replace the standard error with the term Wi as defined by the equation:
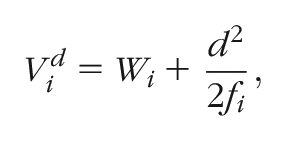
where
Results
The search and screening process yielded 89 studies. Table S1 (available online) lists all included studies along with relevant details. Table 1 shows the breakdown of the studies over intervention and study characteristics, disaggregated by subject and tutor type. Most categories are not mutually exclusive at the study level.
Study Characteristics
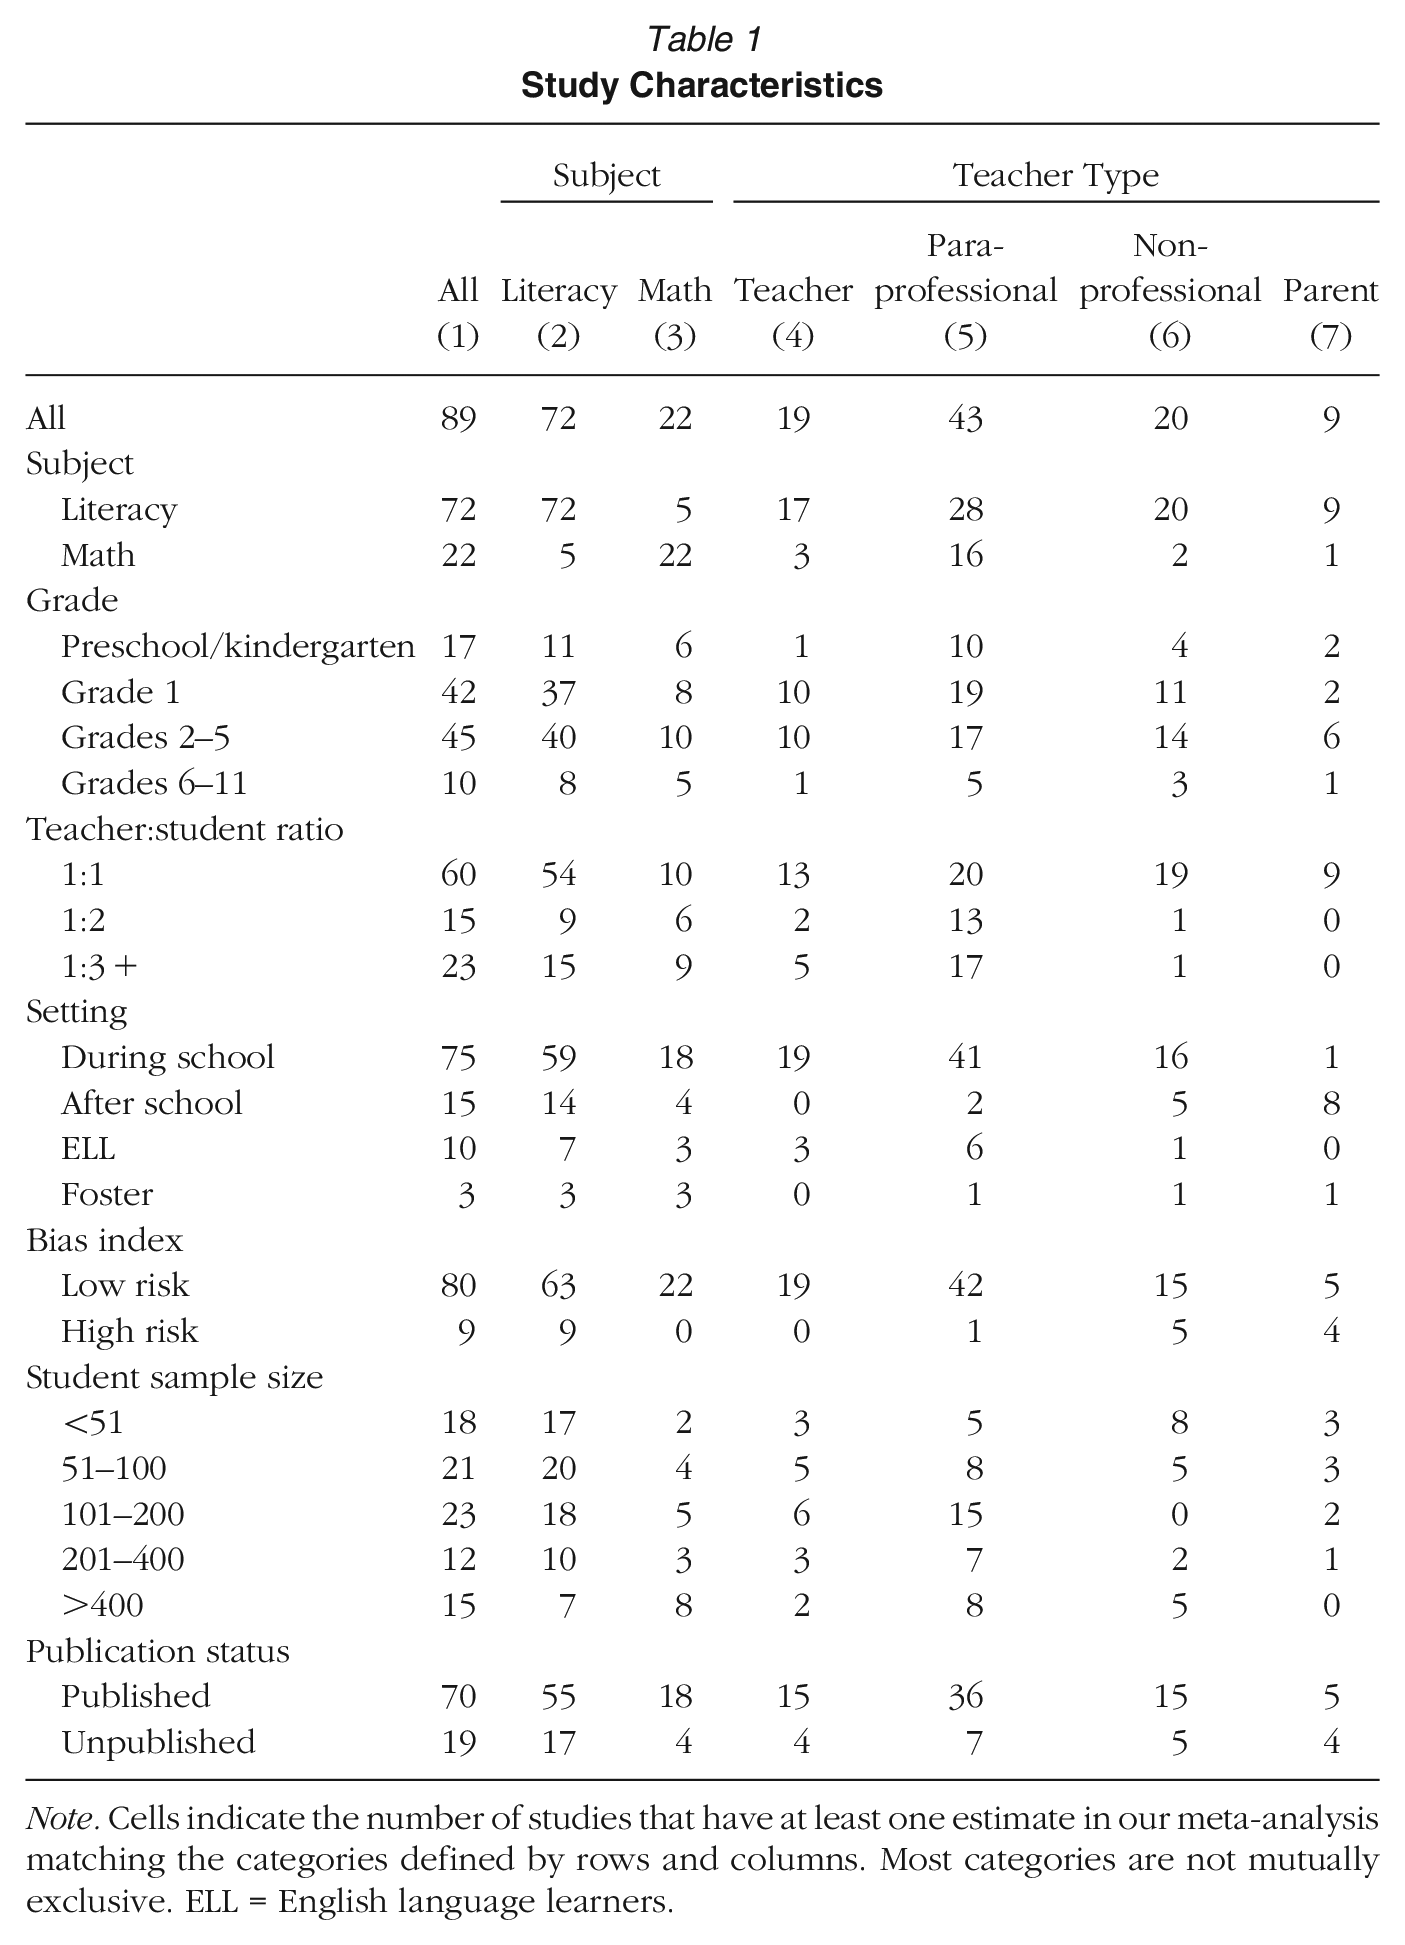
Note. Cells indicate the number of studies that have at least one estimate in our meta-analysis matching the categories defined by rows and columns. Most categories are not mutually exclusive. ELL = English language learners.
Literacy tutoring is far more common within our sample (81%) than math tutoring (25%). Paraprofessional tutoring accounts for the largest share of tutor type with nearly half of the study sample, followed by nonprofessional, teacher, and then parent tutoring. Almost all math interventions utilized paraprofessional tutors. Studies cluster overwhelmingly within elementary school, with fewer than 20% of interventions involving students in sixth grade and above. Almost half of all studies include first grade. During-school tutoring (84%) is more common in our sample than after-school tutoring (17%). Most variation comes from paraprofessional and nonprofessional tutoring because all teacher tutoring interventions in our sample occurred during school and all but one parent tutoring intervention occurred outside of school hours. Nearly 70% of studies include one-to-one tutoring, whereas about a quarter include treatment arms with three or more students per tutor. A relatively small but nonnegligible handful of studies looks specifically at effects of tutoring interventions for English language learners (ELL) and foster students. We coded studies into these categories if they were specifically discussed as part of the program model or if at least half of the sample was listed as falling into the category.
We next address our main research questions, the extent of tutoring impact and variation in impact over program characteristics and contexts. Tables 2 and 3 show pooled ESs of study subsamples broken down by subject, grade level, and tutor-student ratio and additionally separate each into the four tutor type categories. Tables S2A and S2B (available online) show the same categories separated out by grade level instead of tutor type. ESs and standard errors given below for specific studies are averages of the ESs presented in the study, and these are included for all studies in Table S1 (available online).
Pooled Effect Sizes: Program Characteristics by Tutor Type
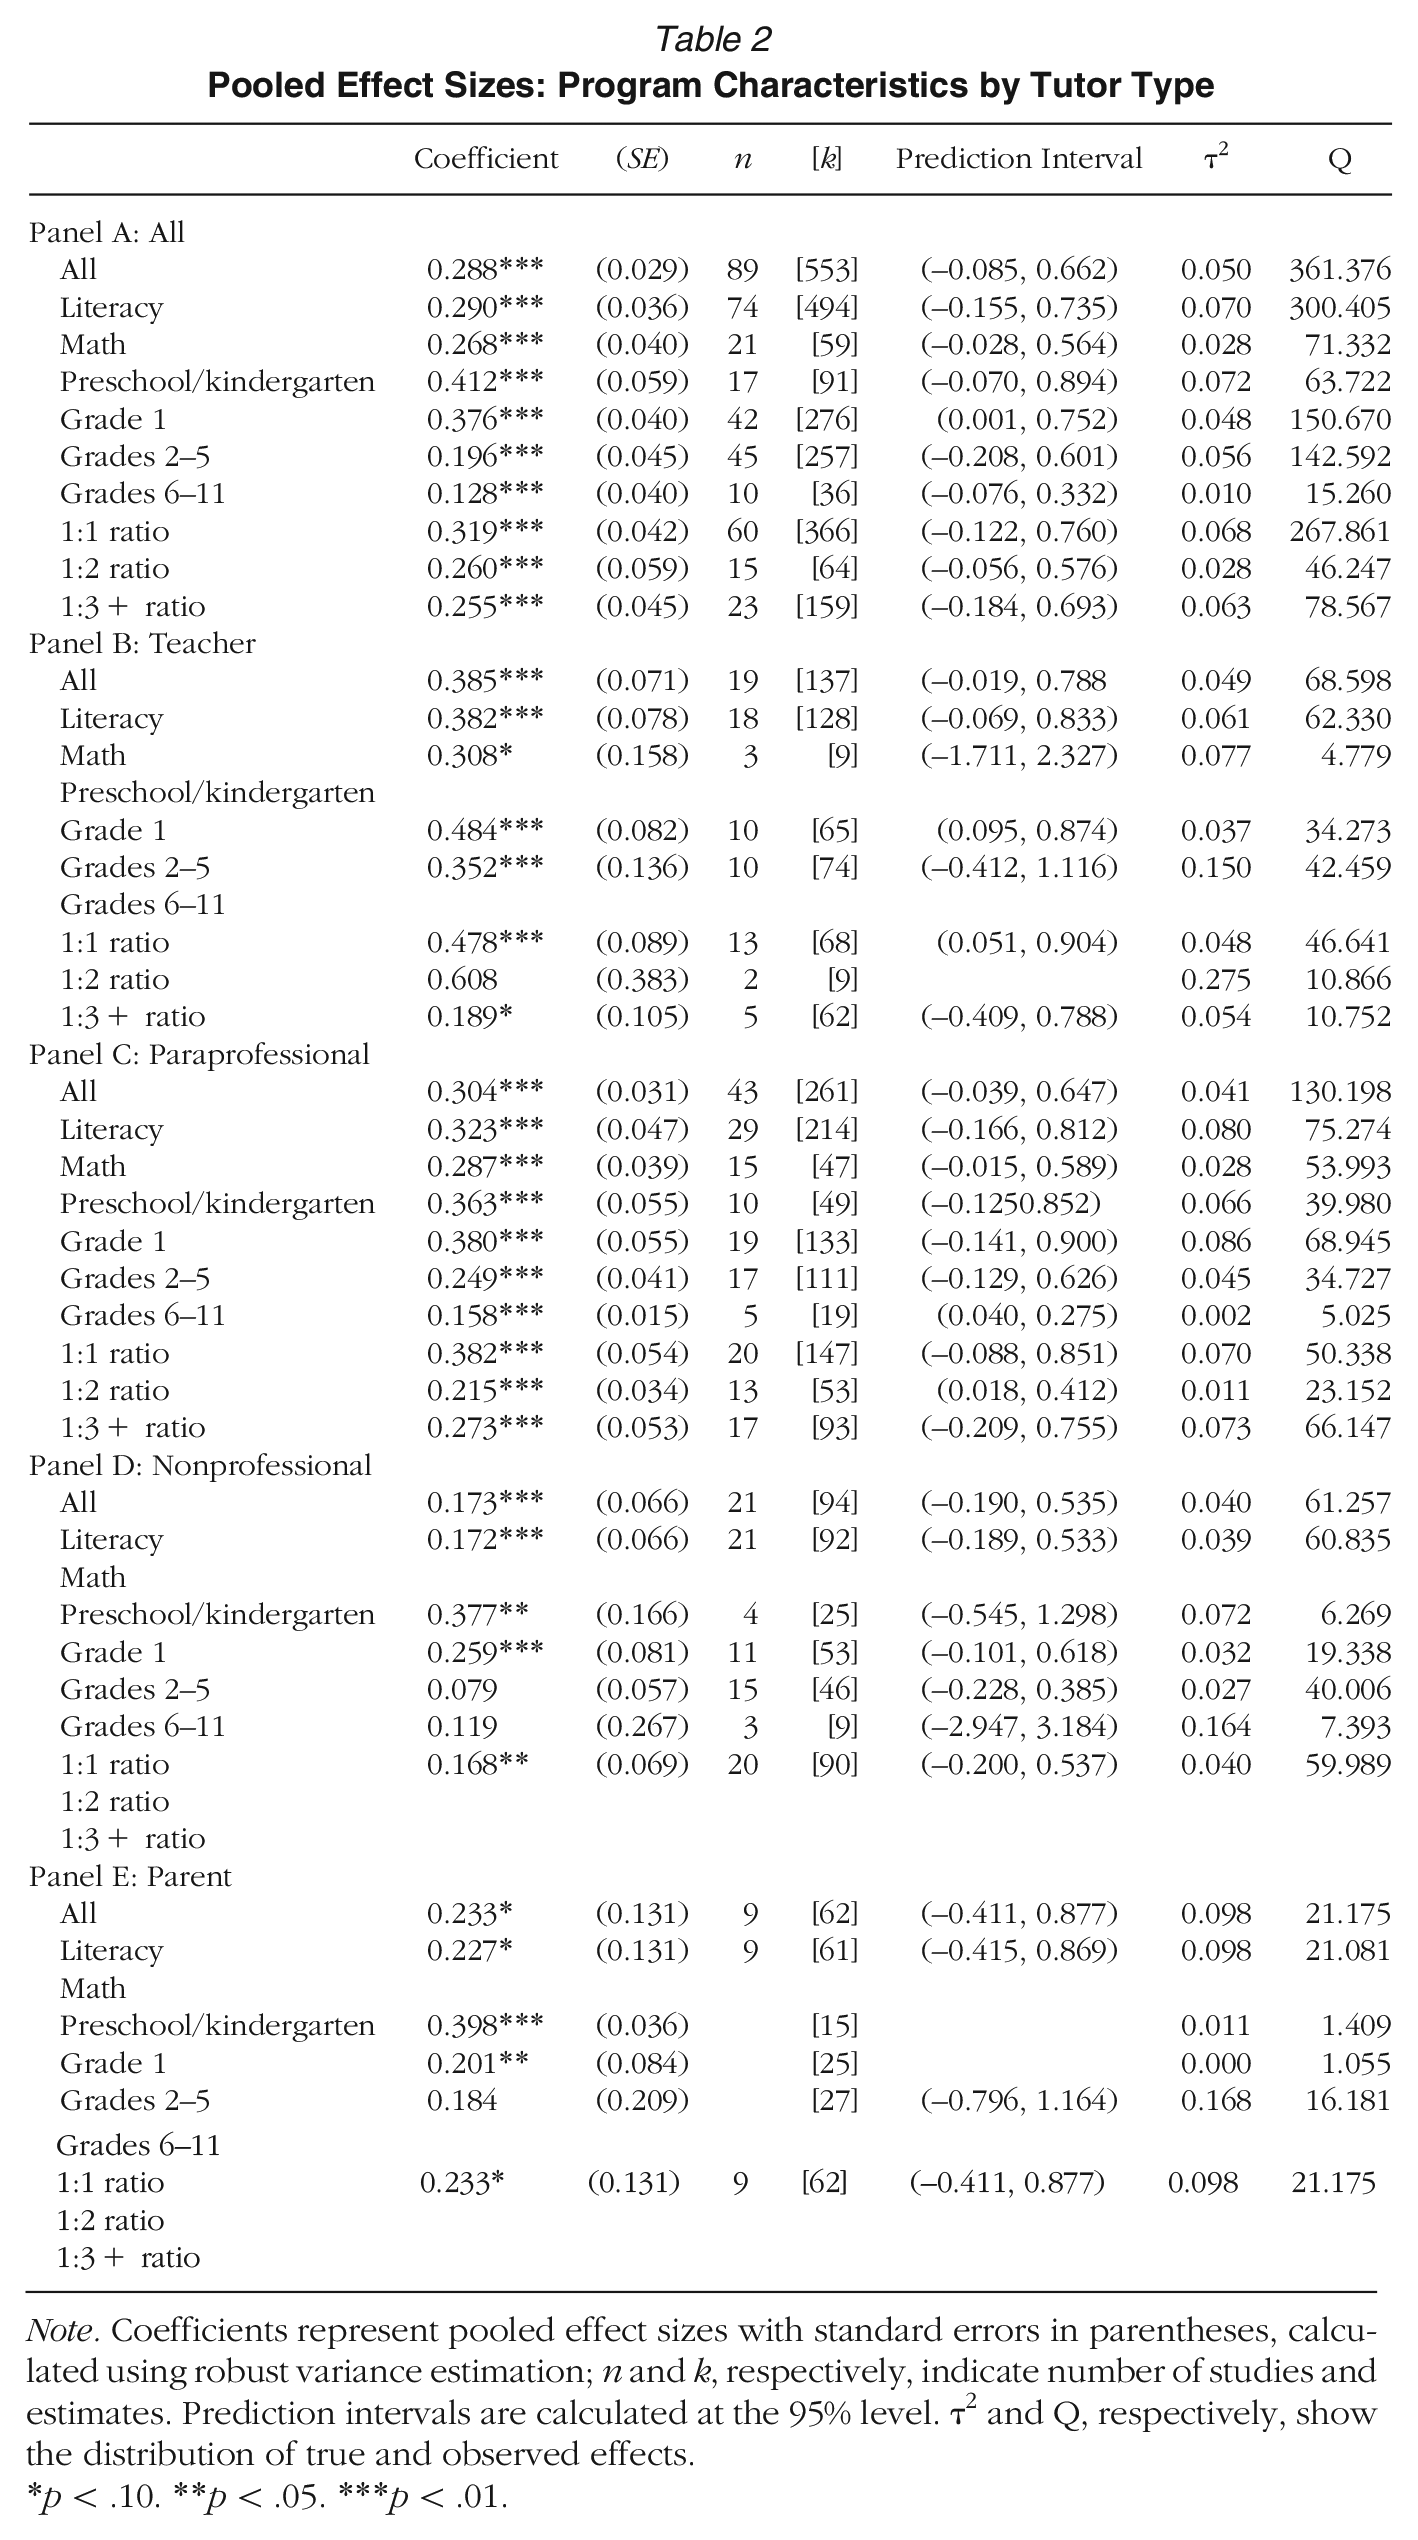
Note. Coefficients represent pooled effect sizes with standard errors in parentheses, calculated using robust variance estimation; n and k, respectively, indicate number of studies and estimates. Prediction intervals are calculated at the 95% level. τ2 and Q, respectively, show the distribution of true and observed effects.
p < .10. **p < .05. ***p < .01.
Pooled Effect Sizes: Program Characteristics by Tutor Type
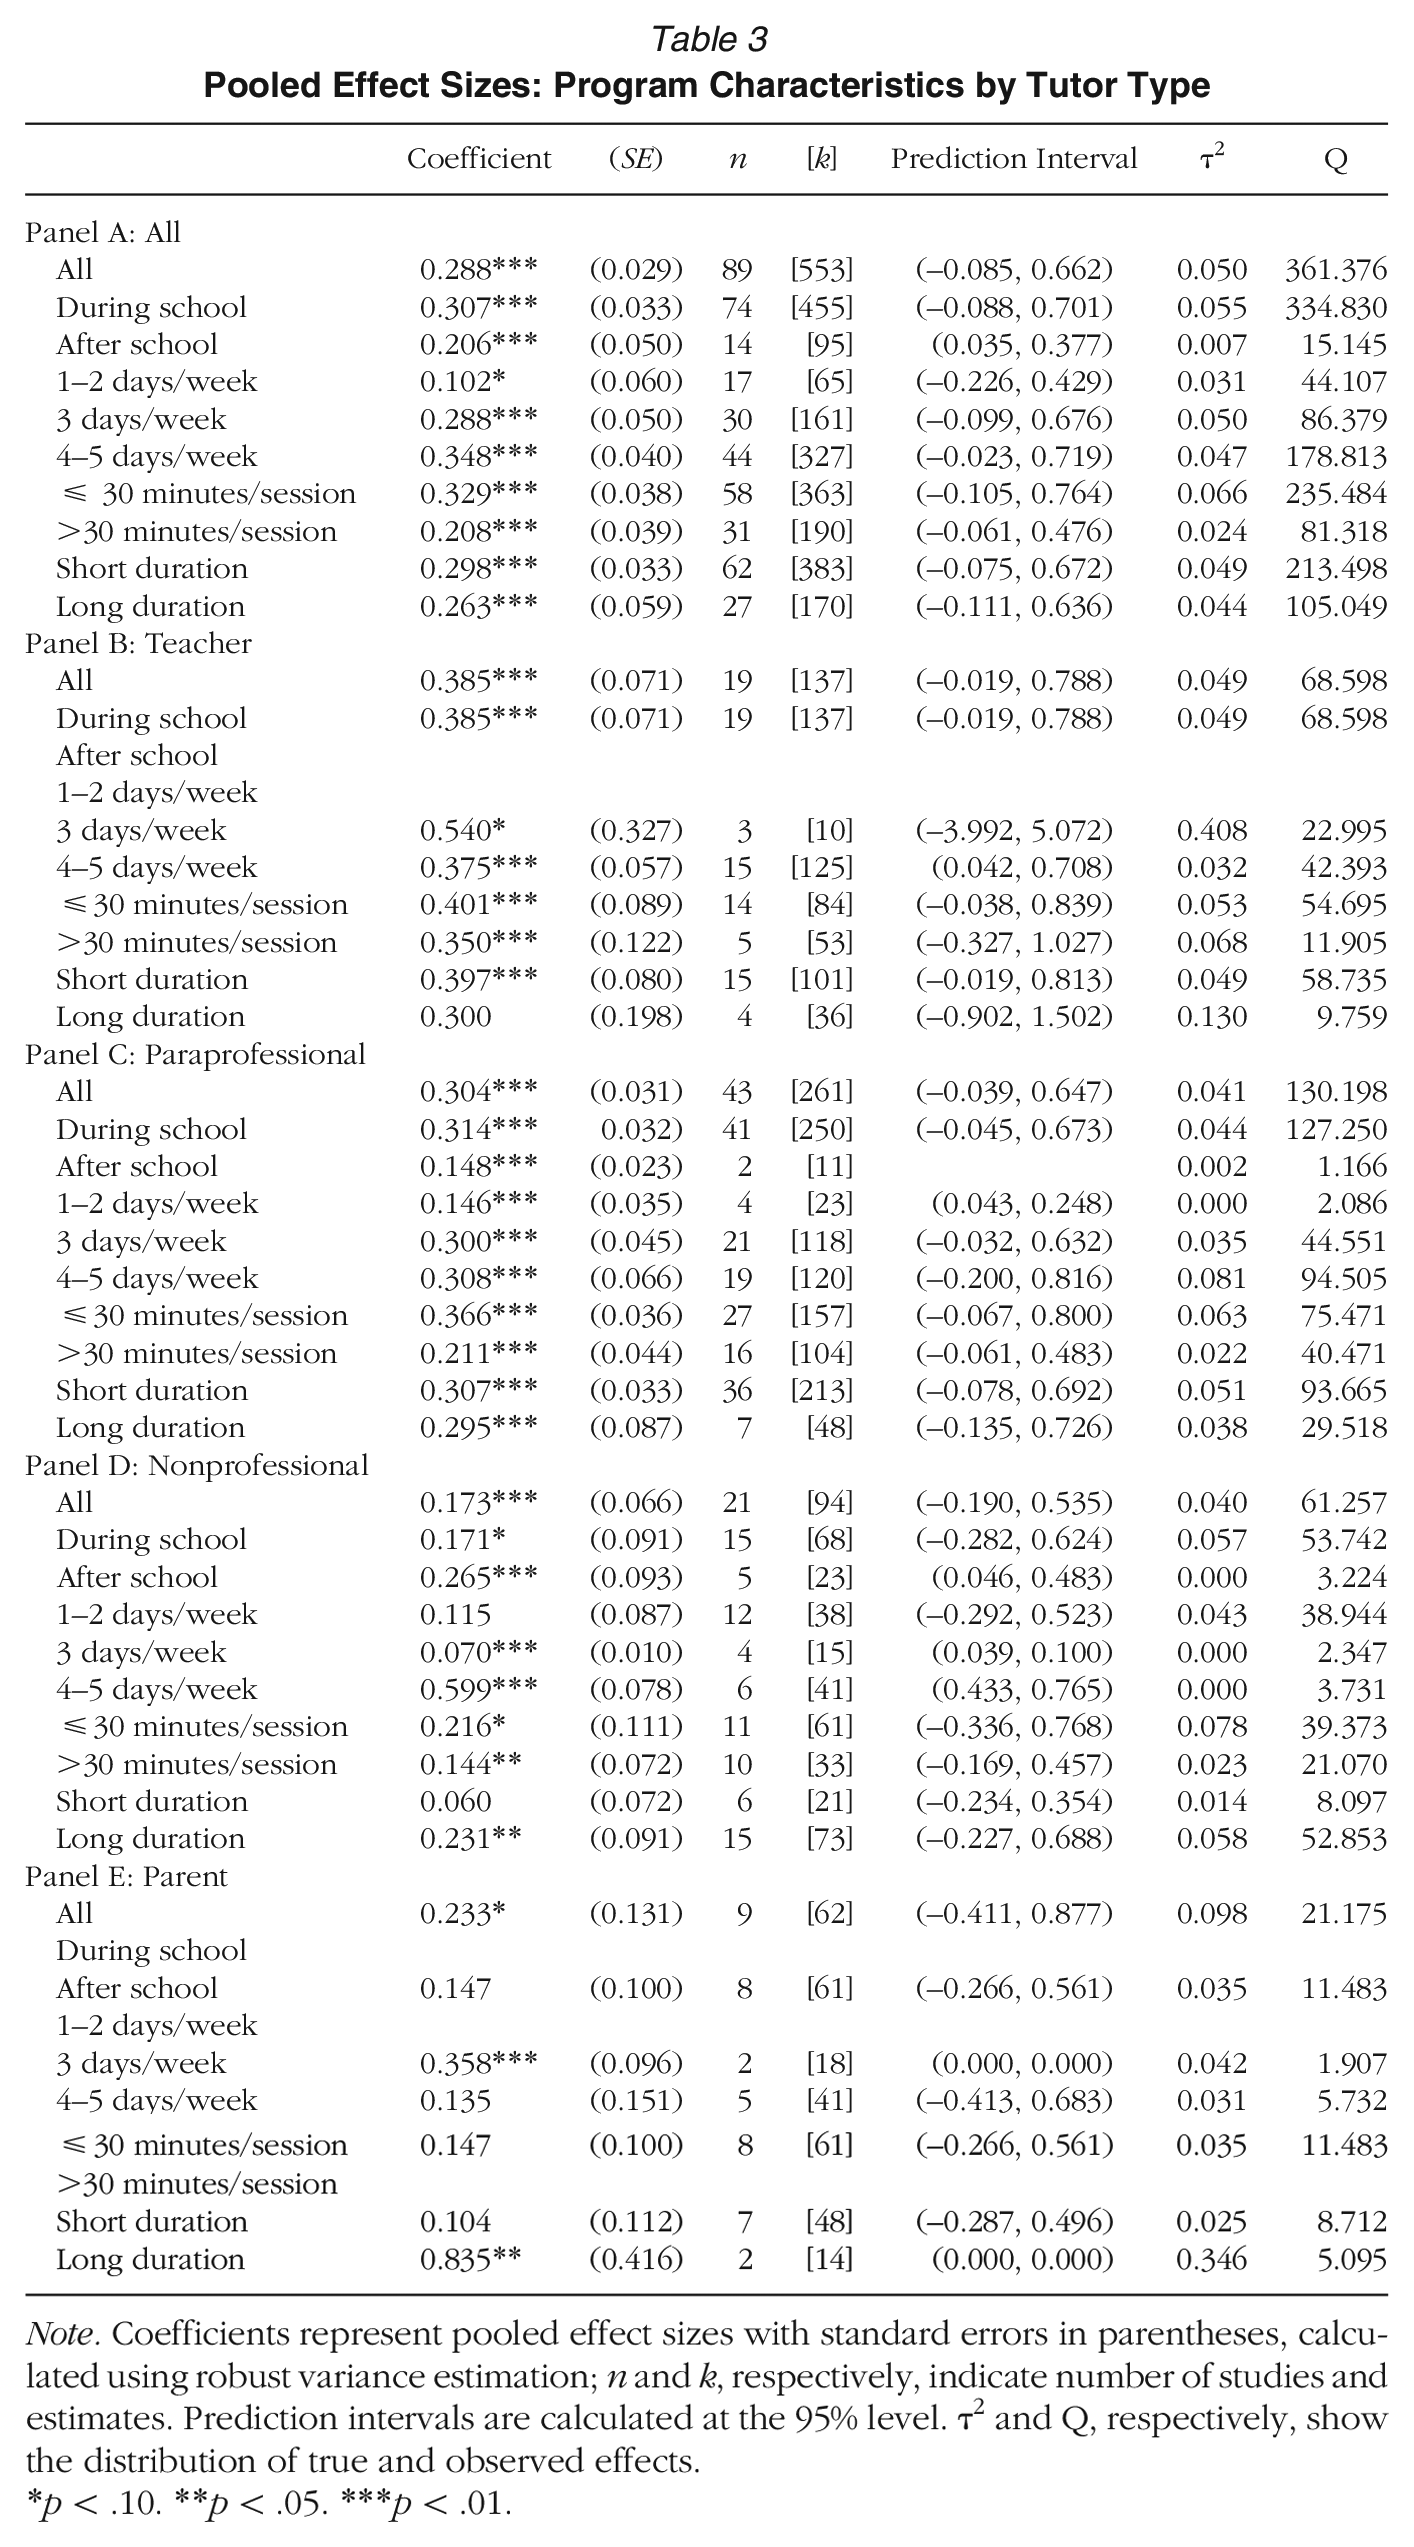
Note. Coefficients represent pooled effect sizes with standard errors in parentheses, calculated using robust variance estimation; n and k, respectively, indicate number of studies and estimates. Prediction intervals are calculated at the 95% level. τ2 and Q, respectively, show the distribution of true and observed effects.
p < .10. **p < .05. ***p < .01.
The central lesson is that tutoring interventions exert meaningful effects on learning across a wide range of program characteristics. ESs are positive and significant for the vast majority of subgroups. The top left cell of Table 2 reveals that across all included estimates and studies, tutoring interventions show a statistically significant and substantively large ES of 0.288 SD (SE = 0.029). Table 2 also reveals that teacher tutoring programs yield the largest impacts, followed closely by paraprofessional tutoring programs, with nonprofessional and parent tutoring accounting for the lower end of the impact distribution. Despite generally large coefficients and high significance, the estimates show substantial heterogeneity. Prediction intervals for each category extend from well below 0 to nearly a full standard deviation in the full and teacher tutoring samples. Paraprofessional tutoring shows less heterogeneity than teacher tutoring with a prediction interval that barely crosses the zero line. Nonprofessional tutoring has even less heterogeneity but also a smaller coefficient.
The advantages of teacher tutoring over paraprofessional tutoring arise most strongly in first-grade interventions, although all occur in grades 1 through 5. Prominent within this category is Reading Recovery, which has been subjected to RCTs spanning 3 decades (Center et al., 1995; Pinnell et al., 1988, 1994; Schwartz, 2005; Sirinides et al., 2018). ESs are substantial, ranging from 0.434 SD (SE = 0.024) in Sirinides et al.’s (2018) large-scale U.S. evaluation to 0.975 SD (SE = 0.294) in Australia (Center et al. 1995). Effects from other teacher tutoring interventions tend to be high as well, ranging from 0.437 SD (SE = 0.158; Mathes et al. 2005) to 0.992 SD (SE = 0.169; Bøg et al., 2021). Two ELL programs, respectively, showed ESs of 0.355 SD (SE = 0.178; Borman et al. 2020) and 0.491 SD (SE = 0.325; Vaughn et al., 2006). Evaluations of literacy programs for later grades also show promise, but results are more mixed (O’Connor et al., 2002,; Vaughn et al., 2019; Wanzek & Roberts, 2012). Only four teacher tutoring studies focused on math. Smith et al. (2013) tested Math Recovery, a program inspired by Reading Recovery, with a sample of more than 700 students across two states an find an ES of 0.242 SD (SE = 0.072). L. S. Fuchs et al. (2008) observed large ESs in a third-grade math programs, although with a small sample and focused on story problems.
Paraprofessional and nonprofessional tutoring programs also exerted highly significant impact. The most common types of paraprofessional tutors in our sample were interventionists employed by the school (Clarke et al., 2016, 2017; Doabler et al., 2016; Gersten et al., 2015; Jenkins et al., 2004; K. L. Lane et al., 2007; Mattera et al., 2018; O’Connor et al., 2010; Vadasy et al., 2006a, 2006b, 2007; Vadasy & Sanders, 2008a, 2008b, 2008c, 2009, 2010, 2011), education students and trainees (Allor & McCathren, 2004; Case et al., 2014; Denton et al., 2004; L. S. Fuchs et al., 2005, 2013; Jung, 2015; H. B. Lane et al., 2009; Mayfield, 2000; Swanson et al., 2014; Young et al., 2018), postgraduate or civic service fellows (Guryan et al., 2023; Markovitz et al., 2014; Parker et al., 2019), and research team members (Bryant et al., 2011; D. Fuchs et al., 2019; L. S. Fuchs et al., 2009; Gilbert et al., 2013; Toste et al., 2017, 2019). Nonprofessional tutoring programs employed community volunteers (Al Otaiba et al., 2005; Benner, 2004; Jacob et al., 2016; Loenen, 1989; Mooney, 2004; Vadasy et al., 2000; Vadasy, Jenkins, Antil, & Wayne, 1997; Vadasy, Jenkins, Antil, Wayne, & O’Connor, 1997), businesspeople (Baker et al., 2000; S. Miller & Connolly, 2013; S. Miller et al., 2012), older adults (Fives et al., 2013; Lee et al., 2011; Rebok et al., 2004), and undergraduates (Lachney, 2002; Lindo et al., 2018). Finally, parent tutoring programs accounted for the fewest studies. The pooled ES is large but only marginally significant (p < .10). The largest sample parent tutoring study (Lam et al., 2013) evaluated a preschool parent reading tutoring program in Hong Kong with around 200 preschoolers and showed an ES of 0.373 SD (SE = 0.144).
Moving to tutor-student ratio, one-to-one tutoring shows the highest overall effect size, followed by one-to-two. All categories show substantial heterogeneity. Most nonprofessional and parent tutoring programs were one-to-one. For teacher and paraprofessional program, one-to-one showed the largest ESs, with one-to-two and small-group interventions statistically similar.
The grade-level rows in Panel A of Table 2 reveal that at least up until middle school, ESs decline with grade level. PreK-kindergarten interventions have the highest overall ESs. All categories exhibit significant heterogeneity, but heterogeneity is highest for first grade. These differences in pooled ES could at least partially be explained by differences in the sensitivity of outcome tests used in different grades rather than real differences in impact.
Literacy and math program impact are similar, with literacy showing greater heterogeneity. However, Figure S3 and Table S2A (available online) reveal that declining impact over grade levels occurs most strongly in literacy programs. The disaggregation of ESs by subject in Table 2 shows that the smaller pooled ESs for nonprofessional and parent tutoring are driven by reading programs because most math tutoring programs utilize paraprofessional tutors. There are too few math tutoring studies to compare the effects of different math tutor types.
For reading, Vadasy and collaborators evaluated elementary literacy interventions using tutors hired by districts. Students were pulled out of different classes depending on the school. Average ESs for kindergarten range from 0.359 SD (SE = 0.263; Vadasy & Sanders, 2008b) to 0.616 SD (SE = 0.239; Vadasy & Sanders, 2010), with Vadasy et al. (2006a) in the middle at 0.438 SD (SE = 0.246). Programs involving explicit instruction in first grade (Vadasy & Sanders, 2011) and grades 2 and 3 (Vadasy et al., 2006b, 2007) generated average ESs of 0.314 SD (SE = 0.207), 0.343 SD (SE = 0.427), and 0.406 SD (SE = 0.304), respectively. However, the program Quick Reads showed smaller ESs in grades 2 through 4 (Vadasy & Sanders, 2008a, 2008c, 2009) of 0.078 SD (SE = 0.157), 0.174 SD (SE = 0.184), and 0.185 SD (SE = 0.173), respectively.
Run by the AARP foundation, 6 Experience Corps (EC) is a nonprofessional tutoring program that uses “older adults” as reading tutors. At present, operations include around 2,000 tutors and 20,000 students over 23 cities. Lee et al. (2011) evaluated EC with a sample of nearly 900 students across 23 schools in Boston, New York City, and Port Arthur, Texas. Tutors received 15 to 32 hours of training. Different sites selected their own curricula. The program ran for a full academic year, with two to four 30- to 40-minute sessions per week. We calculated the overall average ES as 0.075 SD (SE = 0.067), although the authors reported greater impact among students who received at least 35 sessions (p. 110).
Turning to math, ROOTS constituted the most noteworthy program at the preK-kindergarten level. Here, the school district hired paraprofessional “instructional assistants” as tutors. ESs range from 0.101 SD (SE = 0.177; Clarke et al., 2016) to 0.427 SD (SE = 0.130; Doabler et al., 2016), with Clarke et al. (2017) in the middle at 0.247 SD (SE = 0.112), and are impressive given the lack of other impactful elementary math programs. Mattera et al. (2018) evaluated High 5s, an after-school small-group kindergarten math program using tutors from a nearby teaching college. The effect of High 5s was only 0.140 SD (SE = 0.078), but it was part of a sweeping curriculum change that generated no significant impact.
Moving to elementary math, the first-grade program Number Rockets was evaluated at a small scale (L. S. Fuchs et al., 2005), larger scale (L. S. Fuchs et al., 2013), and in a full-scale multistate impact evaluation with a sample of nearly 1,000 students in 76 schools across four urban districts (Gersten et al., 2015). These showed consistently strong ESs of 0.334 SD (SE = 0.179), 0.243 SD (SE = 0.100), and 0.337 SD (SE = 0.066), respectively. Parker et al. (2019) evaluated a grades 4 through 8 math intervention. The study included about 500 students in 13 of the more than 150 schools in which Number Rockets is available across Minnesota. Tutors were “community members” who had made a year-long commitment to tutoring as part of AmeriCorps. The tutors received 4 days of training and two monthly 2-hour follow-up sessions along with monthly coaching. Tutoring was given for 90 minutes per week across 2 or 3 days for one semester. The study found an ES of 0.173 SD (SE = 0.094) on a standardized math assessment, although the authors reported greater impact for students who attended an hour or more per week for at least 12 weeks.
Guryan et al. (2023) reported on the only major high school program in our sample, SAGA Education, with more than 2,700 boys in Grades 9 and 10 across 12 Chicago public schools. Students were overwhelmingly Black or Hispanic (95%), struggling academically, and eligible for free or reduced-price lunches (90%). Tutors were recent college graduates who were not certified teachers but committed to tutoring for a year with a small stipend. Tutoring occurred in 55-minute sessions daily for a full school year, with one tutor and two students in each session. Control group students were assigned to alternative elective courses. It yielded an impact of 0.168 SD (SE = 0.032) on standardized math scores, which is noteworthy given the rarity of strong impacts in high schools. Treatment on the treated estimates were substantially higher.
We turn next to program delivery characteristics as shown in Table 3 and Table S2B (available online), starting with a comparison of during- versus after-school programs. The pooled ES for during is 0.307 SD (SE = 0.033), substantially larger than after-school tutoring, although the latter is also high in magnitude and significance. The impacts of after-school programs were also less heterogeneous, with a prediction interval entirely above 0. During-school versus after-school variation occurs entirely within paraprofessional and nonprofessional tutoring programs because all teacher programs are during school and all parenting programs after school. Table S2B (available online) indicates that pooled estimates for during-school interventions are higher than after-school in all grade categories except for 6 through 11, for which we do not have enough degrees of freedom to interpret.
Counterintuitively, programs lasting over 20 weeks show a pooled ES smaller than programs under 20 weeks, and those under the median length per session (30 minutes) outperformed those above the median. On the other hand, Table 3 shows that ESs generally increase positively with the number of tutoring sessions per week. However, Table S2B (available online) shows that differences between 3 and 4 to 5 days per week are driven by preschool through grade 1 estimates, whereas grades 2 through 5 show stronger impacts for 3 days than for 4-5 days per week. There is little evidence of once-weekly tutoring sessions generating significant effects. In one noteworthy progression, S. Miller and Connolly (2013) found no significant effects from a weekly reading program for 8- and 9-year-olds in Northern Ireland with nonprofessional tutors recruited through a business network. However, S. Miller et al. (2012) found significant effects from the same program administered twice weekly. Ritter and Maynard's (2008) lack of significant findings may stem from the program's reliance on weekly tutoring sessions. Figure S4 (available online) shows ES by sessions per week plotted graphically. For all three dosage variables, heterogeneity varies positively with ES.
Next, we discuss a series of analyses that tested the sensitivity of the results to study characteristics, including potential bias and other research artifacts. Table 4 presents pooled ESs across groups defined by student and school sample size, publication year, publication type, and risk of bias. ESs reduced slightly in the past decade on average but are nearly identical regardless of bias risk. Impact remains broadly consistent for studies with sample sizes up to around 400. The pooled ES for studies with samples greater than 400 is 0.203 SD (SE = 0.045). After this threshold, ESs plateau. Large ESs within small-sample studies are associated primarily with literacy tutoring, whereas math program effects remain more consistent. The pattern for school sample size is similar but with less decline in ES at larger school sample sizes.
Pooled Effect Sizes by Study Characteristics
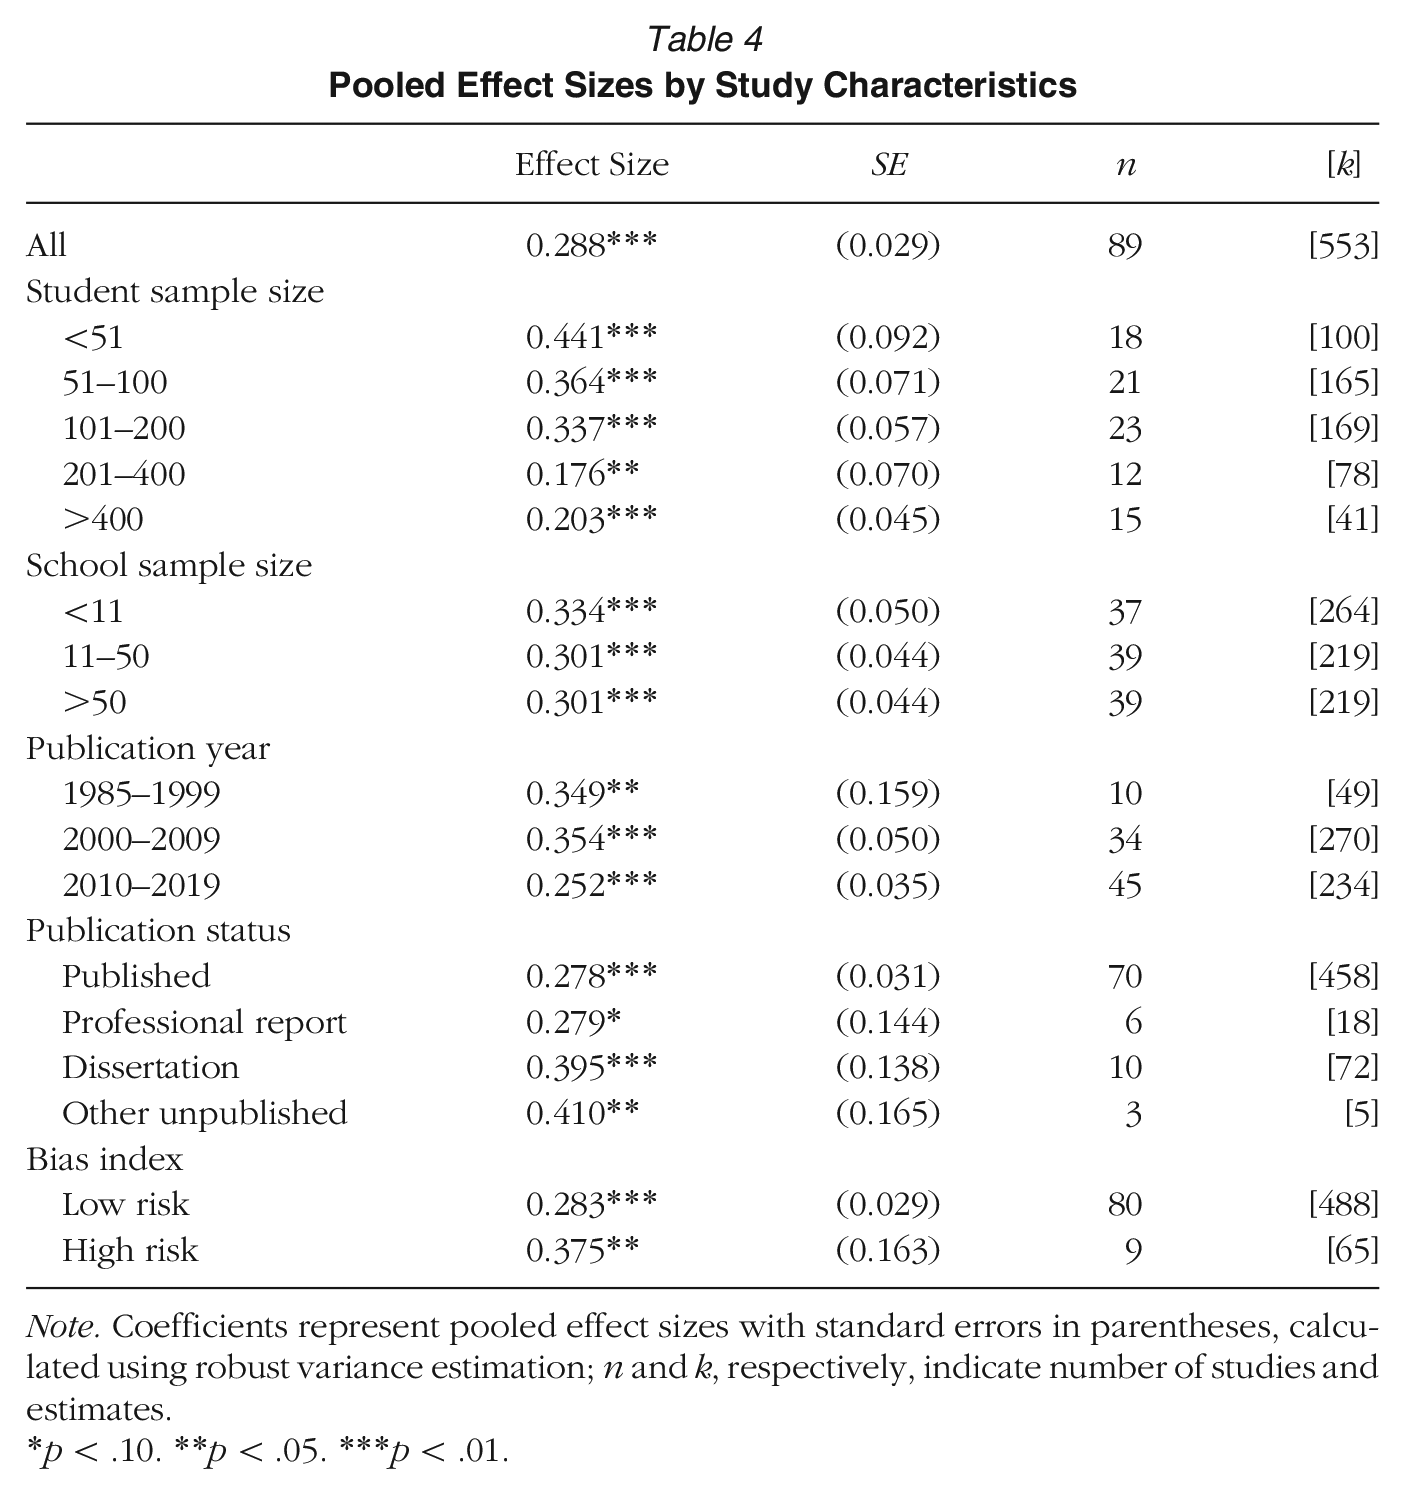
Note. Coefficients represent pooled effect sizes with standard errors in parentheses, calculated using robust variance estimation; n and k, respectively, indicate number of studies and estimates.
p < .10. **p < .05. ***p < .01.
We unpack the connection between student and school sample sizes on one hand and ESs on the other in Tables S3A through S3D (available online). Nonprofessional tutoring programs are almost entirely responsible for weighing down average ESs among larger samples. Teacher tutoring programs remain remarkably consistent across sample sizes. Paraprofessional programs show some decline with sample size, but the pooled ES even at the largest samples remains nearly identical to that of the full study sample. There is an insufficient range of parent tutoring evaluations to identify trends. Figure S5 (available online) shows results graphically via scatter plots with overlaid fractional polynomial regression lines for each tutor type. Tables S3B and S3C (available online) show that sample size trends are similar across the other program characteristics considered in our main ES estimates.
Table S4 (available online) presents multivariate regressions exploring the sensitivity of several of our main findings to the inclusion of variables relating to study characteristics (log sample size, publication status, and bias risk) and dosage (sessions per week). The other dosage variables—minutes per session and duration in weeks—are omitted because they did not reach significance or affect other variables in any specification. The specification in the first column includes only the study characteristics and dosage variables. Columns 2 and 4, respectively, include tutor type (with paraprofessional as the reference category) and curriculum variables (subject with literacy as the reference category and grade level with first grade as the reference category), and columns 3 and 5 add study characteristics and dosage. Column 6 includes all variables. Taken together, the multivariate regressions lend weight to the robustness of our results.
Finally, we turn to a discussion of publication bias. As shown in Table 4, published studies show smaller effect sizes than unpublished studies, making it unlikely that publication bias affected our overall results. To explore the possibility that publication bias is concentrated within smaller sample studies (Fernández-Castilla et al., 2021, p. 125), Table S3D (available online) breaks down ES by publication type across different sample sizes. Although the ES for published studies is higher than unpublished studies within a few sample ranges, the table does not show evidence of a systematic relationship between publication type, sample size, and ES with sufficient magnitude to influence our results. Turning to selection bias more generally, Tables S5A and S5B (available online) replicate the main results in Tables 2 and 3 using a modified Egger's test. The coefficient for precision is significant in several cells, but impact changes little. Figure S6 (available online) shows this graphically, with a mostly symmetrical funnel plot. Especially given the likelihood that these tests are also picking up treatment heterogeneity and small study effects unrelated to bias, they suggest that our overall results are unlikely to be meaningfully affected by selection bias.
Discussion
Among the most widely relied on and dynamic educational tools available for educators and policymakers today, tutoring has been promoted as an effective method for improving education. In this review, we found that tutoring programs yield consistently substantial positive impacts on learning, with an overall pooled ES of 0.288 SD (SE = 0.029). Impacts are strongest for programs that use teacher or paraprofessional tutors, occur in earlier grades, are held 3 or more days per week, and are conducted during school. In the remainder of this section, we review limitations faced by the study, position our results within the broader preK–12 evaluation meta-analysis literature, and discuss implications for policy and research.
Limitations
This review faced several limitations. First, as for all reviews, our findings are limited to programs that have been evaluated, in our case, through RCTs. Second, pedagogical characteristics of tutoring interventions remain mostly black-boxed within our analysis. Curriculum attributes were too subtle and multifaceted for us to reliably code, and we felt that an examination at that level of nuance would be better approached by an education psychology review. Third, in many cases, control group students may have received tutoring or other remedial activities, which would downwardly bias results. Fourth, because of resource limitations, screening and coding was conducted exclusively by one author, albeit with random spot checks from research staff. These limitations also precluded classification of excluded articles according to reasons for exclusion and a more detailed risk of bias measure.
Findings in Context
To contextualize our findings, we compare them to other meta-analytic estimates of preK–12 interventions. Following Kraft (2020), we used ES as a metric for comparison with the following general thresholds: “Less than 0.05 is small, 0.05 to less than 0.20 is medium, and 0.20 or greater is large . . . based on the distribution of 1,942 effect sizes from 747 RCTs evaluating education interventions with standardized test outcomes” (p. 247). Because ESs are likely to differ across contextual domains such as grade level, subject, and sample size, ESs are primarily useful for comparison among closely related potential policy alternatives, which we have attempted to facilitate in our disaggregated tables. As a broadly intuitive benchmark for considering the results, a 0.40 SD achievement gain is expected during the fifth grade, including school and all other education inputs (Bloom et al., 2008; Kraft, 2020, p. 247).
Our overall pooled ES estimate of 0.288 SD approaches that of Ritter et al. (2009), the last meta-analysis of tutoring RCTs, which found an ES of 0.30 SD (SE = 0.061) among K–8 volunteer tutoring programs. When reducing our sample to paraprofessional and nonprofessional tutoring in grades K through 8 to more closely match Ritter et al.’s scope, we found 0.266 SD (SE = 0.033).
A series of recent reviews explored the impacts of alternative intervention types, including tutoring on learning outcomes. Of these, Dietrichson et al.’s (2017) meta-analysis of program impacts for low-SES elementary and middle schoolers covers the range closest to ours, including both literacy and math at the K–8 grade levels. Their study yielded a pooled ES for tutoring programs of 0.36 SD. Meanwhile, they estimated the next highest ESs at 0.32 SD, 0.24 SD, and 0.22 SD, respectively, for “feedback and progress monitoring,”“small-group instruction,” and “cooperative learning.” In addition to showing stronger impacts, the tutoring research base is more robust: Although 36 studies are included in the tutoring estimate, the other three estimates are based on findings from only five, four, and ten studies, respectively. The remaining ten intervention components show ESs below 0.20 SD (Dietrichson et al., 2017, p. 268).
Turning to narrower subject and age coverage, Pellegrini et al. (2021), in their meta-analysis of 66 K–5 math programs, found a pooled ES of 0.20 SD from 22 tutoring studies—similar to our finding of 0.262 SD (SE = 0.043) for the subsample of studies focusing on K–5 math programs. Seven studies on professional development training for classroom management had a similar ES of 0.19 SD, but the six other program categories included in the review showed lower or nonsignificant ESs. Meanwhile, Neitzel et al. (2022) reviewed reading tutoring programs alongside multitiered whole-class/whole-school and whole-class approaches and technology-supported adaptive instruction. They found a pooled ES of 0.26 SD for elementary reading tutoring programs (p. 172), similar to our finding of 0.294 SD (SE = 0.038). Multitiered and whole-class approaches performed comparably with tutoring at 0.27 SD and 0.31 SD, respectively (pp. 160–161), whereas the technology interventions only yielded a nonsignificant 0.09 SD (p. 162; although for promising findings on technology interventions, see Escueta et al., 2020). Baye et al. (2019) reported similar results for secondary reading tutoring programs, finding a pooled ES of 0.24 SD for tutoring—nearly twice that of the program categories with the next largest impacts, “writing focused” and “personalization” programs, both with ESs of 0.13 SD (p. 142).
We next compare our findings of the relative impact of alternative tutoring program types to those from the other recent reviews. Our finding that teacher and paraprofessional tutoring programs yield nearly identical impact matches results from other recent analyses. Dietrichson et al. (2017, p. 269) found a small positive but nonsignificant advantage of 0.06 SD for professional over nonprofessional tutors (the former category corresponds to our “teacher tutoring” category, and the latter includes the categories that we label “paraprofessional” and “nonprofessional”). Similarly, Pellegrini et al. (2021, p. 22) found that there were similar impacts whether the tutoring was given by teachers (0.24 SD) or teaching assistances (0.18 SD) for K–5 math programs. Neitzel et al. (2022, p. 172) found similar ESs whether tutors were teachers or teaching assistants: 0.34 SD for teachers, 0.29 SD for teaching assistants, 0.36 SD for paid volunteers, and 0.04 SD for unpaid volunteers. The differences between teachers, on one hand, and teaching assistants and paid volunteers, on the other hand, were not statistically significant; the differences between teachers and unpaid volunteers were statistically significant. Neitzel et al. considered this to be their “most practically important finding” (p. 172). On the other hand, Slavin et al. (2011) found stronger impacts from teachers. Nonetheless, the evidence on balance is consistent with tutoring skills as distinct from the skills required for effective classroom teaching (Guryan et al., 2023).
Another key finding from our analysis was the decline in impact with more students per tutor. This finding is also in line with previous reviews. Neitzel et al. (2022, p. 170) found an effect size of 0.41 SD for one-to-one tutoring and 0.24 SD for small-group tutoring. Gersten et al. (2020) also estimated a larger effect size for one-to-one tutoring relative to small group, but they found it statistically nonsignificant. Dietrichson et al. (2017) also found a positive, nonsignificant coefficient for group relative to one-to-one tutoring, but with sufficient magnitude to signify likely importance. Baye et al. (2019, p. 142), for secondary school reading programs, found that small-group tutoring has a magnitude only half that of one-to-one tutoring (0.14 SD vs. 0.28 SD), and the impact is nonsignificant. On the other hand, Wanzek et al. (2016) found no advantage for one-to-one over small-group tutoring, and Pellegrini et al. (2021) estimated a higher ES for small-group than for one-to-one tutoring: 0.30 SD and 0.19 SD, respectively.
A fourth important finding from our review is that impact tends to decline across grade levels, with literacy programs seeing the sharpest decline. This is consistent with previous findings that “the critical period for language development occurs early in life, while the critical period for developing higher cognitive functions extends into adolescence” (Fryer 2017, p. 104). More broadly, ESs for math programs in our sample are less variable than for literacy.
With regard to program dosage, we found that more tutoring sessions per week are associated with stronger impact, but longer sessions and overall program duration are not. Although our study is the first to our knowledge to examine the correlations between session frequency and length, on one hand, with ES, on the other, others have found, like us, that longer duration may be associated with weaker impact (Dietrichson et al. 2017, p. 274; Wanzek et al. 2006; 2013).
Implications for Policy
In recent years, tutoring has gained interest among policymakers seeking solutions for students facing learning struggles. Some states and school districts are developing their own tutoring programs, whereas others are expanding existing operations. 7 Although a great deal remains to be learned to optimize tutoring, the present article presents results that robustly support several propositions. The overall impact of tutoring programs across a variety of settings is encouragingly high. The consistency of ESs above 0.20 suggests tutoring is one of the most effective strategies for generating meaningful improvement in academic achievement. The key policy challenge, then, becomes optimizing program quality while keeping costs low.
As discussed above, tutor category represents a central determinant of tutoring program costs. Our review suggests that paraprofessional tutoring is likely to offer the most cost-effective option of the four categories reviewed in the widest range of contexts, given strong impacts alongside low hourly tutor wage requirements. Although some nonprofessional tutoring programs have shown promising results, pools of potential tutors may be limited, and these programs typically allow less scope for training and dedicated commitment. The experimental parent tutoring research is still too thin for policy lessons. However, implementers generally have less control over parent tutoring than other types, and it may be best to approach parent engagement from a broader family support perspective to ensure complementarity with parents’ other roles. Teacher tutoring is generally impactful, but it may be prohibitively expensive (Neitzel et al., 2022, p. 156). Moving toward teacher-led small-group tutoring could be an alternative approach to reducing costs, but our analysis and other recent reviews showed a greater differential between one-to-one and small-group tutoring than between teacher and paraprofessional tutoring. Although it is certainly plausible that certified teachers may be most efficient in some contexts, it seems best to default to paraprofessionals unless skills specific to certified teachers are required.
In particular, paraprofessional school staff members and recent graduates in professional fellowship programs represent promising bodies of potential tutors. Tutoring and other in-school intervention activities may represent a viable and fulfilling career path for individuals who might not otherwise enter the education sector. Programs that employ paraprofessional school staff members as tutors may save on administrative costs given their integration into the school and may allow for stability as the programs develop. Relatedly, education-oriented civic programs are becoming increasingly common within the career trajectory of recent college graduates.
Peer, cross-age, and computer-based tutoring represent potential alternative models that show promise in some contexts but come with limitations that make them unlikely to substitute for paraprofessional tutoring. Dietrichson et al. (2017) found an average of 0.22 SD from peer tutoring, whereas Slavin et al. (2009) found 0.26 SD impacts for both peer and cross-age tutoring. These programs may reduce costs relative to paid tutoring and could generate positive spillover effects if tutoring benefits the tutor as well as the tutee. However, it may be difficult to ensure consistently high-quality tutoring from children, and the ethical necessity of ensuring benefit to the tutor and the tutee may present challenges. Computer-assisted learning (CAL) programs are thought to emulate elements of tutoring programs at potentially much lower costs, so much so that adaptive learning programs have come to be known as “intelligent tutoring systems.” The lack of human engagement may remove some of the potential benefits of tutoring, including associating positive human interaction with the educational content (Neitzel et al., 2022, p. 174). However, the conditions under which CAL can be used effectively in conjunction with human tutors or replace it remain to be explored in future research.
In terms of program delivery, our meta-analysis suggests that the extent to which program implementers are able to ensure that tutoring actually occurs at sufficiently high doses may outweigh subtleties in the content being taught. As with many social programs, ensuring fidelity to the original model remains a challenge for many tutoring programs that aim to scale. Although our data do not allow us to address this topic statistically, our review suggests that the relatively lower effects found within after-school and parent tutoring may arise largely from difficulties in ensuring that tutoring occurs as planned.
Future Directions for Research and Policy
Our review highlights numerous areas for future research, but several stand out as particularly critical. For one, there is a large scope for experimental research on high school tutoring. While ESs tend to be highest at earlier grade levels, the most relevant point of comparison for policymakers is typically the opportunity cost of a program relative to other intervention opportunities for that grade level. The Saga Education model represents an especially promising model for expansion given its low-cost success in a secondary setting. Similarly, experimental evaluations of tutoring programs in subject areas other than reading and math, for instance, science or social studies, could open a new area for tutoring policy research.
Another vital research area is unpacking opportunity costs and spillover effects from tutoring. The majority of tutoring experiments so far have been conducted at relatively small scales and focus primarily on pedagogical rather than logistical and general equilibrium issues, but these considerations become increasingly important as programs move toward scaleup. One key issue here is the opportunity cost faced by students when they invest substantial quantities of time in tutoring. For example, what are the implications of students being pulled out of classes for tutoring on the same topics as their tutoring versus different topics or activities? In our sample of studies, 39 reported avoiding pulling students out of the same subjects, whereas only two reported intentionally pulling students out of the same subjects; 10 reported a mix, 15 were held after school, and 20 did not report which subject tutoring was substituted for. Programs that explicitly avoided pulling children out of the same subject had a pooled ES of 0.376 SD (SE = 0.040), whereas those with a mix and those that did not report this showed 0.197 SD (SE = 0.033) and 0.210 SD (SE = 0.076), respectively. The three studies that explicitly replaced the same subject of tutoring did not provide sufficient degrees of freedom for a reliable significance test, but the pooled ES was 0.405 SD. Furthermore, with the exception of a handful of studies in the “mixed” category, studies reported only what was called for by the program model rather than measures of what occurred in practice from field research or monitoring data.
Future research should pay closer attention to measuring specifically what alternative activities tutoring replaces and estimate implications for impact accordingly. They should also attempt to gain a more detailed picture of the specific tutoring or other supplemental programs that control group students received because otherwise, these may downwardly bias estimates of tutoring program impact. Relatedly, future research should measure outcomes for domains outside of the main topic of tutoring. If students are taken out of classes or recreational activities that are unrelated to the topic of tutoring, do scores in other areas go down? Or, conversely, are there synergies by which tutoring on some topics helps students to perform better on other topics? It is also worth testing for spillover effects on nontutored students, particularly given recent findings from Berlinski et al. (2022) that nontutored students in schools where a tutoring intervention took place indirectly benefited.
Next, researchers and practitioners must pay close attention to impacts on equity and average impact. For the most part, it seems likely that tutoring programs following the models evaluated in this review would be on net equity-increasing. The vast majority of programs examined in the tutoring academic and policy literature are implicitly or explicitly conceptualized as remedial and aim to lessen the education gap. However, some types of tutoring may be more equity-inducing than others, depending on their effectiveness for particular groups of students. Although the specific mechanisms explaining such divergences may not be obvious a priori, they may still exert powerful effects. For instance, despite Fryer and Howard-Noveck’s (2020) findings of a modest ES for middle school reading tutoring, effects for Black students were substantially larger, yielding one of the study's most noteworthy findings.
Equity considerations may underscore the importance of free tutoring programs more broadly. Parents of wealthy students, like education researchers and practitioners, have noticed the potential effectiveness of tutoring and have attempted to leverage it. Over the past few decades, private tutoring that households pay for has grown increasingly popular. Increasing the presence and effectiveness of public tutoring systems may thus be important for less advantaged students to keep pace in this environment.
Both equity and efficiency considerations further point toward the importance of identifying the populations of students who could most benefit from tutoring. Students who have fallen behind as a result of structural barriers rather than specific learning disorders may especially benefit from tutoring programs that can set them on self-sustaining pathways toward rapid learning. A relatively distinct literature has already emerged on tutoring for foster children (Hickey & Flynn, 2019). Future studies could also test interventions for other marginalized populations of children whose circumstances may have precluded sufficient preparation for regular school, including incarcerated adolescents (Wexler et al., 2014) and refugees (Naidoo, 2009). And although a growing number of studies investigates the impact of tutoring on learning outcomes for ELL students, this area of research has enormous room for growth as well.
Tutoring programs rank among the most flexible and potentially transformative learning program types available at the preK–12 levels. This review has synthesized and quantitatively analyzed experimental evidence on all programs for which such evidence is available. With ESs averaging 0.288 SD (SE = 0.029) and impacts consistently significant across a wide range of program and study characteristics, our findings demonstrate not only the power of tutoring but also its versatility. As educators grapple with long-standing inequities and newer challenges like the COVID-19 pandemic, there is little doubt that tutoring programs will constitute a central workhorse educational tool.
Supplemental Material
sj-pdf-1-aer-10.3102_00028312231208687 – Supplemental material for The Promise of Tutoring for PreK–12 Learning: A Systematic Review and Meta-Analysis of the Experimental Evidence
Supplemental material, sj-pdf-1-aer-10.3102_00028312231208687 for The Promise of Tutoring for PreK–12 Learning: A Systematic Review and Meta-Analysis of the Experimental Evidence by Andre Nickow, Philip Oreopoulos and Vincent Quan in American Educational Research Journal
Footnotes
Notes
A
P
V
References
Supplementary Material
Please find the following supplemental material available below.
For Open Access articles published under a Creative Commons License, all supplemental material carries the same license as the article it is associated with.
For non-Open Access articles published, all supplemental material carries a non-exclusive license, and permission requests for re-use of supplemental material or any part of supplemental material shall be sent directly to the copyright owner as specified in the copyright notice associated with the article.