
Abstract
This article explores how the associations between student achievement and achievement growth influence our understanding of the role schools play in academic inequality. Using nationally representative data from the Early Childhood Longitudinal Study, Kindergarten Class of 2010–2011 (ECLS-K:2011), we constructed parallel growth and lagged score models within both seasonal learning and school effects frameworks to study how student- and school-level socioeconomic and racial/ethnic backgrounds relate to student learning. Our findings suggest that seasonal comparative scholars, who generally argue that schools play an equalizing role, and scholars focused on school compositional effects, who typically report that schools exacerbate inequality, come to these contrasting findings not only because they ask different questions but also because they treat student initial achievement differently when modeling student learning.
Does schooling reduce academic inequality, or are schools instead key drivers of academic disparities? Or is neither conceptualization correct and schooling is simply a neutral force that sustains preexisting inequalities within and across generations? Addressing this question has been a central focus of education research over the past century. The fundamental issue— not only for research but also for education policy and practice—is whether disparities in student achievement originate primarily inside schools, meaning that schools themselves are engines of inequality, or mainly in nonschool environments, suggesting that schools at worst maintain the status quo.
The first large-scale study to address these questions, the Coleman Report (Coleman et al., 1966), embodied the tensions inherent in these conflicting interpretations of schooling. On the one hand, it reported that school effects on student achievement were quite small compared with the effect of students’ demographic backgrounds. Many readers took this as evidence that inequality originates mainly in families. On the other hand, the study described high levels of segregation between schools and noted that school socioeconomic and racial/ethnic composition was, descriptively at least, associated with student achievement—evidence that schooling might indeed influence inequality.
Although researchers have made important theoretical and methodological strides since the Coleman Report, it continues to shape how scholars interpret, conceptualize, and study academic inequality (Hill, 2017). Importantly, the contrasting arguments whether schools represent the “balance wheel of the social machinery,” as Horace Mann famously argued, or whether they are primarily agents of social reproduction, continue to dominate the literature today (Domina, Penner, & Penner, 2017; Downey & Condron, 2016; Hanselmann, 2018; Jennings, Deming, Jencks, Lopuch, & Schueler, 2015; Raudenbush & Eschmann, 2015; Von Hippel, Workman, & Downey, 2018). A prominent group of scholars stressing schooling’s neutral or even compensatory effect take as their starting point the substantial inequalities in academic skills already present at kindergarten entry. Their argument then leverages seasonal comparisons of student learning to note that early inequalities change little during the academic year but grow wider during the summer months when school is not in session (e.g., Alexander, Entwisle, & Olson, 2001; Downey & Condron, 2016; Downey, Von Hippel, & Broh, 2004; Entwisle & Alexander, 1992; Von Hippel et al., 2018). In contrast, a larger group of scholars over the past several decades has interpreted schools as disequalizing institutions, pointing to the broad array of social and academic school characteristics that influence the equitable distribution of student outcomes both within and between schools (e.g., Bourdieu & Passeron, 1977; Gamoran, 1987; Gamoran & An, 2016; Jennings et al., 2015; Lucas, 1999; Mickelson, 2015; Raudenbush & Willms, 1995).
Each research strand provides robust empirical support for its respective argument. Although their conclusions might seem contradictory, authors have recently pointed out that the two viewpoints simply employ different counterfactuals (Jennings et al., 2015). Studies focusing on the potentially equalizing effects of schooling ask, “What would inequality look like if students were exposed to more (or less) schooling?” In contrast, authors arguing that schools reproduce or even exacerbate inequality ask, “What would inequality look like if students attended identical schools?” Given that the two lines of research ask fundamentally different questions, it is not surprising that they arrive at different conclusions regarding schooling’s role in academic inequality.
In the current article, we go beyond this theoretical distinction to draw attention to a methodological consideration that distinguishes each strand, one that more tangibly explains their disparate conclusions. Specifically, the analytic strategies each camp typically employs differ markedly in how they treat the associations between student achievement at any given point and subsequent achievement growth. Given the large demographic disparities in achievement present across all grades, combined with the links between initial achievement and subsequent learning reported across many contexts (McCall, Hauser, Cronin, Kingsbury, & Houser, 2006), these analytic differences can produce contradictory conclusions regarding patterns of inequality (Quinn, 2015; Ready, 2013).
To highlight these issues, we focus on how a particular set of modeling decisions influences estimates of inequality at both the student and the school level. At the student level, following the seasonal comparison scholars, we focus on socioeconomic and racial/ethnic disparities in student learning during the school year and during the summer, describing how these estimates vary across analytic techniques. At the school level, we explore the links between school socioeconomic and racial/ethnic composition and student learning—a major focus of the inequality scholars—and again examine how the results differ across modeling strategies. We conduct both sets of analyses using data from the Early Childhood Longitudinal Study, Kindergarten Class of 2010–2011 (ECLS-K:2011). Given that these data will be widely used to address questions of inequality, this article seeks to raise awareness of the implicit assumptions and methodological habits that underlie these two research strands.
In the sections immediately below, we first summarize the extant seasonal comparison literature followed by research on school compositional effects. We then compare and contrast the different modeling strategies used within each of these lines of inquiry and discuss how they may have affected their substantive findings.
Schools as Equalizers: Seasonal Comparisons of Student Learning
Research arguing that schools are neutral or even compensatory institutions is based on the counterfactual of what inequality would look like if students were exposed to more (or less) schooling (Raudenbush & Eschmann, 2015; Ready, 2010). Following Coleman, the central argument here is that academic inequalities stem largely from nonschool environments. Because inequality in family characteristics and resources is greater than inequality in school environments, the argument goes, schools have an overall equalizing effect (Downey et al., 2004). Empirical support for this hypothesis has been drawn from studies of policies that extend the length of school days, the number of days in an academic year, and the number of years of compulsory schooling (for a review, see Raudenbush & Eschmann, 2015). Although many studies explore the effects of schooling within exposure frameworks, the most prominent line of research on the equalizing role of schools comes from seasonal comparison studies that conceptualize schooling as a dichotomous treatment that is activated during the school year and deactivated during the summer months (Alexander et al., 2001; Alexander, Entwisle, & Olson, 2007; Burkam, Ready, Lee, & LoGerfo, 2004; Downey et al., 2004; Entwisle & Alexander, 1992; Entwisle & Astone, 1994; Heyns, 1978, 1987; Quinn, Cooc, McIntyre, & Gomez, 2016; Von Hippel et al., 2018). These studies compare student learning during the school year with student learning that occurs during the roughly 3-month summer break when school is not in session.
The early seasonal comparison studies simply calculated student achievement gains during the school year and summer by subtracting student test scores at the beginning of a given period from those at the end of the period (Entwisle & Alexander, 1992; Entwisle & Astone, 1994; Heyns, 1978, 1987). These authors found no associations between student socioeconomic status (SES) and achievement gains during the school year, but they reported that high-SES students gained more than their low-SES peers during the summer break, findings that these authors interpreted as evidence of schooling’s equalizing effects. Given their focus on Baltimore and Atlanta in the 1970s and 1980s, these authors also examined racial/ethnic inequalities between Black and White students. Importantly, the results regarding Black/White inequalities provided less consistent support for the compensatory argument.
Using growth modeling within multilevel frameworks and data from the first cohort of students from the ECLS-K:1999 to model learning during kindergarten, first grade, and the intervening summer, Downey et al. (2004) replicated the findings of the early seasonal comparison studies: SES gaps grew mainly during summer when school was not in session, and Black-White gaps were either maintained or grew larger during the academic year. The authors also found that learning rates among Asian students were faster than those of White students during summer but roughly equal during the school year, indicating that schools tempered the initial Asian student academic advantage. The patterns for Hispanic and Native American students were inconsistent.
More recently, authors have argued that several seasonal studies, including Entwisle and Alexander (1992), Entwisle and Astone (1994), and Downey et al. (2004), suffered from artifacts of testing and measurement (Reardon, 2007; Von Hippel & Hamrock, 2018). Relevant for studies using the ECLS-K data (as our current study does), the item response theory (IRT) scale scores, which were included with the ECLS-K:1999 data and have been used by many researchers, are not interval scaled and thus inappropriate for analyzing student learning over time. In contrast, theta scores, which are now available for both previous and current versions of the ECLS-K data, are approximately interval scaled and thus the preferred metric for longitudinal analysis. Indeed, replication studies that used the new, and more appropriate, ECLS-K theta scores rather than the old IRT scale scores as outcomes were unable to reproduce the earlier findings that inequalites generally widen during summer (Von Hippel & Hamrock, 2018). Other authors reanalyzing the ECLS-K:1999 data have also found that specific estimates, such as Black/White disparities in learning during the school year and summer, vary dramatically depending on assumptions related to test scaling, measurement error, and, as we discuss below, modeling strategies (Quinn, 2015; Quinn & McIntyre, 2017).
Using data from the more recent ECLS-K:2011, which includes the second grade (and thus the prior summer), both Quinn et al. (2016) and Von Hippel et al. (2018) reported mixed results. Supporting the argument for schooling’s compensatory effects, socioeconomic gaps in reading and math skills narrowed slightly during kindergarten and widened again during the following summer when school was not in session. However, academic growth was unrelated to SES in both first and second grades. Seasonal patterns in racial/ethnic inequality were also inconsistent, with the exception of Black/White disparities, which actually grew wider during kindergarten in both reading and math, and also in first-grade math, but were stable during the summer months. Importantly, these authors reported a key finding beyond socioeconomic and racial/ethnic inequality that suggests schools reduce inequality in cognitive skills, at least during the early grades: From the start of kindergarten through the end of second grade, variability in monthly learning rates was smaller during the school year compared with the summer months. We return to this finding below in our own analyses.
Schools as a Source of Inequality: School Composition and Student Learning
In contrast to the studies and arguments described above, an extensive body of research identifies school characteristics that influence educational equity, both within and between schools (e.g., Gamoran, 1987; Gamoran & An, 2016; Jennings et al., 2015; Lucas, 1999; Mickelson, 2015; Raudenbush & Willms, 1995). These and other authors argue for a focus on the equitable distribution of high-quality schooling rather than on a comparison of differential exposure to schooling. Since Coleman, one school characteristic in particular that has held scholarly attention and been studied widely across disciplines and national contexts is school socioeconomic and racial/ethnic composition (e.g., Benner & Crosnoe, 2011; Curenton, Dong, & Shen, 2015; Lee & Bryk, 1989; McEwan, 2003).
Understanding school compositional effects is crucial given the high levels of socioeconomic and racial/ethnic segregation in the United States (Clotfelter, 2004; Orfield, Ee, Frankenberg, & Siegel-Hawley, 2016; Owens, Reardon, & Jencks, 2016; Reardon & Owens, 2014). Indeed, a large body of research suggests that socioeconomic and racial/ethnic segregation between schools is a key factor contributing to academic inequality (Mickelson, 2015; Owens, 2018; Phillips & Chin, 2004; Reardon, 2016a, 2016b; Rumberger & Willms, 1992). Multiple explanations have been offered for why school composition might matter for student achievement, including disparities in economic, social, and cultural capital (Bridwell-Mitchell, 2017; Li & Fischer, 2017); the so-called peer contagion effects associated with education-related norms, values, and behaviors (Jencks & Mayer, 1990; Nomi & Raudenbush, 2016; Palardy, 2013; Wilkinson, 2002); and the quality of instruction and curriculum (Dreeben & Barr, 1988; Goldhaber, Lavery, & Theobald, 2015; Lankford, Loeb, & Wyckoff, 2002; Palardy, 2015).
Empirically, school composition is operationalized as the school-level aggregate of student demographic characteristics. Typically, school socioeconomic composition is measured via school mean SES (see Van Ewijk & Sleegers, 2010a). There is, however, considerable variability in the aggregate measures of student race/ethnicity used across studies (see Mickelson, Bottia, & Lambert, 2013; Van Ewijk & Sleegers, 2010b). In the U.S. context, some studies employ a measure of the percentage of non-White students, while others use the percentage of students from particular racial/ethnic groups per school. In the international context, studies often use the percentage of immigrant students per school. Whatever the aggregate measure, a compositional effect is most often defined and tested as the impact of these aggregate characteristics on student achievement at Time 2 controlling for the parallel student-level measures and student achievement at Time 1 (Harker & Tymms, 2004; Rumberger & Palardy, 2005; Sacerdote, 2011; Thrupp, Lauder, & Robinson, 2002). Studies following this approach generally report that students learn less on average when they attend schools with higher proportions of low-SES (see the meta-analysis by Van Ewijk & Sleegers, 2010a) and racial/ethnic minority (see the meta-analyses by Mickelson et al., 2013; Van Ewijk & Sleegers, 2010b) students. These findings are supported by studies that use other empirical strategies, including those that use data from public housing lotteries, where families are randomly assigned to neighborhoods and schools (Schwartz, 2010); studies that leverage random variation in student demographics over time within the same schools (Hanushek, Kain, & Rivkin, 2001); and analyses of massive data sets that include virtually every third- to eighth-grade public school student in the United States (Reardon, 2016b).
Particularly relevant to the present study, Ready and Silander (2011) analyzed school compositional effects using a seasonal comparative framework with the ECLS-K:1999 and found that students attending schools with higher proportions of non-White/non-Asian students typically gained fewer math skills in both kindergarten and first grade and fewer reading skills in first grade. Importantly, school composition in that study was not significantly associated with student learning during the summer months, suggesting that unmeasured family and neighborhood influences were not implicated in the school year compositional effects. Using a similar design and similar data, Benson and Borman (2010) found positive effects for school socioeconomic composition in the growth of reading skills during kindergarten and first grade and negative effects for school racial/ethnic composition (as the percentage of students other than non-Hispanic Whites) during first grade, but similar to Ready and Silander (2011), measures of school demographics did not predict growth in students’ math and reading skills during the summer months between kindergarten and first grade. However, as we have discussed above, given that these studies used the IRT scale scores, which are not appropriate for longitudinal analysis, their findings should be interpreted with caution. In our study, we also combine seasonal comparative analysis with analysis of school compositional effects, but we use the more recent ECLS-K data and the (more appropriate) theta score versions of the ECLS-K assessments.
Initial Achievement in Analyses of Student Learning
The two research strands outlined above share a common methodological challenge. Researchers estimating academic growth across groups with large initial achievement differences face an issue inherent in nonequivalent group designs: how to account for the potential relationships between initial achievement and subsequent achievement growth. Three relationships are possible in this regard: (1) initial achievement may be unrelated to achievement growth; (2) a negative relationship may be present, whereby initially lower-achieving students gain more than their higher-achieving peers; or (3) a positive relationship may exist, with initially higher-achieving students learning at a faster rate than lower-achieving students, also known as a “fan spread” or “Matthew effect” (Stanovich, 1986). The latter two associations present serious challenges to any study of inequality in academic development, depending on the strength of the association between achievement and growth, and the degree of initial academic difference between the groups. For example, data in which initial status is negatively associated with growth may spuriously indicate stronger growth rates among groups who began a given period with weaker skills. The source of these patterns may stem from the psychometric properties of the assessments themselves (e.g., scale compression, measurement error), substantive real-world phenomena (e.g., teachers may focus more on low- or high-ability students), or a combination of the above (Ready, 2013).
These issues are central to our discussion here. In addition to their different counterfactuals, the two conflicting lines of research described above also differ in how they model student academic growth over time and how their models incorporate initial achievement of students. Whereas the first line of research mainly uses gain score (sometimes also referred to as change score or difference score) models or growth models (Downey et al., 2004; Entwisle & Alexander, 1992; Entwisle & Astone, 1994), the second line of research typically employs models in which Time 2 test scores are regressed on Time 1 scores (Burns & Mason, 2002; Carlson & Cowen, 2015; Gamoran & An, 2016; Hanselmann, 2018; Mickelson, 2015; Sorensen, Cook, & Dodge, 2017), referred to variously as lagged score, regressor variable, or analysis of covariance models.
The different (and even contradictory) findings that can result from gain score/growth versus lagged score approaches—depending on the strength of the particular association between initial achievement and achievement growth—is commonly known as Lord’s paradox (Lord, 1967, 1969). Holland and Rubin (1982) unraveled Lord’s paradox by asserting that no paradox is actually present. Rather, they argued, the gain score and lagged score approaches simply ask different questions. In the context of student learning, the gain score approach asks, “How much did the students in different groups gain between Time 1 and Time 2?” In contrast, the lagged score approach asks, “How did students in different groups perform at Time 2 who had the same scores at Time 1?” When making descriptive statements, the contradictory results these two approaches potentially afford may both be equally correct (Holland & Rubin, 1982).
We are not the first to show the saliency of Lord’s paradox for conclusions about how schools affect estimates of inequality (Quinn, 2015; Quinn & McIntyre, 2017; Ready, 2013; Rubin, Stuart, & Zanutto, 2004). But what has not been addressed in the literature is the fact that these analytic issues are confounded with the two lines of research on the role of schools in academic inequality, leading to potentially conflicting conclusions. Given the strong sociodemographic disparities in achievement at school entry, combined with the severe segregation and stratification that typify U.S. schooling, researchers arguing for an equalizing role of schools may have come to this conclusion because they typically compare students from different backgrounds across all achievement levels. For instance, they analyze how much students from different socioeconomic backgrounds learn during the school year and during summer regardless of their initial achievement at the beginning of the school year (e.g., Downey et al., 2004). However, this approach may not accurately account for the associations between initial academic achievement and subsequent academic growth. On the other hand, researchers arguing that schools exacerbate inequality may have arrived at this conclusion because their models typically compare students with similar initial achievement levels. For instance, studies on compositional effects analyze whether school mean SES predicts student achievement at the end of the school year after taking into account the initial achievement at the beginning of the school year. In the analyses presented below, we explicitly test the hypothesis that the differential treatment of initial achievement in these two research strands may have affected their findings.
Research Questions
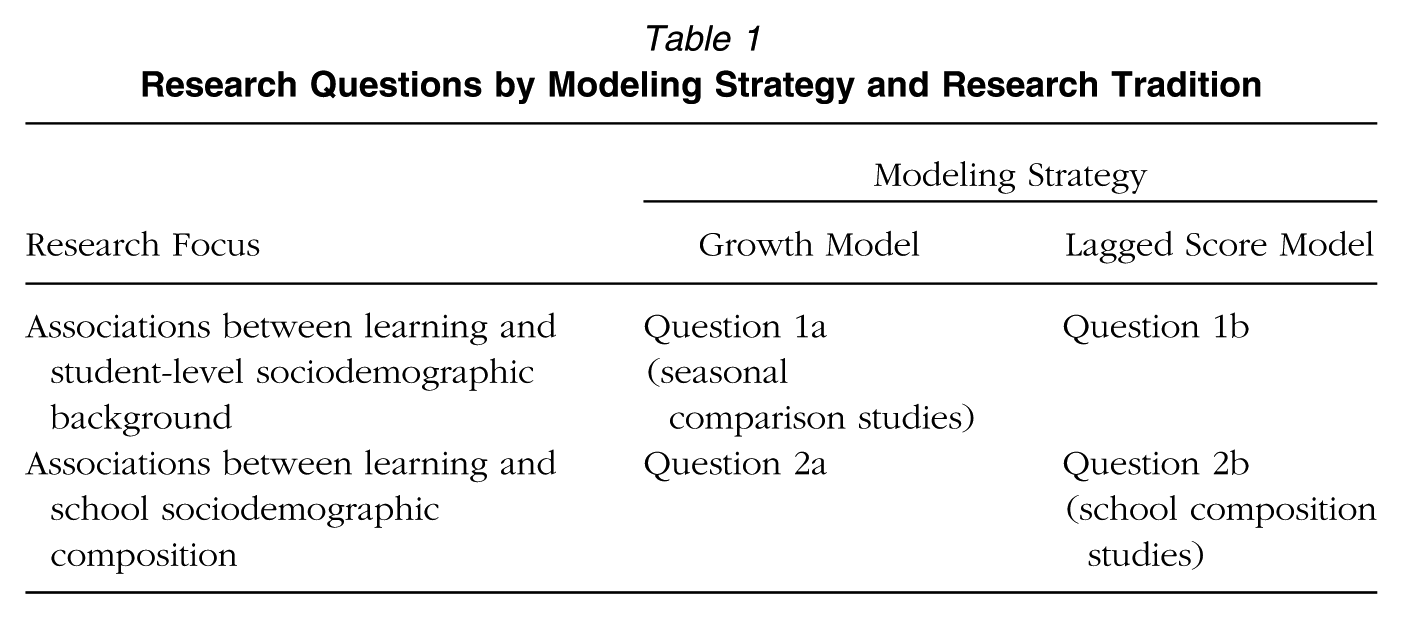
Our overarching goal in this article is to establish the extent to which different modeling strategies, in particular the differential treatment of initial achievement in statistical models of student learning, lead to different conclusions about the role of schools in inequality. Using data from the ECLS-K:2011, we construct both growth and lagged score models within both seasonal learning and school effects frameworks. Our first set of research questions addresses the associations between student-level socioeconomic and racial/ethnic background and student learning, while the second set focuses on the associations between school-level socioeconomic and racial/ethnic composition and student learning. We analyze these two sets of research questions using both growth and lagged score models. More specifically, we ask the following:
Research Question 1a : Is student socioeconomic and racial/ethnic background associated with academic gains during the school year and during summer?
Research Question 1b : Among students who started each school year or summer period with the same level of achievement, is socioeconomic and racial/ethnic background associated with their achievement at the end of the period?
Research Question 2a : After accounting for student socioeconomic and racial/ethnic background, is school socioeconomic and racial/ethnic composition associated with academic gains during the school year and during summer?
Research Question 2b : Among students who started each school year or summer period with the same level of achievement and who come from the same socioeconomic and racial/ethnic background, is school socioeconomic and racial/ethnic composition associated with their achievement at the end of the period?
Note, that for Research Questions 2a and 2b, we also employ a seasonal comparative framework, as we do with Research Questions 1a and 1b, and use the results for the summers after kindergarten and first grade as counterfactuals. Table 1 organizes our research questions by modeling strategy and the research traditions that employ each strategy. Note that seasonal comparison scholars typically address Research Question 1a, whereas scholars studying compositional effects typically focus on Research Question 2b.
Research Questions by Modeling Strategy and Research Tradition
Method
Sample
The ECLS-K:2011 is an ongoing longitudinal large-scale study conducted by the National Center for Educational Statistics (NCES) that follows a nationally representative sample of 18,174 students from 968 schools who attended kindergarten during the 2010–2011 school year (Tourangeau et al., 2017). The study, which also collects data from students’ parents, teachers, and school principals, used a multistage sampling design in which primary sampling units (PSUs, i.e., counties or groups of counties) were chosen in the first stage. In the second stage, private and public schools with kindergarten programs were selected from these PSUs. In the third stage, a target number of 23 students were sampled from each selected school. PSUs and schools were selected with probability proportional to population size, accounting for a desired oversampling of Asian, Native Hawaiian, and other Pacific Islander students (as a group, not separately). The use of sampling weights compensates for these differential selection probabilities, producing a representative sample. Both descriptive and analytic models employ the child-level (W1C0) and school-level (W2SCH0) sampling weights supplied by NCES.
For the present study, we use data from the first six waves of the study, which include information on the same students in the fall and spring of kindergarten (Waves 1 and 2), first grade (Waves 3 and 4), and second grade (Waves 5 and 6). We selected schools that were non-year-round, enrolled at least five ECLS-K students, were not exclusively focused on special-education students, and offered at least kindergarten through second grade. All the models include a dummy variable identifying students who were known to have changed schools during the six study waves (roughly 30% of the sample). These students were analytically nested in the schools in which they were enrolled for the majority of waves. Models that excluded these students altogether and those that eliminated outcomes for the waves in which they attended the alternate school produced virtually identical estimates.
Our analyses required us to address two distinct forms of missing data. First, the ECLS-K:2011 data collection involved only a random subsample of one third of the PSUs in the fall of the first and second grades (see Tourangeau et al., 2017). The second type involved missing data resulting from traditional sources (e.g., survey nonresponse, missing assessment scores related to student absence). Fortunately, there were virtually no missing data for key child-level indicators, including race/ethnicity, gender, and SES (NCES imputed SES values prior to releasing the data). However, after applying the sample restrictions described above, missing data on other child-level academic and sociodemographic variables still averaged around 10%. Missing data on the reading and mathematics assessments during the four full-sample waves ranged from roughly 5% to 25%.
All missing data related to both the reduced ECLS-K samples as well as the nonresponse and unknown sources were estimated using multiple imputation with chained equations (using the R package MICE; van Buuren & Groothuis-Oudshoorn, 2011), producing five complete data sets (see Graham, 2009). The coefficients reported here are the average results across these five data sets (using the multiple-imputation option in HLM 7; Raudenbush, Bryk, Cheong, Congdon, & Du Toit, 2011). The standard errors were calculated via the methods suggested in Allison (2001). The resulting analytic sample includes 97,092 measurements from 16,182 students who were nested within 888 schools. Missing school-level measures were obtained using data from NCES’s Common Core of Data (for public schools) and Private School Universe Survey (for private schools). The authors have licenses for the restricted use of ECLS-K, making this linkage possible.
Measures
Outcomes
We use the students’ test scores in reading and math as outcomes but only present the findings for reading in this article; the findings for math are included in the Appendix. At each of the six waves, the students were administered two-stage adaptive assessments. The first stage was a routing section with items covering a broad range of difficulty. Students’ performance on the routing test determined whether they were administered a test with low, medium, or high difficulty in the second stage of the assessment. The reading assessment included questions measuring basic skills, vocabulary knowledge, and reading comprehension. The mathematics assessment measured students’ conceptual knowledge, procedural knowledge, and problem solving. Three-parameter logistic item response models were used to estimate student achievement scores for each wave—so called theta scores—which indicate the students’ achievement level on a common vertical scale across item sets and test waves (for more information on the administered tests, see Tourangeau et al., 2017).
Predictors
Our student-level predictors include SES, a composite of parents’ income, education, and occupational prestige (z scored), and dummy variables indicating whether the student is Black (non-Hispanic), Hispanic (any race), Asian, or other race/ethnicity (including Native American and students identified as belonging to multiple racial groups), with Whites serving as the uncoded comparison group. As controls, the models further account for students’ age (in months) and a series of dummy-coded indicators of full-day kindergarten attendance, special-education status (whether the student had an Individualized Education Program or Individualized Family Service Plan), whether a non-English language was the primary home language, single-parent family status (presence of a sole biological/adoptive parent at home), mobility (whether the student changed schools during kindergarten, or first or second grade), and grade-specific indicators of chronic absences (>10 days per year). 1 All student-level measures were uncentered. At the school level, our predictors are school-average SES (z scored) and, following previous authors (see Ready & Silander, 2011; Rumberger & Palardy, 2005), the percentage of students in the school who were Black or Hispanic (centered about their means).
Analytic Approach
We employ the two distinct sets of analytic models described above to answer our four research questions. For Research Questions 1a and 1b, we construct three-level piecewise linear growth models; for Research Questions 2a and 2b, we utilize two-level, linear lagged score models. The two sets of models treat the relationship between initial achievement and subsequent achievement growth differently, and given the substantial socioeconomic and racial/ethnic inequalities that characterize academic achievement at kindergarten entry, these analytic differences have both substantive and methodological implications. We describe each approach in turn below.
Three-Level Piecewise Linear Growth Models
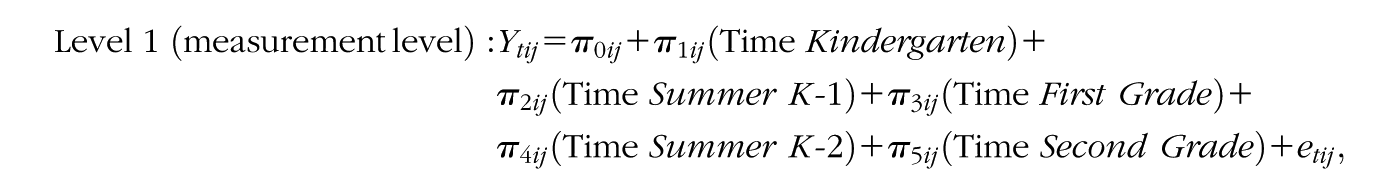
Our first analytic approach entailed hierarchical linear modeling (using HLM 7; Raudenbush et al., 2011) within a three-level piecewise linear growth framework (Raudenbush & Bryk, 2002; Singer & Willett, 2003). Specifically, the models nested learning trajectories within students, who were nested within schools. This approach was made possible by the fact that the dates on which the ECLS-K assessments were administered varied considerably across students. In addition to variability in testing dates, the starting and ending dates of academic years also varied across schools. The result of this variability in school exposure at each assessment was that students’ opportunities to learn differed both within and between schools. For example, some students completed the kindergarten assessments on only the fourth day of school; others completed the fall assessments well into December. This variability was also present with the spring assessments and with all three grades. As such, the time the students were in school between the fall and spring assessments ranged from almost 4 to over 8 months, averaging about 6 months (although the school year is 9 months), meaning the assessments do not represent comparable events in time across students. Further complicating the analyses, the students were, on average, in school for approximately half of the summer vacation between the spring and fall assessments.
To leverage this variability in school exposure, our measurement-level models included five time-varying covariates that indicate individual students’ exposure to school prior to each assessment: months of exposure to kindergarten, first grade, and second grade and months of exposure to summer between kindergarten and first grade and between first and second grade. These five measures of school and summer exposure—each linked to the six assessment dates—permitted the modeling of six distinct parameters: initial status, or initial achievement as the students began kindergarten (i.e., predicted achievement with exposure to 0 day of school or summer), while the five remaining parameters captured linear monthly learning rates or slopes during the kindergarten, first-grade, and second-grade school years and the summers prior to first and second grades.
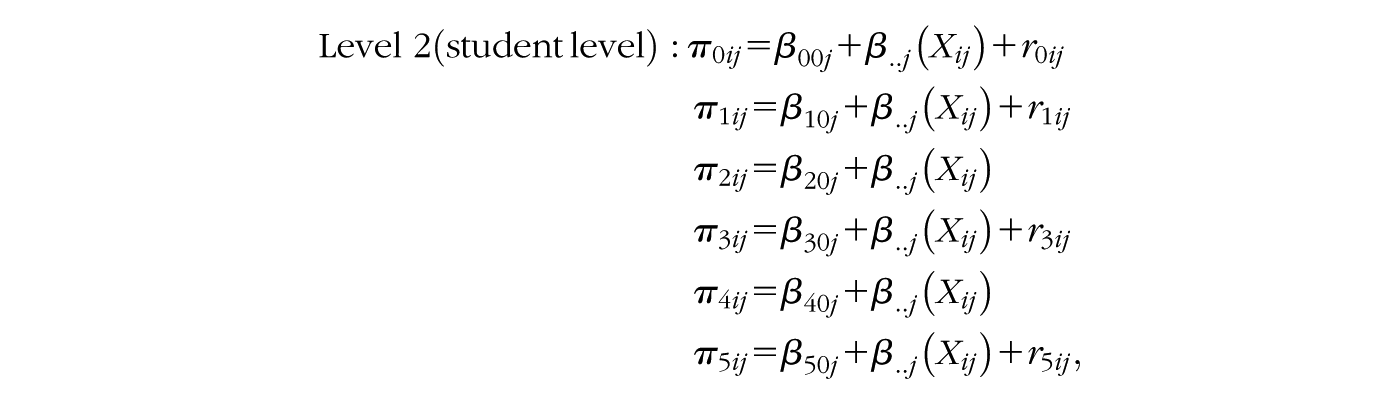
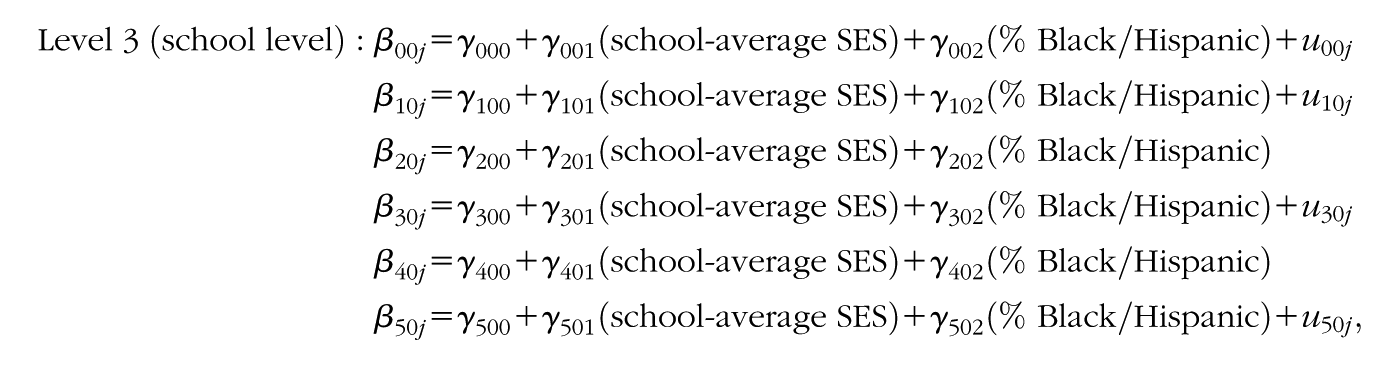
More formally, following the approach taken by others in the seasonal comparison literature (Downey et al., 2004; Ready, 2010), the models (in somewhat abbreviated form) can be described as follows:
where
Ytij is the predicted outcome at time t for student i in school j;
π 0ij is the estimated test score for student ij (at 0 day of school or summer);
π 1ij through π5ij are the period-specific monthly learning rates for student ij;
etij is the error term associated with student ij at time t, assumed to be normally distributed with a mean of 0 and a constant Level 1 variance, σ2;
β 00j is the mean initial status in school j;
Xij represents a vector of student sociodemographic indicators (described above);
r 0ij is the random effect associated with the initial status for student i in school j;
β 10j is the average kindergarten monthly learning rate in school j;
r 1ij is the random effect associated with the kindergarten learning rate for student i in school j;
γ 000 is the school-average mean initial status for the sample;
u 00j is the initial status error term associated with school j; and
γ 100 is the mean school-average kindergarten learning rate for the sample.
Two-Level Linear Lagged Score Models
Our second analytic approach entailed multilevel regression models with students at Level 1 and schools at Level 2, where a given test score was modeled as a function of the immediately prior test score (i.e., the fall kindergarten reading test score was included as a covariate in models that estimated spring kindergarten reading achievement). Other than the inclusion of the pretest, the student- and school-level measures employed here were identical to those used in the piecewise growth models described above. We ran separate models for each time period (Kindergarten, Summer K-1, First Grade, Summer 1-2, Second Grade), which can be described as follows:


Where
Yij is the predicted test score for student i in school j;
β 0j is the average test score in school j;
Pretest is the immediately prior, same-subject assessment score;
Xij is a vector of student-level academic and sociodemographic characteristics;
rij is the error term associated with student i in school j, assumed to be normally distributed with a mean of 0 and a constant Level 1 variance, σ2;
γ 00 is the school-average mean initial status for the sample; and
u 0j is the error term associated with school j.
Results
Descriptive Findings
Table 2 displays the means (in the original theta metric), the standard deviations, and the proportion of variance in reading between schools (for mathematics, see Table A1 in the Appendix). Note first the tremendous spurt in reading scores during kindergarten and the subsequently slower increases in the first and second grades. Also important to our understanding of the changing inequalities in early academic development is the fact that the standard deviation of reading scores decreases over time. Rather than the common perception that variability in students’ abilities increases during formal schooling, the ECLS-K data provide clear evidence of a narrowing of the skills distribution, at least during the early grades. This overall decrease in student reading ability is at odds with the research tradition that assumes growing inequality and seeks to explain the phenomenon as a function of school characteristics. Note also that these shrinking standard deviations are accompanied by a slight decrease in test score variability across schools as well. In other words, as overall variability in test scores decreases, so too does the proportion of variability in test scores that lies across schools. This finding also complicates the argument that schools are engines of inequality if, in general, variability in student outcomes between schools decreases over time.
Means (M), Standard Deviations (SD), and Intraclass Correlations (ICC) for Reading
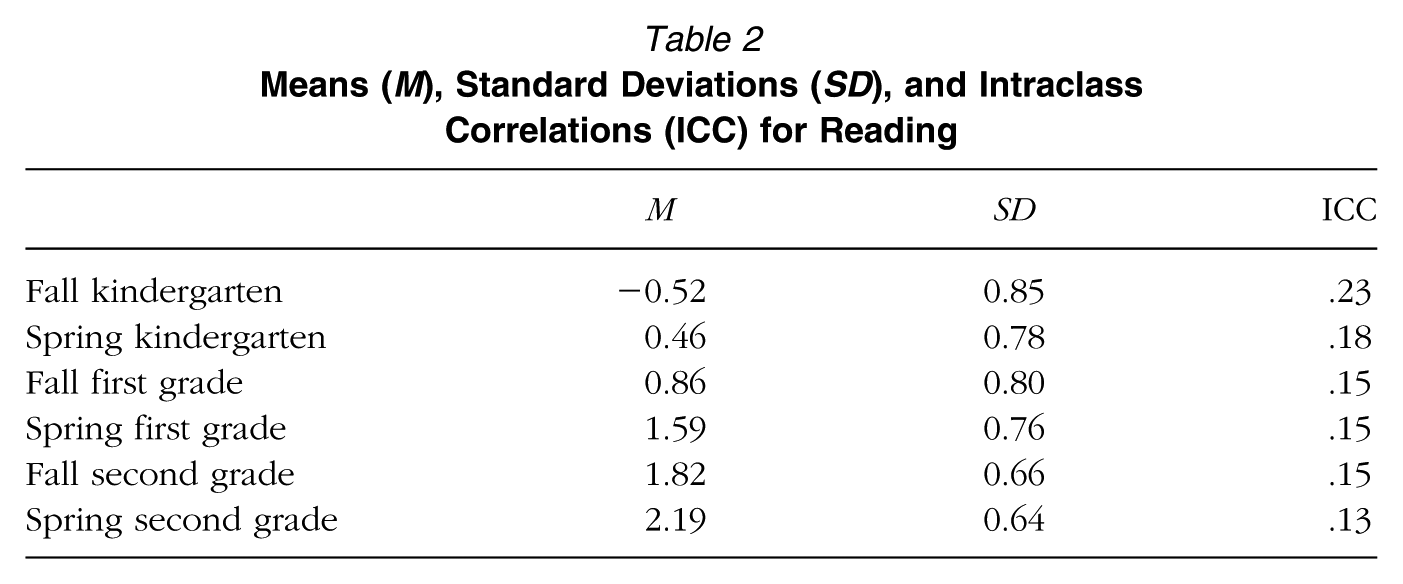
Table 3, which categorizes schools based on school-mean SES and racial/ethnic composition, provides descriptive information on schools and their students. We find large initial achievement differences by school socioeconomic and racial/ethnic characteristics, suggesting that the estimated effects for school composition on student learning may differ across the growth and lagged score approaches, depending on the associations between initial status and growth. A 3/4 standard deviation gap in reading achievement separates low- and high-SES schools at kindergarten entry, and a 1/2 standard deviation gap distinguishes schools with Black/Hispanic enrollments below 15% from schools with majority Black and Hispanic enrollments. These gaps are similarly large for mathematics. We also found substantial demographic disparities. Two out of three students attending low-SES schools were Black or Hispanic (compared to fewer than one in five students in high-SES schools), and the SES difference across low- and high-minority-enrollment schools approached 1 full standard deviation. Low-SES and high-minority-enrollment schools also served larger proportions of students who were mobile, had a non-English language as a primary home language, lived in single-parent households, received special-education services, and attended full-day kindergarten. At the school level, perhaps unsurprisingly, low-SES and high-minority-enrollment schools were far more likely to be public, to be located in large cities, and to serve larger student enrollments.
Student and School Characteristics by School Socioeconomic and Racial Composition
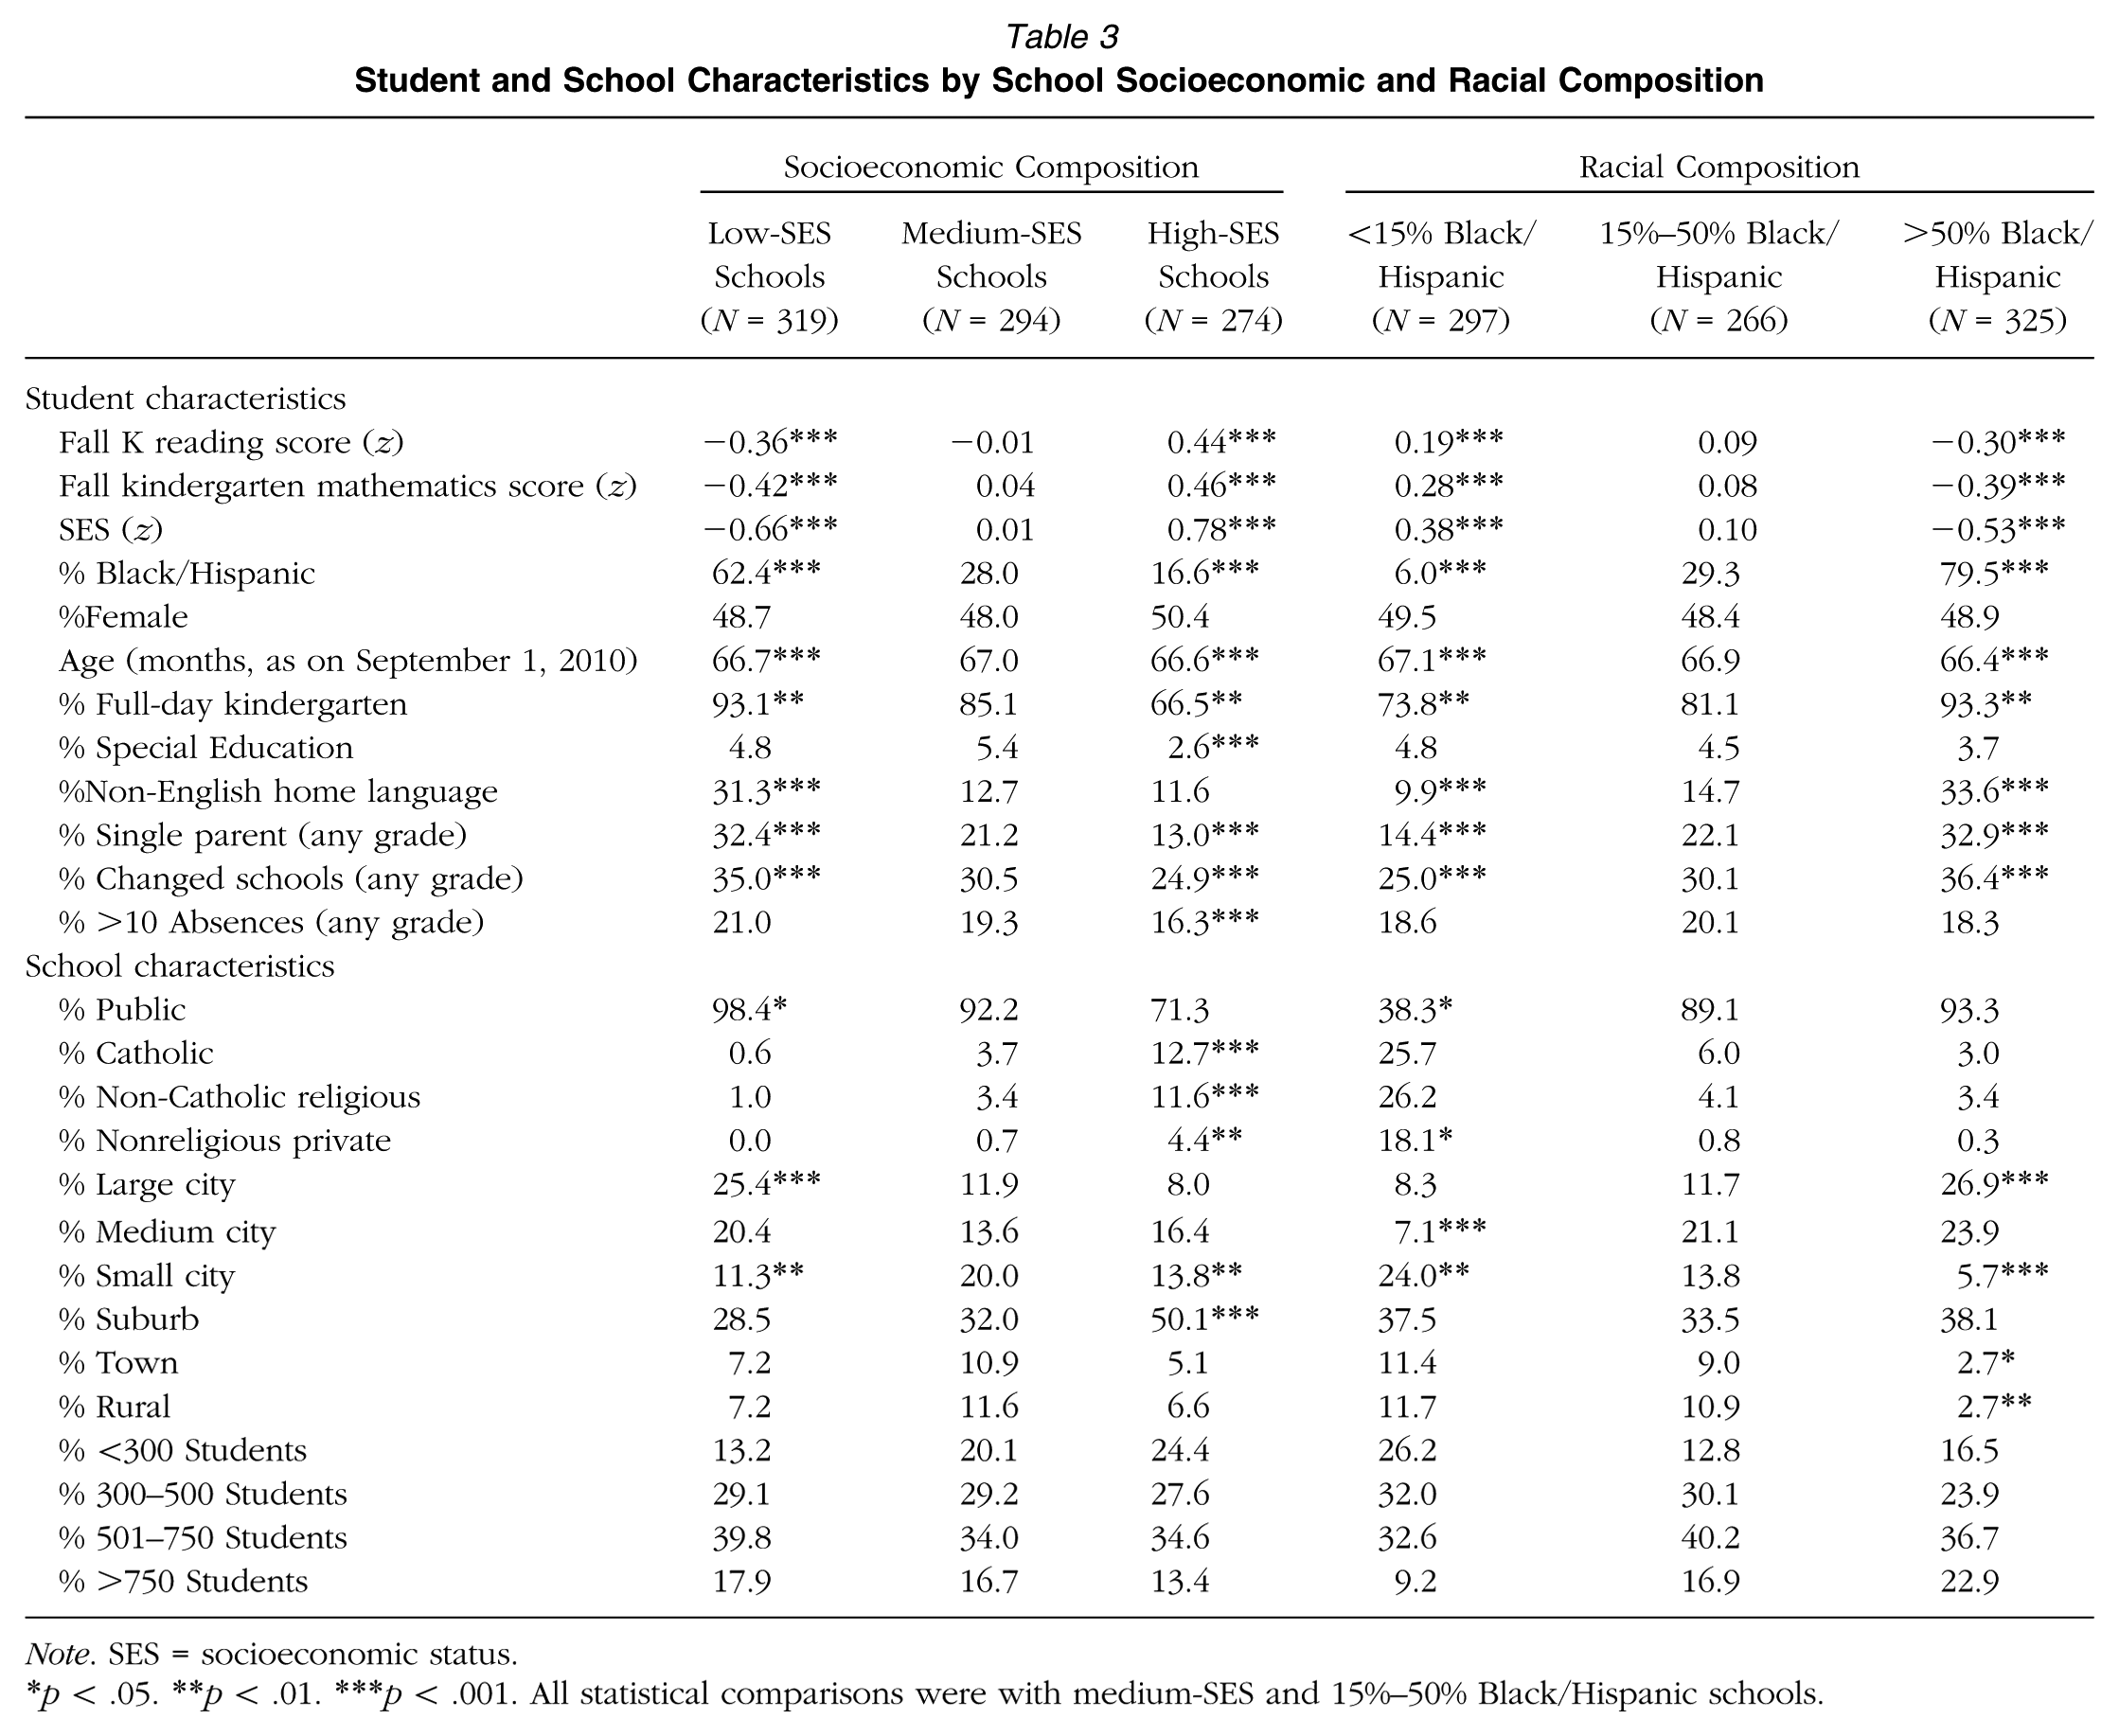
Note. SES = socioeconomic status.
p < .05. **p < .01. ***p < .001. All statistical comparisons were with medium-SES and 15%–50% Black/Hispanic schools.
Table 4 displays unadjusted monthly learning rates in reading (for mathematics, see Table A2 in the Appendix). As indicated in the far-left column, monthly learning rates in kindergarten were higher than first-grade learning rates, which were in turn higher than those in second grade. Equally important, during the intervening summer months, on average, students gained no skills in reading. This is the common finding of stunted academic growth during summer often described in the literature. In addition to these declining learning rates over time, variability in learning rates also decreased as the students progressed through school. Note also that variability in learning rates was larger during the summer months when school was not in session and considerably smaller during the academic year. This finding lends credence to the “schools as equalizers” argument.
Monthly Learning Rates in Reading by Students’ Initial Achievement at Kindergarten Entry
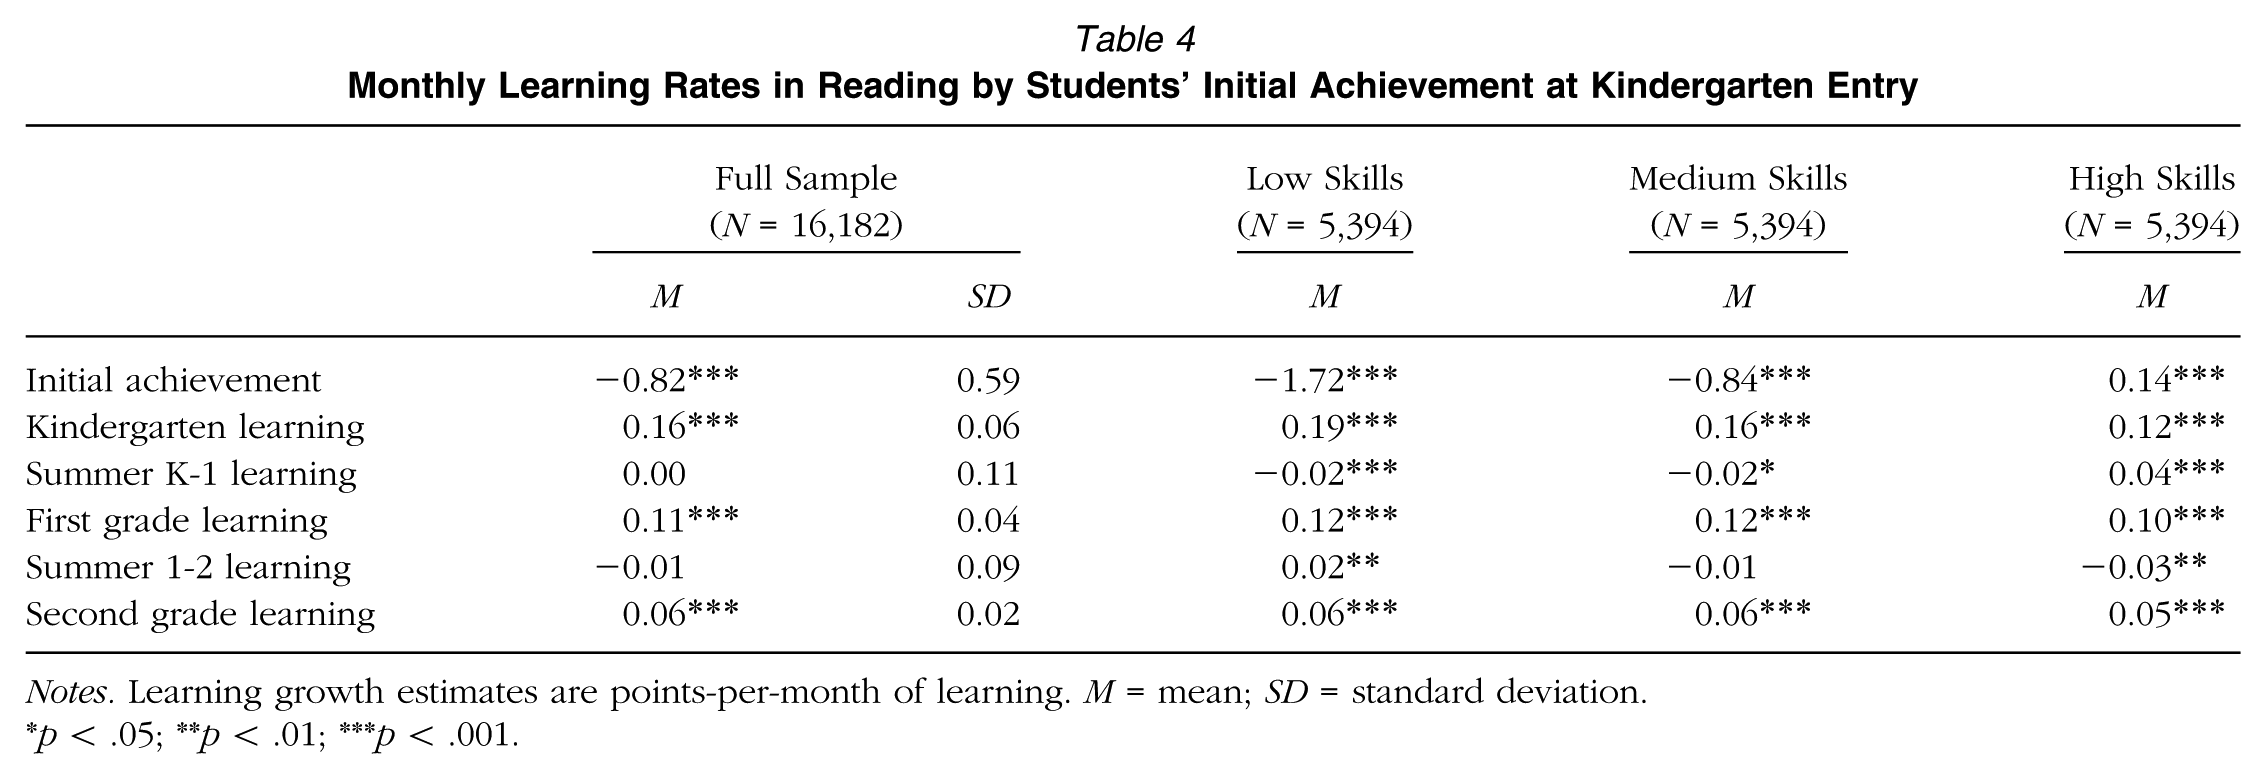
Notes. Learning growth estimates are points-per-month of learning. M = mean; SD = standard deviation.
p < .05; **p < .01; ***p < .001.
The next three columns in Table 4, which organize monthly learning rates by students’ reading skills at kindergarten entry, highlight the associations between initial reading skills and subsequent learning. On average during kindergarten, students who began formal schooling with weaker skills learned considerably more compared with their peers with moderate skills, who in turn gained more than students with high initial skill levels. More specifically, students categorized as having low skills at kindergarten entry gained 0.19 points per month during kindergarten, compared with medium-skilled students, who gained 0.16 points per month, and initially high-skilled students, who gained 0.12 points per month. Authors using the same data and methods have reported identical patterns with children’s executive skills development (see Ready & Reid, 2019).
Although initially low-achieving students gained more, on average, during kindergarten, this did not close the gap separating them from their higher-achieving peers. For example, a 1.86-point gap separated high- and low-achieving students at kindergarten entry. Assuming a 9-month school year and a 0.07-point advantage in monthly learning rates, low-achieving students narrowed the gap by an average of 0.63 points, or roughly one third of the initial disparity. Key to our focus here, these associations between initial status and subsequent learning suggest that our growth models (which compare all students regardless of their initial achievement levels) may produce estimates quite different from the lagged score models (which compare students who began kindergarten with the same initial achievement levels).
These associations between initial skills and kindergarten learning had faded by first grade (i.e., first and second graders gained skills at comparable rates regardless of their skills at kindergarten entry). Because initial status was strongly related to learning in kindergarten but not in first or second grade, and given that the growth and lagged score models approach the links between achievement and achievement growth differently, we would expect the growth and lagged score models to diverge more strongly in kindergarten than in the first and second grades. We turn now to analyses that explicitly address these hypotheses.
Reading Development and Student Socioeconomic and Racial/Ethnic Background
Research Question 1a: Findings From Piece-Wise Growth Models
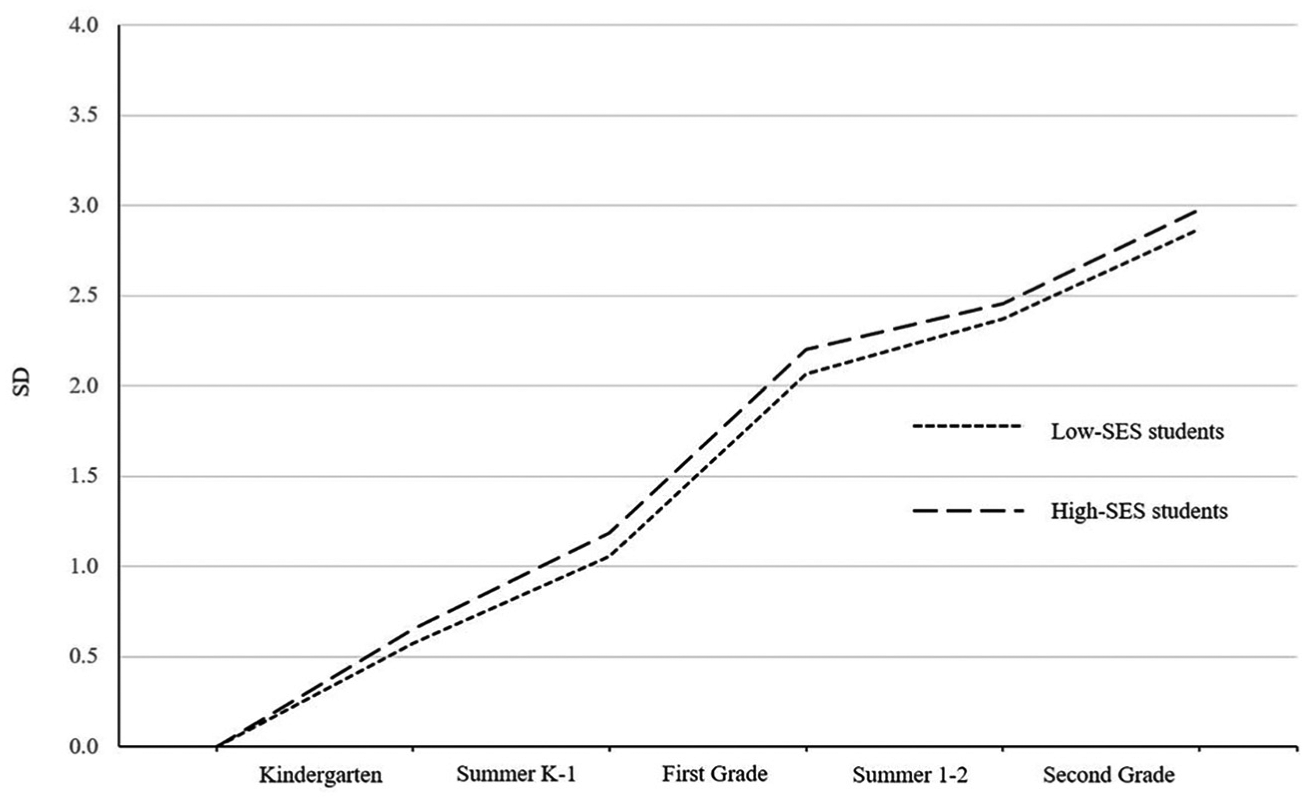
Models 1 to 4 in Table 5 address Research Question 1a regarding inequality in student reading development within a piece-wise growth model framework. Our interest here is the portrait of inequality painted by the growth models. Do socioeconomic and racial/ethnic inequalities widen during the school year and the intervening summers when comparing students regardless of what reading skills they had at the beginning of kindergarten? The initial status estimates reflect predicted achievement on the first day of kindergarten. The kindergarten intercept in Model 1 indicates that, on an unadjusted basis, a middle-class (average SES) student gained on average 0.16 points per month during kindergarten in reading. This is exactly what Table 4 indicates the average student gained in kindergarten. The coefficient for SES here indicates that a one–standard deviation increase in SES was associated with a 0.01-point decrease in monthly kindergarten learning in reading, or roughly 6% less per month (0.01/0.16). This negative student-level association between SES and reading development makes sense given that higher-SES students started school with stronger skills but higher-skilled kindergarteners actually gained fewer reading skills each month (again, see Table 4). The nonsignificant intercept associated with learning during the summer after kindergarten indicates that average-SES students gained no reading skills during the summer after kindergarten on a monthly basis. The positive SES summer learning estimate indicates that higher-SES students continued to gain skills during summer while lower-SES students actually lost skills each month. However, in subsequent academic years and summers, we find no link between student SES and reading development. Figure 1 visualizes the learning gains for students from low- versus high-SES backgrounds based on the results from the growth models.
Results for Reading From Piecewise-Growth-Models
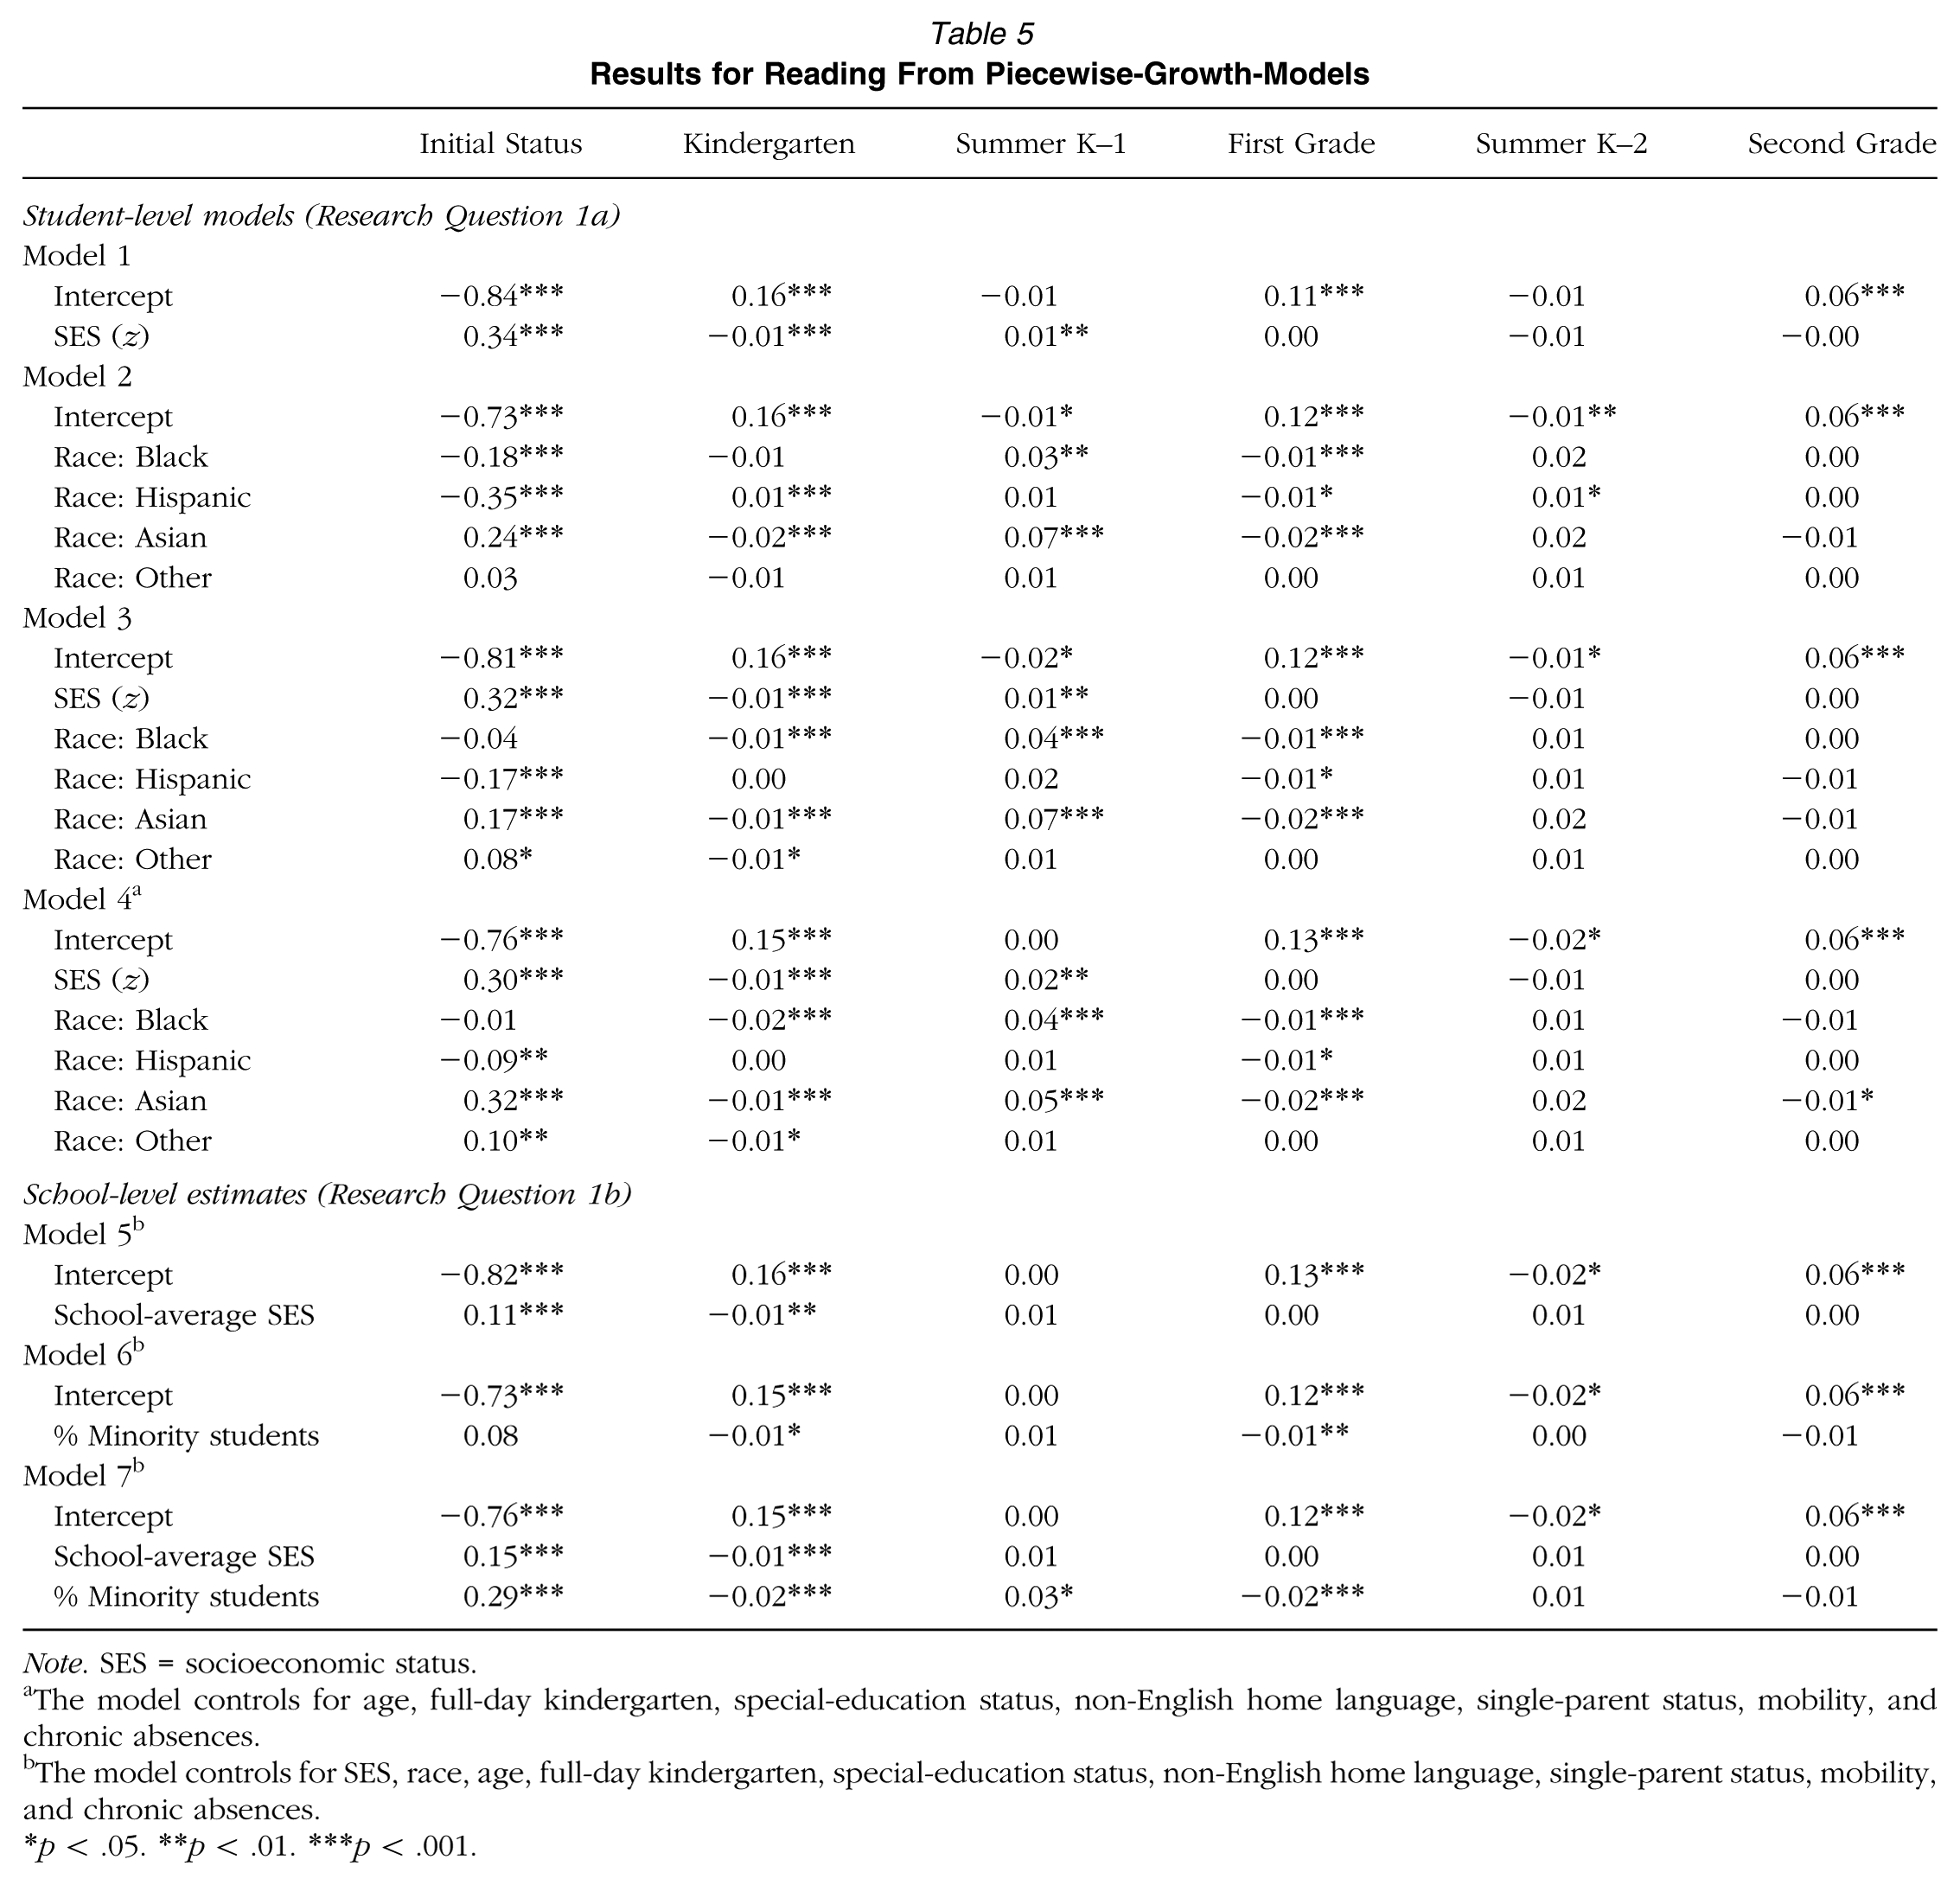
Note. SES = socioeconomic status.
The model controls for age, full-day kindergarten, special-education status, non-English home language, single-parent status, mobility, and chronic absences.
The model controls for SES, race, age, full-day kindergarten, special-education status, non-English home language, single-parent status, mobility, and chronic absences.
p < .05. **p < .01. ***p < .001.
Differential learning for high- and low-SES students according to growth models.
Model 2 provides unadjusted estimates of the links between student race/ethnicity and monthly reading learning rates (with Whites as the uncoded comparison group). Black students entered school with weaker reading skills, but the nonsignificant coefficient suggests that they gained skills during kindergarten at a rate comparable with their White peers. Importantly, Black students actually gained skills during the summer after kindergarten, while White students exhibited summer learning loss, as indicated by the negative intercept. Black students, however, then gained roughly 8% fewer points per month once school resumed in first grade (based on the 0.12-point/month learning rate among White students indicated by the intercept, and the −0.01 Black estimate). Understandably, given their higher probability of having English as a nonprimary language, Hispanic students began kindergarten at an even larger deficit than Black students. The reading development patterns are less clear for Hispanic students, with compensatory effects evident in kindergarten and monthly learning rates below those of White students in first grade but above those of White students in the summer after first grade. Note also that Asian students began kindergarten with reading skills above those of their White peers, gained fewer reading skills each month in both kindergarten and first grade, but gained more skills the summer after kindergarten compared with White students. Students with other racial/ethnic backgrounds began kindergarten with comparable reading skills and developed skills at comparable rates during both the academic years and the intervening summers.
Model 3 incorporates both SES and race/ethnicity simultaneously. The estimated coefficients for SES remain unchanged across all growth parameters after adjusting for race/ethnicity, and the coefficients for race/ethnicity are generally stable holding SES constant. Importantly, however, once we adjust for SES, the negative coefficient indicating Black/White inequality in reading development from Model 2 is now statistically significant: On an adjusted basis, Black students appear to have fallen further behind White students each month during kindergarten and first grade and to have gained more during the intervening summer. The Hispanic advantage in kindergarten learning is no longer significant after accounting for SES, although the lower learning rate compared with Whites remains in first grade. The patterns for Asian and other race/ethnicity students remain consistent. Model 4 then adjusts the SES and race/ethnicity estimates for additional factors that are associated with both student demographic background and student learning (i.e., age, full-day kindergarten, special-education status, non-English home language, single-parent status, mobility, and chronic absences). However, the patterns remain virtually unchanged from the third set of models. The findings for mathematics are quite similar to those for reading (see Table A3 in the Appendix).
Research Question 1b: Findings From Lagged Score Models
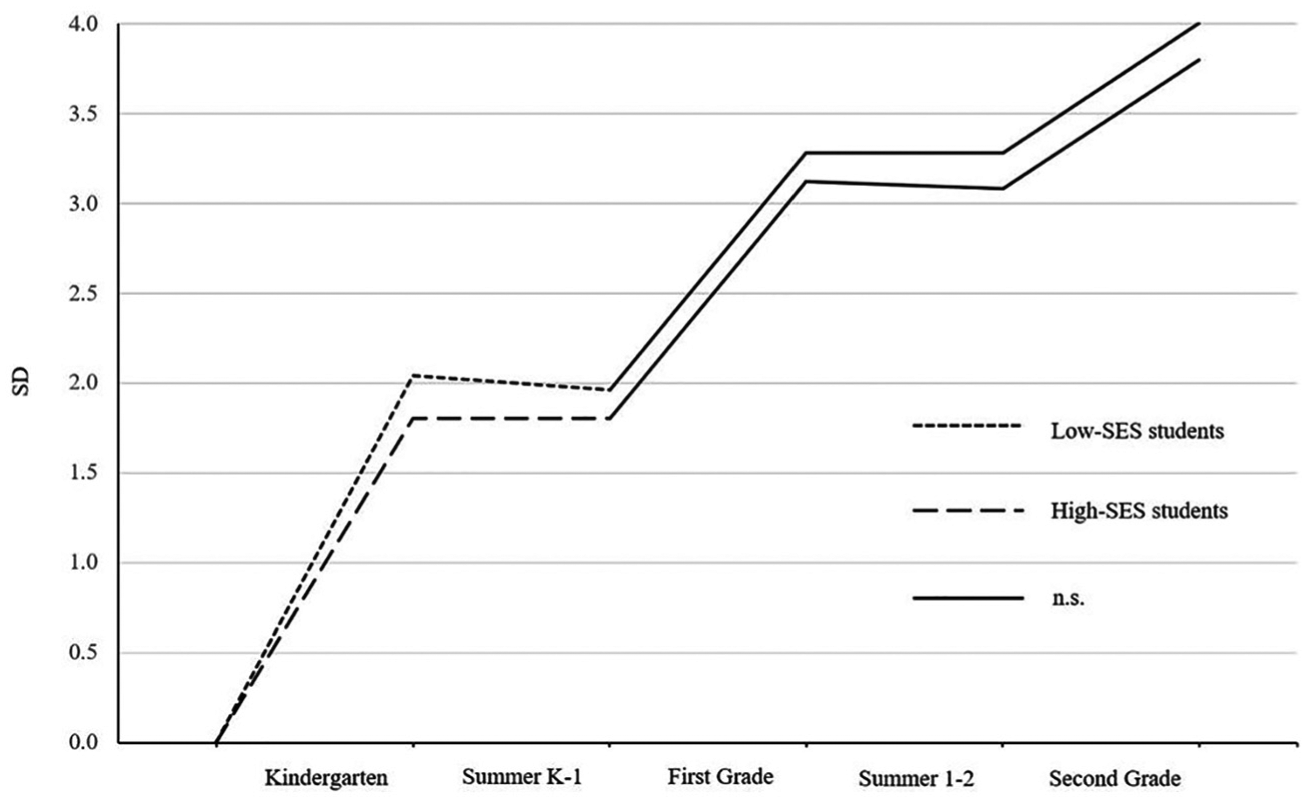
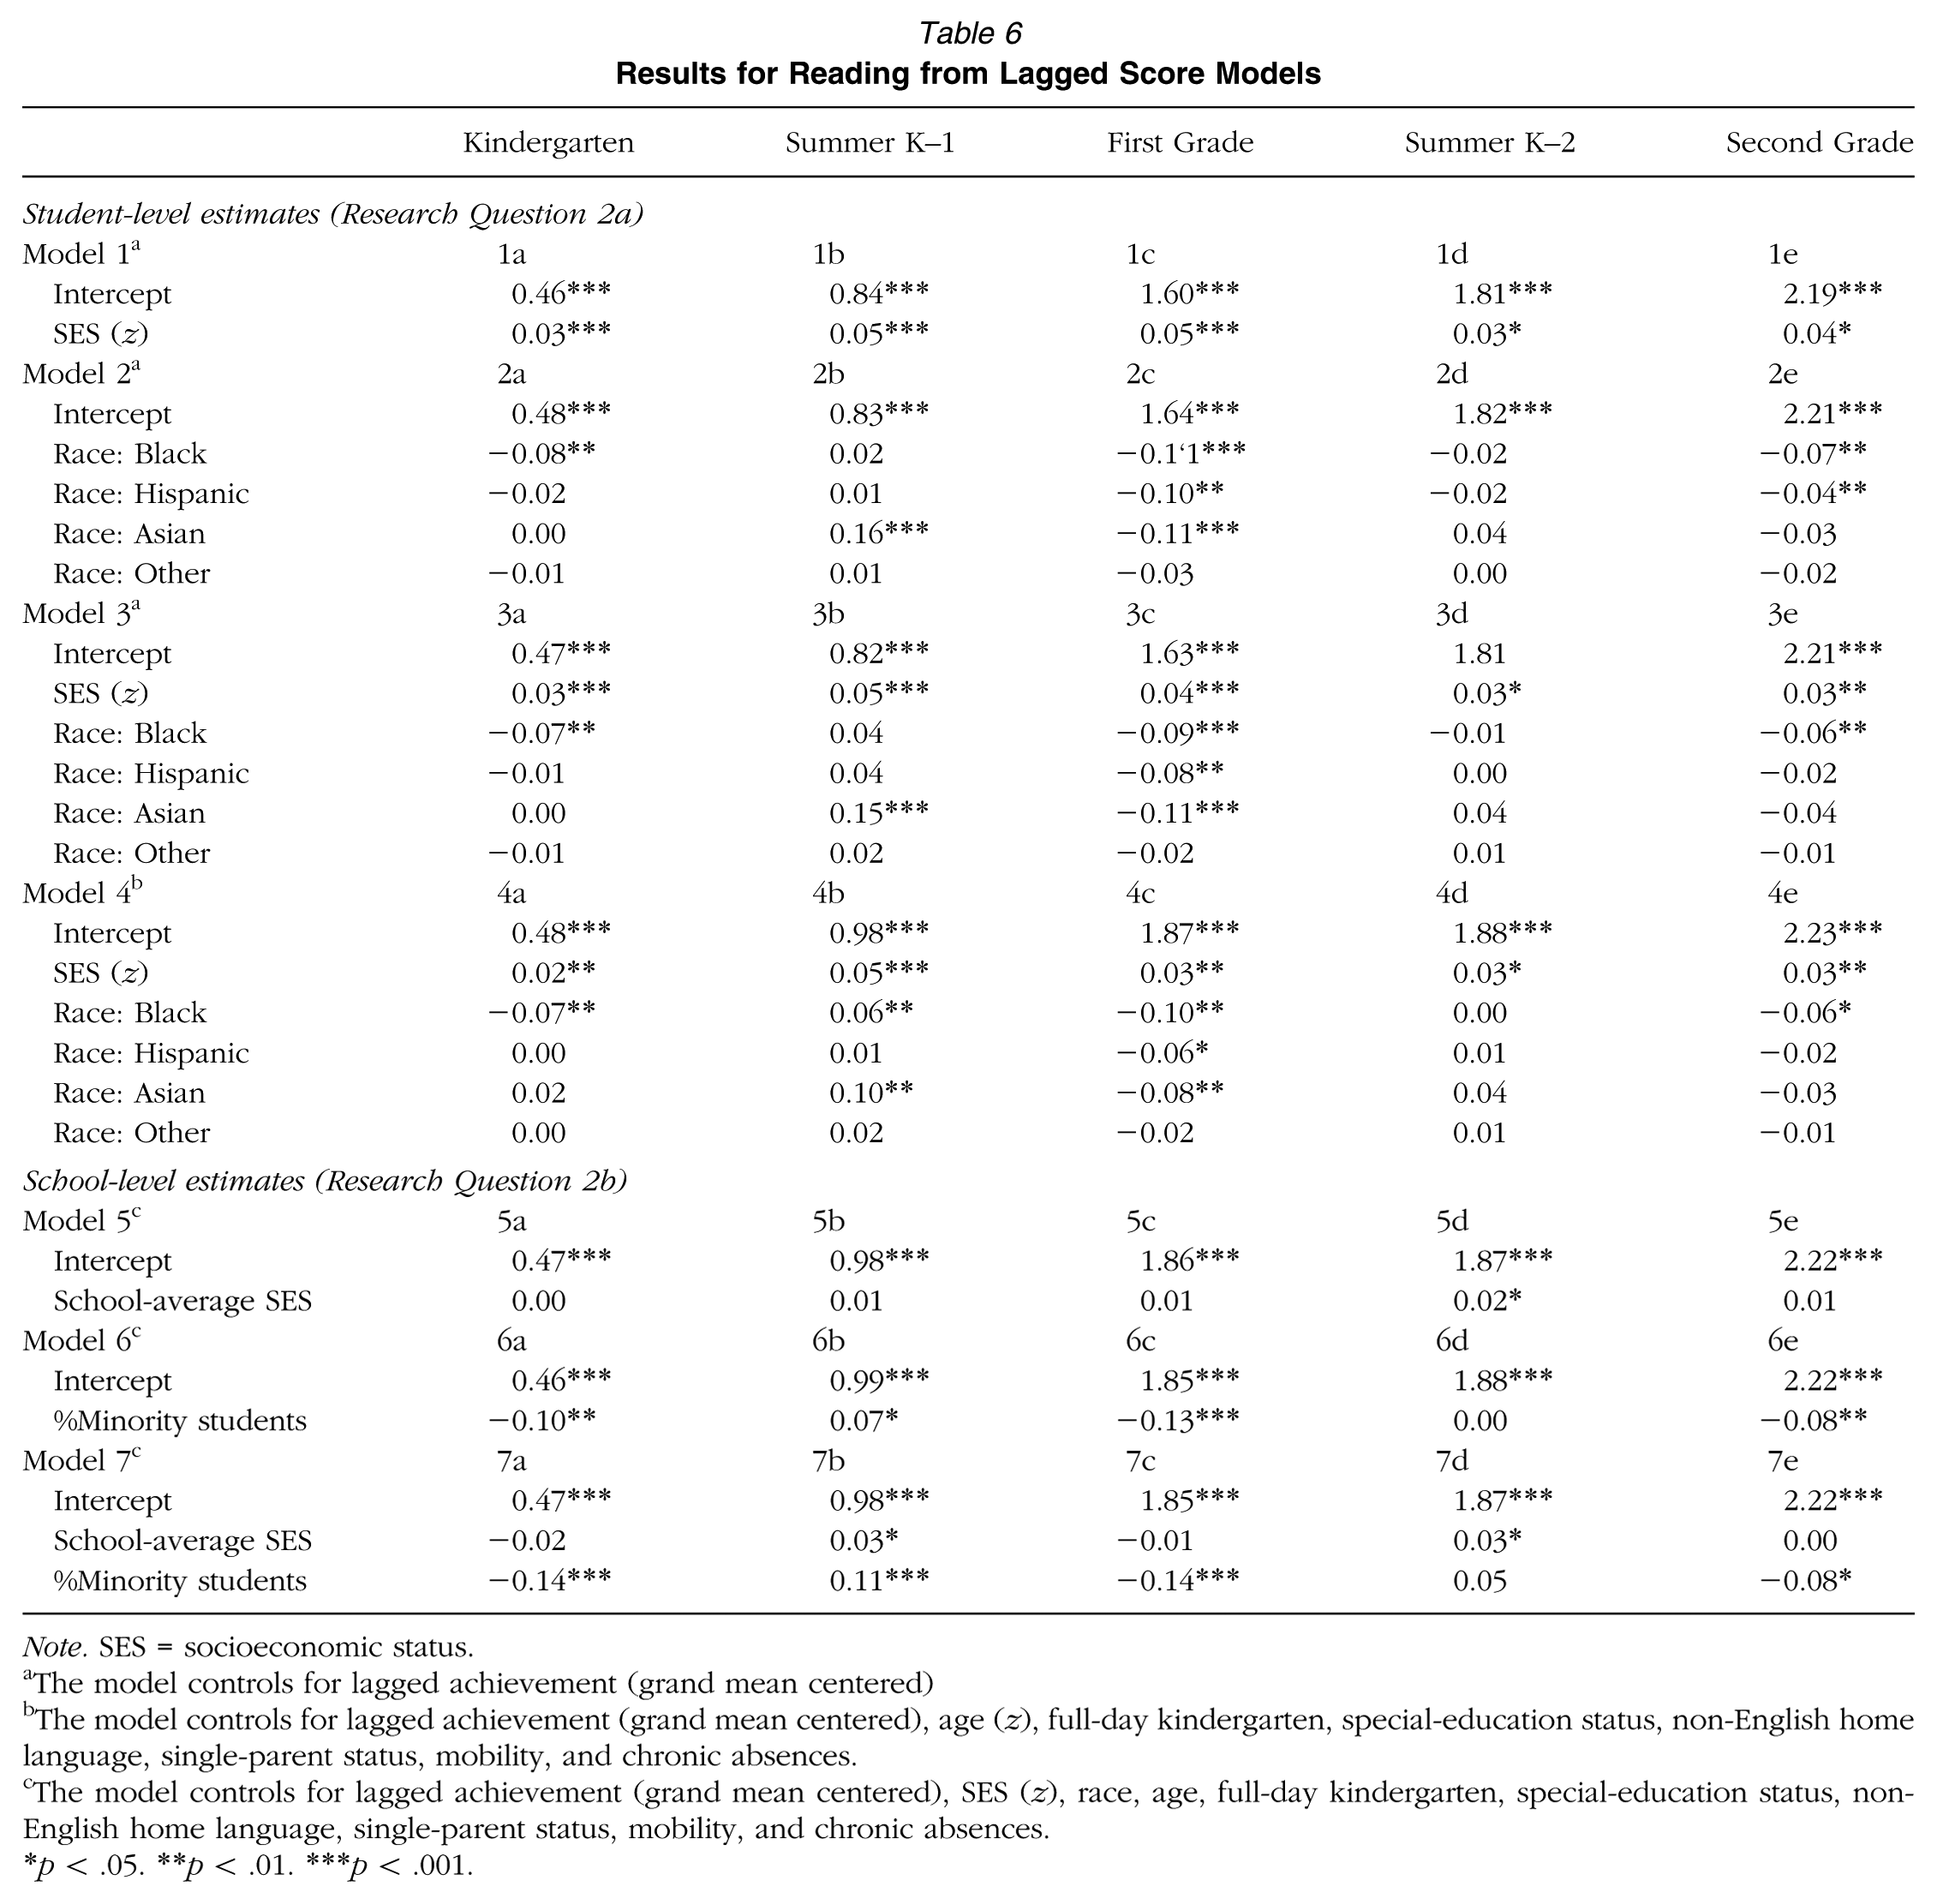
Models 1 to 4 in Table 6 address Research Question 1b regarding socioeconomic and racial/ethnic inequality in learning during the school year and the intervening summers. The models here examine inequality within a lagged score framework, thus comparing students who started each school year or summer period with the same reading skills. More specifically, the lagged score models explore group differences in end-of-period test scores while accounting for students’ test scores at the beginning of the period. Our primary consideration here is how the lagged score estimates differ from the growth estimates in terms of their portrayal of academic inequality. In contrast to the growth results, Model 1 in Table 6 indicates positive and statistically significant coefficients for SES for every growth period, both during the school years and during the intervening summers. This suggests widening SES-related inequalities among students who started each measurement period with similar initial achievement, contradicting the growth results to some degree. This is also visible in Figure 2, which shows the differential learning for low- versus high-SES students according to the lagged models. However, the summer learning SES estimates do lend some support to the compensatory findings noted above. Note that the school year and summer learning estimates are all positive and quite similar in magnitude. If low-SES children learn less during the school year (when school effects are present) and also during the summer months (when school effects are removed), the extent to which schooling widens SES-related inequalities is necessarily limited.
Results for Reading from Lagged Score Models
Note. SES = socioeconomic status.
The model controls for lagged achievement (grand mean centered)
The model controls for lagged achievement (grand mean centered), age (z), full-day kindergarten, special-education status, non-English home language, single-parent status, mobility, and chronic absences.
The model controls for lagged achievement (grand mean centered), SES (z), race, age, full-day kindergarten, special-education status, non-English home language, single-parent status, mobility, and chronic absences.
p < .05. **p < .01. ***p < .001.
Differential learning for high- and low-SES students according to lagged score models.
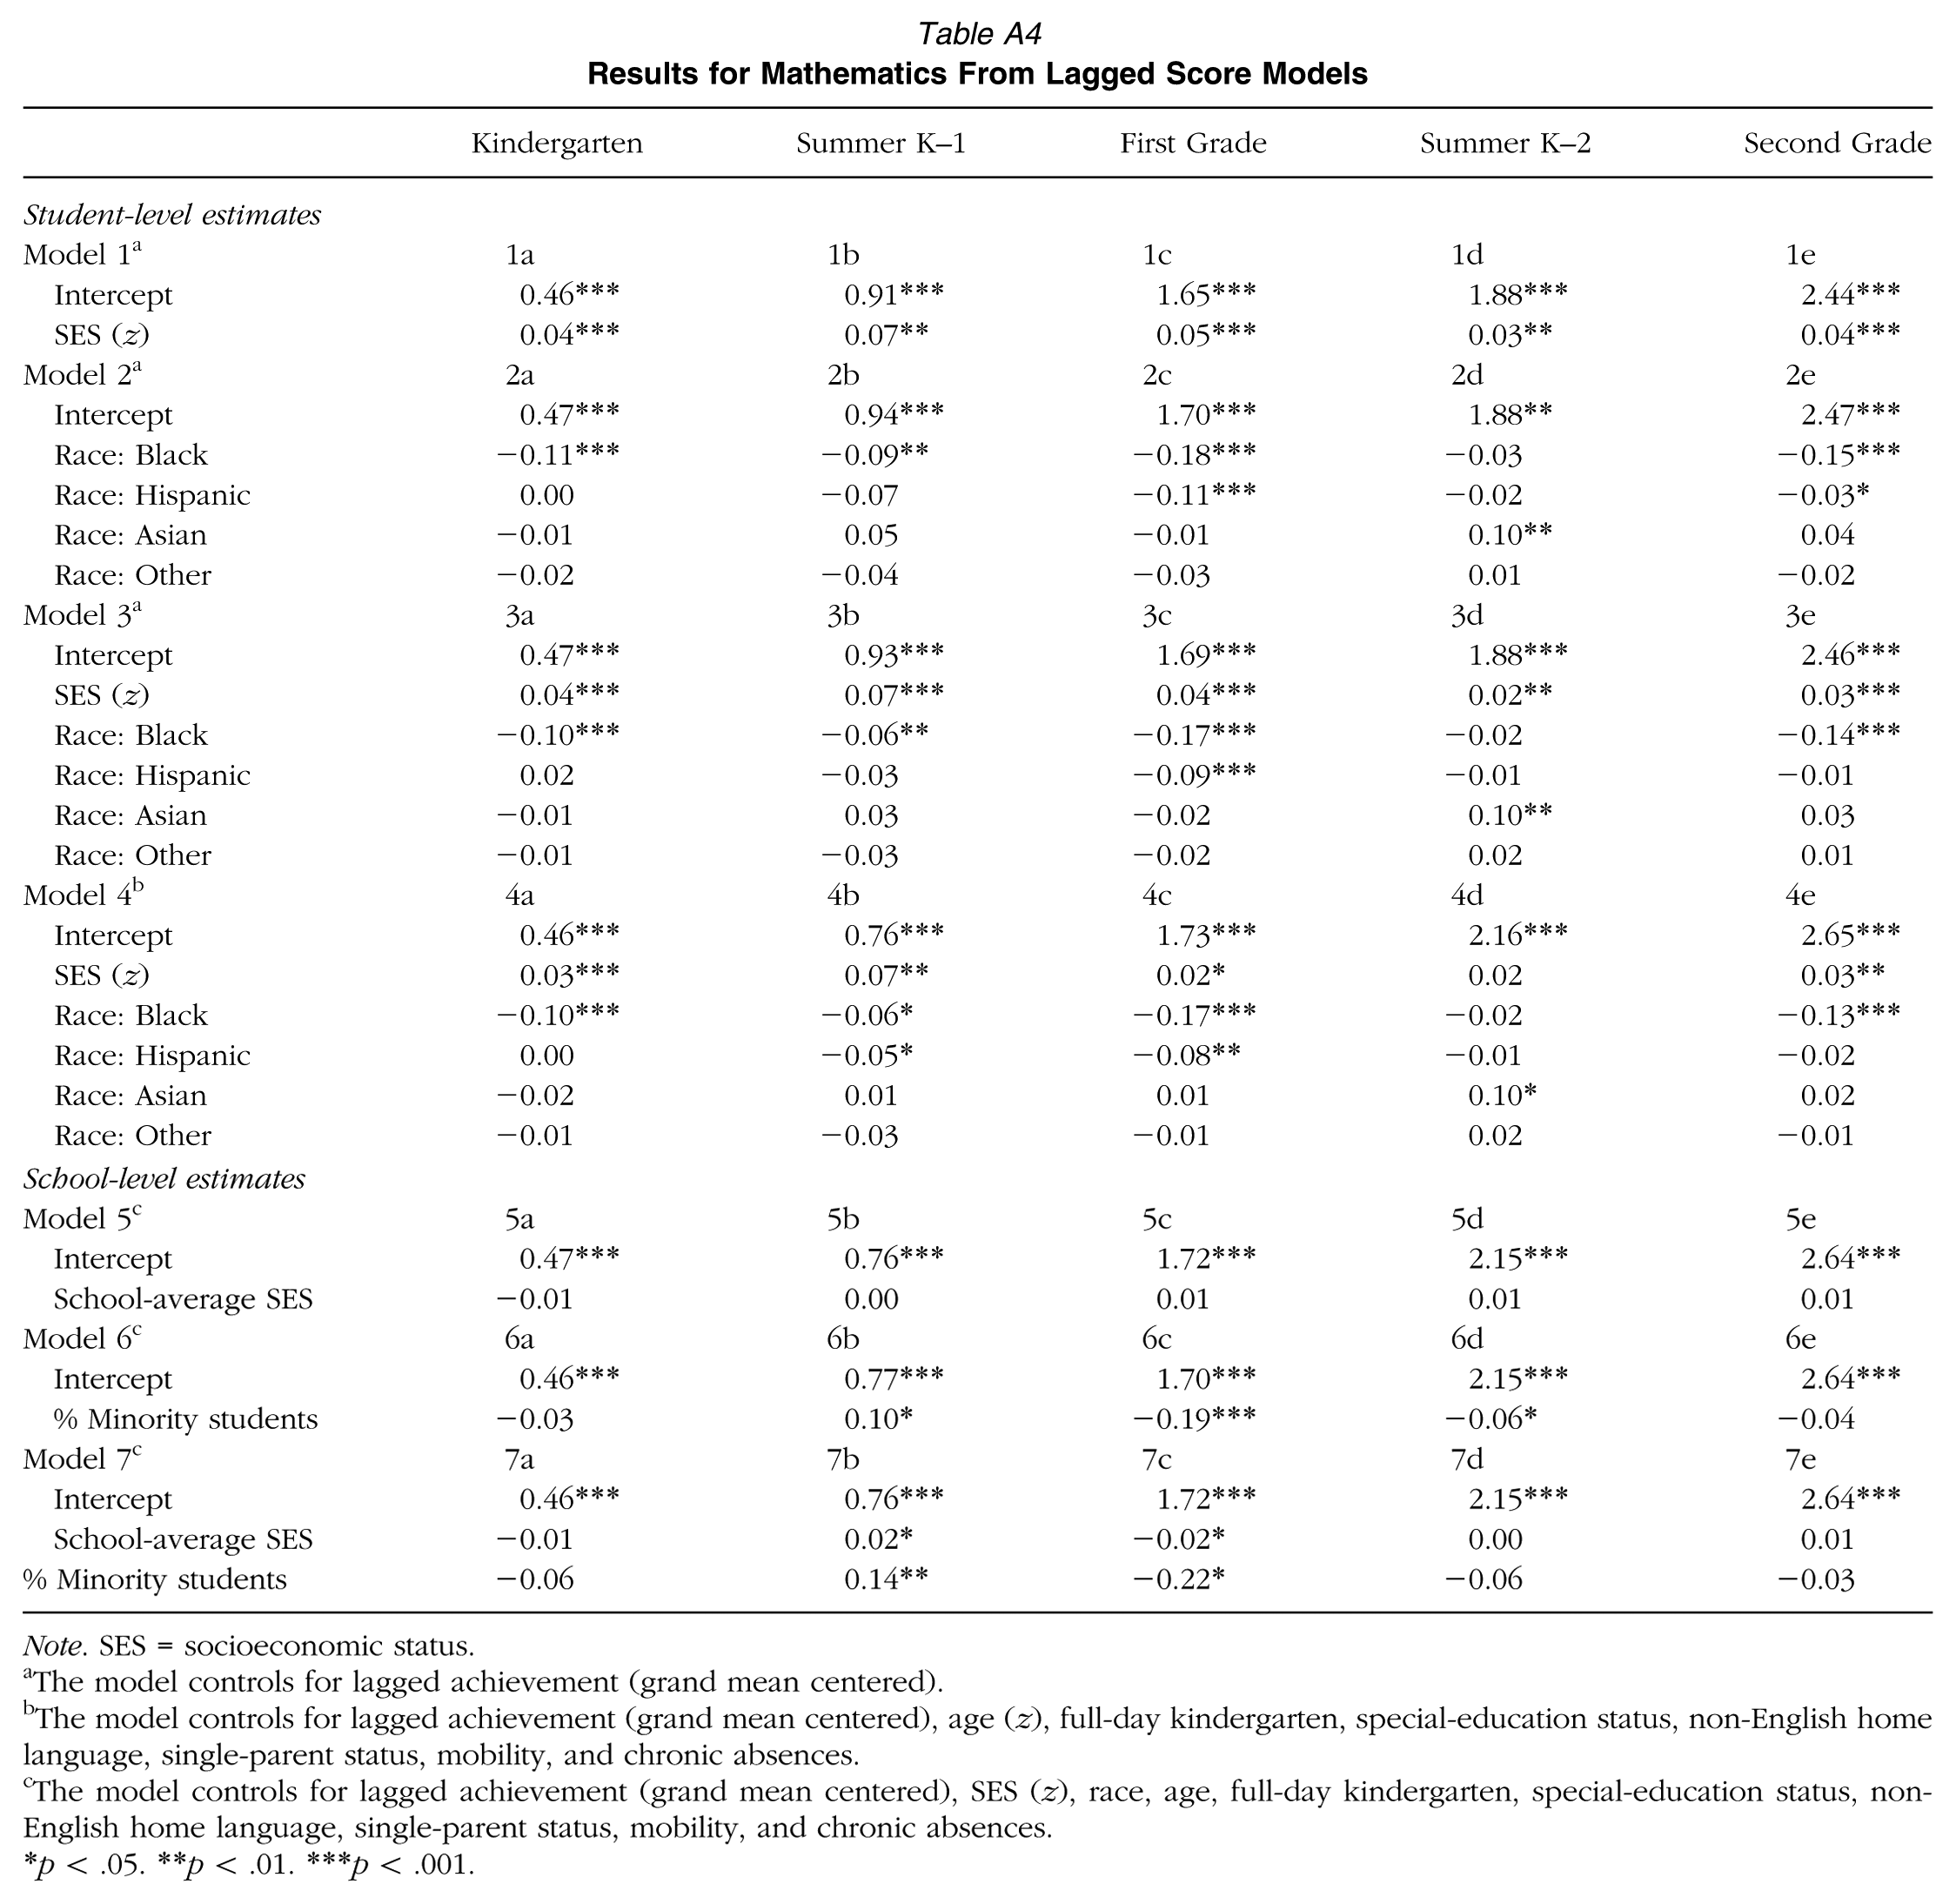
Inequalities between Black and White students with similar initial achievement levels also widened during elementary school, both unadjusted (Model 2) and adjusted (Model 3) for SES. Importantly, Black/White inequalities grew only during the school years, not during summer. The patterns are less consistent for Hispanic students, with widening inequalities only in first grade after controlling for SES. Asian students learned more than White students during the summer between kindergarten and first grade but learned less in first grade. These findings remained the same even after controlling for student SES. No differences in reading development were observed for other race/ethnicity students. The observed patterns for SES and race/ethnicity held even when other student characteristics were included in the model (Model 4). The findings for mathematics are quite similar (see Table A4 in the Appendix).
Reading Development and School Socioeconomic and Racial/Ethnic Composition
Research Question 2a: Findings From Piece-Wise Growth Models
Returning to Table 5, Model 5 begins to address Question 2a regarding the links between school socioeconomic and racial/ethnic composition and student reading development within a piece-wise growth model framework. As with the student-level findings described above, we concentrate here on whether the school-level growth estimates suggest that school demographics are associated with increasing or decreasing levels of academic inequality. These models adjust for the full complement of student-level covariates used in Model 4, including student-level indicators of SES and race/ethnicity. Even after accounting for the student-level associations described above, students in higher-SES schools gained slightly fewer reading skills each month. Specifically, the growth models indicate that, on an adjusted basis, a one–standard deviation increase in school-average SES is associated with a 0.01-point decrease in learning per month. In other words, students in lower-SES schools exhibit higher average learning rates. Within this analytic framework, schools may be regarded as compensatory institutions during kindergarten. However, school-average SES is unrelated to student learning after kindergarten.
Model 6 includes the same student-level controls but includes only percent minority enrollment at the school level. Even with the negative relationship between initial status and academic growth, and even after accounting for their own academic and sociodemographic backgrounds, students in schools with higher minority enrollments typically gained fewer skills each month. Specifically, attending a school that enrolled exclusively Black and Hispanic students compared with one that enrolled no Black or Hispanic students was associated with a 0.01-point decrease in monthly learning rates in both kindergarten and first grade (but not in second grade). To put this in perspective, given the 0.16-point average monthly learning rate in kindergarten, this suggests that kindergarteners in high-minority-enrollment schools gained just over 6% less each month. Note, however, that we do not find this link to be present during the summer months, suggesting that this school year effect is likely not due to unmeasured family or neighborhood influences.
Model 7 then incorporates both school-level demographic measures. Although the estimated coefficient for school-average SES remains identical regardless of school minority enrollments—again, schools are an equalizing force in kindergarten—the minority enrollment estimate grows somewhat larger once we account for school-average SES. Moreover, closely reflecting the student-level coefficients for Black students from Models 2 to 4, the school-average percent minority estimate is now both positive and significant during the summer after kindergarten: Students in higher-minority-enrollment schools learn less during the school year each month in kindergarten and first grade but learn more during the intervening summer. The identical models for mathematics produced very similar results to those for reading (see Table A3 in the Appendix).
Research Question 2b: Findings From Lagged Score Models
In contrast to the results from the piece-wise growth models, the school-level estimates in Models 5 to 7 from the lagged score models shown in Table 6 indicate no relationship between school-average SES and students’ reading development during the academic year. In fact, the estimated coefficients for school-average SES were only significant for the summer periods. This has important implications for school effects studies that use spring-to-spring comparisons, as their estimates may be “polluted” by the intervening summer months. The positive summer estimates we find associated with school-average SES would be captured within the school year effects reported in traditional lagged score studies, thus incorrectly attributing nonschool factors to learning during the school year.
In contrast, more closely mirroring the growth model results, we found negative and significant coefficients for school percent minority enrollment for all three school years—even after additionally controlling for school-average SES. Importantly, the respective coefficients were nonsignificant or even positive and significant during the summer periods, indicating that the observed negative coefficients for racial school composition were not driven by unobserved out-of-school factors. The results for mathematics are not as clear as for reading but overall point in the same direction (see Table A4 in the Appendix).
Discussion and Conclusion
The overarching aim of this article was to explore how the associations between initial achievement and achievement growth influence our understanding of the role schools play in academic inequality. Using nationally representative data from the ECLS-K:2011, we constructed parallel growth and lagged score models within both seasonal learning and school effects frameworks to address the associations between student- and school-level socioeconomic and racial/ethnic background and learning. Our findings suggest that seasonal comparative scholars, who generally argue that schools play an equalizing role, and scholars focused on school compositional effects, who typically report that schools exacerbate inequality, come to these contrasting findings not only because they ask different questions but also because they treat student initial achievement differently when modeling student learning.
At the student level, we estimated the associations between socioeconomic and racial/ethnic background and academic gains during the school year and during summer using piece-wise linear growth models, the common modeling approach employed in the seasonal comparative literature (Research Question 1a). Echoing the findings reported in this extant work—that schools are equalizing or neutral institutions—we found that SES gaps for both reading and mathematics narrowed during kindergarten and remained stable during the first and second grades (see also Quinn et al., 2016; Von Hippel et al., 2018). Conversely, lagged score models that also addressed inequalities at the student level, but compared gains among students who began a measurement period with the same level of achievement, suggested that SES-related inequalities widened not only during all three school years but also during the summers after kindergarten and first grade (Research Question 1b).
The observed disparities in SES estimates across modeling strategies stem from two related phenomena: (1) the substantial differences in initial achievement between demographic subgroups and (2) the associations between initial achievement and achievement growth, particularly in kindergarten. More specifically, the negative student-level associations between SES and development in kindergarten reading and mathematics indicated by the growth models reflect the fact that higher-SES students started school with stronger skills but kindergarteners with stronger initial skills actually learned less each month than students with initially weaker skills. As discussed above, this negative association between initial status and academic growth in kindergarten may stem from the psychometric properties of the assessments themselves, or it may reflect substantive real-world phenomena. There is, in fact, evidence that kindergarten teachers focus on skills that many students have already mastered (Claessens, Engel, & Curran, 2014; Engel, Claessens, & Finch, 2013; Engel, Claessens, Watts, & Farkas, 2016), meaning that kindergarten may indeed serve as a compensatory force for students who begin formal schooling with weak academic skills. Although these students are often from low-SES backgrounds, it is the case that low-achieving students catch up somewhat with their high-achieving peers (also visible in the decreasing variance in student test scores during the first 3 years of schooling that we observed), not that low-SES students narrow the gap separating them from their high-SES peers. This interpretation matches the findings from our lagged score models, which indicated that SES-related inequalities actually widened among students who started formal schooling with comparable skills.
For racial/ethnic inequalities, the findings were more consistent—and more consistently troubling—across modeling strategies. Both approaches indicated that Black/White inequalities in reading skills worsened somewhat during the first and second grades, and the lagged score approach suggested that the inequalities grew slightly wider during kindergarten as well. But what is perplexing—and completely counter to the “schools as equalizers” viewpoint—is that in no model did Black/White inequalities grow wider during the summer months. Indeed, the growth models even suggested that Black students may have learned more than their White peers during the summer after kindergarten. If the lack of formal schooling ostensibly explains why Black students begin kindergarten with lower average levels of academic skills, why then do Black/White inequalities grow faster once formal schooling begins? Previous scholars have reported similar results and raised similar questions (Condron, 2009; Downey et al., 2004; Entwisle & Alexander, 1992; Quinn et al., 2016; Von Hippel & Hamrock, 2018). The results for inequalities in Hispanic/White learning rates were less clear, but in the fully adjusted models across both approaches, Hispanic students fell behind White students during first grade and gained skills at comparable rates during kindergarten and second grade. In addition to the broader institutional and structural racism that is endemic to the United States (Crenshaw, 1988; Jones, 2002; Ladson-Billings & Tate, 1995), potential explanations for the lack of compensatory effects among Black and Hispanic students are many, including racial/ethnic mismatches between students and teachers (Downey & Pribesh, 2004), racialized disciplinary practices and beliefs that are present as early as preschool (Gilliam, Maupin, Reyes, Accavitti, & Shic, 2016), and inaccuracies in teacher perceptions of students’ abilities that are associated with race/ethnicity (Ready & Wright, 2011).
Turning to inequality at the school level, we also examined school socioeconomic and racial/ethnic compositional effects within a seasonal comparative framework. Employing piece-wise linear growth models, we analyzed whether school demographic composition was associated with academic gains after accounting for student socioeconomic and racial/ethnic background (Research Question 2a). We found evidence of compensatory school effects during kindergarten: Students in higher-SES schools learned less. Again, it is important to note that these results partly reflect the fact that higher-achieving students gained fewer skills in kindergarten and that higher-SES schools had higher average levels of initial kindergarten achievement. Indeed, we did not find an association between school socioeconomic composition and student learning in the lagged score models (which account for students’ initial achievement differences), the modeling strategy commonly used to investigate compositional effects (Research Question 2b).
Similar to the findings for racial/ethnic inequalities at the student level, the findings for school racial/ethnic composition were more consistent between the two modeling strategies. Both the growth models and the lagged score models indicated that students learned less in schools with higher percentages of minority students. Importantly, we observed these associations only during the school year and not during the summer months. These findings are in line with Quinn’s (2015) analyses of the same data showing that the Black-White gap in kindergarten reading development could be explained by differences located at the school level. As previous authors have noted, school racial/ethnic compositional effects may stem from inequalities in the economic, social, and cultural capital available to the school, as well as disparities in curricula, instruction, and student expectations (see Clotfelter, 2004; Kozol, 2005; Orfield & Lee, 2005). Harris (2010) suggested that school peer effects may also be driven by “group-based contagion” mechanisms, in the sense that peers influence one another’s beliefs and values. Moreover, the fact that public school teachers are predominantly White, often with little experience working with students of color, may lead to cultural disconnects that influence classroom processes and climates (Leath, Mathews, Harrison, & Chavous, 2019).
Methodological and Conceptual Differences in Studies of Inequality
Methodologically, both modeling strategies are accompanied by unique limitations. With the growth models, a question is the extent to which the estimates reflect (rather than address) the associations between initial achievement and subsequent achievement growth. In fact, this was noted long ago by Cronbach and Furby (1970), who argued against the use of gain scores because they often show a spurious advantage for persons low on the pretest score. With the ECLS-K data, this issue is certainly a concern with kindergarten learning, where performance at the start of kindergarten is strongly (and negatively) associated with monthly learning rates but less so in the first and second grades, when the initial achievement/achievement growth associations have faded.
Another important consideration is how the growth models and lagged score models respond to measurement error in the standardized assessments. In this regard, the growth models may be preferable as they are less susceptible to test measurement error, which is contained in the outcome. With the lagged score models, however, the pretest will be correlated with the error term, thus producing potentially biased estimates (see the findings by Quinn, 2015). For this reason, some scholars (Allison, 1990) have argued that the gain score model is superior to the lagged score model.
Taken together, there are advantages and disadvantages in both modeling approaches. It is thus not surprising that the question of whether gain score or lagged score approaches are preferable has flummoxed researchers for decades (see Kenny, 1975; Maris, 1998; van Breukelen, 2013). This particularly holds for studies focused on groups with large preexisting test score differences, as our study clearly does here. In such cases, most scholars advise running the analyses both ways, checking if the results converge, and only trusting those findings for which the two modeling strategies come to the same conclusion with regard to the presence and direction of an effect (Allison, 1990; Kenny, 1975; van Breukelen, 2013). In our current study, we find little convergence across modeling strategies in terms of our student-level SES estimates. However, the fact that these quite different approaches both indicated that Black/White inequalities widen during kindergarten and first grade but are stable or even narrow during the intervening summer indicates a robust finding that deserves continued researcher and practitioner scrutiny.
Beyond these differences between the gain score and lagged score approaches, there are also broader issues associated with selection bias and unobservables. In contrast to the seasonal comparison literature, which at its core simply provides descriptive estimates of learning rates during the school year and summer, the school effects literature often seeks to make causal claims, generally in the absence of causal methods. This issue is particularly relevant to efforts to estimate school compositional effects, given the nonrandom assignment of students to schools (Reardon & Owens, 2014).
But there are also conceptual differences between the two research strands studying the role of schools regarding inequality that may even outweigh these important methodological considerations, namely a macro versus micro view of inequality. The seasonal comparison literature, which seeks to develop a broad understanding of whether schools or nonschool factors are the primary sources of inequality, is generally not interested in the specific mechanisms that exacerbate or ameliorate academic inequality. In contrast, the school effects scholars are typically less interested in the macro question of the relative impacts of school versus nonschool factors posed by the seasonal comparison scholars. Instead, this literature focuses on the specific microlevel mechanisms that influence student outcomes during the academic year. We believe that integrating both perspectives, as we have attempted to do in the present study, will advance our understanding of the role of schools in inequality. For example, school effects studies might well benefit from further integrating seasonal effects conceptualizations, although such analyses would clearly depend on the availability of data that support such designs. Similarly, seasonal comparative studies might equally benefit from analyzing specific school mechanisms that can explain the equalizing role of schools.
Limitations
It is important to bear in mind that these analyses focus exclusively on young children at the very start of formal schooling. As such, the saliency of our findings to subsequent grades is an important consideration. Even our own analyses suggest that learning patterns differ across kindergarten and first and second grades, and these grades are instructionally more similar compared with later years, when students typically experience subject-based classrooms, there is an increased emphasis on accountability and standardized assessments, and students are themselves at very different points in their own developmental trajectories. Moreover, our models employed only academic measures as outcomes. How our findings would differ were we to focus on other important outcomes, such as children’s executive functioning or their physical or socio-emotional development, remains unclear. Given the modest size of the estimates we report here, one might also question their importance or relevance. However, small effects accumulate and will increasingly influence student opportunities over time (Prentice & Miller, 1992). For example, even minor differences in achievement can affect student placement into ability groups or courses, and these placements themselves influence subsequent student outcomes (see Pallas, Entwisle, Alexander, & Stluka, 1994).
Implications
What does our study tell us about the role schools play in academic inequality among young students? The fact that variance in both reading and mathematics test scores decreases steadily during the first three years of formal schooling is a compelling argument for the compensatory nature of schooling for students entering kindergarten with different cognitive skills, and the phenomenon is certainly worthy of further study. And importantly, this finding is not dependent on the modeling strategies on which our study focuses. However, the overall decrease in variance does not, ipso facto, indicate that inequality among particular sociodemographic subgroups increases or decreases over time. To address such questions, one must model these associations directly.
In terms of socioeconomic disparities, our findings imply that the appropriate question is perhaps not “Are schools to blame?” but, rather, “Do SES-related inequalities grow at all?” According to the growth models, SES gaps in reading skills narrowed somewhat during kindergarten and widened slightly during the following summer, but they grew no larger over the next 2 years. Given the very large initial inequalities present at kindergarten entry, and their subsequent stability, these models do suggest that schooling is a compensatory force. However, as noted above, this analytic approach does not account for achievement differences that already exist at the beginning of kindergarten. In contrast, the lagged score models, which do account for these differences, suggest that SES-related inequalities widen during every school year and summer period from the start of kindergarten to the end of second grade when comparing students who started out at the same achievement level. But given that SES-related inequalities grew at almost the same pace during the school year and summer months, it is unclear what role schools play in contributing to inequality.
It is important to keep in mind that scholars typically rely on only one modeling approach, namely the one most common in their respective research field. For instance, employing the growth model results for the school year and summer learning—the typical approach in seasonal comparative studies—scholars would have concluded that schools are equalizing forces. In contrast, analyzing the data within a lagged score model by only comparing students with the same initial achievement levels and only considering those findings during the school year—what most studies in the school effects tradition do—scholars would have come to the conclusion that schools are disequalizing institutions. Taking both modeling approaches into account and considering the large initial achievement differences that exist between students from high- and low-SES backgrounds, it may be safest to say that schools as a whole play a rather neutral role when it comes to socioeconomic inequalities in the early years of schooling. However, this is not to say that there may not be specific disequalizing and equalizing mechanisms simultaneously at play in schools. These are important to understand in order to increase the educational opportunities of students from different socioeconomic backgrounds.
The story with racial/ethnic inequalities is more consistent across analytic approaches. Both approaches indicated that Black/White inequalities in reading widened during the first and second grades and that Hispanic/White disparities grew during first grade. Neither approach suggested that during the academic year Black or Hispanic students narrowed the gaps present at kindergarten entry. Hence, in particular for Black/White inequalities, schools seem to be disequalizing institutions. This assertion is in line with recent work indicating the differential benefits of effective teaching, which exacerbate Black/White disparities (and to a lesser extent Hispanic/White disparities) but do not widen economic achievement gaps (Hanselman, 2018).
Taken together, findings suggest that depending on the outcome in question, seasonal comparative scholars and scholars interested in the effects of certain school characteristics such as school demographic composition have perhaps arrived at different and potentially contradictory conclusions about the role of schools because they have—in line with their disparate research questions—employed different analytic strategies. The goal of this study was to draw attention to the divergent methodological habits of both research strands and raise awareness among education researchers that methodological decisions carry tremendously important ontological and epistemological import regarding “how inequality works.”
Footnotes
Appendix
Results for Mathematics From Lagged Score Models
| Kindergarten | Summer K–1 | First Grade | Summer K–2 | Second Grade | |
|---|---|---|---|---|---|
| Student-level estimates | |||||
| Model 1 a | 1a | 1b | 1c | 1d | 1e |
| Intercept | 0.46*** | 0.91*** | 1.65*** | 1.88*** | 2.44*** |
| SES (z) | 0.04*** | 0.07** | 0.05*** | 0.03** | 0.04*** |
| Model 2 a | 2a | 2b | 2c | 2d | 2e |
| Intercept | 0.47*** | 0.94*** | 1.70*** | 1.88** | 2.47*** |
| Race: Black | −0.11*** | −0.09** | −0.18*** | −0.03 | −0.15*** |
| Race: Hispanic | 0.00 | −0.07 | −0.11*** | −0.02 | −0.03* |
| Race: Asian | −0.01 | 0.05 | −0.01 | 0.10** | 0.04 |
| Race: Other | −0.02 | −0.04 | −0.03 | 0.01 | −0.02 |
| Model 3 a | 3a | 3b | 3c | 3d | 3e |
| Intercept | 0.47*** | 0.93*** | 1.69*** | 1.88*** | 2.46*** |
| SES (z) | 0.04*** | 0.07*** | 0.04*** | 0.02** | 0.03*** |
| Race: Black | −0.10*** | −0.06** | −0.17*** | −0.02 | −0.14*** |
| Race: Hispanic | 0.02 | −0.03 | −0.09*** | −0.01 | −0.01 |
| Race: Asian | −0.01 | 0.03 | −0.02 | 0.10** | 0.03 |
| Race: Other | −0.01 | −0.03 | −0.02 | 0.02 | 0.01 |
| Model 4 b | 4a | 4b | 4c | 4d | 4e |
| Intercept | 0.46*** | 0.76*** | 1.73*** | 2.16*** | 2.65*** |
| SES (z) | 0.03*** | 0.07** | 0.02* | 0.02 | 0.03** |
| Race: Black | −0.10*** | −0.06* | −0.17*** | −0.02 | −0.13*** |
| Race: Hispanic | 0.00 | −0.05* | −0.08** | −0.01 | −0.02 |
| Race: Asian | −0.02 | 0.01 | 0.01 | 0.10* | 0.02 |
| Race: Other | −0.01 | −0.03 | −0.01 | 0.02 | −0.01 |
| School-level estimates | |||||
| Model 5 c | 5a | 5b | 5c | 5d | 5e |
| Intercept | 0.47*** | 0.76*** | 1.72*** | 2.15*** | 2.64*** |
| School-average SES | −0.01 | 0.00 | 0.01 | 0.01 | 0.01 |
| Model 6 c | 6a | 6b | 6c | 6d | 6e |
| Intercept | 0.46*** | 0.77*** | 1.70*** | 2.15*** | 2.64*** |
| % Minority students | −0.03 | 0.10* | −0.19*** | −0.06* | −0.04 |
| Model 7 c | 7a | 7b | 7c | 7d | 7e |
| Intercept | 0.46*** | 0.76*** | 1.72*** | 2.15*** | 2.64*** |
| School-average SES | −0.01 | 0.02* | −0.02* | 0.00 | 0.01 |
| % Minority students | −0.06 | 0.14** | −0.22* | −0.06 | −0.03 |
Note. SES = socioeconomic status.
The model controls for lagged achievement (grand mean centered).
The model controls for lagged achievement (grand mean centered), age (z), full-day kindergarten, special-education status, non-English home language, single-parent status, mobility, and chronic absences.
The model controls for lagged achievement (grand mean centered), SES (z), race, age, full-day kindergarten, special-education status, non-English home language, single-parent status, mobility, and chronic absences.
p < .05. **p < .01. ***p < .001.
Notes
H
D