
Abstract
Scholars have argued that schools are “equalizers” because inequalities in test scores by race/ethnicity and socioeconomic status (SES) grow faster over summer vacation than over the school year. In this study, we use nationally representative data from the Early Childhood Longitudinal Study–Kindergarten Classes of 1998–1999 and 2010–2011 to examine the extent to which such patterns have changed over time. Results suggest that more between-group equalizing by race/ethnicity and SES occurred over kindergarten in the recent cohort. However, this was often followed by more inequality widening over summer and more widening or less narrowing over first grade in the latter cohort. The net result was that in recent years, inequality tended to widen more (Black-White) or narrow less (SES and Hispanic-White) over the first 2 years of schooling.
Keywords
Since at least the early 20th century, social scientists and educators have worried about the potential negative impact of summer vacation on student learning (Cooper, Nye, Charlton, Lindsay, & Greathouse, 1996). Researchers have been particularly focused on whether summer learning rates differ by students’ socioeconomic status (SES) or race/ethnicity in ways that exacerbate between-group inequalities in educational outcomes. Early studies generally found that inequality in literacy by SES grew over the summer (Cooper et al., 1996) and at a faster rate as compared with the school year (Alexander, Entwisle, & Olson, 2001; Heyns, 1978). This evidence was often interpreted as showing that schools were “equalizers” (Alexander et al., 2001; Downey, von Hippel, & Broh, 2004). Summer loss was also generally found in math but equally for students across SES backgrounds (Cooper et al., 1996).
An underexamined question in this line of research is whether and how these patterns might be changing over time. As compared with earlier work, recent studies have drawn more mixed conclusions regarding the seasonal dynamics of achievement inequality (Atteberry & McEachin, 2016; Quinn, Cooc, McIntyre, & Gomez, 2016; von Hippel & Hamrock, 2016). Beneath the cross-study differences in test scaling, modeling, and design, it is difficult to know whether meaningful time trends are occurring. Yet there are reasons to expect that between-group inequality dynamics may have changed over the past several decades. To begin with, inequality in income and parental spending on children’s education has been growing (Duncan & Murnane, 2011; Kornrich & Furstenberg, 2013), and the country is becoming increasingly segregated by income and race (Orfield & Frankenberg, 2014; Reardon & Bischoff, 2011). These trends would lead one to expect that achievement inequalities may be widening more over the school year and summer today as compared with the recent past. At the same time, however, there have been efforts to improve early childhood education for children from low-income backgrounds, and the academic rigor of kindergarten (K) has been increasing more for students from low-income backgrounds versus students from wealthier backgrounds (Bassok, Latham, & Rorem, 2016). This would lead to the prediction that, at least over K, inequality trends may be improving.
In this article, we contribute to the literature on seasonal learning by examining the extent to which the equalizing effect of schools on learning disparities by race/ethnicity and SES has been changing over time. The recent availability of data from the Early Childhood Longitudinal Study–Kindergarten Class of 2010–2011 (ECLS-K:2011) provides an opportunity to investigate this question by comparing the seasonal trends across two nationally representative cohorts of students: the ECLS-K:2011 and the Early Childhood Longitudinal Study–Kindergarten Class of 1998–1999 (ECLS-K:1999). In past work, researchers analyzed each ECLS-K cohort separately (Downey et al., 2004; Quinn et al., 2016; von Hippel, Workman, & Downey, 2018) but did not formally test for changes in seasonal patterns across cohorts. 1 By comparing two nationally representative studies with quite similar designs, we offer evidence regarding the extent to which true time trends may underlie the contrasting results across decades. When used alongside other evidence, basic descriptive facts such as these will be useful to policy makers aiming to end disparities in educational outcomes by race/ethnicity and SES.
We find that in general, more between-group equalizing occurred over K in 2010–2011 versus 1998–1999. This is in line with research showing that K has become more academically focused of late and that this change has been more pronounced in schools serving students from low-income backgrounds (Bassok et al., 2016). However, this positive trend did not continue past K. Over the post-K summer in 2011, inequalities were stagnant or widened more (vs. 1999), and the equalizing effect of schools did not continue into first grade in 2011–2012. These patterns are what might have been anticipated from research showing increasing segregation and growing gaps in educational spending (Evans, Schwab, & Wager, 2017; Kornrich & Furstenberg, 2013). The net result over the first 2 years of schooling was that achievement inequalities by race/ethnicity and SES widened more or narrowed less in the recent cohort.
Background
Summer Loss and Seasonal Patterns in Inequality
In an early comprehensive review of the literature, Cooper and colleagues (1996) summarized several key findings on summer loss and between-group inequality. They concluded that on average (a) students’ achievement scores declined over summer vacation, (b) declines were sharper for math than reading, and (c) the extent of loss was larger at higher grade levels. Importantly, they also concluded that (d) income-based reading inequality grew over the summer, given that middle-class students tended to show improvement in reading skills while lower-income students tended to experience loss. However, they did not find differential summer learning by income status in math or by gender or race in either subject.
The ECLS-K:1999 provided an opportunity to update the picture of seasonal learning dynamics in a nationally representative sample. Downey and colleagues (2004) found that, when controlling for race and other variables, literacy inequality by SES widened more quickly over the summer after K than it did over K or first grade. SES math inequality widened over K, did not change over the summer, and then narrowed over first grade. Schools seemed to narrow Asian-White inequality but exacerbate Black-White inequality. Overall, the authors interpreted their findings as evidence that schools generally served as equalizers.
Recent studies on seasonal learning patterns showed mixed results. Analyzing the ECLS-K:2011, Quinn and colleagues (2016) concluded that the data were consistent with a story in which schools initially narrow inequalities (with the exception of Black-White inequality) but do not maintain this equalizing over time. In some cases, the trend reversed as students aged such that less equalizing occurred over the school year than the summer. The authors did not find consistent evidence of inequality widening over the summer, though one robust summer result was that SES math inequality widened the summer after K. The dynamics of other between-group differences over the summer depended on whether inequality was operationalized in absolute terms (difference in score gains) or relative terms (changes in z scores).
Another important source of recent data on seasonal learning patterns is the NWEA Measures of Academic Progress. In line with the ECLS-K:2011 findings, some researchers using national (but not nationally representative) NWEA data found that average-achieving students experience flat learning trajectories over the summer (Rambo-Hernandez & McCoach, 2015). However, another analysis based on NWEA data from over a half million second-through-ninth graders from a southeastern state showed that the average student lost between 25% and 30% of his or her school year learning over the summer (Atteberry & McEachin, 2016). Some NWEA studies showed that inequalities in test scores by race/ethnicity and SES tend to widen over the summer (Atteberry & McEachin, 2016; McCall, Hauser, Cronin, Kingsbury, & Houser, 2006) as well as the school year (Atteberry & McEachin, 2016).
Methodological issues in seasonal analyses
A theme in the recent literature has been the sensitivity of estimates of seasonal inequality patterns to issues of test scaling, modeling, and how inequality is operationalized. Quinn and colleagues (Quinn, 2015; Quinn et al., 2016; Quinn & McIntyre, 2017) emphasized that alternative ways of operationalizing inequality dynamics can lead to different, but not necessarily contradictory, conclusions. Using data from the ECLS-K:1999, Quinn (2015) found that, depending on factors such as modeling strategy and reliability adjustment, one might conclude that Black-White inequality narrows, widens, or remains constant over the summer after K. Patterns can also appear to differ depending on whether one is tracking the size of absolute between-group mean differences over time or changes in relative position (Quinn et al., 2016).
Von Hippel and Hamrock (2016) questioned the conclusions from early seasonal studies on psychometric grounds. For example, the authors argued that in the landmark Beginning School Study (Alexander et al., 2001; Entwisle & Alexander, 1992), the practice of changing the test form in the fall had the effect of exaggerating the extent of summer learning loss. In the ECLS-K:1999, the test scales included in early data releases were “number right true scores,” or estimates of how many test items a student would have answered correctly had he or she taken all of the items in the bank. Such scales do not have claim to equal-interval properties, given that the test items vary in their difficulty. The authors’ analyses based on test scales with greater theoretical claim to interval properties did not show the same dramatic inequality widening as students aged. Overall, von Hippel and Hamrock concluded that, net of artifacts, much of the observed between-group inequality is already present at school entry.
Faucet Theory and School versus Out-of-School Learning
Entwisle, Alexander, and Olson’s (2000) “faucet theory” offers an explanation for why schools may play a compensatory role when it comes to achievement inequality by income status. According to the theory, the “resource faucet” is on for all students during the school year, enabling students from all backgrounds to make learning gains. Over summer, however, the flow of resources slows for students from disadvantaged backgrounds more so than for students from advantaged backgrounds. Put differently, although high SES students may have access to more or higher-quality resources at school as compared with low SES students, the inequality by SES in home resources is even greater (Downey et al., 2004; Raudenbush & Eschmann, 2015). As such, schools play a compensatory role for low SES students, with inequality in learning widening over the summer but remaining constant (or widening less) over the school year. In early studies, the faucet theory seemed to apply specifically to literacy. The explanation was that students’ experiences with vocabulary and print exposure differed by social class over the summer, while students of all backgrounds tended to lose access to math-related instructional experiences when school was out of session (Alexander et al., 2007; Cooper et al., 1996).
Of particular relevance to summer learning, Lareau (2003) argued that middle- and working-class parents engage in different parenting styles that have consequences for their children’s development. According to Lareau, middle-class parents engage in “concerted cultivation” to intentionally guide their children’s personal and intellectual development. This involves, for example, enrolling their children in organized activities to impart important life skills. Working-class parents, in contrast, allow for children’s natural growth; that is, according to Lareau, they tend to believe that the parents’ role is to provide for their children rather than actively nurture their talents and intellect.
Chin and Phillips (2004) investigated how different parenting approaches might relate to students’ time use over the summer, and they found that the structure and substance of students’ summer experiences differed by social class. However, the authors concluded that these differences stemmed more from parents’ differential access to resources, as opposed to differences in their desires to cultivate children’s skills and talents. Such resources include the financial resources required for entry into summer programming, the human capital to best assess and support their children’s skills, the cultural capital to help students develop their talents, and the social capital to access summer opportunities.
Quantitative researchers examining children’s summer activities also found differences by social class on activities relevant to academic development. Gershenson (2013) analyzed time-use diaries and found that the largest difference in students’ time use by SES over the summer was in television viewing, with students from low-income families watching 2 hr more per week, on average, as compared with students from wealthier households. Additionally, students from low-income backgrounds spent an average of 12 min less per week in conversation with adults, and their parents spent less time facilitating their children’s activities over the summer.
Using data from the ECLS-K:1999, Burkam, Ready, Lee, and LoGerfo (2004) found that over the summer after K, higher SES parents reported taking their children to the library and bookstore more often, as well as taking their kids on more summer trips. Higher SES parents also reported that their children more frequently used the computer for educational purposes, watched less television, and were more likely to participate in sports or other organized activities. High SES students were less likely to attend required summer school, but there were no significant differences by SES in optional summer school attendance or parents’ reported frequency of math activities with kids. While there are theoretical reasons to expect that such differences in time use may lead to learning differences over the summer, the ECLS self-report scales for these activities only modestly explained variation by social class in summer learning. Borman and colleagues similarly found, using data collected through a randomized trial of a summer school program in Baltimore, that parental expectations and home-based learning activities did not predict much variation in summer learning. However, the authors did find that parents’ promotion of students’ summer school attendance seemed to help prevent summer learning loss (Borman, Benson, & Overman, 2005).
The seasonal patterns of inequality during the early years of schooling may be particularly consequential. Raudenbush and Eschmann (2015) proposed a model of school effects in which students benefit more from instruction when they begin at higher skill levels. When children develop skills at a young age, they increase their capacity to benefit from future instruction. Early gains are therefore more valuable than later gains because of this compounding effect. The authors also argued that access to K will disproportionately benefit low SES students because (a) the school/nonschool contrast is greater for low SES students and (b) the skill difference by SES is smaller among young children, limiting the extent to which high-skill high SES students differentially benefit from instruction.
Why Might Seasonal Inequality Patterns Be Changing Over Time?
Several trends lead to the prediction that the seasonal inequality patterns may have gotten worse over the period covered by the two ECLS-K studies. To begin with, income inequality widened over these years (Reardon & Portilla, 2016). Perhaps fueled in part by this, longitudinal evidence suggests that high-income parents have been increasing spending on their children’s cognitive development more so than low-income parents (Duncan & Murnane, 2011; Kornrich & Furstenberg, 2013). This trend may be responsible for the observed widening of income-based test score inequality in cohorts of students born between 1970 and 2001 (Reardon, 2011). Higher incomes may also enable parents to spend more time with their children in ways that promote children’s cognitive development. Over this period, the amount of time that college-educated parents spent with their children rose more so than it did for parents without a college degree (Ramey & Ramey, 2010). According to the faucet theory, such investments are most relevant when school is out of session. Consequently, these findings suggest that test score inequality may be growing more over the summer today than in the past.
A major event that took place between ECLS studies was the Great Recession, which occurred over important formative years for the ECLS-K:2011 cohort. Economically, the recession more negatively affected lower-income families, and Black-White and Hispanic-White wealth disparities grew (Kochhar & Fry, 2014). Also important, the recession appears to have affected state and local education budgets (Chakrabarti & Livingston, 2013; Leachman & Mai, 2014), and lower-income schools were harder hit (Evans et al., 2017). Given evidence that family income (Dahl & Lochner, 2012; Duncan, Morris, & Rodrigues, 2011) and school spending (Candelaria & Shores, 2017; Jackson, Johnson, & Persico, 2016) affect children’s educational outcomes, we might expect that the recession influenced students’ in-school and out-of-school learning. Indeed, some evidence suggests that the recession significantly reduced math and reading achievement, with effects concentrated among students in low-income districts and those serving higher proportions of minoritized students (Shores & Steinberg, 2017).
Research also showed that residential segregation by income grew over the period covered by the ECLS-K studies (Bischoff & Reardon, 2014). This is relevant to studies of seasonal inequality because neighborhood environments are predictive of children’s educational outcomes (e.g., Chetty, Hendren, & Katz, 2016). Additionally, analyses based on the ECLS-K:1999 indicated that neighborhood factors predict student learning over summer vacation (Benson & Borman, 2010). Segregation can lead to diverging learning trajectories over the school year as well, given that many school quality indicators differ systematically with the income levels and racial makeup of the student body (Fryer & Levitt, 2004; Jackson, 2009).
While the trends described here all lead to the expectation that between-group inequality may be getting worse over the school year and summer, comparative evidence from the ECLS-K studies shows trends that might lead to more between-group equalizing over the K school year today as compared with the recent past. At the same time as states began attempting to raise academic rigor by adopting the Common Core Standards, K teachers reported spending more time on advanced math content (Engel, Claessens, Watts, & Farkas, 2016). As compared with K teachers in 1998, K teachers in 2010 reported higher academic expectations for incoming students, spent more class time on academic content, and more frequently used standardized tests (Bassok et al., 2016). Importantly, for many of these outcomes, the changes were more dramatic for teachers of low-income students than those of high-income students (Bassok et al., 2016). This leads to the expectation that between-group inequality in test scores may have narrowed more over K during the 2010–2011 school year versus the 1998–1999 school year.
Summary and Research Questions
Much of the early research on seasonal learning patterns suggested that test score inequalities between advantaged and disadvantaged students widened more over the summer than the school year. Recent studies produced mixed results, and researchers have called attention to the ways in which conclusions from these studies can be sensitive to methodological issues. Yet there are reasons to suspect that true seasonal patterns in between-group inequality dynamics may be changing over time, net of any cross-study confounds related to sample composition or methodology. The recent release of the ECLS-K:2011 data provides an opportunity to investigate this question by comparing the inequality trends across two similar nationally representative studies. Basic descriptive facts on whether and how seasonal patterns in between-group achievement inequality may be evolving will inform discussions on how to make schools more equitable.
In this study, we use data from the National Center for Education Statistics’ (NCES) nationally representative ECLS-K:1999 and ECLS-K:2011 studies to document how test score inequality trends by SES and race/ethnicity have changed over time. Following past researchers (Alexander et al., 2001; Quinn et al., 2016; von Hippel & Hamrock, 2016), we begin by documenting inequality at school entry and the net changes in inequality over the early years of schooling. We then examine how differences in school year and summer patterns may contribute to these net changes. Specifically, we ask the following research questions:
Research Question 1: To what extent have trends in math and reading inequality by race/ethnicity and SES changed in total over the first 2 years of schooling across ECLS cohorts?
Research Question 2: How do the changes in achievement inequality over the school year (K/first grade) and over the summer differ across ECLS cohorts?
Methods
Data
We use restricted-use data from the NCES’s ECLS-K:1999 and ECLS-K:2011. Each study used a three-stage sampling design in which primary sampling units (counties or contiguous counties) were first sampled, followed by schools within primary sampling units, followed by students within schools. Each study produced a nationally representative sample (when weighted) of students attending K over the 1998–1999 and 2010–2011 school years. In both studies, researchers scheduled achievement tests for the full sample in the fall and spring of K and the spring of first grade. Also in both studies, researchers scheduled assessments in the fall of first grade for a randomly selected subsample of students (approximately 30%). This allows for the estimation of learning over the post-K summer and first-grade school year. We are therefore able to compare inequality changes over K, post-K summer, and first grade across the two cohorts. The ECLS-K:2011 included additional test occasions that allow us to track learning over the summer after first grade and over second grade. For completeness, we also include these rounds in our analyses.
Samples
For all analyses, we include only students who attended schools with a traditional 9-month school calendar. We include observations from any student with at least one test score (for math or reading) in any analyzed wave who are not missing on any of the relevant variables (described later).
In both studies, researchers administered a language screener to students but followed different procedures (see Appendix A for detail). Consequently, some between-group differences are not comparable across surveys.
Outcomes
Our outcomes derive from the math and reading assessments. In each study, assessments were administered one-on-one by trained child assessors. Test dates varied by school, and testing windows in the fall and spring spanned several months.
The ECLS-K tests were based on the National Assessment of Educational Progress frameworks, projected to earlier grades via curriculum frameworks from national and state performance standards. Test content was similar across both studies, with reading assessments measuring print awareness, letter recognition, phonemic awareness, word recognition, vocabulary, and reading comprehension. Math assessments measured number sense, properties, and operations; measurement; geometry and spatial sense; data analysis; statistics and probability; and patterns, algebra, and functions. To avoid floor and ceiling effects, students first answered a set of routing items that determined the appropriate difficulty level for their test questions.
We use scales derived from the theta test metric. In both data sets, theta scores were estimated with a three-parameter item response theory model, which (in theory, if the model assumptions hold) generates a common scale across test waves within each study (Tourangeau et al., 2012).
At present, the NCES has not equated theta scores across the two data sets. Consequently, we cannot make absolute comparisons across cohorts on group means, mean differences, or standard deviations based on the original theta scales. However, we can make relative comparisons by transforming the test scales.
Following past researchers (Quinn et al., 2016), we conduct analyses using test scores transformed in two ways, each of which yields a different operationalization of inequality change. First, we operationalize inequality within each cohort as the between-group (i.e., race or class) difference in the average learning rate over a given period, expressed in fall K test score SD units for interpretability (Δ
In addition to estimating group differences in learning rates within each cohort, we operationalize inequality as the rate of change in relative status within each cohort (Δ
When test score variances change over time, Δ
Analytic Plan
Research Question 1: Total inequality change from K to first grade
For our first research question, we make cross-cohort comparisons in the total inequality changes over the first 2 years of schooling. To answer this question, we fit multilevel longitudinal models and conduct post hoc tests to examine inequality changes. For brevity, we present the Research Question 1 model in more detail in Appendix B.
Research Question 2: Seasonal trends for each ECLS cohort
To answer our second research question regarding changes in the seasonal dynamics of inequality across cohorts, we begin by fitting multilevel models (separately for each subject area and ECLS cohort) of the following form:

where i indexes student, t indexes time, α
i
represents a student-specific random intercept, SESi is an NCES-created continuous composite variable representing SES (see Appendix C for detail), and
When
To estimate seasonal inequality trends by race/ethnicity, we fit a separate model similar to Model 1 except that we replace SESi with a vector of mutually exclusive race/ethnicity dummy variables representing Hispanic, non-Hispanic Black, Asian, or “other race” with non-Hispanic Whites as the omitted group (following past researchers [e.g., Fryer & Levitt, 2004], we combine the American Indian/Alaska Native, Alaska Hawaiian/Pacific Islander, and multiracial categories into the single “other race” category due to their small cell sizes). Additionally, instead of the variables interacting SESi with the period variables, we include interactions between the period variables and each race/ethnicity dummy.
For SES and race/ethnicity models, we report learning rates over each period for the relevant reference group (i.e., students at the 90th percentile of SES or White students while assuming mean values for controls).
Testing for changes across cohorts
After obtaining the set of described estimates separately for each ECLS cohort, we test whether the differences in the estimates across cohorts are statistically significant. Because the observations in each data set are independent of the observations in the other, we can conduct simple t tests. Specifically, we compute the standard error of the cross-cohort difference in the rate of inequality change for a particular comparison over a particular period as follows:
Results
We present estimates for math and reading in our tables, but we describe only the math results for narrative simplicity. The reading results fit the same general pattern as seen for math, though the math trends are more pronounced.
Descriptive Statistics
In Tables 1 and 2, we present descriptive statistics for the ECLS-K:1999 and ECLS-K:2011, respectively. We show test score statistics by wave for the full analytic samples and by race/ethnicity (to keep the tables manageable, we exclude the period variables; for full descriptive tables see Appendix H).
Descriptive Statistics for the ECLS-K:1999 for the Full Analytic Sample and by Race
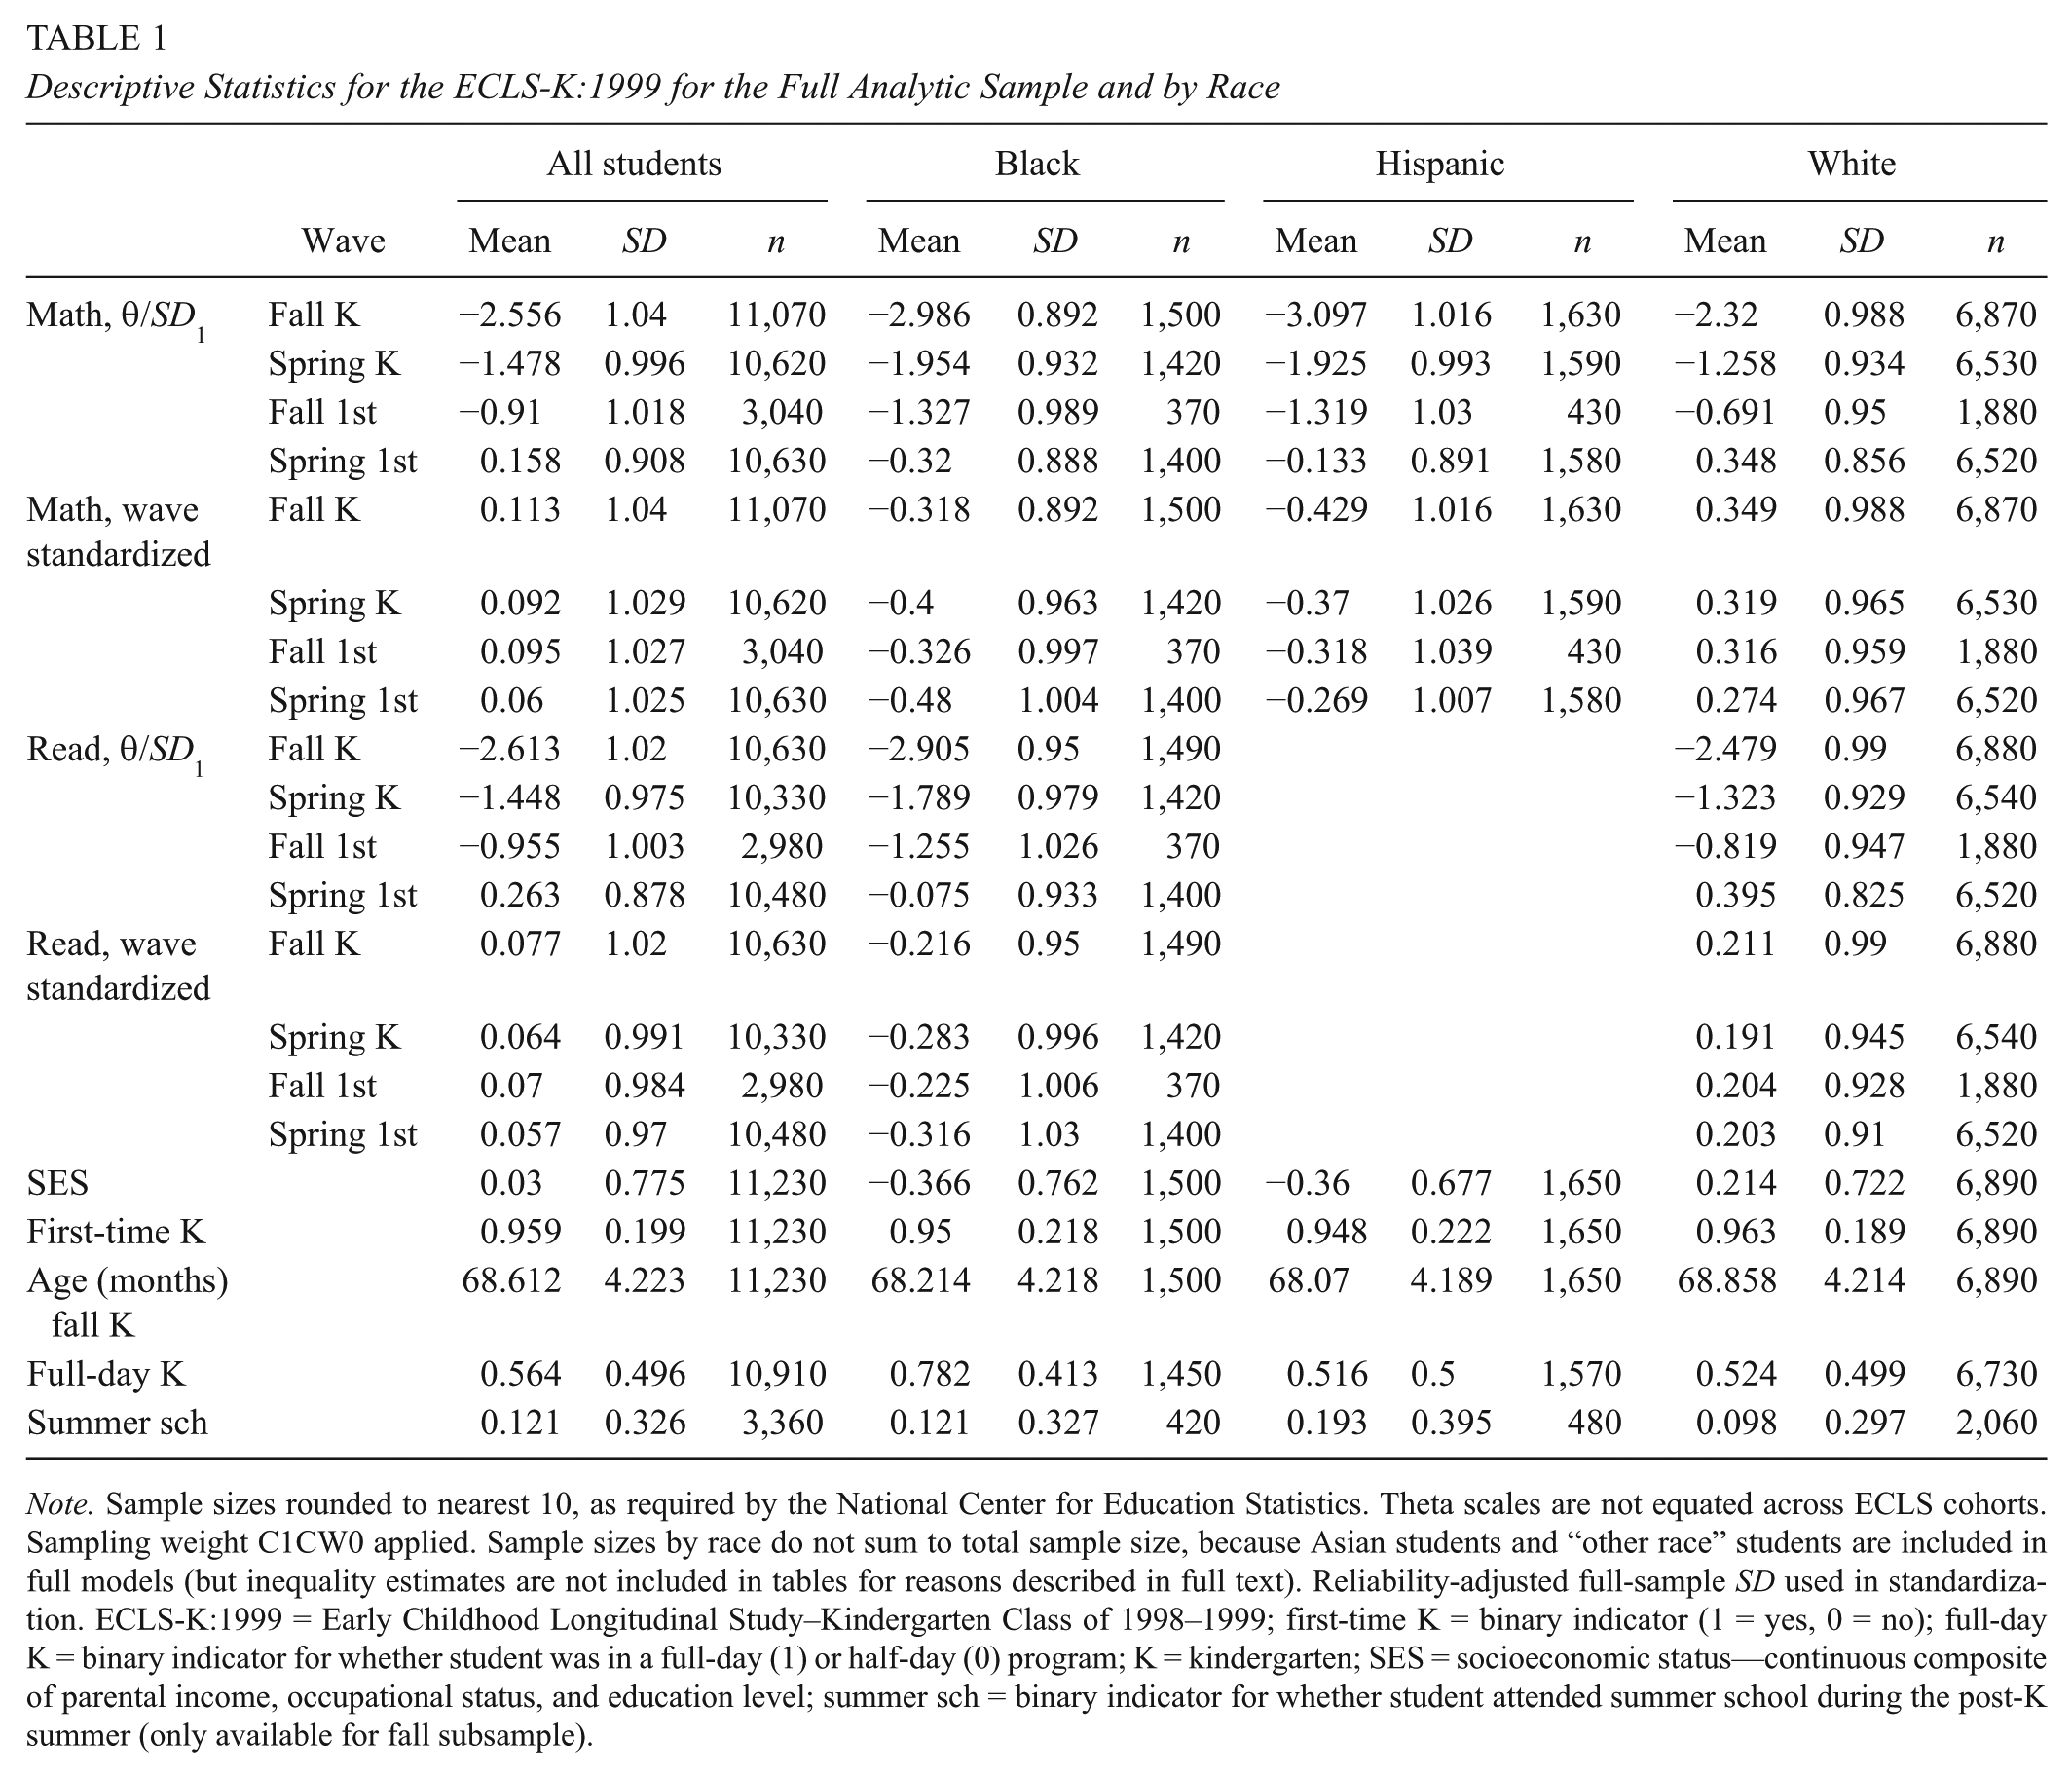
Note. Sample sizes rounded to nearest 10, as required by the National Center for Education Statistics. Theta scales are not equated across ECLS cohorts. Sampling weight C1CW0 applied. Sample sizes by race do not sum to total sample size, because Asian students and “other race” students are included in full models (but inequality estimates are not included in tables for reasons described in full text). Reliability-adjusted full-sample SD used in standardization. ECLS-K:1999 = Early Childhood Longitudinal Study–Kindergarten Class of 1998–1999; first-time K = binary indicator (1 = yes, 0 = no); full-day K = binary indicator for whether student was in a full-day (1) or half-day (0) program; K = kindergarten; SES = socioeconomic status—continuous composite of parental income, occupational status, and education level; summer sch = binary indicator for whether student attended summer school during the post-K summer (only available for fall subsample).
Descriptive Statistics for the ECLS-K:2011 for the Full Analytic Sample and by Race

Note. Sample sizes rounded to nearest 10, as required by the National Center for Education Statistics. Theta scales are not equated across ECLS cohorts. Sampling weight W1C0 applied. Sample sizes by race do not sum to total sample size, because Asian students and “other race” students are included in full models (but inequality estimates are not included in tables for reasons described in full text). Reliability-adjusted full-sample SD used in standardization. ECLS-K:2011 = Early Childhood Longitudinal Study–Kindergarten Class of 2010–2011; first-time K = binary indicator (1 = yes, 0 = no); full-day K = binary indicator for whether student was in a full-day (1) or half-day (0) program; K = kindergarten; SES = socioeconomic status—continuous composite of parental income, occupational status, and education level; summer sch = binary indicator for whether student attended summer school during the post-K summer (only available for fall subsample).
As seen across the tables, a higher percentage of kindergarteners were enrolled in full-day K in 2010 (83.3%) versus 1998 (56.4%). These changes differ by race/ethnicity. Supplementary analyses based only on students enrolled in full-day K show the same patterns as those reported in the main text (see Discussion section).
Within each survey, attrition across waves for cross-cohort analytic samples was, at its maximum, approximately 15% (from Wave 1 to Wave 4 in the ECLS-K:2011). See Appendix I for a comparison of the full versus analytic sample, Appendix J for analyses based on multiple imputation, and Appendix K for results based only on students with complete data each wave (all results show same patterns as the main tables).
By tracking the (reliability adjusted) theta SD across seasons in Tables 1 and 2, we get a sense of school effects on achievement inequality overall (without regard to race/ethnicity and SES). Although theta scales are not comparable across cohorts, we can compare percentage change in SD across seasons. Over K, overall variation in math and reading scores shrank more for the 2010–2011 cohort, decreasing by approximately 16% and 9% (math and reading, respectively) in 2010–2011 as opposed to 4% (both subjects) in 1998–1999. But this positive trend did not continue. Over summer, overall variation increased more in math for the recent cohort (7% vs. 2%) and increased similarly across cohorts for reading (1% in 2011 vs. 3% in 1999). During first grade in 1999–2000, overall math and reading variation shrank (by 11% and 12%, respectively), but overall math variation grew for the recent cohort (by approximately 3%) and decreased only slightly for reading (by 4%). These results suggest that overall, the recent cohort experienced more equalizing over K than the earlier cohort but more inequality widening—or less narrowing—during subsequent seasons.
Research Question 1: Overall Changes in Inequality From K to First Grade
We begin by examining changes across cohorts in the extent to which inequality changed in total from fall of K to spring of Grade 1. In Table 3, we present these results for math (top panel) and reading (bottom panel). Each row represents a different comparison by race/ethnicity or SES. The first three columns of results show the following for the ECLS-K:1999, respectively: estimates of the standardized mean differences in test scores at school entry (“Fall K” column), mean differences in learning from fall K to spring of first grade (expressed in Wave 1 SD units, or
Math and Reading Inequality and Inequality Changes (K–Grade 1) by Race/Ethnicity and SES: ECLS-K:1999 and ECLS-K:2011

Note. Fall kindergarten math and reading inequality by race/ethnicity and SES and inequality changes from fall kindergarten to spring of Grade 1 expressed in fall kindergarten SD units (Δ
p < .10. *p < .05. **p < .01. ***p < .001.
As seen in the final two columns of Table 3, we find cross-cohort differences in the extent to which inequality changed from K to first grade. Here, negatively signed cross-cohort differences represent more relative inequality widening, or less narrowing, from K to first grade for the more recent cohort.
In general for both cohorts, Black-White inequality widened as students aged. However, math inequality widened more from K to first grade among students in the recent cohort (by .126 fall K SD more, or .104 more by Δ
We now turn to our second research question to determine when academic outcomes became less equal for the recent cohort. That is, does the explanation for why things look worse overall from K to first grade in the recent cohort lie with what happened during the school year or during the summer?
Research Question 2: Changes in Seasonal Trends Across ECLS Studies
In Tables 4 and 5 (for math and reading, respectively), we present the relevant estimates derived from Model 1 answering our second research question. In the top panel for each table, we show monthly rates of learning in fall K SD units for reference group students (the “White students” row for the race/ethnicity models and the “90th percentile SES students” row for the SES models). Under the reference group estimates, we show group differences in monthly rates of learning (
Math Inequality Changes (Monthly Rates) by Race/Ethnicity and SES Over the School Year and Summer: ECLS-K:1999 and ECLS-K:2011

Note. Monthly math learning rates (White students, high SES students), differences in monthly math learning rates (
p < .10. *p < .05. **p < .01. ***p < .001.
Reading Inequality Changes (Monthly Rates) by Race/Ethnicity and SES Over the School Year and Summer: ECLS-K:1999 and ECLS-K:2011

Note. Monthly reading learning rates (White students, high SES students), differences in monthly reading learning rates (
p < .10. *p < .05. **p < .01. ***p < .001.
To facilitate interpretation, we present these results in Figures 1 to 3. Figure 1 shows, for Hispanic-White and SES math inequality, the differences in learning rates (ΔTSD1, left panel) and changes in relative status (Δ

Seasonal changes in Hispanic-White and SES math inequality across ECLS-K cohorts. Solid lines indicate that the rate of inequality change is significantly different from zero at α = .05 (long dash, p < .10; short dash, not significant). Asterisks indicate that rates of inequality change for a given between-group comparison and season are significantly different across ECLS-K cohorts: ~p < .10. *p < .05. **p < .01. ***p < .001. ECLS-K = Early Childhood Longitudinal Study–Kindergarten Class; SES = socioeconomic status.

Seasonal changes in Black-White math inequality across ECLS-K cohorts. Solid lines indicate that the rate of inequality change is significantly different from zero at α = .05 (long dash, p < .10; short dash, not significant). Asterisks indicate that rates of inequality change for a given season are significantly different across ECLS-K cohorts: ~p < .10. *p < .05. **p < .01. ***p < .001. ECLS-K = Early Childhood Longitudinal Study–Kindergarten Class.

Seasonal changes in Black-White and SES reading inequality across ECLS-K cohorts. Solid lines indicate that the rate of inequality change is significantly different from zero at α = .05 (long dash, p < .10; short dash, not significant). Asterisks indicate that rates of inequality change for a given between-group comparison and season are significantly different across ECLS-K cohorts: ~p < .10. *p < .05. **p < .01. ***p < .001. ECLS-K = Early Childhood Longitudinal Study–Kindergarten Class; SES = socioeconomic status.
Key Findings
Three patterns emerge from these cross-cohort seasonal comparisons. First, consistent with research showing narrowing SES gaps in academic rigor over K (Bassok et al., 2016), skill inequalities tend to narrow more over K in the ECLS-K:2011 versus the ECLS-K:1999. However, consistent with broader trends of increasing segregation and economic inequality, we find evidence that summer math learning was more unequal between groups in the recent cohort. Third, by first grade, the trend of increased school year equalizing in the ECLS-K:2011 has faded away, often reversing. That is, achievement becomes more unequal over first grade in the ECLS-K:2011 versus the ECLS-K:1999. This pattern is most striking for math inequality when measuring relative differences in learning rates (
More equalizing over K in recent years
Math inequality between students from the 90th and 10th percentiles of SES narrowed over K for both cohorts. This can be seen by the positive slopes over K in the left panel of Figure 1. However, this inequality narrowed more over 2010–2011 versus 1998–1999 (with narrowing of .051 vs. .02 SD per month; see Table 4).
In the recent cohort, we also see an increase in the rate of math inequality narrowing over K for Hispanic-White and Black-White relative learning rates (
When inequality is operationalized as changes in relative status (
This picture of more school year equalizing over K is followed by a less optimistic picture of summer dynamics.
More inequality widening over summer in recent years
In the left-hand panel of Figure 1, we see that over the summer of 1999, students from the 10th and 90th percentiles of SES learned math at statistically equivalent rates. In the summer of 2011, however, the steep negative slope indicates that low SES students learned less math than high SES students (.075 SD per month less). This led to a significant difference across cohorts of .06 SD more inequality widening per month in the recent cohort (second column from last, Table 4). Most of this cross-cohort difference seems to be due to low SES students gaining less over the summer (relative to the fall K SD) in 2011 versus 1999 (low SES students in 1999: .067 – .015= .052 SD per month; low SES students in 2011: .087 – .075 = .012 SD per month). When operationalized as change in relative status, math inequality by SES widened by a marginally significant .039 SD more per month in the recent cohort (second column from last,
Over the summer of 2011, Hispanic students learned significantly less math than White students (see the significant negative summer slope in the left-hand panel of Figure 1). This came after Hispanic and White students showed statistically equivalent math learning rates over the summer of 1999. However, the cross-cohort difference in summer inequality change did not reach statistical significance. Black-White math inequality did not change significantly over the summer in either cohort (see Figure 2).
More inequality over first grade in recent years
The positive trends that we saw over K reversed during first grade, when inequality in math learning (Δ
In the ECLS-K:2011, Black students learned .017 SD less per month over first grade as compared with White students (sixth column,
Summer 2 and Grade 2 (ECLS-K:2011)
In Tables 4 and 5, we also include the ECLS-K:2011 results for the post–Grade 1 summer and Grade 2 school year. Here, we see a slowing of between-group inequality changes. In most cases, inequalities are stagnant over the summer after Grade 1 (with the exception of significant Black-White math inequality widening by Δ
Discussion
Using data from the ECLS-K:1999 and ECLS-K:2011, we examined changes across cohorts in the seasonal dynamics of academic achievement inequality by SES and race/ethnicity. Schools seem to accomplish more equalizing over K today than in the past, but there is evidence of more inequality widening over the summer after K. This is followed by an even less optimistic picture over Grade 1, when between-group inequality became greater in the ECLS-K:2011 than the ECLS-K:1999. The net result was that in the recent cohort, inequality often widened more (Black-White) or narrowed less (Hispanic-White and SES) from the beginning of K to the end of first grade.
While the majority of inequality is already present at K entry in many cases (Reardon, 2011; von Hippel & Hamrock, 2016), the magnitudes of some of these cross-cohort differences are meaningful. Math inequality between students at the 10th and 90th SES percentiles narrowed by .031 fall K SD more per month over K in the recent cohort. This amounts to approximately .29 SD more narrowing total over that school year (assuming the average 9.5-month school year), which represents 25% of the standardized mean difference measured in the fall of K in 2010. Over first grade in the 1998–1999 cohort, Hispanic-White math inequality narrowed by .026 SD more per month (Δ
Interpreting Results
As noted earlier, test scales have not been equated across ECLS studies. This has implications when interpreting our results. For example, the decreased relative rate of math growth over K for high SES students in the ECLS-K:2011 versus the ECLS-K:1999 does not necessarily represent an absolute decrease in the amount that students learned each month. We cannot tell whether high SES kindergarteners in 2010–2011 learned less, more, or an equal amount over each month as compared with high SES kindergarteners over 1998–1999. Rather, what these results suggest is that, relative to the amount of skill variation at K entry, high SES kindergarteners developed math skills at a slower rate in the more recent cohort. A similar point applies to differences in inequality changes. For example, the larger K learning rate advantage for low versus high SES students in the ECLS-K:2011 represents a larger advantage relative to the fall K SD. If a common scale were available across studies, we might discover that the differences in learning rates over K by SES stayed the same or even got worse across cohorts in terms of absolute learning. Keeping in mind that our comparisons should not be interpreted in absolute terms, we proceed with a discussion of the results.
The finding that more equalizing generally occurs over K now as compared with the past coheres with earlier work showing that the increasing academic rigor of K has been more dramatic for low-income students than for high-income students (Bassok et al., 2016). This trend could be linked to the major curricular change that occurred over this period—namely, the widespread adoption of the Common Core Standards. Even if implementation of the new standards did not differ by social class—indeed, even if implementation was better for higher-income students—the increase in curricular rigor could nevertheless have been more dramatic for low-income students than for high-income students. This may help explain the increased between-group inequality narrowing over K.
Although comparisons across ECLS studies show narrowing Hispanic-White gaps in full-day K participation, differential enrollment across time does not explain any of the inequality changes shown here: Our main results replicate when restricting both ECLS samples to students enrolled in full-day K (see Appendix L).
Our finding that math inequality by SES grew more over the summer in 2011 versus 1999 is consistent with research showing the longer-term trend that high-income parents have been increasing spending on their children’s cognitive development more so than have low-income parents (Duncan & Murnane, 2011; Kornrich & Furstenberg, 2013). However, it is not clear why math inequality but not reading inequality widened by SES over the summer. One possibility is that lower-income students have increased their participation in summer reading programs but not math programs. Unfortunately, we are limited in the extent that we can examine this in the data: While the ECLS-K:2011 distinguishes between attending summer school for math versus reading, the ECLS-K:1999 does not.
The pattern of widening inequalities over Grade 1 in the recent cohort is broadly consistent with trends of increasing segregation by income and increasing educational spending gaps. Perhaps the disproportionate increase in academic rigor over K for low-income students did not continue into the first grade, or perhaps the skills typically taught in K (letter sounds, counting) are more responsive to increases in academic rigor than are the skills that students learn in first grade.
The changes across cohorts in inequality dynamics are more pronounced for math than reading. The school year changes are consistent with the notion that math is more sensitive to school effects than reading. According to this argument, a greater share of the skills relevant to reading achievement (e.g., vocabulary acquisition, language exposure, print exposure) are acquired outside of school, making school-based math instruction more impactful than reading instruction (e.g., Burkam et al., 2004; Cooper et al., 1996; Murnane, 1975). As such, we might expect the differential changes in schooling experiences by SES over this period (Bassok et al., 2016; Shores & Steinberg, 2017) to have had a greater impact on math inequality than reading. Yet we also find that math inequality by SES grew over the post-K summer in 2011. While this finding is consistent with previous analyses of the ECLS-K:2011 (Quinn et al., 2016; von Hippel et al., 2018), it differs from the ECLS-K:1999 and other early studies showing that reading inequality but not math inequality by SES widened over the summer (Cooper et al., 1996). Research is needed into the ways in which math-relevant summer learning experiences may have become more stratified by class in recent years.
An unexpected result over first grade was that—relative to the variation in fall K for their respective cohorts—students from all examined groups learned less in the ECLS-K:2011 than the ECLS-K:1999 (but the decrease was sharper for students from disadvantaged, rather than advantaged, backgrounds). As discussed earlier, one potential explanation might be that the ECLS-K:2011 data are picking up the effects of the Great Recession, which would have affected students’ school and nonschool environments. Research suggests that the recession significantly reduced math and reading achievement and that effects were concentrated among students in low-income districts and districts serving higher proportions of minoritized students (Shores & Steinberg, 2017). This is consistent with our observed overall decreases in relative learning rates and greater average decreases for students from minoritized and less economically advantaged backgrounds. Again, the greater between-group equalizing over K in the recent cohort may be a sign that the disproportionate increase in rigor over K for lower-income students (Bassok et al., 2016) counteracted recession effects that school year.
Limitations and Future Research
As discussed here, a strength of the ECLS data is that they cover the early childhood years when equalization efforts may have maximum payoff (Raudenbush & Eschmann, 2015). Nevertheless, a limitation to this study is that we cannot know the extent to which these patterns generalize to later grades. Although it appears that inequalities remain more constant each season as students get older, we are able to examine only a limited number of grades, and the trend may change in middle or high school. Additionally, while the similarity of the two ECLS studies makes them ideal for investigating trends over time with minimal cross-study confounds, we are limited in that we have only two cohorts and cannot know the extent to which the trends found here are representative of trends over a broader period.
The finding of more inequality narrowing over K in the ECLS-K:2011 than the ECLS-K:1999 is an encouraging result that should be better understood. Was the differential increase in academic rigor by SES (Bassok et al., 2016) driven by cultural changes or by the national move toward common standards? Are there lessons from the K period that might be applied in later grades? Regarding the summer period, do differential changes in time use by SES help explain why inequality widened more in math but not reading? Analyzing trends on the ECLS-K survey items that inquire about parents’ activities with their children might be a useful exercise for future research. Investigating these issues, while beyond the scope of the present article, could lead to improved policies and practices for ending inequality in educational outcomes.
Another area for future research is documenting the extent to which the seasonal dynamics of achievement inequality differ by geography and grade level. The ECLS-K studies are useful because they provide a summary of what is happening on average across the country, but there is likely variation across locales. For example, the seasonal patterns in NWEA data from a southeastern state (Atteberry & McEachin, 2016) differ from the national patterns found in the ECLS-K:2011. However, differences other than geography may explain these contrasting findings, including the grade levels of students in each sample. Additionally, given the heterogeneity that exists within the Hispanic population (and Asian population, for whom estimates are not shown here), it will be important to disaggregate trends for these groups to develop an understanding of the unique needs of the various ethnic groups that compose these broader groups (Teranishi, 2007).
Future research can investigate the opportunity gaps that lead to inequality in academic outcomes. Given that test score inequalities result from historical and systemic inequities (Milner, 2012), it is important to develop greater understanding about how differential access to resources has led to the current dynamics in which some achievement inequalities are widening faster during post-K summer and first grade as compared with the past. We reiterate Gutierrez’s (2008) call for more research on effective teaching and learning environments for minoritized populations, with richer descriptions of what these environments look like.
Conclusion
Researchers analyzing seasonal learning patterns in the ECLS-K:1999 concluded that schools serve as equalizers. However, the school and nonschool contexts in which students find themselves today differ from those experienced by students at the turn of the century. We find that, in general, more between-group equalizing occurred over K in 2010–2011 versus 1998–1999. This coheres with research showing that K has become more academically focused of late and that this change has been more pronounced in schools serving students from low-income backgrounds (Bassok et al., 2016). However, this positive trend did not continue past K. Over the post-K summer in 2011, inequalities were stagnant or widened more (vs. 1999), and the equalizing effect of schools did not continue into first grade in 2011–2012. Consequently, the net result over the first 2 years of schooling was that achievement inequalities by race/ethnicity and SES widened more or narrowed less in the recent cohort. This overall trend is what might have been anticipated based on increasing segregation and less equitable educational spending in school and nonschool environments (Evans et al., 2017; Kornrich & Furstenberg, 2013). While these patterns did not hold universally, the instances in which they did not hold were instances of no significant change in trends rather than examples of significant changes in the opposite direction. These findings raise the question of whether there are any lessons to be learned from the K period that could be applied to help reverse the trend of increased inequality widening over first grade.
Supplemental Material
DS_10.1177_2332858418819995 – Supplemental material for Are We Trending to More or Less Between-Group Achievement Inequality Over the School Year and Summer? Comparing Across ECLS-K Cohorts
Supplemental material, DS_10.1177_2332858418819995 for Are We Trending to More or Less Between-Group Achievement Inequality Over the School Year and Summer? Comparing Across ECLS-K Cohorts by David M. Quinn and Q. Tien Le in AERA Open
Footnotes
Acknowledgements
This research was supported by a grant from the American Educational Research Association, which receives funds for its AERA Grants Program from the National Science Foundation under Grant DRL-0941014. Opinions reflect those of the authors and do not necessarily reflect those of the granting agencies. This document has been approved for dissemination to nonlicensed personnel by the Institute of Education Sciences. We are grateful to North Cooc for providing feedback on this article.
Notes
Authors
DAVID M. QUINN is an assistant professor of education policy at the University of Southern California. He conducts research to inform policy and practice aiming to end educational inequity by race/ethnicity and socioeconomic status.
Q. TIEN LE is a senior policy and program analyst for the Los Angeles Unified School District.
References
Supplementary Material
Please find the following supplemental material available below.
For Open Access articles published under a Creative Commons License, all supplemental material carries the same license as the article it is associated with.
For non-Open Access articles published, all supplemental material carries a non-exclusive license, and permission requests for re-use of supplemental material or any part of supplemental material shall be sent directly to the copyright owner as specified in the copyright notice associated with the article.